Fig. 1
Transcriber’s Note:
The cover image was created by the transcriber and is placed in the public domain.
In the minds of most people a very silly notion prevails about the weather and the weather man. They have a general impression that the weather knows no laws—that it is lawless and reckless, fickle and changeable; that the weather man is a sort of conjurer, and by some mysterious gift he is able to prophesy things that most people know nothing about. Nothing could be further from the truth.
After you have carried out the simple experiments described, and have read this text, whether you have a scientific trend of mind or not, you will at least learn that the weather is a science, like electricity, chemistry, or medicine; that its laws are uniform, constant, and unchanging, and there is really nothing mysterious about it. The weather man is a scientist and by means of instruments, which indicate certain things, he comes to definite conclusions. He is not a prophet; he does not prophesy; he forecasts.
If you are interested in having a Weather Bureau station of your own, you will find it one of the most interesting things you ever acquired in your life. You will soon gain a knowledge of a subject that most people are quite ignorant of, and if you desire to stand for leadership among your boy friends, it may be achieved by knowing about those things that to most boys, and in fact to adults, assume a mysterious and magical aspect.
A Weather Bureau station at your home will give you a source of pleasure, fun, and insight into a science that is intensely interesting, easy to understand, fascinating and worth while knowing. The importance of the subject cannot be overestimated. It has an influence on the whole world; it affects our health; it affects our comfort; it means success or failure in farming; it has an immense influence upon transportation. When ready to move perishable goods, the transporter must have indications of what the weather is going to be.
The weather observer is the guardian angel of the ships at sea; some men have doubts as to whether medicine itself has saved more human lives than the study of the weather and the practice of weather observing. It is not unusual for those who live along 4the coast to see ships hovering into cover long before a storm approaches, for the wonderful weather bureau system operated by the United States Government gives warnings and danger signals all over the country. Statistics show that losses have been reduced seventy-five to eighty per cent through this system. The marine warnings are so perfect, so prompt, and so efficient that for a great many years no long or hard storms have ever reached any part of the United States without advance warnings and danger signals being shown beforehand.
When a storm is brewing, the Government’s wonderful Weather Bureau organization watches every atmospheric change with the greatest care and concern, and takes observations every few hours, and telegraphs the indications to all places where a warning should be given. Thereby perishable goods that need protection can be looked after. When extra hazardous storms and weather changes of a severe character are indicated, hundreds of thousands of telegrams are sent out in a comparatively short time, to all parts of the country, so that interested parties may prepare for such conditions. One can readily see the great service rendered and the satisfaction it must be to the shipper and the farmer to know that his property, which might be destroyed by a bad storm or low temperature, is being constantly and carefully guarded against danger. Not only storms and great cold waves have been forecasted, but floods have been anticipated and warnings given.
This brings us to a study of the subject “Weather,” and the best way to learn about the weather is to first learn about the air.
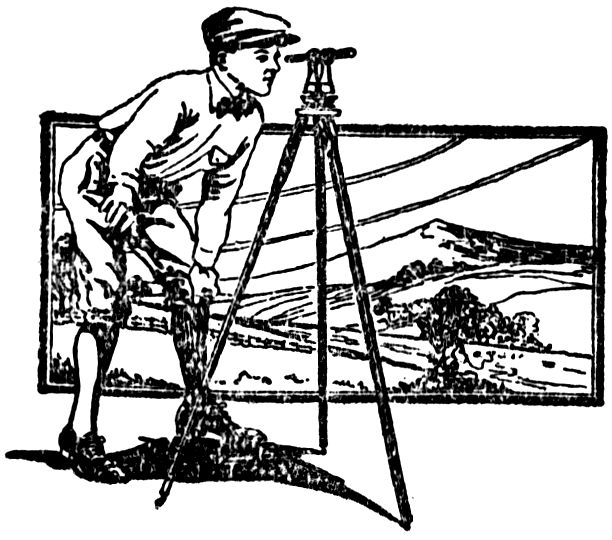
If you were to ask ninety-nine people out of a hundred to take the stopper out of a bottle, to look into it, and to smell its contents, and then ask them if, in their opinion, it contained anything, the invariable answer would be: “It contains nothing.”
Take the stopper out of a bottle and endeavor to pour water into it rapidly and see what happens. (See Fig. 1.) One of the laws in Physics is that no two bodies can occupy the same space at the same time. After doing this experiment, you will come to 5the conclusion that the bottle does contain something, and that “something” is matter, and that matter is air. There is in the bottle probably as important a thing as you could possibly conceive of, because even this earth without its ocean of air would be a world of desolation; for air sustains life itself, and when agitated, develops great strength. It may be whirled about into a hurricane blast and assume such violent proportions that villages will be swept away, and great waves of water will be raised, upon which ships can be tossed about like so much chaff. We all know that air can become so cold that great suffering will be caused, and so hot that it will make life almost unbearable. We really live in an ocean of air.
Fig. 1
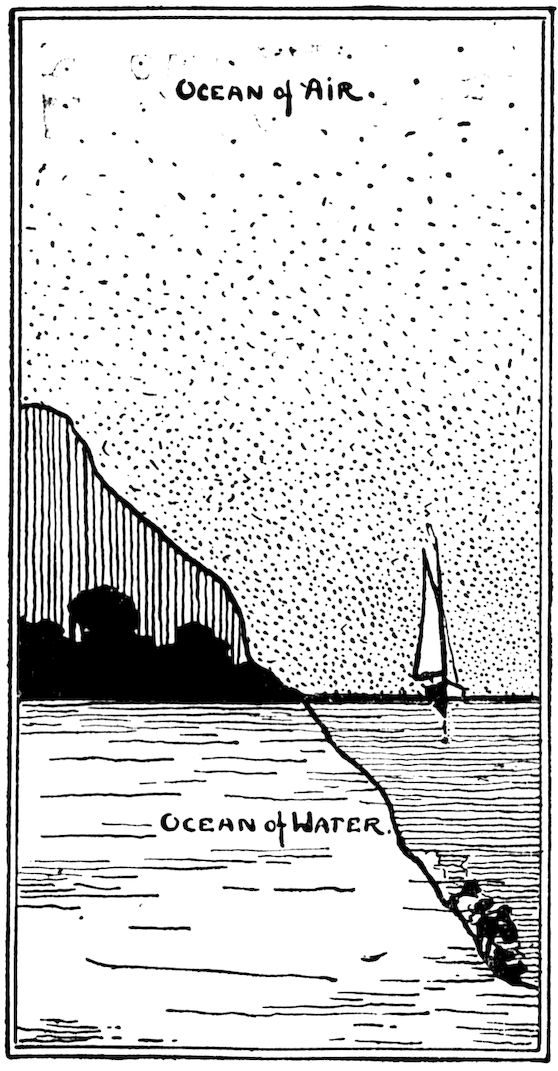
Fig. 2
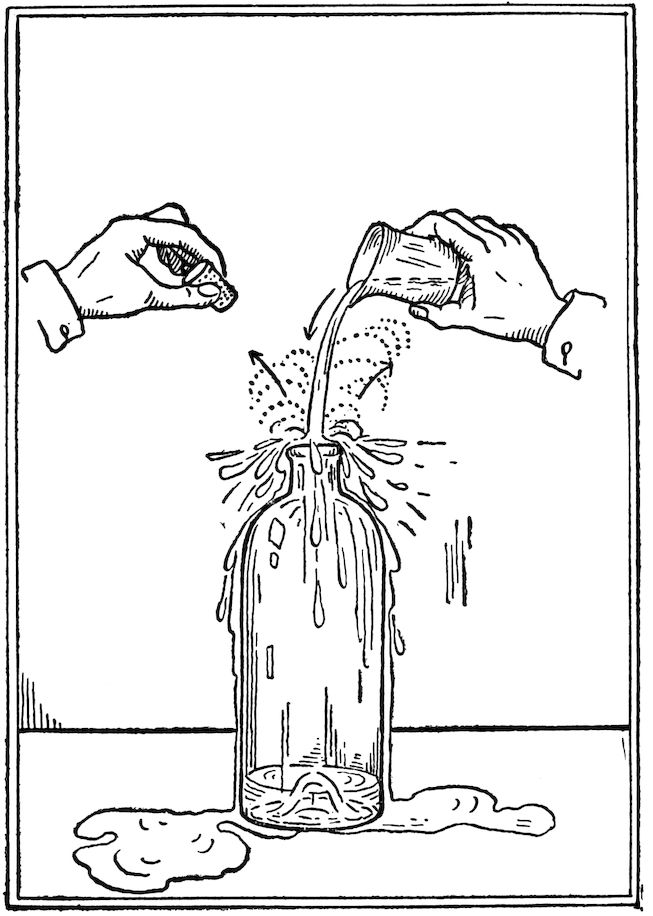
As the fishes live at the bottom of the ocean of water, mankind lives at the bottom of an “ocean of air.” (See Fig. 2.) No one is absolutely certain about the depth of this air, but it has been estimated as low as forty miles and as high as two hundred miles. Balloons have gone up to a height of nearly nineteen miles (100,320 feet). We do know that the higher we go, the thinner the air becomes. It is practically impossible for man to ascend into the air more than five or six miles, owing to the fact that the air above that height is so thin that there is not enough to breathe. Naturally, the air at the bottom is more compact because of the vast amount of air above. The air is a great weight lying upon us—14.7 pounds per square inch of surface.
The air-globe is a piece of apparatus for demonstrating that air has weight. (See Fig. 3.) First, the air-globe is weighed and then the air is pumped into it; its stop-cock is closed and the globe is reweighed. It will be found to have gained in weight. This is conclusive that air is matter and that it has weight.
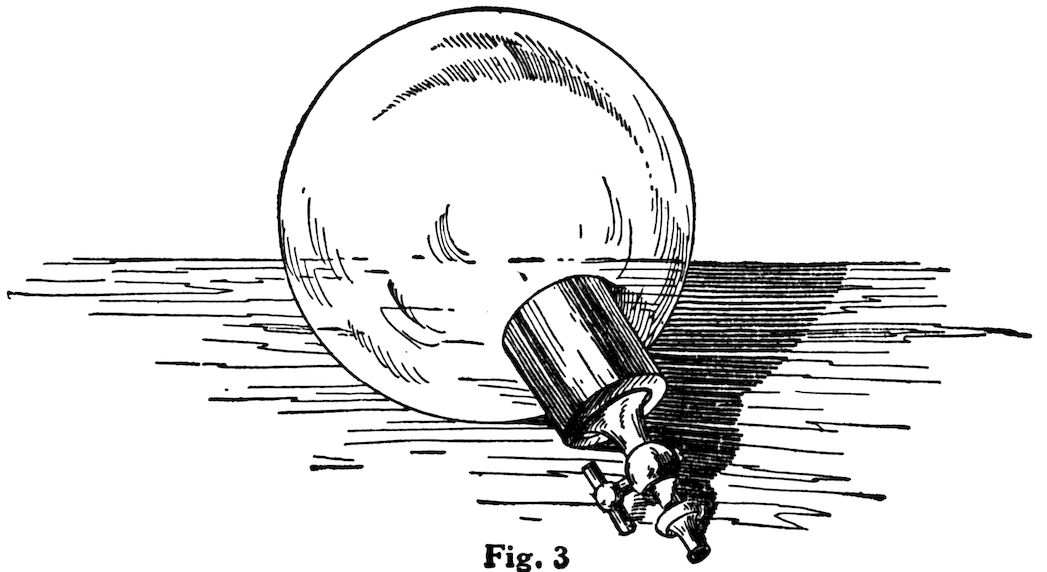
Fig. 3
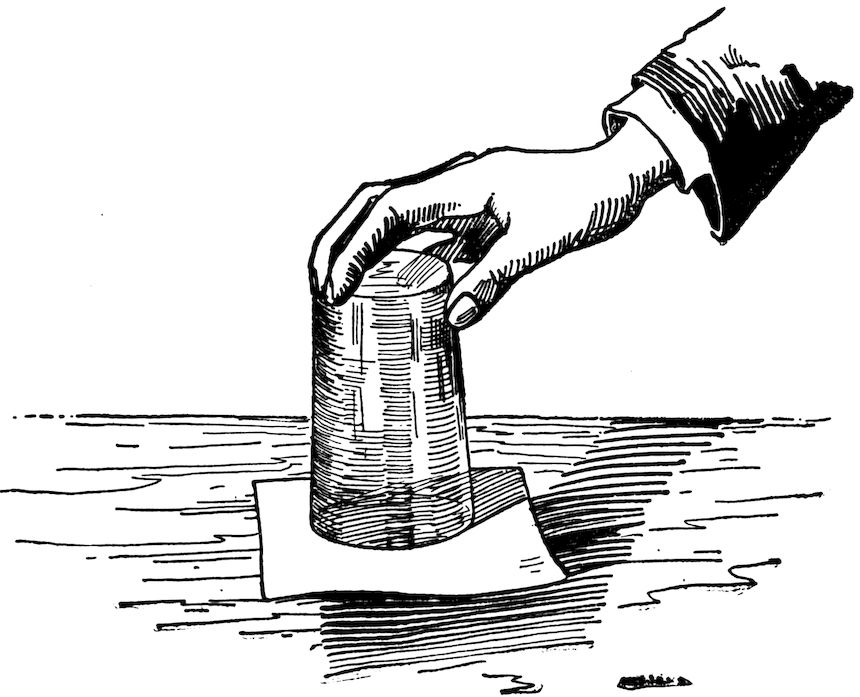
Fig. 4
8Of great importance to us in the study is the next fact, that air exerts pressure on everything about us and upon ourselves.
A tumbler is filled with water and a piece of paper placed over the top of it. The glass is then inverted, holding the hand over the paper so that none of the water will come out. On taking the hand away, although the glass of water is inverted, the contents do not leave the glass. (See Fig. 4.)
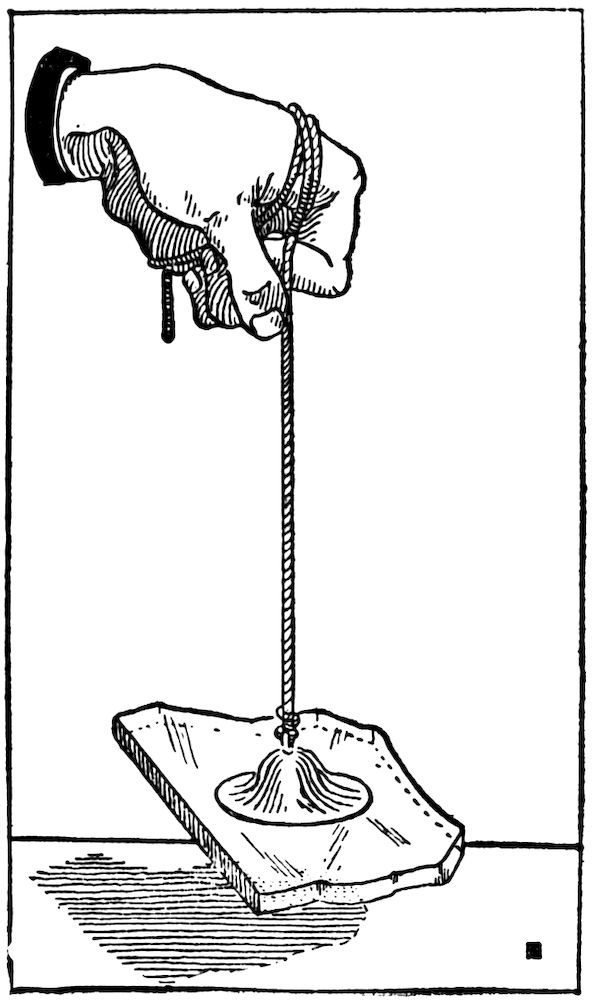
Fig. 5
It demonstrates that the air is exerting a pressure from below on the paper, which is more than enough to support the weight of the water. The tumbler may be placed in any position and yet the water will stay in. This air pressure is exerted alike from all directions, and this pressure, which is 14.7 pounds to the square inch, is weighed down by the air about it and may be likened very much to ordinary water in that it exerts pressure in all directions.
Take an ordinary rubber sucker, such as is used on the end of a dart, and attach it to a string. Force this down on a piece of glass. (See Fig. 5.) The glass can then by lifted by the pressure of the air that holds the rubber to it.
We are indebted to a German experimental philosopher named Otto Von Guericke for knowledge of atmospheric pressure. Guericke is distinguished by his original discoveries of the properties of the air. He was born at Magdeburg in Prussian Saxony, November 20, 1602. He became interested 9at an early age in the politics of his city, and in 1627 was elected alderman, and in 1646 Mayor of Magdeburg. While serving in the above capacities, he devoted his leisure to science, especially on the creation of a vacuum and the action of bodies in a vacuum. His first experiments were conducted with a pump on a barrel of water. After drawing off all the water, he still found that air permeated the wood of the barrel, so he substituted a globe of copper and pumped out air also. He thus became the inventor of the air pump and illustrated in a simple but effective way the force of atmospheric pressure.
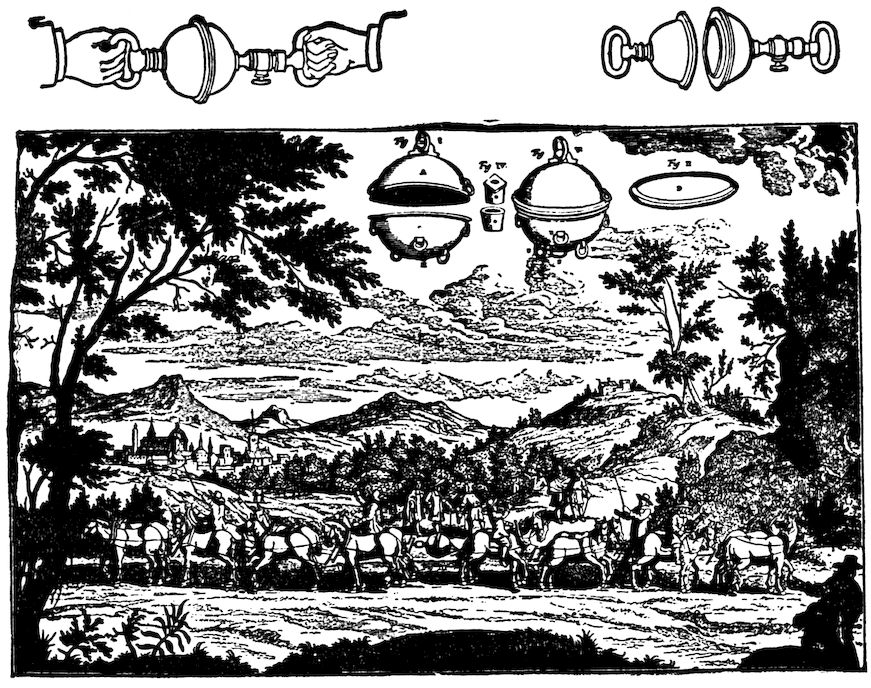
Fig. 6
By placing two hollow hemispheres of copper (see Fig. 6) together, and exhausting the air, he found that fifteen horses pulling one way and fifteen pulling the opposite were unable to pull the hemispheres apart.
10He further demonstrated that in a vacuum all bodies fall equally fast, that animals cannot exist therein, or, in fact, living matter. He is also credited with being the inventor of the air balance and a type of weather cock, called the anemoscope. He was interested also in astronomy.
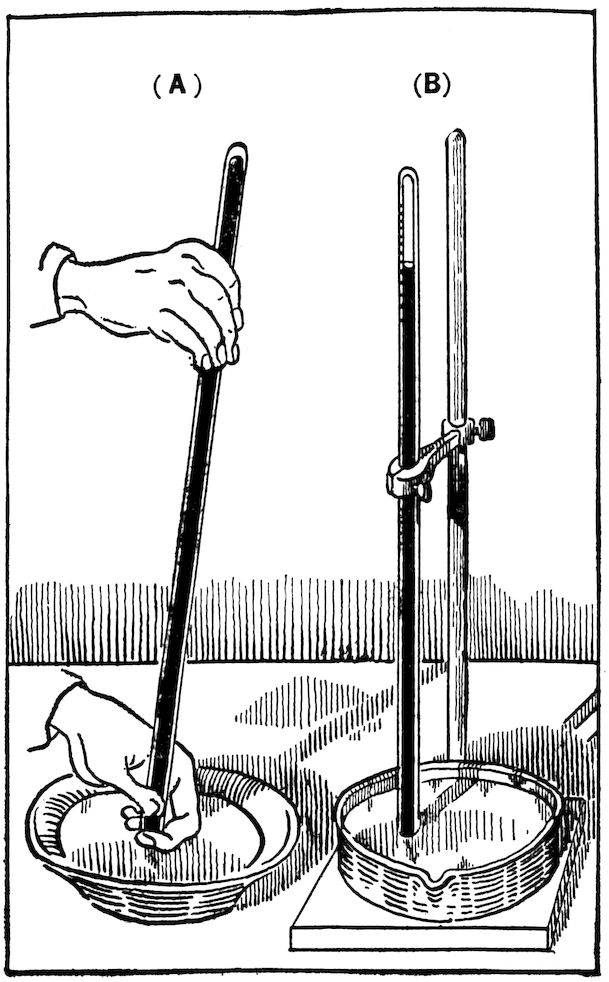
Fig. 7
This experiment should interest you very much, because it is going to lead up to the subject of weather instruments, and is absolutely essential that you understand the fundamental principles in order to intelligently interpret these instruments. This experiment will explain one of the principles of the barometer.
Take a glass tube thirty-two inches long and one-quarter or one-eighth inch in diameter, and fill it with mercury, care being used to get rid of all the air bubbles. The mercury should be poured in with an eye dropper, one end of the tube being sealed, until filled, and then the finger is placed over the open end. (See Fig. 7A). The tube is inverted and immersed in a reservoir of mercury and clamped to an upright stand. 11Immediately the mercury falls to about thirty inches. (See Fig. 7B). Ask yourself what held the mercury up in the tube. Again the answer is that the pressure of the air on the mercury in the reservoir causes it to rise and fall in the tube, as the pressure of the air changes. You will soon learn what causes these changes in the pressure of the air.
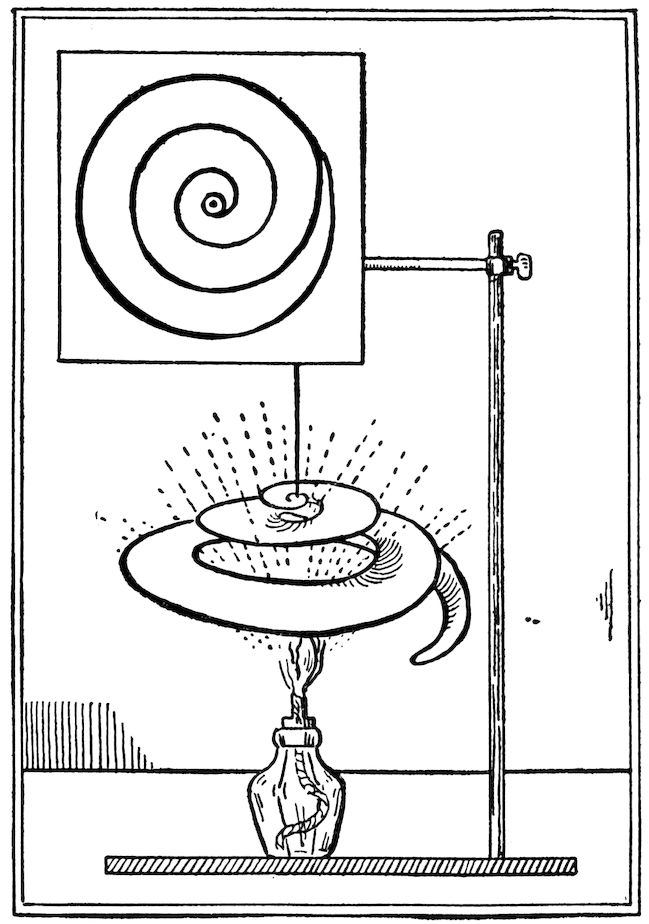
Fig. 8
Have you ever asked yourself why it is that the wind blows? Why doesn’t it stand still?
Put your hand over a lamp chimney under which the lamp is lighted. You will soon discover that the heat is rising. Four things in connection with this are of great importance:
Cut a piece of stiff cardboard in a spiral shape. Thread a piece of thread through a pinhole in the center point of the spiral and 12fasten this to a support so that it swings freely in the air. (See Fig. 8.) Under this put a little alcohol lamp, or put it over a gas jet or radiator.
The cardboard will spin around rapidly. Ask yourself what causes this. It is the force of the hot air rising which caused the spiral cardboard to turn in such an attractive manner.
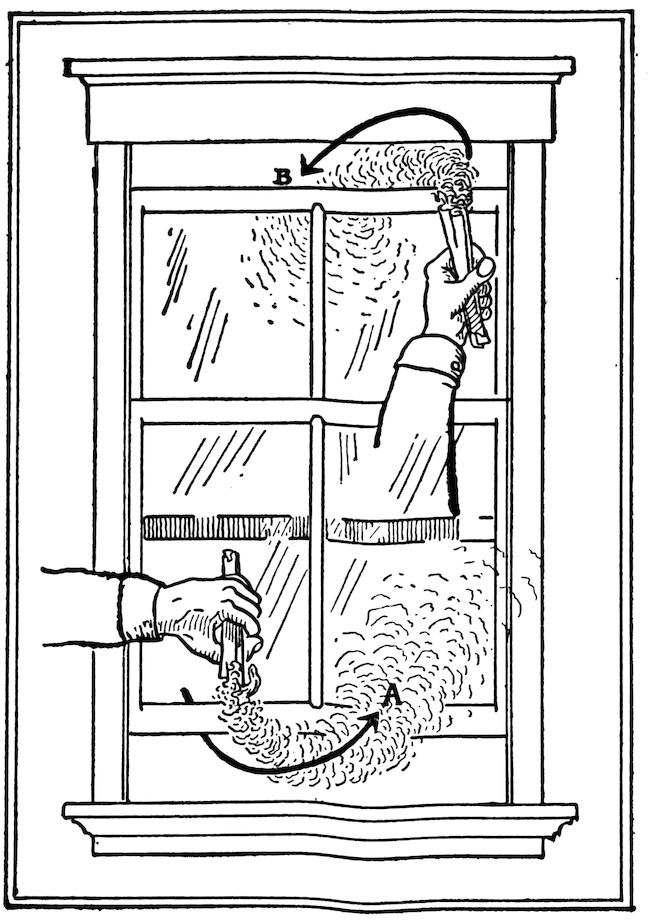
Fig. 9
When you are in a warm room, find out which air is the hottest, that in the upper or that in the lower part of the room. This answer you can get by placing the thermometer low down in the room and then putting it up near the ceiling. This is another conclusive proof that hot air rises.
Another experiment that is quite familiar to all of us is that of opening the windows of a heated room a few inches top and bottom, and holding a lighted match or smoke paper at the bottom, when you will find that it blows the flame or smoke inward. Then put it near the top of the window and it will be drawn out. The same answer is true; the cold air is rushing in 13from below to take the place of the hot air rising and going out at the top. (See Fig. 9.)
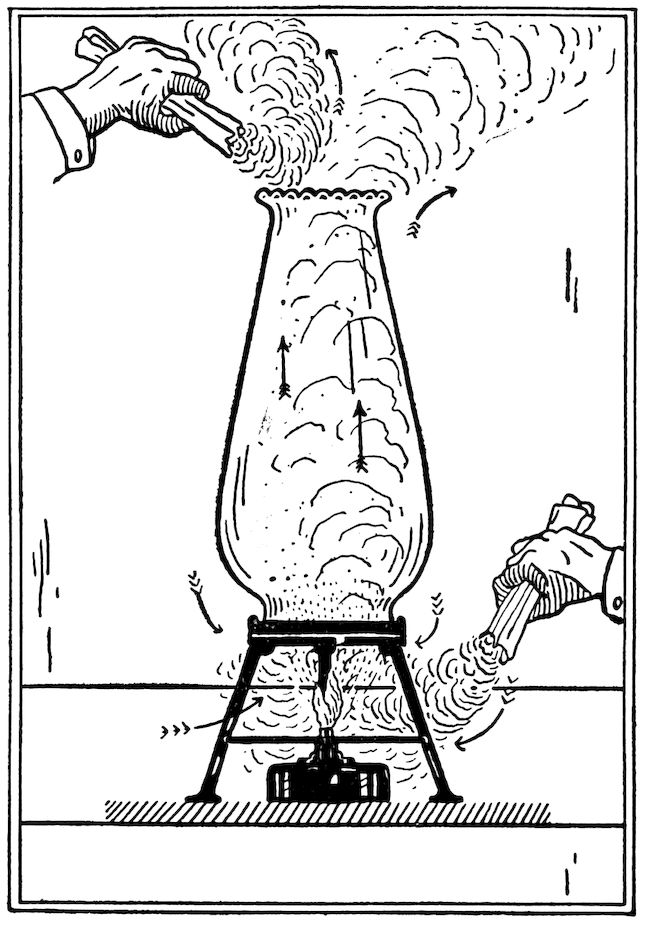
Fig. 10
This experiment is even more important than the preceding one, and you should by all means do it, for it is going to prove more conclusively than anything else what causes the wind, and in miniature it is a real storm.
Place a little alcohol lamp on the table, or a wax candle will do. Over this place an ordinary lamp chimney, lifting it a short distance off the table, and it can be held in position by any little object. (See Fig. 10.) Over the chimney hold some smoke paper. (Smoke paper is nothing more than filter paper, or brown wrapping paper of a soft texture.) From the experiments already visualized to you, you should know what to expect. You will again see that the heated air is rising; it has expanded and become light. Now what becomes of the air that is rising and where does it go? In doing this experiment be careful not to make any unnatural movements that will change the current of wind. Stand perfectly still so that the experiment will be perfect, because you are now producing in miniature a real storm, or demonstrating the cause of wind.
14The next observation—what happens at the bottom of the chimney? Here you will find the outside air is coming in, the same as it did in the window experiment. Particularly, notice however, that the smoke enters underneath the chimney from all directions, and the smoke paper should be moved away from the glass chimney to determine the distance at which the smoke flames will still be drawn into the chimney.
You now produced for yourself in miniature a storm and wind. The air that has been heated rises over a heated area, and cooler air from all directions around is passing into the space underneath the chimney and taking the place of the heated air that has gone up. This experiment illustrates what takes place, except on a smaller scale, out in the atmosphere when a portion of the earth becomes heated. If this is clear to you, it will help you to understand the main principles underlying storms and winds, which will be given later on.
Equally important is the last part of the experiment, which consists in lifting the lamp chimney off the table altogether and continuing with the smoke paper. Note results that you get now. The smoke will spread out over a large area.
By the weather we mean the temperature, the amount of moisture in the air, the pressure of the air, the movement of the air, and all the conditions that have to do with the atmosphere, such as heat, cold, rain, snow, sleet, fog, frost, dew, etc. It has to do with everything, from calmness and clearness to cloudiness and blizzards.
The sun has a great deal to do with the regulation of the weather. Its heat causes evaporation; it is the rays of the sun that raises the vapor from the water and brings it into the air; it is the cooling of this vapor that produces the rain, hail and sleet storms, and its brilliancy causes a difference in air pressure at times. It is this difference in air pressure that produces winds, as you will learn later.
The state of the air with respect to the vapor that it contains is called its humidity. The humidity is said to be high when the air is damp, and low when the air is dry. Humidity and moisture in the air are important factors about the weather. It is lack of humidity that has more to do with poor health, colds, and catarrh than anything else. The importance of proper humidity in houses and buildings cannot be emphasized too greatly. Proper humidity will save twelve and one-half per cent in the cost of heating. The great majority of people are under the impression that colds are caused by sudden change in temperature, but the most colds are actually caused by stuffy, hot rooms. The reason that some people complain that 70° is not hot enough is because the humidity is too low, but if the moisture is brought into the air at a proper degree, the humidity is maintained. You will find that 68° will be a proper temperature to maintain in a room. The reason for this is that the air in the room is dry and the heat actually goes through it. In other words, it does not warm it; moist air stops radiation. Consequently, the result is that it warms it. In other words, moisture is nothing more than clothing, and this accounts for the fact that in a hot room, where there is no moisture, we heat our rooms beyond the degree that is necessary in order to feel any reasonable amount of comfort. Dry air allows too much radiation from the body and too rapid evaporation, which makes us cold.
The following experiment illustrates the above statement. Place a few drops of water on a smooth surface, such as a table top or ordinary board, and over this a watch glass, containing a small quantity of ether. In order to hasten evaporation, blow a current of air across it, and it will be found that the glass will be frozen to the board. This is caused by the evaporation of the ether, which uses up heat.
You know a great many times when you go out into the wind how cold it feels, and yet if the wind would actually stop, you would think it warm. It is the wind that causes the rapid evaporation and makes the surface of the skin feel cold. As it is true that the moisture in the air acts as a blanket to us in our homes, it is likewise as true that the vapor in its natural form outside of the house acts as a blanket for the earth. Do you realize that 16without this blanket we would burn up in the summer and freeze to death in the winter?
Water vapor in the air is transparent, but when this water vapor becomes cooled, a portion of it becomes precipitated, which is no more or less than drops of water that are extremely small, but yet large enough to become transparent, and the atmosphere in this state is called fog. In reality, fogs are nothing more than clouds near the surface of the earth. When the ground is at a higher temperature than the air, it produces fogs. They are also produced when a current of moist air and a current of hot air pass over a body of water at a lower temperature. Consequently, you can easily see that fog will never form when it is dry.
After rain drops have been formed and they freeze in their passage through the air, they then become hailstones.
When condensation of vapor in the air takes place at a temperature below 32° F., a deposit is made in a solid condition, either in the form of snow or hail. Snow is made up of crystals, most of which have great beauty. Everyone should observe either by the naked eye or by a magnifying glass the little crystals caught before they are broken. When you see extremely large snowflakes in the sky, you can be sure the temperature is very near freezing, for at this point the flakes are more or less damp and the snow is heavy and wet. Now if there is a slight wind, the crystals become broken and separate flakes unite to form large masses of snow. Generally speaking, ten inches of snow makes one inch of rain.
If the temperature of the ground falls below the dew point of the air, the air deposits on the cooler surface moisture in the form of small drops of water, which we call dew drops. Where the temperature of the ground becomes cooler than the air above it, a rapid cooling by radiation on a clear night has taken place; and if the dew point or frost point has been reached by the ground, the air just above the point is several degrees warmer.
When the moisture in the air that is in contact with the earth is condensed above the freezing point, dew is formed. When below the freezing point, frost is formed or deposited on the earth. It is readily understood from this that the surface on which the frost is deposited is at a freezing temperature, while the air above it may not be freezing. Naturally, you can expect frost when the temperature falls to a point 8° or 10° above the freezing point. Clear, calm nights are favorable for frost, because the absence of clouds helps radiation, that is, it draws heat away from the earth. If there are clouds, it prevents this radiation.
Free electricity is always in the air. During clear weather it is generally positive; during cloudy weather it is negative. This electricity is carried in the air by the moisture. As dry air is a non-conductor of electricity, in fair weather the electrified particles of air are insulated and therefore acquire very little intensity. The clouds having been formed and being filled with moisture, form an excellent conductor of electricity, which acquires considerable intensity. It is a well-known physical law that two bodies having opposite electricities attract each other, and those having like charges repel each other. From this, two clouds having opposite charges rush together and produce the phenomena, called lightning, which is accompanied by an explosion called thunder. Often we see several flashes of lightning and then hear several thunder crashes, which is caused by only one section of a cloud discharging its electricity at a time.
As a cloud attracts the opposite charge of electricity from the surface of the earth beneath it by inductive influence, often we see a discharge of electricity from the cloud to the earth, the charge usually being received by such objects as hills, trees, church spires, high buildings, etc. Bodies containing large quantities of moisture are susceptible to strokes of lightning, as the moisture causes them to become good conductors of electricity. Also trees on the outer edge of a forest are more liable to be struck than those farther in.
There are several forms of lightning, such as zigzag, ball, sheet, and heat lightning.
18Zigzag lightning, as the name implies, follows an irregular course, producing a long zigzag line of light, sometimes ten miles in length, and is caused by the air producing a field of resistance to the path of electricity, causing it to seek a path of less resistance.
Ball lightning appears like a large ball of fire, usually accompanied by a terrific explosion. This is the result of the bodies being charged with electricity of great intensity, and travels in a straight path, as it has enough strength to oppose any resistance placed in its path.
Heat lightning is usually seen on warm evenings, especially during the summer, and very often unaccompanied by thunder, due to the great distance of the lightning clouds from where we are located, thus diminishing the intensity of the thunder. The electricity of the clouds escape in flashes so feeble as to produce no audible sound.
Sheet lightning is a diffused glare of light sometimes illuminating only the edges of a cloud, and again spreading over its entire surface.
Ordinary flashes of lightning last but the minutest part of a second.
Thunder is the re-entrance of air into an empty space. The vacuum is created by the lightning in its passage through the air. The violence of thunder varies according to the intensity of the electrical flashes.
Because of the fact that light is transmitted almost instantaneously, while sound travels at a speed of eleven hundred feet per second, the sound will not reach the ear for some few seconds after the flash of lightning. Average space of time between a flash and a report is about twelve seconds. The longest interval is seventy-two seconds and the shortest one second. Prolonged peals of thunder are, in some cases, due to the effect of echoes. These peals are especially noticeable in mountainous countries. The echoes are also produced by the reflection of sound from the clouds.
Thunder storms are distributed over certain sections of the globe, occurring most frequently in the equatorial regions and diminishing as we approach the polar regions. Within the tropics, where there are trade winds, thunder storms are rare. Thunder storms are common in warm climates because evaporation supplies electricity in great abundance, and thus precipitation of the air is brought about.
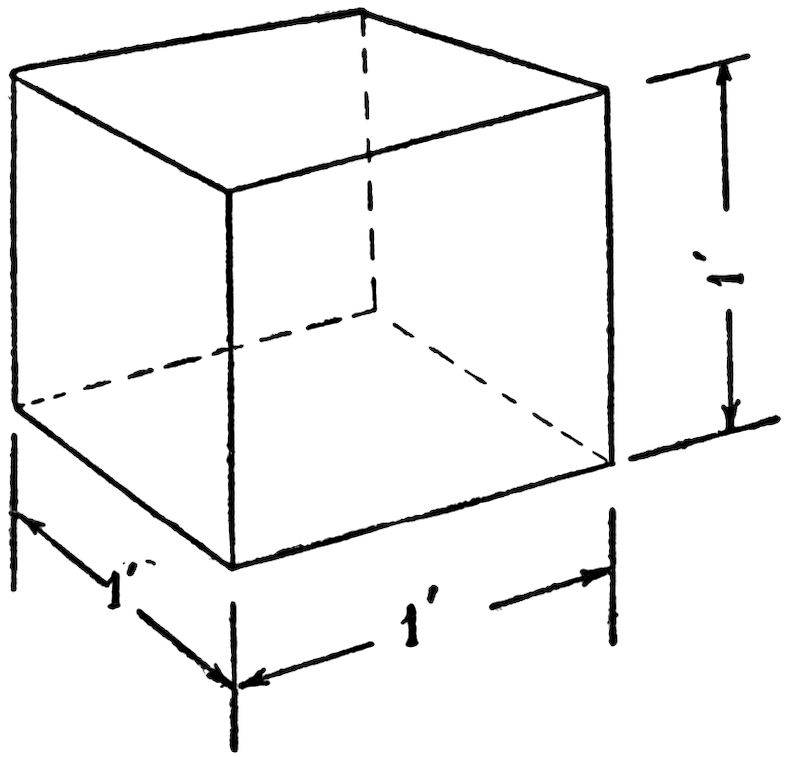
Fig. 11
Tornadoes are caused by the air becoming abnormally heated over certain areas. Likewise, caused by a difference in pressure. Tornadoes are local whirlwinds of great energy, generally formed within thunder storms. They are most easily distinguished by a funnel-shaped cloud that hangs from the bottom of the larger thunder cloud mass above it. The funnel is formed around a violent ascending mass of whirling winds; its diameter sometimes reaching several hundred feet, being larger above than below, the winds themselves covering a greater space.
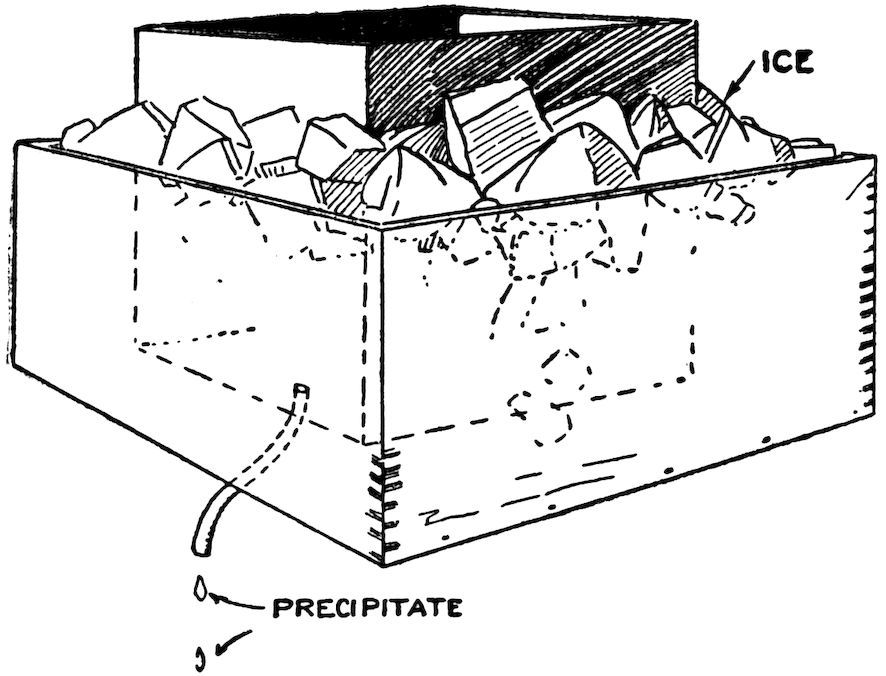
Fig. 12
The whirling funnel advances generally to the east or northeast at a rate of twenty to forty miles an hour, accompanied by a 20deafening noise, destroying everything in its path. The path is usually less than a quarter of a mile in width.
The winds in the vortex (the apparent cavity or vacuum formed in the center of the whirling winds) of the tornado attain an incredible violence, and due to this fact houses are shattered, trees uprooted, and human lives lost, besides other devastation of property and animal life. It is, therefore, the vorticular whirl that causes the destruction produced by tornadoes.
Tornadoes are more frequent in the southern states than anywhere else in the country, and occur in the warmer months.
The velocity of the whirling winds in a tornado increase towards the center, and it is because of this that the point of danger is only a small distance from the funnel cloud. The direction of the whirling motion is from right to left. From the appearance of the funnel formed in a tornado, it looks as though the currents were descending from the cloud to the earth, when in reality the currents are ascending. The ascending current draws on the warm and moist air near the surface of the earth for its supply, and this inrush of air in a spiral form into the low pressure core made by the higher whirl constitutes the destructive blast of the tornado.
Tornadoes approach rapidly, and it is therefore almost impossible for those who happen to be in their path to escape their violence.
A tornado at sea is termed a water spout.
You will recall a preceding statement that evaporated humidity turns into water when it becomes cool below a certain point. (See page 14, Effect of the Sun.) A given amount of air will hold a certain amount of moisture. For example, let us assume that a cubic foot of air (see Fig. 11) is saturated, that is, it is holding all the water it will retain. Now if this cubic foot of air is cooled, it will contract, and as a result there will not be enough room to hold both the air and moisture, so the excess moisture will leak out. (See Fig. 12.) The result of this reduction in temperature causes precipitation, simply because the air cannot sustain the water that is in it. Therefor, at any time when moisture in the air has reached the point of saturation and a chilling takes place, due to the air becoming cold, rain follows. This may happen as a result 21of air rising into higher places or cooler levels, or through its contact with cooler surfaces.
The air becomes thoroughly saturated. When air is comparatively warm, it will expand, and this air, which is heavily saturated is brought up by breezes onto the mountain range, which is cold, causing the air to lose its heat and contract and really force the water out of the air. The same principle applies to sea breezes bringing rain.
Winds are caused as a result of differences in temperature between the various layers of the atmosphere. A certain amount of air becomes heated and rises, and as explained before, expands. As the air expands, it becomes lighter, and because it is light it goes upward toward higher regions. It also flows from hot to cold countries. A good illustration of this is the sea breezes. If you have lived around the seashore in the summer time, you will have observed that during the hot part of the day the winds generally blow from the sea toward the land. At night the direction of the wind is reversed, that is, it blows from the land to the sea. Why? Because the land during the day retains its heat, while the water diffuses it. What is the result? The air on the land expands, becomes light. The air over the water being cool, it does not expand, and the result is that it presses toward the land. At night the land loses its heat more rapidly than the water, so that it is not long before the land is cooler than the water, and when this happens, the air over the land, which has become cooler, presses seaward.
Mountain Breezes: Caused by the heating and cooling of the hills and valleys.
Avalanche Winds: Winds that are in front of a landslide, caused by the movement of the snow forcing the air in front of it.
Fig. 13
Fig. 14
Fig. 15
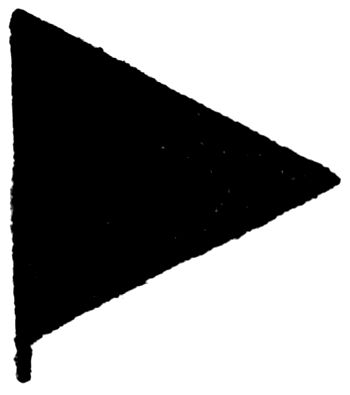
Fig. 16
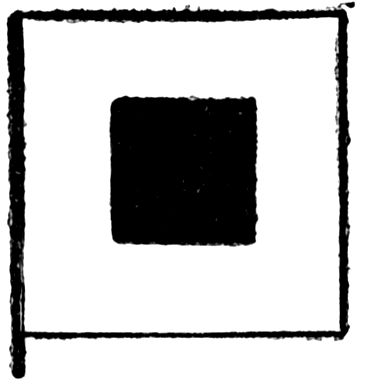
Fig. 17
Volcanic Winds: Due to volcanic eruption, which produces an outrush of air.
A Squall: Due to the sudden disturbance in temperature.
A Simoon: A desert wind.
The wind blows a great deal harder on water than on land, because on land it meets with various obstacles, whereas it has very little friction on the water.
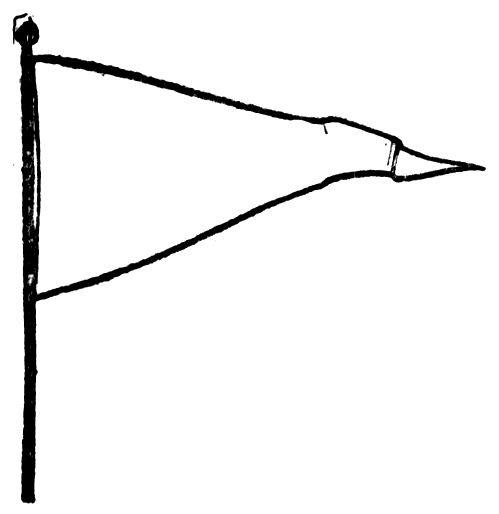
Fig. 18
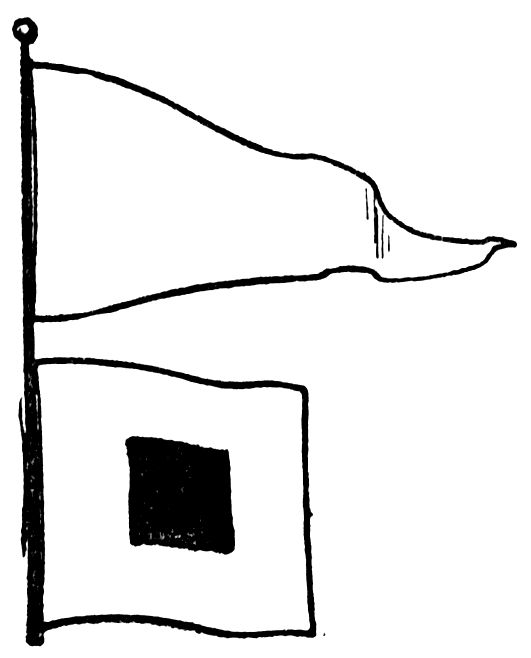
Fig. 19
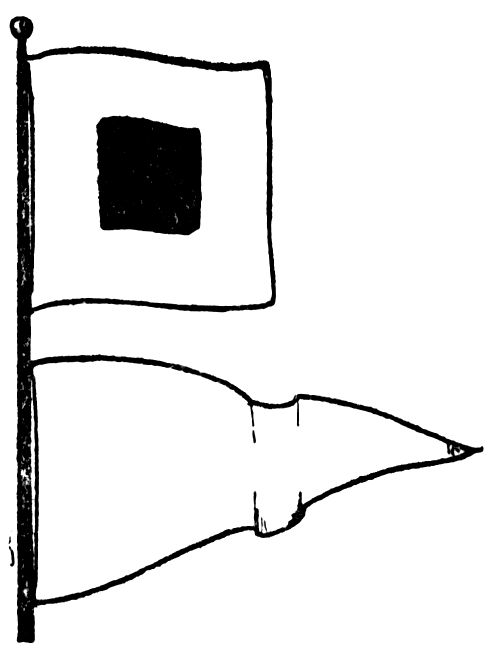
Fig. 20
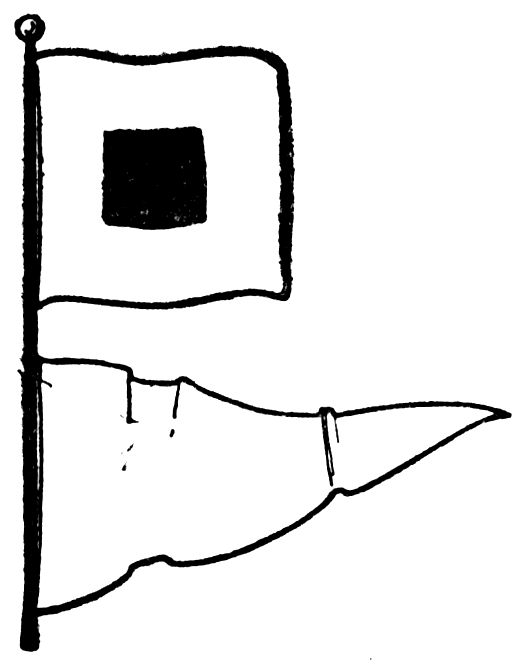
Fig. 21
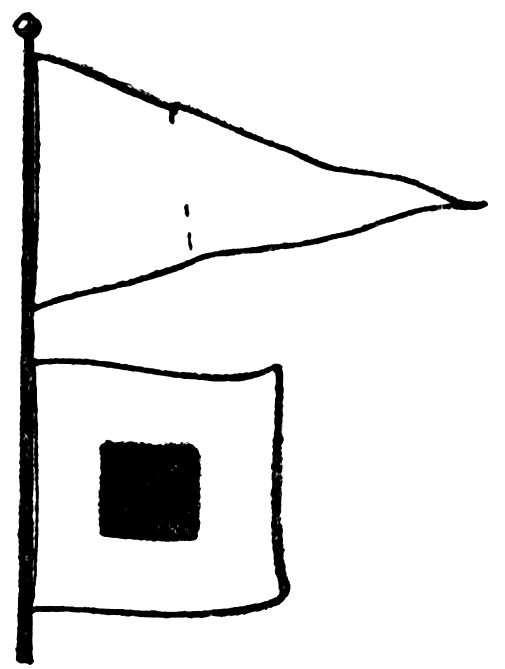
Fig. 22
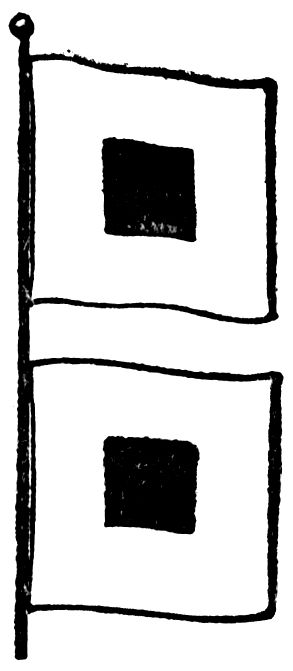
Fig. 23
Fig. 19A
Fig. 20A
Fig. 21A

Fig. 22A
Fig. 23A
Beaufort’s scale, used in preparation of all Weather Bureau wind forecasts and storm warnings.
| FORCE | DESIGNATION | MILES PER HOUR | |||
|---|---|---|---|---|---|
| 0 | Calm | From | 0 | to | 3 |
| 1 | Light Air | Over | 3 | to | 8 |
| 2 | Light breeze (or wind) | „ | 8 | „ | 13 |
| 3 | Gentle breeze (or wind) | „ | 13 | „ | 18 |
| 4 | Moderate breeze (or wind) | „ | 18 | „ | 23 |
| 5 | Fresh breeze (or wind) | „ | 23 | „ | 28 |
| 6 | Strong breeze (or wind) | „ | 28 | „ | 34 |
| 7 | Moderate gale | „ | 34 | „ | 40 |
| 8 | Fresh gale | „ | 40 | „ | 48 |
| 9 | Strong gale | „ | 48 | „ | 56 |
| 10 | Whole gale | „ | 56 | „ | 65 |
| 11 | Storm | „ | 65 | „ | 75 |
| 12 | Hurricane | „ | 75 | ||
The following method of transmitting weather signals by means of flags was used for a number of years, but the newspapers now convey the same news to the interested public:
1. A square white flag indicates fair weather. (See Fig. 13.)
2. A square blue flag indicates rain or snow. (See Fig. 14.)
3. A white and blue flag, half white and half blue, indicates local rain or snow. (See Fig. 15.)
4. Black triangular flag indicates a change in temperature. (See Fig. 16.)
5. White flag with a square black center indicates cold wave. (See Fig. 17.)
When No. 4 is placed above No. 1, 2, or 3, it indicates warmer weather; when below, colder; when not displayed the temperature is expected to remain stationary.
The following flag warnings are used along the Atlantic and Gulf coasts to notify inhabitants of this section of the country of impending danger.
Fig. 18. The Small Craft Warning. A red pennant indicates that moderately strong winds that will interfere with the safe operation of small craft are expected. No night display of small craft warnings is made.
Fig. 19. The Northeast Storm Warning. A red pennant above 26a square red flag with black center displayed by day, or two red lanterns, one above the other, displayed by night (Fig. 19A), indicates the approach of a storm of marked violence, with winds beginning from the northeast.
Fig. 20. The Southeast Storm Warning. A red pennant below a square red flag with black center displayed by day, or one red lantern displayed by night (Fig. 20A), indicates the approach of a storm of marked violence with winds beginning from the southeast.
Fig. 21. The Southwest Storm Warning. A white pennant below a square red flag with black center displayed by day, or a white lantern below a red lantern displayed by night (Fig. 21A), indicates the approach of a storm of marked violence, with winds beginning from the southwest.
Fig. 24
Fig. 22. The Northwest Storm Warning. A white pennant 27above a square red flag with black center displayed by day, or a white lantern above a red lantern displayed by night (Fig. 22A), indicates the approach of a storm of marked violence, with winds beginning from the northwest.
Fig. 23. Hurricane, or Whole Gale Warning. Two square flags, red with black centers, one above the other, displayed by day, or two red lanterns, with a white lantern between, displayed by night (Fig. 23), indicate the approach of a tropical hurricane, or of one of the extremely severe and dangerous storms which occasionally move across the Great Lakes and Atlantic Coast.
Fig. 25
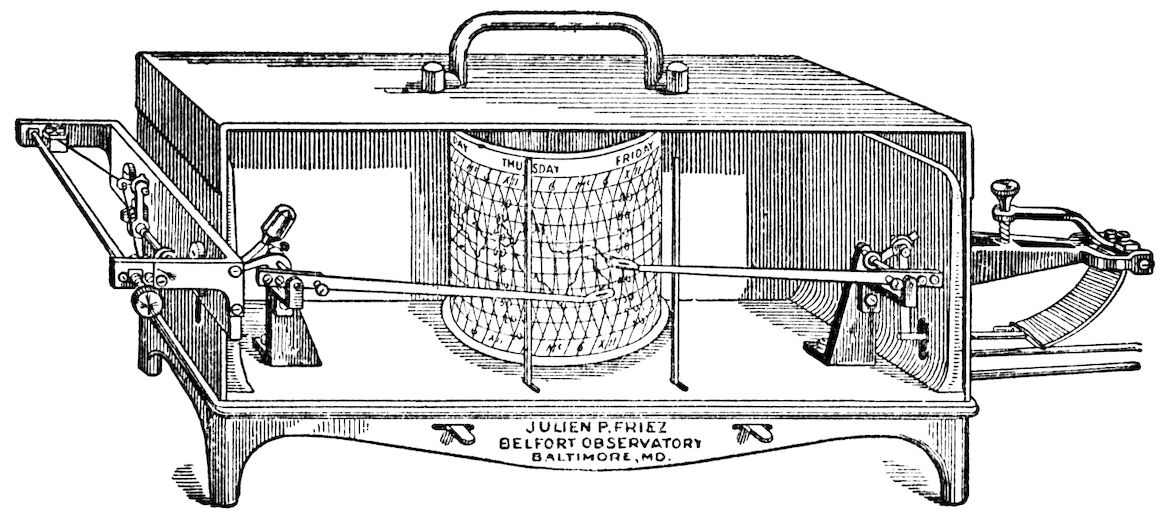
We have installed at our manufacturing plant a high-class weather station, with equipment of the latest United States Weather Bureau standard pattern, and are able to send out weather signals by wireless from our own wireless station twice daily, at 4 P. M. and 7 P. M., to all boys owning a wireless outfit. The indications are taken from our own instruments. A description of these instruments 28and the method of recording the indications will give you an insight into how the various government weather stations arrive at their forecasts.
Fig. 26
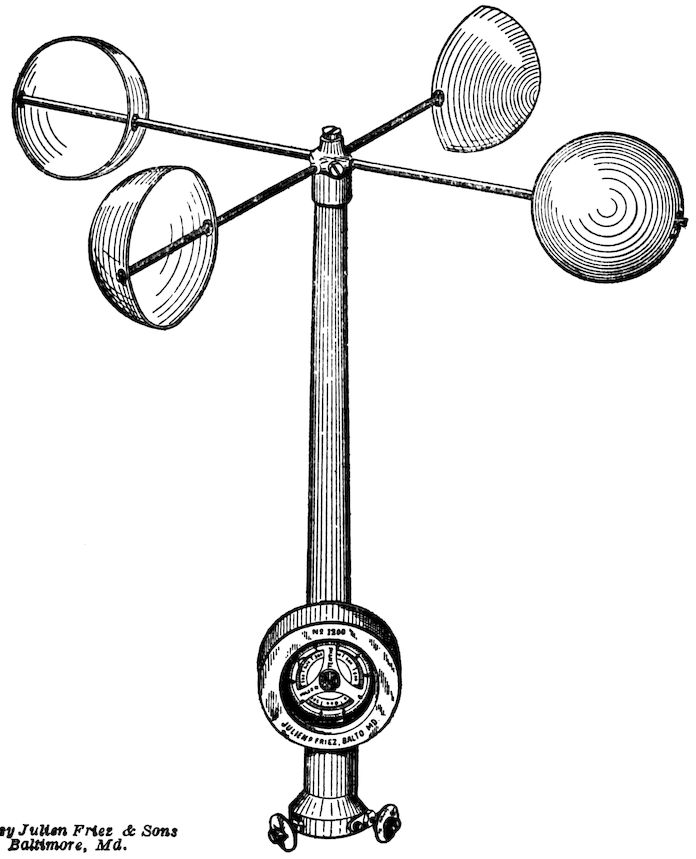
On the roof of the factory is a weather vane (Fig. 34) twenty feet high, which is connected electrically with a register in our weather office. The register is of the quadruple type (Fig. 45), and is capable of recording wind direction, wind velocity, rainfall, and sunshine on the same form or sheet. Thus, we know the wind direction and can deduce certain things relating to the weather. Mounted on the wind vane support is an anemometer (Fig. 36), an instrument for measuring the velocity of the wind. A rain gauge (Fig. 49) on the roof catches the precipitation, and for every one hundredth of an inch of rainfall, a small tipping bucket empties its contents into a receiver and a record is made on the form in the quadruple register.
The same pen that records the rainfall also records the number 29of hours of sunshine during a day, for it is not a common thing to have rain and sunshine at the same time.
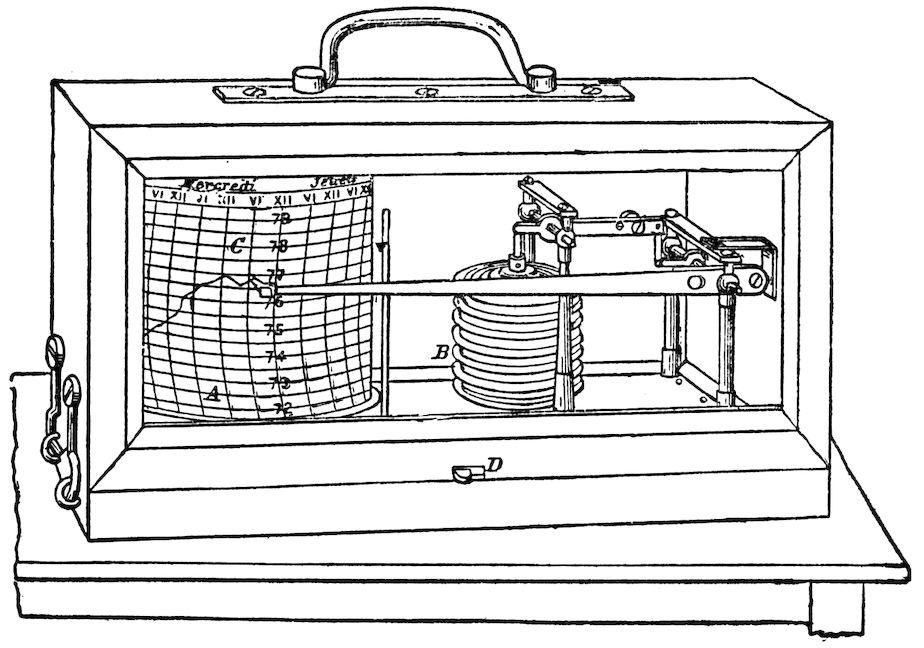
A hygrothermograph (Fig. 43) records on a form the temperature and amount of humidity in the atmosphere.
A barograph (Fig. 44) records the pressure of the atmosphere. For determining the pressure, we also have a mercurial and aneroid barometer, which will be described later on.
You can readily see that it is a simple matter to obtain the weather indications.
Fig. 27
The numberless kinds of clouds makes it quite difficult to describe and arrange them or illustrate them in any manner that makes it easy to recognize them. Although some may be recognized from description and with a fair amount of observation, you will be able to classify them in their proper place. For instance, 30the thunder clouds most anyone recognizes without any experience whatever.
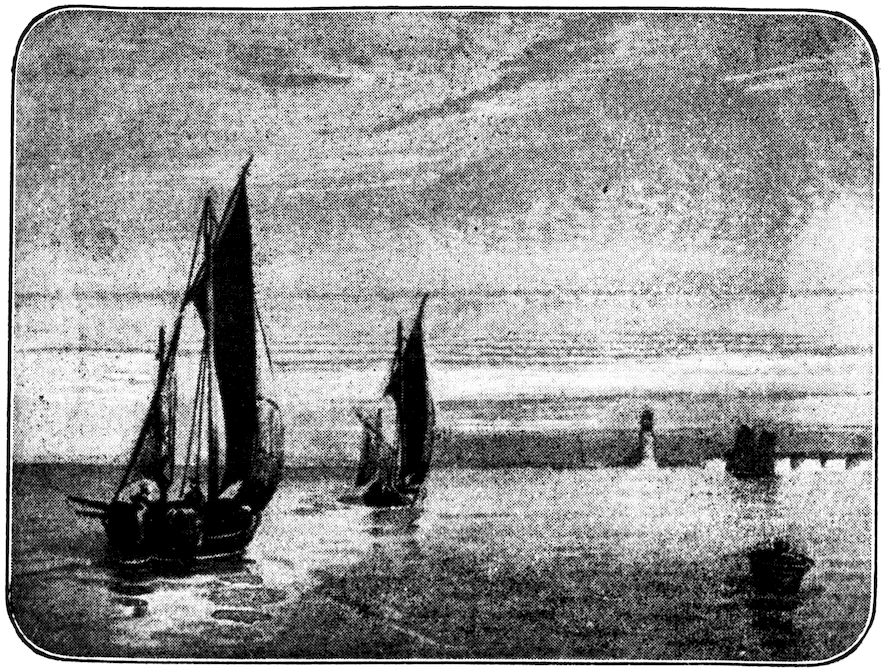
Fig. 28
There are really four simple cloud formations and three compound formations:
1. The Cirrus Cloud. (Fig. 24.)
The Cirrus cloud is always seen high in the sky and at a great elevation. Its formation is fibrous and it is particularly characterized for its many varieties of shapes. It also has a marked delicacy of substance and it is pure white.
2. The Cumulus Cloud. (Fig. 25.)
The Cumulus cloud is of moderately low elevation. It is a typical cloud of a summer day. It may be recognized by little heaps or bushes rising from a horizontal base. In summer-time we are all familiar with the cumulus clouds rising with the currents of air in huge masses. They form one of the most accurate indications of 31fair weather when you see them gradually dissolving. Sometimes these clouds become very large, and, while the texture is generally of a woolly white, naturally, when they assume such large sizes, they gradually change in color to a darkish tint.
3. The Stratus Cloud. (Fig. 26.)
This is the opposite of the Cirrus cloud, because it hangs the lowest of all, in gray masses or sheets, with a poorly-defined outline.
4. The Nimbus Cloud. (Fig. 27.)
Any cloud can be classed as a nimbus cloud from which rain or snow is falling.
Of the Compound Clouds we have:
Fig. 29
1. The Cirro-Cumulus Cloud (Fig. 28), which has all the characteristics of both the Cirrus and the Cumulus. The most characteristic form of this cloud, and the one most commonly known, is when these clouds form small round masses, which appear to be 32cirrus bands broken up and curled up. This is what people call the “mackerel” sky.
2. The Cirro-Stratus Cloud (Fig. 29), which is known when the clouds arrange themselves in thin horizontal layers at a great elevation.
Fig. 30
3. The Cumulo-Stratus (Fig. 30) is the cumulus and the stratus blended together. Their most remarkable form is in connection with approaching thunder storms, and are often called thunder heads. They rapidly change their outline and present a beautiful spectacle in the sky at times.
The Cirrus, Cirro-Cumulus and Cirro-Stratus are known as the upper clouds and the others are known as the lower.
Disturbances of the atmosphere are classified as follows: Cyclonic, or low area storms, or anti-cyclonic, or high area storms.
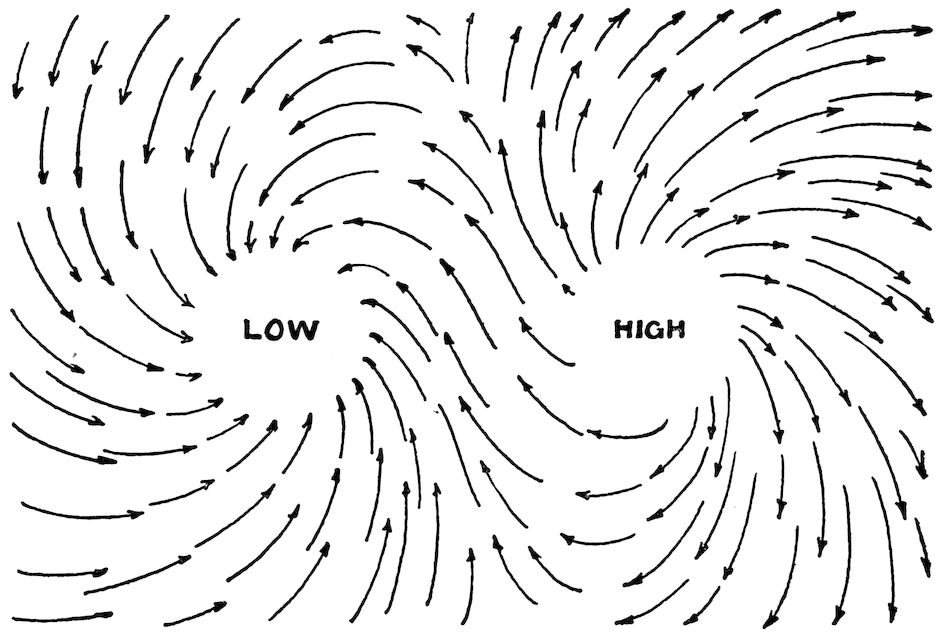
Fig. 31
The word “cyclone” to most people immediately means a terrific storm, whereas in weather observing the cyclonic storm is not really a cyclone or hurricane at all. It is a storm with an atmospheric pressure below average. Particularly important is the wind that blows about this area, which is always spirally inward, due to the rotation of the earth on its axis. This is probably why it is given the name of cyclonic storm, for it bears one of the important characteristics of a real cyclone. As the wind is deflected and moves into the storm center, it turns to the right and in the form of a whirlwind, spirally, moves around the storm center. (See Fig 31.) It is this whirling process that has given it the name, cyclonic storm.
As the air rises over the point of low storm area, or, in other words, the area of low pressure, and travels into the atmosphere, it is not permitted to rise to any great height, because it is always acted upon by the force of gravity and is being pulled back to earth again. We assume that because of this fact, this rising air which has been pulled back to the earth again piles up in certain places, 34causing the barometer to rise. Such a center as this is known as a high barometric center or the anti-cyclonic area. Here the circulation of the air is exactly opposite to that of the cyclonic area.
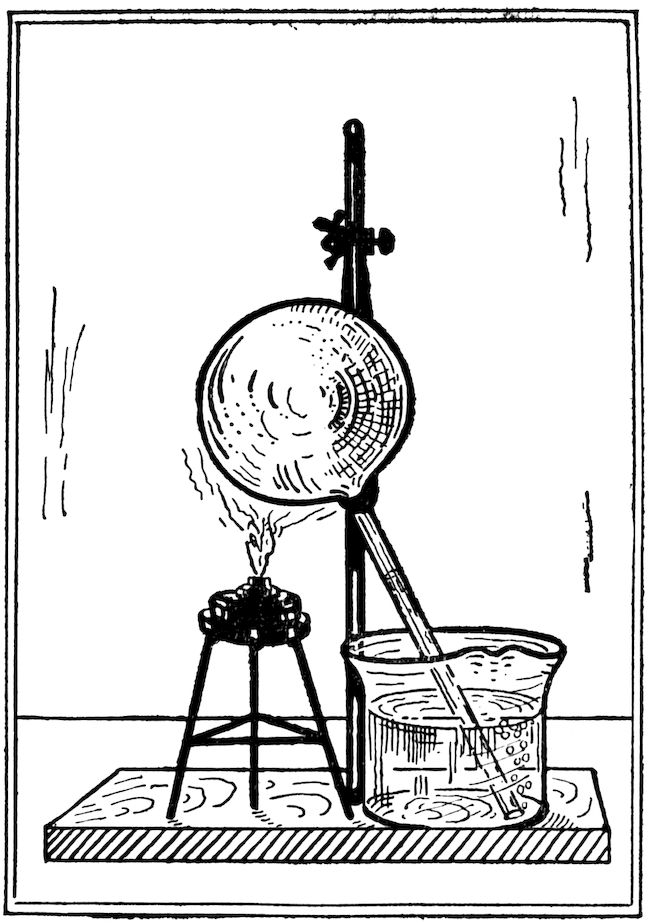
Fig. 32
We are all more or less acquainted with these anti-cyclonic storms, because in winter these great masses of air rise up from the warm areas, pile up, and form high pressure areas over the mountains of Canada, and soon this high pressure works down upon us as blizzards and cold waves.
We have described quite minutely the movement of the wind about these points of high pressure and low pressure and have shown you the map and have illustrated the high pressure and low pressure areas, but there is still another feature that is of great importance to us, and that is the movement of the storms and the fact that storms have a progressive movement from west to east.
These storms move more rapidly in the United States than elsewhere, and are more rapid in their movement in winter than in summer. Their speed is almost one half again as great. The average velocity of the low area storm in the United States is about twenty-five miles an hour in June, July, August, and September, and from October on they continue to increase.
We can summarize low pressure storms generally in the following manner: They have a wind circulation inward and upward and are elliptical in form. Their velocity varies from six hundred to nine hundred miles per day, moving in the same general direction. They are characterized in their eastern quadrants by cloudy weather, southerly and easterly winds, precipitation, temperature oppressive in summer and abnormally high in winter, falling barometer, increasing humidity and followed by clear weather, rising barometer, decreasing humidity and falling temperature in the western quadrants.
Buys Ballot’s law of winds is, that in the Northern Hemisphere if one stands with his back to the wind, the low barometric pressure will be invariably to the left hand; in the Southern Hemisphere the lowest pressure is always to the right. This law explains one of the characteristics of low pressure storms.
In speaking of low pressure storms we called them storm centers, because nearly always they are of sufficient intensity to bear that name, but in high pressure areas we do not speak of them as storm centers.
The Buys Ballot’s law applies to anti-cyclonic as well as cyclonic storms, that is, when one’s back is to the wind, the lowest barometric pressure is at the left and the highest at the right. This is probably understood by saying that in the cyclonic storms, the winds blow inward, contrary to the hands of a watch, and in the anti-cyclonic they blow outward, that is, in the same direction to the direction of the hands of the watch.
In the United States, the cyclonic storms are not as frequent as low pressure storms, and it is safe to say that probably not more than one-third of the entire anti-cyclonic areas can be classed as storm areas.
Another very interesting experiment is to secure a long-stemmed glass bulb (see Fig. 32). Arrange this apparatus as illustrated, with the stem of the bulb immersed in the water. The glass bulb condenses the air. When you first put it into the water nothing 36happens, but as soon as you apply heat the air bubbles come out of the end of the tube. This means that the air in the tube has expanded and part of it has come out through the stem of the tube and the remainder is lighter. It is well to remember, when air is heated it expands and becomes lighter. This fact is extremely important to remember, because it has a great deal to do with the important instrument, the barometer, which is used to measure the pressure of the atmosphere and is an important element in the question of humidity, as you will learn later. By this time you no doubt have learned that:
1. Air has weight.
2. Heated air expands, becomes lighter, and exerts less pressure.
3. Cold air comes from the side to take the place of hot air that rises.
When the rays of the sun heat an area of the earth, the air over such a place expands and becomes lighter, naturally rising, and the result of this is that the winds are produced by cool air moving in to take the place of the heated air. This cool air moves in from all directions. When such a thing happens at any point on the earth’s surface, it is known as a storm center, an area of low pressure.
Because of the rotation of the earth on its axis, a force arises which tends to deflect to the right all motions in the northern hemisphere, and to the left all motions in the southern hemisphere. The winds flowing toward the storm center are turned to the right or left and move in a spiral around the storm center. This system of whirling winds around a central region of low pressure produce what is termed a cyclonic storm. Storms have a tendency to move in an easterly or northeasterly direction, and at a rate of from five hundred to seven hundred miles a day. Cyclonic storms, although we look upon them as being very severe, are very often mild and not of an intensive character.
From the descriptions and experiments preceding, which illustrate the development of storms, reference was made only to the winds blowing in toward the storm center. Naturally the question 37comes to your mind: What happens to them after the cold air has taken the place of the warm air? They change to other directions when the storm has passed away. It is because of this fact that we look for a change in weather conditions when the wind changes—a very important sign that you will be interested in later on.
It is well to mention here a thing that is going to be very important to us when we study the barometer, that is, the pressure of the atmosphere. Should the pressure of the air, which is normally at sea level 14.7 pounds to the square inch, change, that is, become lighter, it would not exert so much pressure on the column of mercury in the tube of the barometer and the mercury would drop in the tube. (See Fig. 7.) On the other hand, if the weight of the air was increased, that is, if it became heavier, it would force the mercury to rise in the tube. This should be quite clear to you, because it is the lightness and heaviness of the air that is going to interest us more particularly than any other part of the subject when we get into the study of the atmospheric changes, what causes them, and the indications that lead up to our conclusions. In order that this principle is absolutely clear to you, you should perform Experiment 4, or if you have not facilities for doing it, it is well to see it performed in any physics laboratory.
Immediately you ask yourself: If air has such a tremendous pressure as 14.7 pounds to the square inch, why is it that a weight of air amounting to thirty-five thousand pounds bearing down on the average individual does not cave the body in? Simply because air penetrates the body so easily that it exerts as much pressure on the inside as on the outside, and thereby equalizes itself. For instance, if you go down into a subway or a caisson (a water-tight box or chamber within which submarine construction is carried on under great air pressure to keep out the water), where the pressure is sometimes greater than it is outside, have you noticed the effect this pressure exerts on the ear drums? As it becomes greater, you may equalize it by swallowing, which allows the air to get back of the ear drums through the Eustachian tubes, which lead from the mouth to the inner ear.
Water vapor is always present in the air.
Expose a piece of dry potash to the air. You will soon discover that the potash will dissolve. It has taken up water from the air.
Put a piece of ice in a pitcher of water and allow it to stand in a warm room. You will soon notice that little beads of perspiration collect on the outside of the pitcher. This moisture is air being condensed.
Water vapor is part of the atmosphere. Some of it is always present in the air. The amount of vapor that the air can hold depends upon the temperature. When the temperature is warm, the air will hold more water. For instance, at 100° F. a cubic foot of air will hold 19.79 grains of vapor; at 80° F., 10.95 grains; at 50° F., 4.09 grains, and 32° F., 2.17 grains. At 32° F. is the freezing point on the Fahrenheit scale.
Air containing as much water vapor as it can hold is saturated. If the air is suddenly cooled down, that is, if the temperature falls when the air is saturated, air molecules are contracted, and it must give up the water, which produces rain. The ocean and the Great Lakes are the source from which the air gets its water. It rises into the air in the form of vapor, that is, vapor rising from the surface of the water, and the wind distributes it over the land. Condensation turns it into clouds, and when it is over-saturated, or rather, when the temperature drops and the air is unable to retain any more water, then it forms into drops of water and falls as rain. When the clouds get into the air, below the freezing point of the water, the drops of water are changed into ice crystals or snow flakes.
When the ice crystals are just at the point of melting into water, due to the rise in temperature, the snowflakes lose their form and the result is sleet.
So far we have described, in a general way, certain facts about the elements of the air, such as temperature, pressure, humidity, precipitation, evaporation, clouds, winds, etc., and these facts of the elements enter into a very interesting phase of weather observation 39which we will designate as prophesying without instruments or forecasting by physical science. When we come to the more interesting and scientific part of weather observation, we will drop the word “prophecy,” because the instruments that are used to measure these elements are going to indicate certain things to us that will lead you to more definite conclusions. Hence, the following observations are what have given an opportunity to the weather prophet or to those people who have been credited with some mysterious power to prophesy what the weather is going to be. They are not definite or conclusive, and they cannot always be depended upon, but they certainly are significant and interesting, and a description of weather would not be complete without a list in chronological order of a series of phenomena or physical signs of this character that have lead certain men to gain quite a reputation for prophesying what the weather is going to be.
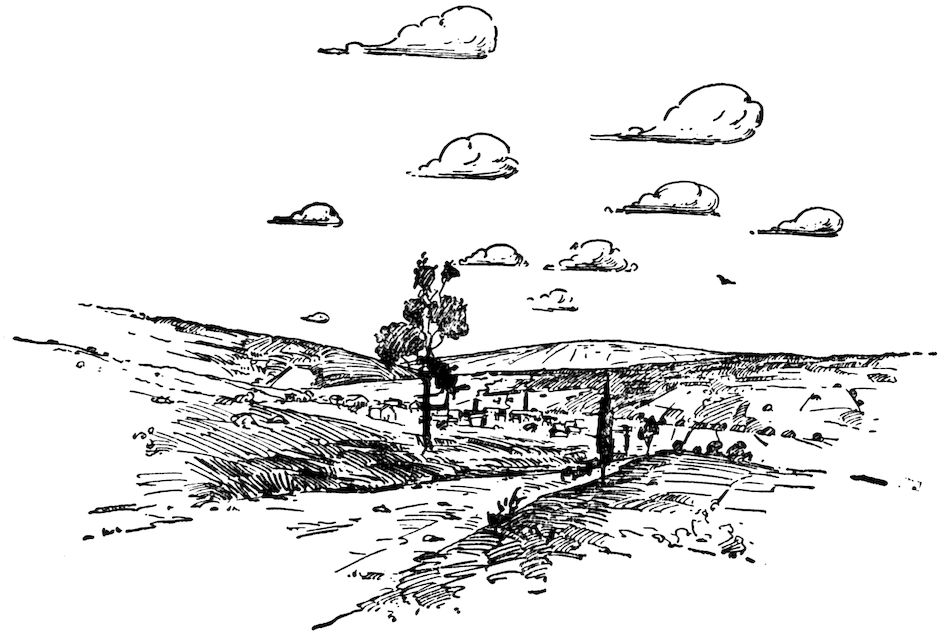
Fig. 33
Various appearances that come in the sky.
For instance, a good example is in the case of the thunder storm, 40which can be determined at least a few hours in advance, by the movement of the clouds and the forms they take. In every locality there is a direction that clouds take that forecasts bad weather, and there is a direction that clouds take that forecasts fair weather.
When you see a halo about the top of a mountain, you know that bad weather is expected. The same is true when a halo appears about the moon. This indicates rain, or if the lower clouds break up and the upper clouds, or a second light covering of clouds, are seen above the lower ones, it speaks for continued bad weather. In some localities if rainy weather is continuing for some time, and a certain change in wind sets in, it will indicate that good weather is coming.
These observations will be readily understood as being adapted for certain localities and are not general. It is always necessary that the observer adapt himself to these localities and study them, so that he can make prophecies accordingly. It should be borne in mind that these prophecies are only possible from one day to another.
When high clouds are seen crossing the sun or the moon in a different direction from the lower clouds, this indicates change of wind toward the direction of the higher clouds. When you see hard-edged clouds, look for wind. When you see delicate soft clouds, look for fine weather and probably moderate breeze or high breeze. When you see gloomy dark clouds in a blue sky, look for slight winds. When you see a bright blue sky through fine clouds that are soft and delicate, this indicates fine weather. When you see soft-looking clouds, you can expect less wind, but probably rain. But when the clouds become hard and ragged, tufted and rolling in appearance, stronger winds are coming. When you see small clouds that are inky looking, look for rain. When you see light clouds traveling across heavy hard masses of clouds, this indicates both wind and rain, but if the light scud clouds are alone, you may expect wind only. Misty clouds forming or hanging over the peaks of hills indicate both wind and rain. If during a rainy spell they ascend or disperse the weather is pretty certain to clear up. If there has been fine weather and you begin to see light 41streaks in the sky which are distant clouds, and they continue to increase and grow into cloudiness, this indicates rain.
When the sun is setting and the sky in the west presents a color of whitish yellow or radiates out at a great height, rain can be looked for during the next night or day. Gaudy colors where clouds are definitely outlined indicate probably wind and rain.
Before setting, if the sun looks diffused and the color is a brilliant white, this forecasts storms. When the sun sets in a slightly purple sky and the color at the zenith is a bright blue, this indicates fine weather. A red sunset generally indicates good weather, whereas a ruddy or misty sunset indicates bad weather.
When you see a dark, dismal sky, look for rain. A sky with a greenish hue, described as a sickly-looking sky, is an indication of both rain and wind. A sailor’s sky, which is red in the morning, means either wind or rain, and it makes no difference if the sky is cloudy or clear, if at sunset it is rosy, it indicates fine weather. A gray sky in the morning indicates fine weather. When daylight is first seen above a bank of clouds, look for a good stiff wind. Wind is indicated if we have a bright yellow sky in the morning, and rain is indicated if the sky takes on a pale yellow hue. If the sky turns bright yellow late in the afternoon, it generally indicates that rain is near at hand. Unusual colorations, particularly of deep intense color, indicate wind or rain.
The following appearances indicate a change in the weather: When the atmosphere is clear and crystalline and the stars appear extremely bright; when the background of the horizon seems to be pinned up against the foreground; when the clouds form into delicate white film-like mist way up overhead. (Fig. 33.)
Locality has considerable to do with what the fog indicates. As a rule, where you have fog, there is not much wind, and as a result it does not indicate stormy weather, unless the fog becomes heavy with overhanging sky, then it is apt to turn into rain, but a heavy fog with a light sky indicates fine weather. A fog in the morning generally indicates a fair day. A rising fog is a good indication for fair weather.
Courtesy Julien Friez & Sons, Baltimore, Md.
Fig. 34
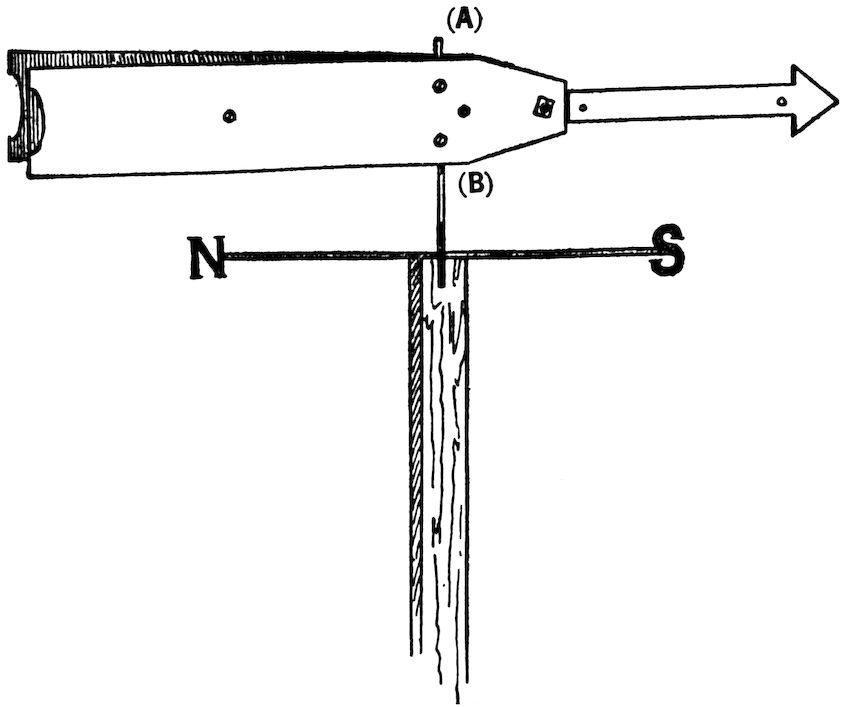
Fig. 35
Dew is a pretty good sign of fine weather. When you can see and hear with remarkable clearness, and everything is calm and still, it is a pretty infallible sign that cold weather is due.
Frost may be looked for on clear, calm, cloudless nights, when the ground is apt to be cooler than the air.
When these clouds suddenly appear in the sky on a clear summer day, they indicate wet weather. Especially if the weather ends turn upward, which means that the clouds are coming down. When moisture in the form of little drops cling to vegetation, it is a pretty good indication that there is apt to be more rain.
When the sky assumes the appearance of a gray mass and the sun is observed shining through, it is a pretty good indication that it will rain before night.
44When overhead clouds are thick and grayish and the lower surface of them is lumpy, this is an indication of rain.
Whirlwinds of dust are also indications of rain.
The rings that we see formed about the moon are caused by the delicate white clouds through which the moon is shining.
Courtesy Julien Friez & Sons, Baltimore, Md.
Fig. 36
The morning rainbow indicates that a shower is in the west, but if the rainbow is in the east it indicates that the shower has passed over.
There are certain actions of birds that indicate many things pertaining to the weather that are interesting. It is probable that their ability to fly into the air gives them a view of the horizon, that by instinct they have been able to determine the atmospheric changes. For instance, it is well known that if birds of long flight remain at their base, it generally foretells a storm. The sudden silence of birds has been referred to a great many times preceding a storm.
Barnyard fowls do many peculiar things that foretell certain weather conditions. The crow flies low and in great circles, cawing loudly, before approaching rain.
Sometimes the house fly is a pretty good barometer. Generally before a storm they seem to light on everything, particularly persons, and we call them “sticky.” Generally at these times they congregate in swarms. Most everyone is familiar with the gnat. They are one of the few insects that gives us indications and good signs, and when you see them forming in groups and moving along in front of you, you may expect fair weather.
There are many other interesting facts and fairy tales about indications by animals and insects, but there is nothing scientific about them. It has been demonstrated that there is nothing conclusive to be drawn from such signs, so we will not attempt to waste pages of this book reiterating these fables.
Certain actions of insects and animals give indications and enable the weather prophet to prophesy. The spider is a good example of an insect prophet, and if you will observe him carefully, you will find that when stormy weather is going to come on he shortens his webs, and if he anticipates a long, hard storm, he not only shortens the strings that hold up the web, but he strengthens them as well, and vice-versa, when he anticipates fine weather, he lengthens his strands of the web. When you see the spider cease his activities and he hangs pretty close to his home, which is the center of the web, you will know that rain is approaching. On the other 46hand, if he continues to spread about during a storm, you can be pretty certain that it is not going to be of very long duration.
The frog is a good example of an animal prophet. There is a green frog which has been studied in Germany, which will come out of the water when rainy weather or cold is approaching. Some observers have placed these frogs in a glass jar with a landing provided so that he can come out of the water when he wants to, and he is always observed high and dry above the water several hours in advance of a storm.
The first part of this book may not appeal to you, if you are of a scientific trend of mind, but it is quite essential that you possess a knowledge of the fundamentals treated in the earlier pages in order to thoroughly understand the weather instruments we will now describe. These instruments are the scientific means of forecasting what the weather is going to be. They definitely indicate certain things, and from these indications you are going to be able to draw conclusions and become a scientist or meteorologist. The success that you attain will depend upon the accuracy of the instruments and the care you use in reading them. You will be able to rig up a Weather Bureau of your own, and the use of these instruments will interest anyone in a study of the weather.
To make a forecast, it is essential from what we have already written, to know the direction of the wind, and to determine the direction we must have a weather vane. It is real important that the vane should be sensitive to the slightest movement of the wind and give actual wind directions. At the same time it must possess the property of steadiness, so that when it is set up it will be rigid.
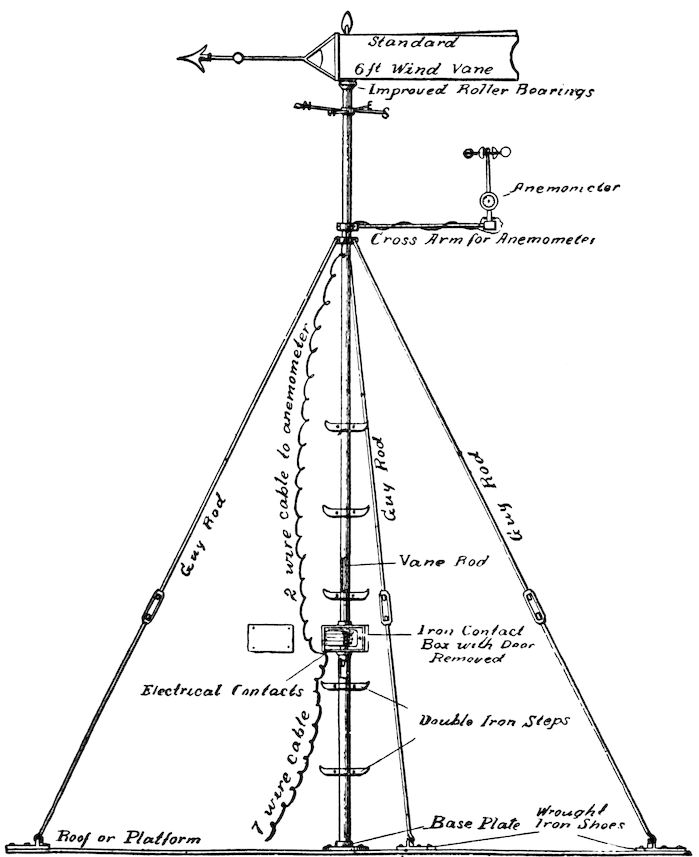
Fig. 34 shows the standard weather vane used at all United States Weather Bureau Stations and Fig. 35 shows the Gilbert Weather Vane.
Fig. 35. The Gilbert weather vane consists of a metal arrow pointer and a metal rod eight inches long and five thirty-seconds 47of an inch in diameter. The rod is fastened by means of a few staples to the side of a pole, or whatever is to be used as a support for the vane. About three inches from the top of the rod is a collar with set screw, which is tightened, and the vane itself is then placed on the rod, the rod passing through the small angles A and B, between the sides of the vane. It will be found that the vane will swing freely on this support, and by constructing two crosspieces with letters N, S, E, and W at each end of the pieces, of course having N pointing directly north, the vane will swing around and show the direction of the wind.
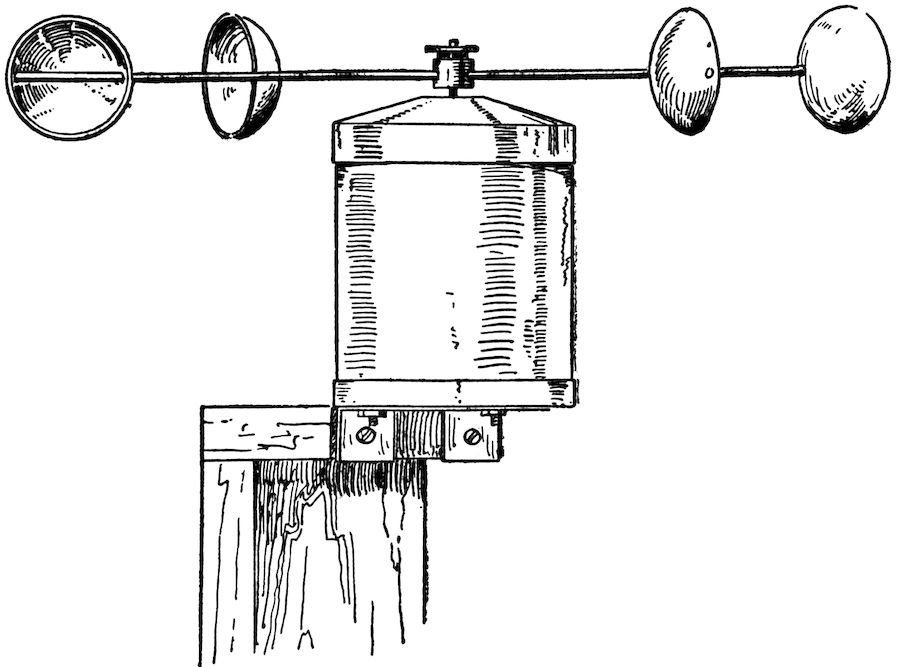
Fig. 37
The standard United States Weather Bureau type hardly needs explanation, as the illustration clearly shows all parts. It is the old, reliable, standard iron, combined wind vane and anemometer support complete, twenty feet high; iron contact box near base, improved roller bearings for six-foot vane; latter, with electrical contacts shown enlarged at the right. The vane is fastened securely to the roof of the building and held in a perfectly vertical position.
It is essential to know the velocity of the wind. This is determined by means of an instrument called the anemometer.
Fig. 36. The Standard U. S. Weather Bureau Station Anemometer.
This is the well-known standard Robinson Anemometer, now in universal use throughout the world for the registration of wind velocity, but of the latest improved construction. It records electrically the miles or kilometers, etc., of wind movements on a register. The standard pattern as furnished to Weather Bureau stations is made of brass, highly polished and finished, aluminum (or copper reinforced) cups, steel spindle with hard steel bearings, a ten-mile or kilometer indicator, electrical contacts, etc.
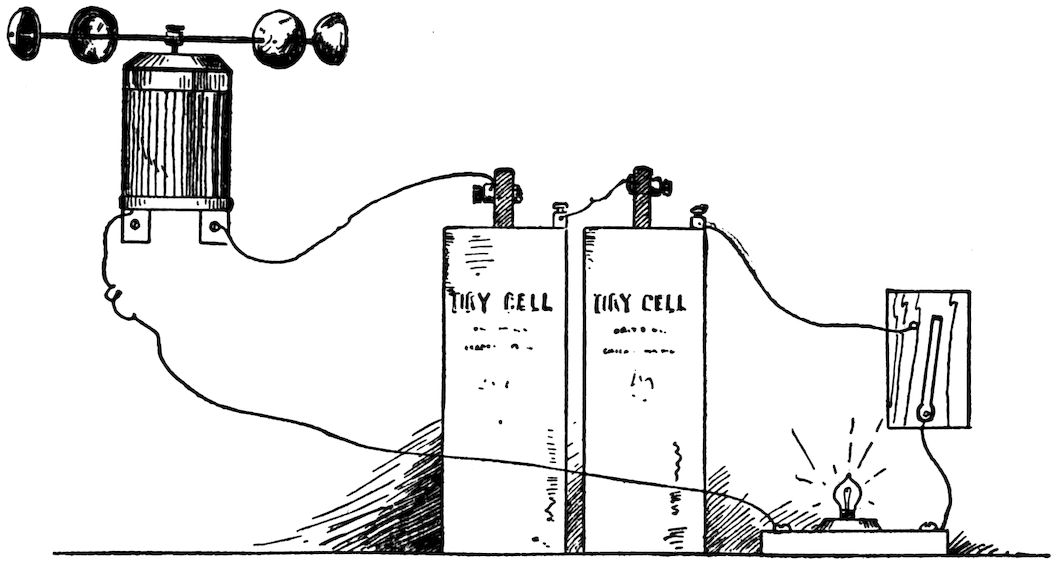
Fig. 38
The four hollow hemispherical cups are mounted upon cross-arms at right angles to each other, with the open sections vertical and facing the same way around the circumference. The cross-arms are on a vertical axis, which has at its lower end an endless screw. This axis is supported so as to turn with as little friction as possible. The endless screw is in gear with a wheel which moves two dials registering the number of revolutions of the cups. The mechanisms are mounted in a suitable metal case with glass front, as shown in the illustration, well protected from the weather, the whole being designed for outdoor use.
Courtesy Julien Friez & Sons, Baltimore, Md.
Fig. 39
50The center of the cups moves with a velocity about one-third that of the wind which puts them in motion. The cups are four inches in diameter. The distance from center of cup to center of rotation or axis is 6.72 inches. Assuming that the wind-travel is exactly three times that of the center of the cup, the dials are marked to register miles of wind travel, five hundred revolutions of the cups corresponding to a mile.
The ratio of wind-travel to travel of cup is in reality variable, depending on the velocity of the wind. It is less for high than low velocities. It varies also with the dimensions of the instrument, being different for every different length of arm and diameter of cup.
On account of the great interference offered by buildings and other obstructions to the free movement of the wind, its velocity is much less in the vicinity of these obstructions than beyond; therefore, in selecting the location for an anemometer, preference should be given to the more elevated points in the vicinity of the station, and some rigid support should be used to raise the instrument as far as practicable above the immediate influence of the office building itself. The support must be set up so that the anemometer on top or on the cross-arm is as nearly vertical as possible.
The illustration shows clearly the appearance of an approved Weather Bureau pattern combined support for wind instruments, similar to the one installed at our plant.
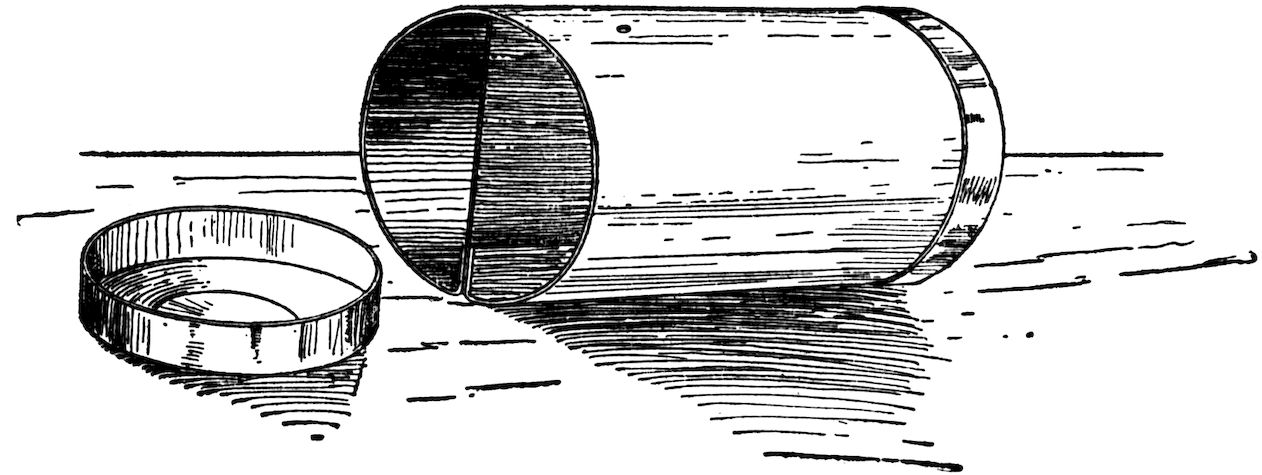
Fig. 40
Courtesy Taylor Instrument Companies Rochester, N. Y.
Fig. 41
Fig. 37. The Gilbert Anemometer.
The Gilbert Anemometer consists of a case containing a spindle passing through a worm gear, which turns a toothed gear. This gear in its rotary motion makes a contact with a brass brush, which is connected electrically with a flashlight. The cross-arms, with cups attached, is placed on the spindle, and as the wind blows, it revolves the cups, causing the contact. The velocity of the wind is determined by counting the flashes for fifteen seconds, thus giving you the number of miles per hour. For instance, if light flashes eight times in fifteen seconds, this signifies that the wind is blowing eight miles an hour.
Fig. 38. How to Connect the Gilbert Anemometer.
By referring to the diagram, you will see that one wire which should be the annunciator wire, or even a small electric light wire, is connected from the wire at the anemometer case directly to one side of the lamp socket. Another piece of the same size wire connects the other side of the lamp socket to one terminal of your switch. The second terminal of the switch should be connected to an outer post of one dry battery. The inner post of this same dry battery should be connected to the outer post of the second dry battery. Complete the circuit by connecting the inner post of the second dry battery to any one of the screws at the bottom of the anemometer case. The lamp used should be a small flashlight battery lamp for use on two and a half to three volts. Be sure in making the connections that the ends of your wire are scraped free from insulation and dirt. This can be done by cutting off the insulation with a knife and then rubbing the copper wire bright by a piece of sandpaper or emery cloth, or even a file. The switch should be left open when you are not taking readings, in order to prolong the life of your batteries. By unloosening the little screw in the hub of the anemometer vanes, you can remove them and also take off the brass cap on the anemometer case. This should be taken apart once or twice a month, and some machine oil used around the bearings to keep them from wearing out too quickly.
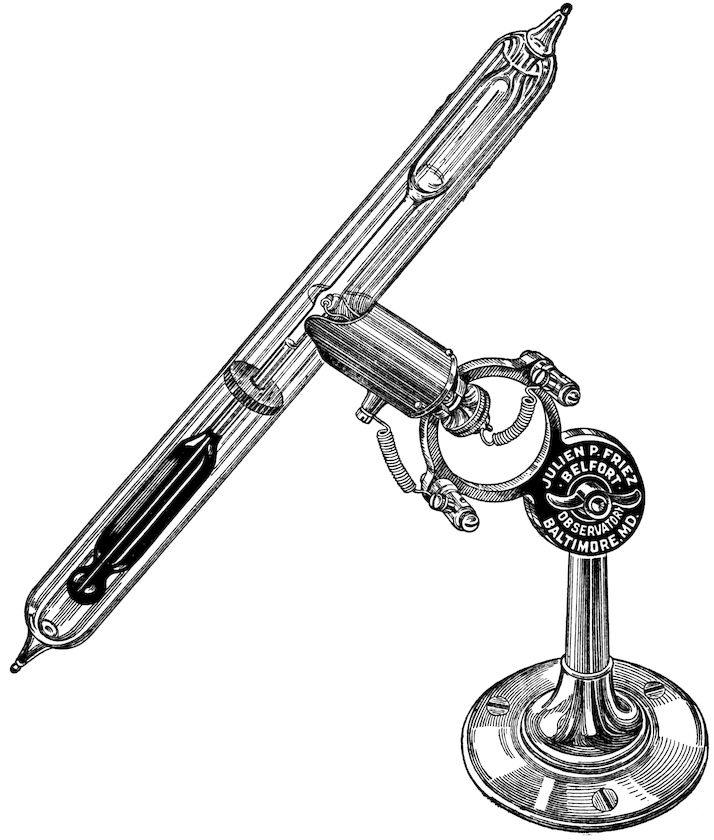
Fig. 39. The standard sunshine recorder is designed for recording the duration of sunshine electrically, continuously, and automatically, on a register. The instrument is essentially a differential air thermometer in the form of a straight glass tube with cylindrical bulbs at each end, enclosed in a protecting glass sheath, with suitable platinum wire electrodes fused in at the center, the whole mounted in a metal socket on an adjustable support.
Courtesy Taylor Instrument Companies, Rochester, N. Y.
Fig. 42
The base is secured to the support on the roof so that the glass tube points north and south, with the blackened bulb toward the south and lowermost, then the tube is inclined at such an angle that the instrument will begin and cease to record sunshine with the proper degree of cloudiness. This inclination should be approximately 45° from the vertical. The machine should be adjusted at an hour when the sun is wholly obscured.
In temperate and cold climates, slightly different adjustments will be found necessary at different seasons of the year.
Fig. 40. The Gilbert Sunshine Recorder consists of a metal case, cylindrical in form, with a piece of metal turned up on the ends, dividing the cylinder in half. On each side of the case are small holes through which the sun casts its rays and records its movement and duration on a small piece of blue print paper inside the cylinder, one piece of paper being in each compartment. When the blue print paper is dipped in water, it becomes entirely bleached, with the exception of the path made by the sun, which shows up in a blue line.
Courtesy Julien Friez & Sons, Baltimore, Md.
Fig. 43
Courtesy Julien Friez & Sons, Baltimore, Md.
Fig. 44
54The sunshine recorder should be set up so that the ends point directly north and south. The holes pierced in the sides of the case are nearer one end than the other. The end that the holes are nearest should be toward the south. It should be held firmly in place.
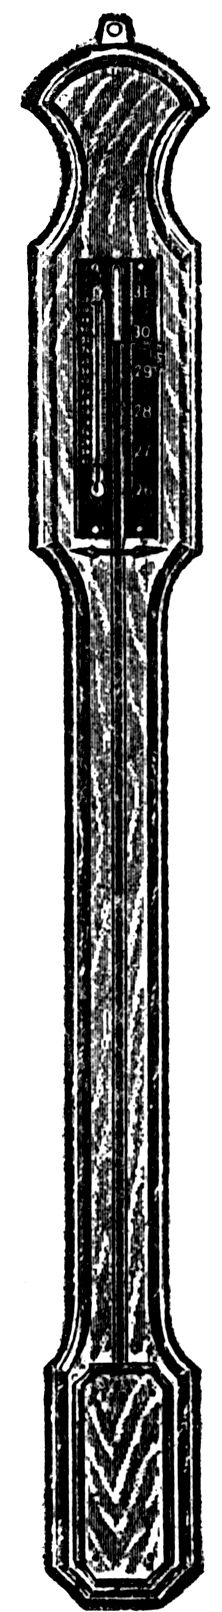
The barometer is used for measuring the pressure of the atmosphere. The principle of this instrument was first discovered by Torricelli, a pupil of Galileo, the great Italian philosopher and scientist, in 1643. Many and various types of instruments have been made, but the two most generally used, especially where accurate indications are desired, are the mercurial and aneroid barometers. Either of these instruments are quite sensitive to changes in the weight or pressure of the earth’s atmosphere, and from their variations we are able to draw conclusions relative to changes in the weather. Figs. No. 41 and 42 illustrate the standard mercurial and aneroid barometers used most extensively today. A description of these barometers will serve to make the photographs clearer to the readers of this text.
The mercurial barometer in use today is practically the same as that invented by Torricelli. Of course, many changes have been made in the case containing the tube of mercury, adding to its attractiveness, but the principle remains the same.
The standard mercurial barometer consists of a straight glass tube about thirty-two or thirty-three inches in length, hermetically sealed at one end. The tube is of half-inch bore and is filled with chemically pure mercury, which has been boiled in the tube to insure the total exclusion of all air and moisture. After the tube has been filled, the open end is immersed in a cistern of mercury. Upon immersion the mercury drops in the tube to a height of 29.92 inches at sea level, or until counterbalanced by the weight of the surrounding atmosphere pressing upon the surface of the mercury in the cistern. The space in the top of the tube is a perfect vacuum and is called the Torricellian vacuum.
The glass mercury tube is enclosed in a brass case. About two 55inches from the top of the case is an opening extending down the front and back for a distance of about eight inches. On each side of this opening is a graduated scale, one side being in inches and the other graduated in centimeters. The opening is fitted with a sliding vernier scale graduated in millimeters, thus permitting the reading of changes in the height of the mercury column most accurately, as the sliding vernier may be adjusted to the level of the mercury by means of a thumb screw fitted on the side of the case. The cistern containing the mercury is of glass, with a soft leather or chamois bottom and an adjusting screw, used to raise or lower the level of the mercury, so that it just comes in contact with a small ivory point, inserted in the top of the cistern, and which is used to mark the zero of the scale. Observations of the changes in the atmospheric pressure should be taken at regular intervals, and it is necessary to adjust the height of the mercury in the cistern before each observation. This is done by bringing the ivory point in contact with the level of the mercury and then bringing the vernier scale absolutely level with the top of the column of mercury in the tube, and then take the reading.
The mercurial barometer is a very delicate instrument and when once placed in the desired position should not be moved. Care should be taken that the room in which the barometer is placed is of nearly uniform temperature, for if the temperature at the top of the barometer is different than the temperature at the bottom, of course there will be an effect produced on the changes in the mercury column. All other barometers are set by the mercurial.
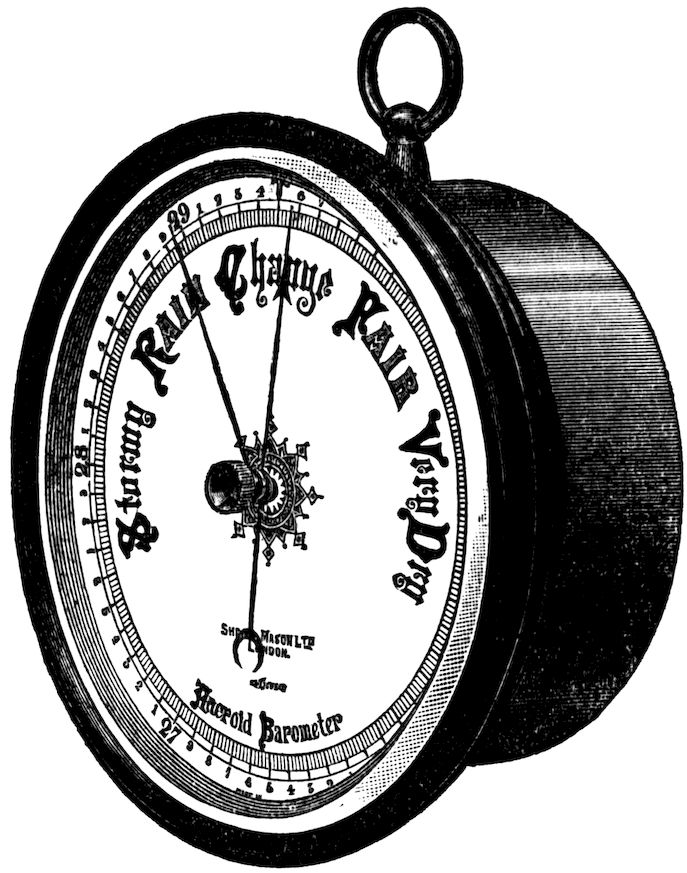
The aneroid barometer is so constructed that it contains no liquid whatever, and thus derives its name from the Greek compound word “aneroid,” meaning “without fluid.”
The essential parts of the instrument are a metallic case from which the air has been exhausted, and which contains a spring. The case of elastic metal is fastened to a base plate at the bottom and to the spring at the top. The pressure of the atmosphere causes the case to expand and contract, thus affecting the spring, which is connected to a needle or dial, causing the dial to move around on the scale on the face of the instrument and record the changes. The scale is marked off in inches from 28 to 31, and besides 56a brass hand or pointer, used to designate the changes in the atmospheric pressure, there is a small index hand to set over the needle so that the amount of change in a certain period is easily known on consulting the instrument.
Courtesy Julien Friez & Sons, Baltimore, Md.
Fig. 45
The dial of the barometer is marked with the words “Fair,” “Change,” and “Rain,” etc., but these words have no significance, and should be disregarded. For instance, 29½ is marked “Change”; 30, “Fair”; 31, “Very dry”; 28½, “Rain.” If the barometer, which has been standing at 30.9, suddenly drops down to 29.9, this is positive indication that a storm is approaching, with strong winds, yet, according to the dial on the aneroid, the reading would be “Fair.” If the barometer were standing at 28 and rose to 29, this would actually indicate approach of cold, dry weather, and yet on the dial it reads “Rain.” This simply goes to show that the readings on the dial are of no significance whatsoever, and are not to be relied upon.
The aneroid is not as accurate an instrument as the mercurial, so should be checked up occasionally with the mercurial barometer.
Courtesy Taylor Instrument Companies Rochester, N. Y.
Fig. 46
The aneroid type of barometer is also used in altitude work, but must be compensated before using.
This type of barometer possesses several advantages over the mercurial in that it is portable and therefore used for altitude work; at sea it is used because there is no fluid to become unsettled by the motion of the vessel; it is used also in observatory work because the action is quicker than the mercurial barometer action, and sudden changes likely to occur are indicated.
A single observation reading of the barometer is of no significance. Readings must be taken at different intervals or the results will be misleading. The important thing about the barometer is to watch the rise and fall, particularly, whether it is gradual or rapid. From no single reading can you make an observation or a forecast. A rapid rise indicates that a strong wind is apt to blow. A rapid fall indicates that the weather will be unsettled, and that strong winds are apt to blow. Both indicate a change in the weather, depending upon many things, particularly, however, the direction from which the wind blows. If an observer stands with the wind blowing on his back, the area of low barometric pressure will be at his left, and that of high barometric pressure at his right. With low pressure in the west and high pressure in the east, the wind will be from the south; but with low pressure in the east and high pressure in the west, the wind will be from the north. The barometer rises for northerly winds, from northwest by the north to eastward, for dry, or less wet weather, for less wind, or for more than one of these changes—except on a few occasions, when rain, hail, or snow comes from the northward with strong wind. The barometer falls for southerly wind, from southeast, by the south, to the westward, for wet weather, for stronger wind, or for more than one of these changes, except on a few occasions, when moderate wind with rain or snow comes from the northward.
| RELATIVE HUMIDITY TABLES | |||||||||||||||||
|---|---|---|---|---|---|---|---|---|---|---|---|---|---|---|---|---|---|
| Per Cent Fahrenheit Temperatures | |||||||||||||||||
| Difference in Degrees Between Wet and Dry Bulb Thermometers | |||||||||||||||||
| Reading of Dry Bulb Thermometer | 1.0 | 2.0 | 3.0 | 4.0 | 5.0 | 6.0 | 7.0 | 8.0 | 9.0 | 10.0 | 11.0 | 12.0 | 13.0 | 14.0 | 15.0 | 16.0 | 17.0 |
| 32 | 90 | 79 | 69 | 60 | 50 | 41 | 31 | 22 | 13 | 4 | |||||||
| 33 | 90 | 80 | 71 | 61 | 52 | 42 | 33 | 24 | 16 | 7 | |||||||
| 34 | 90 | 81 | 72 | 62 | 53 | 44 | 35 | 27 | 18 | 9 | 1 | ||||||
| 35 | 91 | 82 | 73 | 64 | 55 | 46 | 37 | 29 | 20 | 12 | 4 | ||||||
| 36 | 91 | 82 | 73 | 65 | 56 | 48 | 39 | 31 | 23 | 14 | 6 | ||||||
| 37 | 91 | 83 | 74 | 66 | 58 | 49 | 41 | 33 | 25 | 17 | 9 | 1 | |||||
| 38 | 91 | 83 | 75 | 67 | 59 | 51 | 43 | 35 | 27 | 19 | 12 | 4 | |||||
| 39 | 92 | 84 | 76 | 68 | 60 | 52 | 44 | 37 | 29 | 21 | 14 | 7 | |||||
| 40 | 92 | 84 | 76 | 68 | 61 | 53 | 46 | 38 | 31 | 23 | 16 | 9 | 2 | ||||
| 41 | 92 | 84 | 77 | 69 | 62 | 54 | 47 | 40 | 33 | 26 | 18 | 11 | 5 | ||||
| 42 | 92 | 85 | 77 | 70 | 62 | 55 | 48 | 41 | 34 | 28 | 21 | 14 | 7 | ||||
| 43 | 92 | 85 | 78 | 70 | 63 | 56 | 49 | 43 | 36 | 29 | 23 | 16 | 9 | 3 | |||
| 44 | 93 | 85 | 78 | 71 | 64 | 57 | 51 | 44 | 37 | 31 | 24 | 18 | 12 | 5 | |||
| 45 | 93 | 86 | 79 | 71 | 65 | 58 | 52 | 45 | 39 | 33 | 26 | 20 | 14 | 8 | 2 | ||
| 46 | 93 | 86 | 79 | 72 | 65 | 59 | 53 | 46 | 40 | 34 | 28 | 22 | 16 | 10 | 4 | ||
| 47 | 93 | 86 | 79 | 73 | 66 | 60 | 54 | 47 | 41 | 35 | 29 | 23 | 17 | 12 | 6 | 1 | |
| 48 | 93 | 87 | 80 | 73 | 67 | 60 | 54 | 48 | 42 | 36 | 31 | 25 | 19 | 14 | 8 | 3 | |
| 49 | 93 | 87 | 80 | 74 | 67 | 61 | 55 | 49 | 43 | 37 | 32 | 26 | 21 | 15 | 10 | 5 | |
| 50 | 93 | 87 | 81 | 74 | 68 | 62 | 56 | 50 | 44 | 39 | 33 | 28 | 22 | 17 | 12 | 7 | 2 |
| 51 | 94 | 87 | 81 | 75 | 69 | 63 | 57 | 51 | 45 | 40 | 35 | 29 | 24 | 19 | 14 | 9 | 4 |
| 52 | 94 | 88 | 81 | 75 | 69 | 63 | 58 | 52 | 46 | 41 | 36 | 30 | 25 | 20 | 15 | 10 | 6 |
| 53 | 94 | 88 | 82 | 75 | 70 | 64 | 58 | 53 | 47 | 42 | 37 | 32 | 27 | 22 | 17 | 12 | 7 |
| 54 | 94 | 88 | 82 | 76 | 70 | 65 | 59 | 54 | 48 | 43 | 38 | 33 | 28 | 23 | 18 | 14 | 9 |
| 55 | 94 | 88 | 82 | 76 | 71 | 65 | 60 | 55 | 49 | 44 | 39 | 34 | 29 | 25 | 20 | 15 | 11 |
| 56 | 94 | 88 | 82 | 77 | 71 | 66 | 61 | 55 | 50 | 45 | 40 | 35 | 31 | 26 | 21 | 17 | 12 |
| 57 | 94 | 88 | 83 | 77 | 72 | 66 | 61 | 56 | 51 | 46 | 41 | 36 | 32 | 27 | 23 | 18 | 14 |
| 58 | 94 | 89 | 83 | 77 | 72 | 67 | 62 | 57 | 52 | 47 | 42 | 38 | 33 | 28 | 24 | 20 | 15 |
| 59 | 94 | 89 | 83 | 78 | 73 | 68 | 63 | 58 | 53 | 48 | 43 | 39 | 34 | 30 | 25 | 21 | 17 |
| 59 | |||||||||||||||||
| 60 | 94 | 89 | 84 | 78 | 73 | 68 | 63 | 58 | 53 | 49 | 44 | 40 | 35 | 31 | 27 | 22 | 18 |
| 61 | 94 | 89 | 84 | 79 | 74 | 68 | 64 | 59 | 54 | 50 | 45 | 40 | 36 | 32 | 28 | 24 | 20 |
| 62 | 94 | 89 | 84 | 79 | 74 | 69 | 64 | 60 | 55 | 50 | 46 | 41 | 37 | 33 | 29 | 25 | 21 |
| 63 | 95 | 90 | 84 | 79 | 74 | 70 | 65 | 60 | 56 | 51 | 47 | 42 | 38 | 34 | 30 | 26 | 22 |
| 64 | 95 | 90 | 85 | 79 | 75 | 70 | 66 | 61 | 56 | 52 | 48 | 43 | 39 | 35 | 31 | 27 | 23 |
| 65 | 95 | 90 | 85 | 80 | 75 | 70 | 66 | 62 | 57 | 53 | 48 | 44 | 40 | 36 | 32 | 28 | 25 |
| 66 | 95 | 90 | 85 | 80 | 76 | 71 | 66 | 62 | 58 | 53 | 49 | 45 | 41 | 37 | 33 | 29 | 26 |
| 67 | 95 | 90 | 85 | 80 | 76 | 71 | 67 | 62 | 58 | 54 | 50 | 46 | 42 | 38 | 34 | 30 | 27 |
| 68 | 95 | 90 | 85 | 81 | 76 | 72 | 67 | 63 | 59 | 55 | 51 | 47 | 43 | 39 | 35 | 31 | 28 |
| 69 | 95 | 90 | 86 | 81 | 77 | 72 | 68 | 64 | 59 | 55 | 51 | 47 | 44 | 40 | 36 | 32 | 29 |
| 70 | 95 | 90 | 86 | 81 | 77 | 72 | 68 | 64 | 60 | 56 | 52 | 48 | 44 | 40 | 37 | 33 | 30 |
| 71 | 95 | 90 | 86 | 82 | 77 | 73 | 69 | 64 | 60 | 56 | 53 | 49 | 45 | 41 | 38 | 34 | 31 |
| 72 | 95 | 91 | 86 | 82 | 78 | 73 | 69 | 65 | 61 | 57 | 53 | 49 | 46 | 42 | 39 | 35 | 32 |
| 73 | 95 | 91 | 86 | 82 | 78 | 73 | 69 | 65 | 61 | 58 | 54 | 50 | 46 | 43 | 40 | 36 | 33 |
| 74 | 95 | 91 | 86 | 82 | 78 | 74 | 70 | 66 | 62 | 58 | 54 | 51 | 47 | 44 | 40 | 37 | 34 |
| 75 | 96 | 91 | 87 | 82 | 78 | 74 | 70 | 66 | 63 | 59 | 55 | 51 | 48 | 44 | 41 | 38 | 34 |
| 76 | 96 | 91 | 87 | 83 | 78 | 74 | 70 | 67 | 63 | 59 | 55 | 52 | 48 | 45 | 42 | 38 | 35 |
| 77 | 96 | 91 | 87 | 83 | 79 | 75 | 71 | 67 | 63 | 60 | 56 | 52 | 49 | 46 | 42 | 39 | 36 |
| 78 | 96 | 91 | 87 | 83 | 79 | 75 | 71 | 67 | 64 | 60 | 57 | 53 | 50 | 46 | 43 | 40 | 37 |
| 79 | 96 | 91 | 87 | 83 | 79 | 75 | 71 | 68 | 64 | 60 | 57 | 54 | 50 | 47 | 44 | 41 | 37 |
| 80 | 96 | 91 | 87 | 83 | 79 | 76 | 72 | 68 | 64 | 61 | 57 | 54 | 51 | 47 | 44 | 41 | 38 |
| 82 | 96 | 92 | 88 | 84 | 80 | 76 | 72 | 69 | 65 | 62 | 58 | 55 | 52 | 49 | 46 | 43 | 40 |
| 84 | 96 | 92 | 88 | 84 | 80 | 77 | 73 | 70 | 66 | 63 | 59 | 56 | 53 | 50 | 47 | 44 | 41 |
| 86 | 96 | 92 | 88 | 85 | 81 | 77 | 74 | 70 | 67 | 63 | 60 | 57 | 54 | 51 | 48 | 45 | 42 |
| 88 | 96 | 92 | 88 | 85 | 81 | 78 | 74 | 71 | 67 | 64 | 61 | 58 | 55 | 52 | 49 | 46 | 43 |
| 90 | 96 | 92 | 89 | 85 | 81 | 78 | 75 | 71 | 68 | 65 | 62 | 59 | 56 | 53 | 50 | 47 | 44 |
| 92 | 96 | 92 | 89 | 85 | 82 | 78 | 75 | 72 | 69 | 65 | 62 | 59 | 57 | 54 | 51 | 48 | 45 |
| 94 | 96 | 93 | 89 | 86 | 82 | 79 | 75 | 72 | 69 | 66 | 63 | 60 | 57 | 54 | 52 | 49 | 46 |
| 96 | 96 | 93 | 89 | 86 | 82 | 79 | 76 | 73 | 70 | 67 | 64 | 61 | 58 | 55 | 53 | 50 | 47 |
| 98 | 96 | 93 | 89 | 86 | 83 | 79 | 76 | 73 | 70 | 67 | 64 | 61 | 59 | 56 | 53 | 51 | 48 |
| 100 | 96 | 93 | 90 | 86 | 83 | 80 | 77 | 74 | 71 | 68 | 65 | 62 | 59 | 57 | 54 | 52 | 49 |
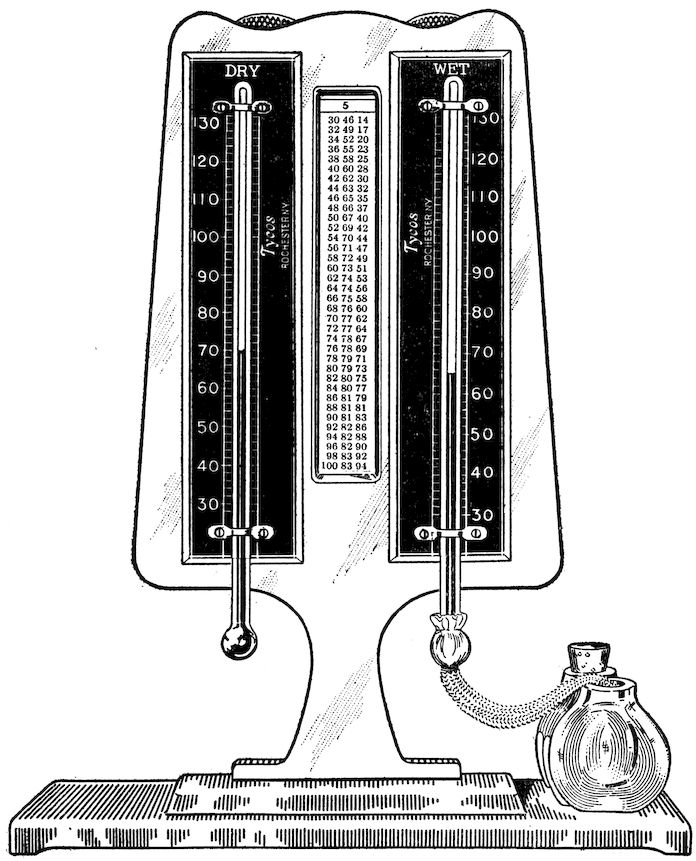
Courtesy Taylor Instrument Companies, Rochester, N.Y.
Fig. 47
Like the hygrometer, this instrument measures the “relative humidity.”
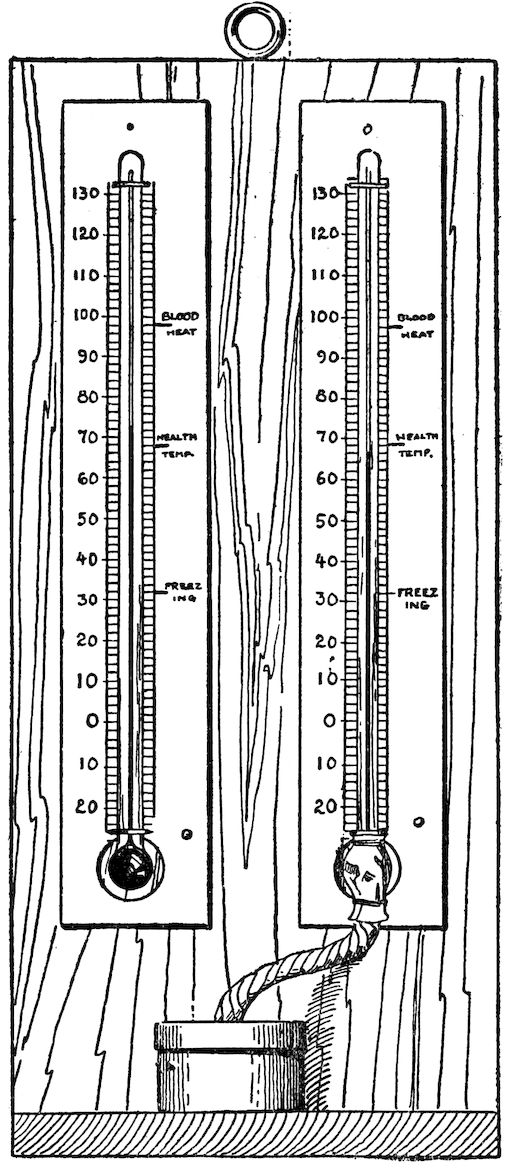
Fig. 48
GILBERT HYGROMETER
A gradual but steady rise indicates settled fair weather.
A gradual but steady fall indicates unsettled or wet weather.
A very slow rise from a low point is usually associated with high winds and dry weather.
A rapid rise indicates clear weather with high winds.
A very slow fall from a high point is usually connected with wet and unpleasant weather without much wind.
62The following table of the United States Weather Bureau gives a summary of the wind and barometer indications:
| Barometer Reduced to Sea Level | Wind Direction | Character of Weather Indicated |
|---|---|---|
| 30.10 to 30.20 and steady | SW to NW | Fair with slight temperature changes for 1 to 2 days |
| 30.10 to 30.20 and rising rapidly | SW to NW | Fair, followed within 2 days by warmer and rain |
| 30.10 to 30.20 and falling slowly | SW to NW | Warmer, with rain in 24 to 36 hours |
| 30.10 to 30.20 and falling rapidly | SW to NW | Warmer, with rain in 18 to 24 hours |
| 30.20 and above and stationary | SW to NW | Continued fair, with no decided temperature change |
| 30.20 and above and falling slowly | SW to NW | Slowly rising temperature and fair for two days |
| 30.10 to 30.20 and falling slowly | S to SE | Rain within 24 hours |
| 30.10 to 30.20 and falling rapidly | S to SE | Wind increasing in force, with rain within 12 to 24 hours |
| 30.10 to 30.20 and falling slowly | SE to NE | Rain in 12 to 18 hours |
| 30.10 to 30.20 and falling rapidly | SE to NE | Increasing wind, with rain within 12 hours |
| 30.10 and above and falling slowly | E to NE | In summer, with light winds, rain may not fall for several days. In winter, rain within 24 hours |
| 30.10 and above and falling rapidly | E to NE | In summer, rain probably within 12 to 24 hours. In winter, rain or snow, with increasing wind will often set in, when the barometer begins to fall and the wind sets in from the NE |
| 30 or below and falling slowly | SE to NE | Rain will continue 1 or 2 days |
| 30 or below and falling rapidly | SE to NE | Rain, with high wind, followed within 24 hours by clearing and cooler |
| 30 or below and rising slowly | S to SW | Clearing within a few hours and continued fair for several days |
| 29.80 or below and falling rapidly | S to E | Severe storm of wind and rain or snow imminent, followed within 24 hours by clearing and colder |
| 29.80 or below and falling rapidly | E to N | Severe northeast gales and heavy rain or snow, followed in winter by a cold wave |
| 29.80 or below and rising rapidly | Going to W | Clearing and colder |
63A sudden fall indicates a sudden shower or high winds, or both.
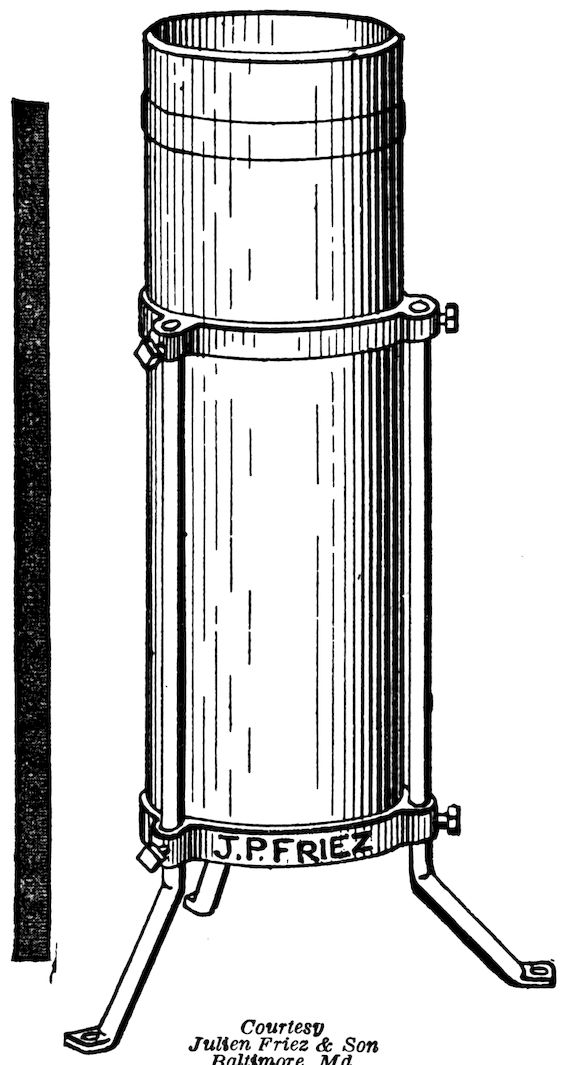
Courtesy Julien Friez & Son Baltimore, Md.
Fig. 49
U. S. STANDARD RAIN GAUGE
A stationary barometer indicates a continuance of existing weather conditions. (Note: Tap the barometer slightly on the face. If the hands move a trifle, it indicates that there is the tendency to rise or fall, depending upon the direction of movement of the hands.)
Northeasterly winds precede storms that approach from the southwest; that is, in New England and the Middle States and the Ohio Valley. Southeasterly winds precede storms that approach from the Lake region.
For information regarding the manufacture of thermometers, we recommend P. R. Jameson’s book, “Weather and Weather Instruments,” published by the Taylor Instrument Companies of Rochester, N. Y.
Thermometers are of great importance to us in determining weather.
1. They must be properly exposed.
2. A good circulation of air around them is necessary.
3. They must be properly protected from the rays of the sun.
64Note: If these instructions are not carefully followed out, errors are apt to occur, and you will be misled.
For a change of wind towards northerly directions, a thermometer falls. For a change of wind toward southerly directions a thermometer rises.
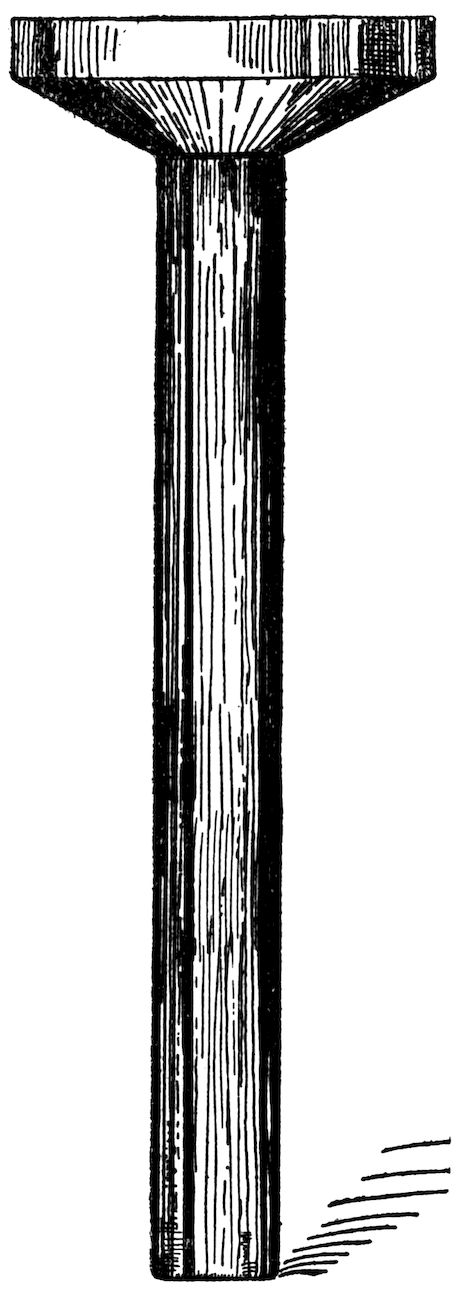
Fig. 50
GILBERT RAIN GAUGE
Maximum and minimum thermometers are used to record the daily maximum and minimum temperatures. Fig. 46 shows a typical maximum and minimum thermometer used for giving the extremes of temperature. One side of the thermometer has a scale reading, beginning at the top, from 60° below zero to 140° above zero. This is the scale used when determining the coldest temperature reached during a day. The other side of the thermometer has a scale marked from 70° below zero, beginning at the bottom and reading up, to 130° above zero. On this side the maximum heat reached during the day is recorded. There is a small metal piece in the tubes, one on each side, and as the mercury pushes ahead or recedes, the small index is left at the lowest point reached in one tube and at the highest point reached in the other. The small metal piece is drawn back to the level of the mercury by means of a small magnet.
You can generally look for maximum temperature between three and four o’clock in the afternoon. At this time the sun has reached its highest altitude.
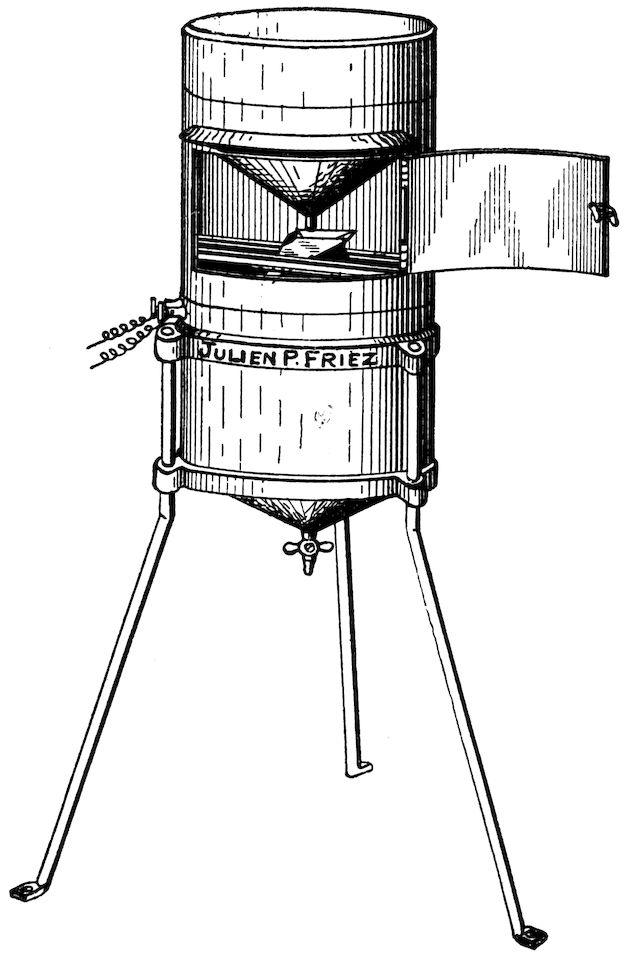
Courtesy Julien Friez & Sons, Baltimore, Md.
Fig. 51
TIPPING BUCKET RAIN GAUGE
This usually occurs a little while before sunrise. It is important in weather observing to make a record of the highest temperature of the day and the lowest temperature of the night. Continuous observation, as the reader will appreciate, is practically impossible for such a record.
Moisture or dampness in the air, as shown by an instrument called the hygrometer, increases before rain, fog, or dew.
Before describing the hygrometer, a definition of a few of the terms used in conjunction with the instrument will be found useful.
The amount of vapor actually present in the atmosphere is termed the absolute humidity, expressed usually either in the expansive force that the vapor exerts or in its weight in grains per cubic foot of air.
The absolute humidity divided by the amount of vapor that might exist if the air were saturated gives a ratio that is called the relative humidity.
The temperature at which moisture begins to be condensed on a cold vessel or other container and becomes visible is called the dew point.
The most generally used hygrometer consists of two ordinary thermometers, the bulb of one being covered with a piece of muslin and kept constantly moistened with water by means of a wick or cotton thread communicating with a container of water. The difference in the readings of the two thermometers, the wet and the dry, is observed, and knowing this, it is very easy to determine the 67humidity by consulting a table (see table on pages 58–59), which has been prepared for this purpose. These instruments are, according to the increase in price, equipped with a table, and the container is held in a wire frame, as you will see from the Figs. 49–50 showing the standard Weather Bureau station instrument and the Gilbert hygrometer.
Fig. 49 shows the U. S. Standard Weather Bureau Station Rain Gauge, Fig. 50 the Gilbert Rain Gauge and Fig. 51 the U. S. Standard Weather Bureau Station Rain Gauge, Tipping Bucket Type.
The Gilbert Weather Station is equipped with the Tipping Bucket Type Rain Gauge. Fig. 51 shows the apparatus clearly, complete and mounted ready for use. The brass bucket seen in position through the open door is adjusted to tip for each hundredth inch of rainfall collected in the twelve-inch diameter receiver at the top, and this rainfall is electrically recorded at any convenient distance on a register. After any desired period the water may be drawn off and check measurements made by means of the brass measuring tube and graduated cedar stick shown in the figure.
The essential parts of the Gilbert Rain Gauge consists of a metal tube twelve inches long, having a diameter of 1⁵⁄₁₆ inches (inside) and a funnel-shaped top, the neck of which fits snugly into the open end of the metal tube. The outside diameter of the neck of the funnel is a trifle less than 1⁵⁄₁₆ inches. The area of the circle formed at the top of the tube is one-tenth the area of the funnel circle. A measuring stick is provided to measure the rainfall collected in the tube.
To determine the amount of rainfall on the surface of the ground, the rain collected in the tube should be measured at regular intervals, usually twelve hours apart. For every inch of rain collected in the tube, as denoted by the measuring stick, it means that there is one one-tenth of an inch of rain on the ground; if 10 inches of rain in the tube, it signifies one inch of rain on the ground. In 68other words, divide the figure recorded on the measuring stick by ten for actual rainfall.
It is well to put some sort of a shelter around the gauge, so that it will be protected from strong winds. The shelter is usually placed at a distance from the tube equal to the height of the tube. With the Gilbert rain gauge it is well to erect the shelter at a distance of about three feet from the tube. It is essential that the gauge be held in an upright position, so it should be fastened to the roof.
Snow is measured by melting the quantity collected in the gauge and follow the same procedure as in rainfall measurements.
There is another very common method, called ground measurement. There are many instances where ground measurements are inaccurate:
1. When snow and rain are mixed or alternate.
2. When melting accompanies snowfall.
3. When snow is already upon the ground.
4. When the amount of fall is very small.
5. When drifting is very bad.
6. When the snow is blown about after the storm and before measurements have been made.
A bucket and a spring balance are used. The bucket is filled with snow, but not packed down too hard, and weighed. The reading of the index hand on the spring balance gives the density of the snow. The depth of the snow in the vicinity of the spot from which the bucket was filled is obtained and this figure is multiplied by the density, thus giving the water equivalent of the snow collected. For instance, if the reading of the balance was .16, and the depth of the snow was 7 inches, multiply .16 by 7, and the result, 1.12, is the water equivalent of the snow.
The first thermometer scale to give satisfaction was devised in 1714 by Fahrenheit. He determined the fixed points on the thermometer in a very novel manner. Having been born at Dantzig, he took for the zero point on his scale the lowest temperature observed by him at Dantzig, which he found was that produced by mixing equal quantities of snow and sal-ammoniac. The space between this point and that to which the mercury rose at the 69temperature of boiling water he divided into 212 parts. He determined, with his thermometer, that the atmospheric pressure governed the boiling point of water. Today the Fahrenheit thermometer is used extensively, and has for its freezing point 32° and for its boiling point 212°.
Another scale that has not become too well known, because of the fact that it did not meet with public favor, was devised by a Frenchman, named Reaumur, in 1730, and bears his name. He determined the freezing point of the scale at 0° and the boiling point of water at 80°.
Another Frenchman, named Anders Celsius, devised a scale with the boiling point of water at 0° and the freezing point at 100°. In 1743 a Frenchman, named Christin, living at Lyons, France, reversed the points, and today the scale is known as the Centigrade scale, and, together with the Fahrenheit scale, is used almost exclusively wherever thermometers are required.
Centigrade degrees into Fahrenheit: multiply by 9, divide the product by 5 and add 32.
Fahrenheit degrees into Centigrade: subtract 32, multiply by 5, and divide by 9.
Reaumur degrees into Fahrenheit: multiply by 9, divide by 4, and add 32.
Fahrenheit degrees into Reaumur: subtract 32, multiply by 4, and divide by 9.
Reaumur degrees into Centigrade: multiply by 5 and divide by 4.
Centigrade degrees into Reaumur: multiply by 4 and divide by 5.
The following is a list of the Weather Bureau Stations of the United States, and from any of these offices, preferably the one nearest you, you will be able to obtain the weather reports and weather map (see Fig. 52), indicating many things of interest, and from which you will be able to make a careful study of the weather.
You will notice that on this map different lines are drawn: First, the Isobar lines—these are solid lines drawn through places which have the same barometric pressure. Second, the Isotherm lines—these are dotted lines drawn through places having the same temperature.
The Weather Bureau Maps are gotten out on the same day all over the country, and the preparation of them is quite interesting.
At 7:40 A. M. simultaneous readings are taken at all weather bureau stations of the country. On the coast, where the time is three hours different than at New York, the readings are taken at 4:40, so that the hour corresponds at all places. At 8:00 A. M. the various stations telephone their findings to the Western Union Office located in their city and immediately the messages are transmitted by Western Union to a central district office, or circuit center as it is called. For New England, the circuit center is Boston. All messages are received at this office, and from here transmitted to the next office, which is New York, and from New York to the next center, until the news is transmitted to the coast. The wires are open from 8:00 until 9:30 A. M. The western offices follow the same procedure until the weather indications are received by all stations. Immediately the preparation of the map is begun and they are mailed to interested parties by the Weather Bureau Stations of the United States.
Figs. 52, 53 and 54 show three maps, typifying storms traveling from the west to the east, and by studying them on successive days you can at once grasp the importance of studying the weather from these maps.
Fig. 53 shows a storm of low pressure and how this area of low pressure is progressing and moving from the west to the east. Particular notice should be taken of how fast the storm travels, that is, the distance it goes each day, and the direction it is going and the results.
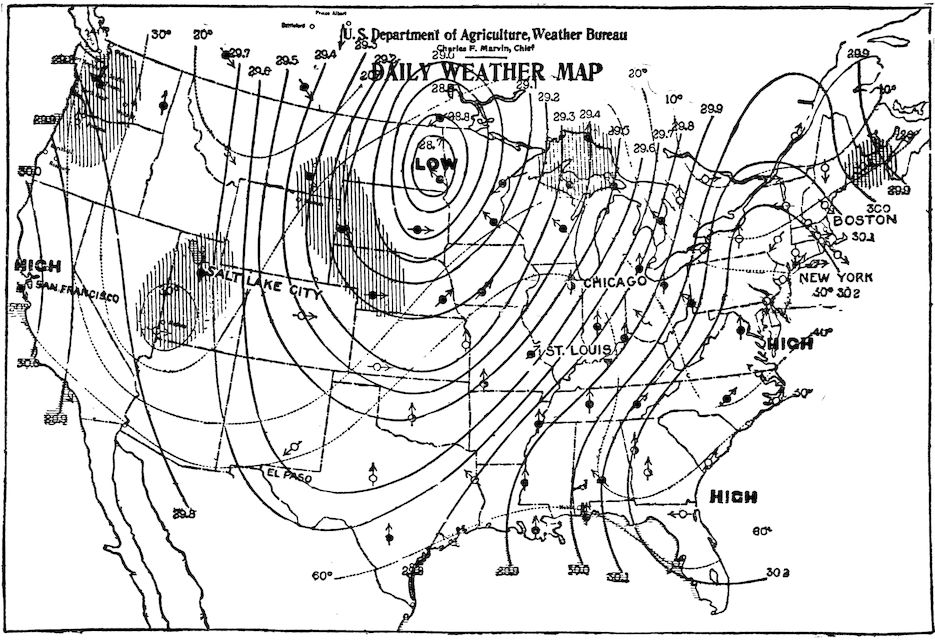
Fig. 52
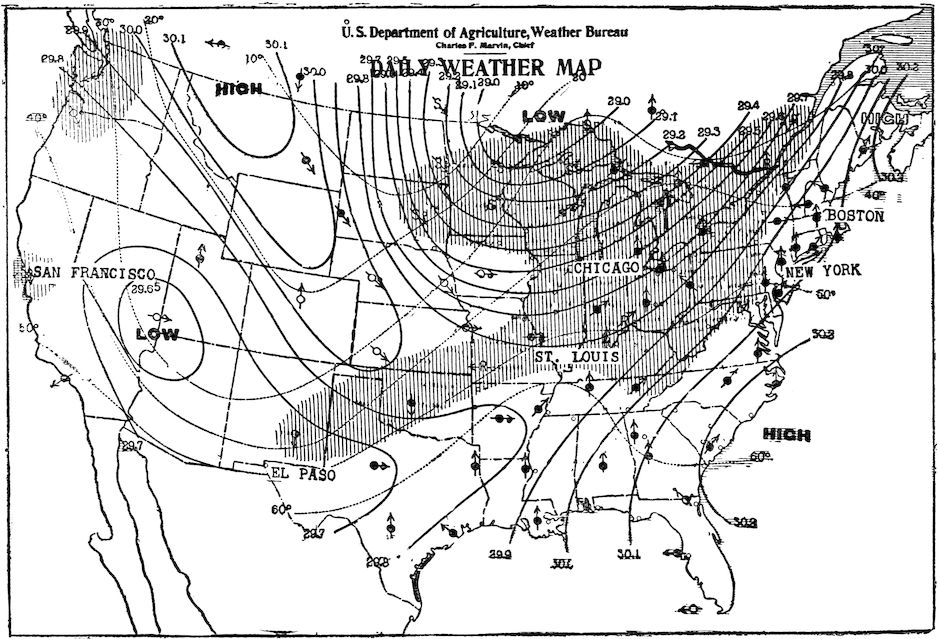
Fig. 53
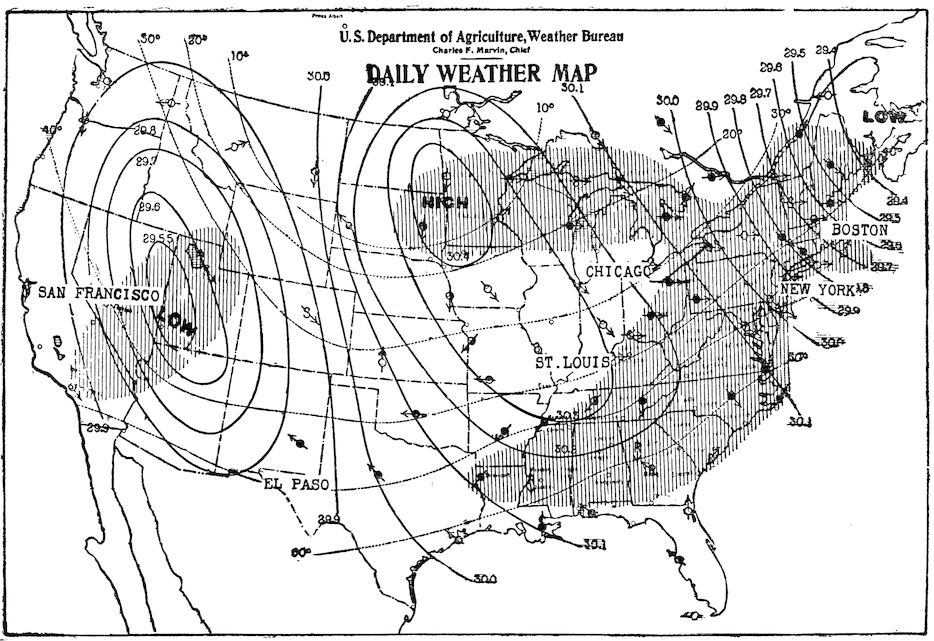
Fig. 54
76The arrows denote the direction of the wind, and you will notice they point to the region of low barometric pressure. In the regions of high barometric pressure the winds are in the opposite direction. This readily explains to you why it is that you can expect changes in weather conditions when the wind changes.
From the markings and printed matter on each map, information is secured regarding observations of the barometer, thermometer, wind velocity, direction of the wind, kind of clouds, and their movements, and the amount of precipitation (rain or snow), in different localities.
Clear, partly cloudy, cloudy, rain or snow indications are symbolized. The shaded area designates places or areas where precipitation has occurred during the preceding twelve hours.
Low barometric pressure, or the storm centers, are indicated on the map by the word “low.” High barometric pressure centers are indicated by the word “high.” Note how they move in an easterly direction; how they are progressive. They can be compared to a series of waves, which we will call atmospheric waves. The crest of the wave may be likened to the “highs” and the troughs to the “lows.”
Usually the winds are southerly or easterly and therefore warmer in advance of a “low.” When the “lows” progress east of a place, the wind generally shifts to westerly and the temperature lowers. The westward advance of the “lows” is preceded by precipitation, and almost always in the form of rain or snow, following which the weather is generally clear. Note how a “low” is followed by a “high,” and so on as they move along eastwardly.
If the Isotherms run nearly parallel, that is, east and west, there will most likely be no change in the temperature. Southerly to east winds prevail west of the nearly north and south line, passing through the middle of a “high” and also east of a like line passing through the middle of a “low.”
To the west of a nearly north and south line passing through the middle of a “low,” northerly to westerly winds prevail. We will find the same condition prevailing to the east of a line passing through the center of a “high.”
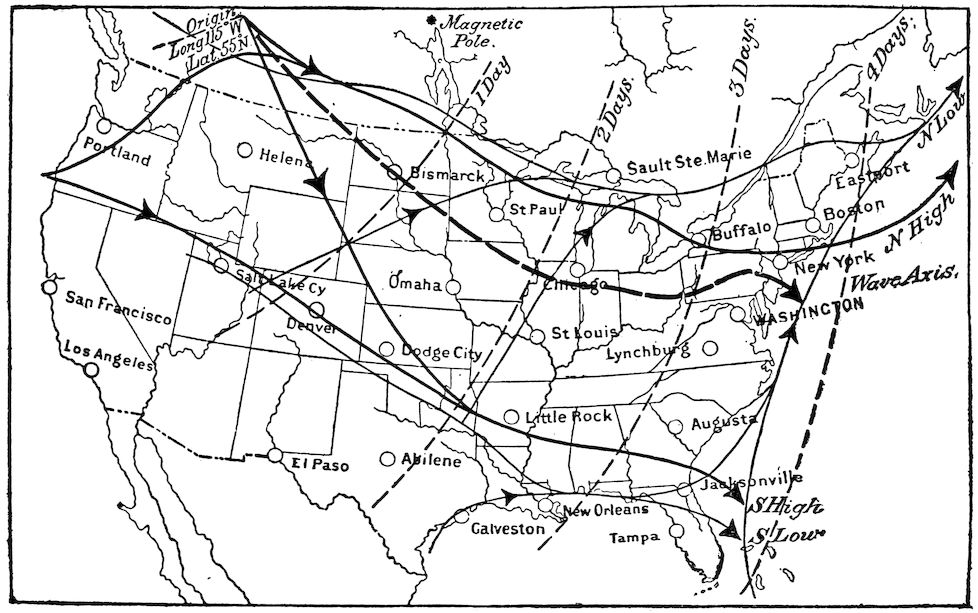
Fig. 55
78When we find an absence of decidedly energetic “lows” and “highs,” this is an indication of the continuance of existing weather. We can expect this state of the atmosphere until later maps show a beginning of a change, usually first appearing in the west.
The storms of the United States follow, however, year after year, a series of tracks, not likely to change suddenly, and not irregular, but related to each other by very well-defined laws.
The United States Weather Bureau has made a very intensive study of the positions of the tracks of the storms. Fig. 55 shows the mean tracks and the movement of storms from day to day. This map indicates that generally there are two sets of lines running west and east, one set over the northwestern boundary, the Lake region, and the St. Lawrence Valley, the other set over the middle Rocky Mountain districts and the Gulf States. Each of these is double, with one for the “highs” and one for the “lows.” Furthermore, there are lines crossing from the main tracks to join them together, showing how storms pass from one to the other. On the chart, the heavy lines all belong to the tracks of the “highs,” and the lighter lines to the track of the “lows.”
A “high” reaching the California coast may cross the mountains near Salt Lake City (follow the track on the map), and then pass directly over the belt of the Gulf States, turning northeastward and reaching the Virginia coast; or it may move farther northward, cross the Rocky Mountains in the State of Washington, up the Columbia River Valley, then turn east, and finally reach the Gulf of St. Lawrence. These tracks are located where they are by the laws of general circulation of the atmosphere and the outline of the North American continent. This movement of the “highs” from the middle Pacific coast to Florida or to the Gulf of St. Lawrence is confined to the summer half of the year, that is, from April to September. In the winter months, on the other hand, the source of the “highs” is different, though they reach the same terminals.
Galileo discovered the principles of the thermometer in 1592. The Grand Duke of Tuscany, Ferdinand II, is given credit for perfecting it in 1610. Athanasius Kircher is given credit for the discovery of the mercurial thermometer. This was about 1641. Ferdinand the II, in 1650 or thereabouts, filled a glass tube with colored alcohol and hermetically sealed it after graduating the tube. Fahrenheit is given credit for the discovery that water freezes always at the same temperature. With these facts he devised a scale for thermometers in 1714.
A temperature of 111° below zero has been recorded at an altitude of 48,700 feet in the United States.
The highest record in the United States Weather Bureau was taken in Death Valley, Cal., on June 30, July 1 and 2, 1891, when the thermometer reached 122° F. Death Valley is also given credit for the highest known monthly temperature, which was 102° F. in the month of July. Arctic expeditions have records of 73° and 66° below zero. This is the greatest natural cold recorded. The average temperature in the United States is 52.4°; the average temperature in England is 50°.
In the interior of Australia a record has been taken of a drop of 60° to 70° in a few hours; whereas the most rapid change recorded in the United States was 60° F. in twenty-four hours. This record has been made twice, in 1880 and again in 1890.
The lowest temperature recorded in the United States Weather Bureau was at Poplar River, Mont., January, 1885, when the thermometer registered 63° below zero.
The estimated heat of the sun is 10,000°; the highest artificial heat obtained is 7,000°. Regarding the heat of the sun, no definite conclusions have been arrived at, so the above temperature is only approximate.
Least relative humidity is found in places southwest of Arizona, where the average is about 40°. Fifty degrees humidity means half 80as much moisture as is necessary for complete saturation. The average in other parts of the country is from 60° to 80°.
Steel boils at 3500°; water boils at 212°; liquid air submitted to a degree of cold where it ceases to be a gas and becomes a solid is 312° below zero. Professor John Dewar of England is credited with some of the most remarkable experiments with low temperature, and at these temperatures made some wonderful discoveries. He went down so cold that he could freeze liquid air back into a solid; he continued further until he reduced hydrogen, a very light gas, to a liquid. This was at 440° below zero. One of the most remarkable things he did was to freeze hydrogen into a solid.
Water boils at 183.2° Fahrenheit on top of Mt. Blanc; water boils at 194° Fahrenheit on top of Mt. Quito.
Torricelli is given credit for the discovery of the principles of the barometer. Otto Von Guericke, of Magdeburg, to whom we are indebted for the air pump, is credited as being the first person to use the barometer as a weather indicator.
Because of the fact that the mercurial barometer is not adaptable for portability, many scientists began work on producing a barometer without fluid that could be easily carried about and would give accurate results. In 1798 M. Comte, professor of aerostatics in the school at Meudon near Paris, invented the aneroid barometer, which he used in his balloon ascents. This instrument has been described fully on page 55.
Lowest reading taken in the United States by the United States Weather Bureau was 28.48, or practically three quarters of a pound per square inch below normal. Altitude records have been taken with the barometer as high as 85,270 feet. This record was made at Uccle Observatory, Belgium, the pressure being 0.67° at this point.
Hail varies from one-tenth inch to more than five inches in diameter.
The following is an extract from the “Memoirs of Benvenuto 81Cellini” of a terrible hail storm in Lyons, France, in 1544: “The hail at length rose to the size of lemons. At about half a mile’s distance all the trees were broken down, and all the cattle were deprived of life; we likewise found a great many shepherds killed, and we saw hailstones which a man would have found it a difficult matter to have grasped in both hands.”
New Hampshire has the record for the largest hailstones seen here so far; they were 4 inches in diameter and weighed 18 ounces, and were 12½ inches in circumferences.
There are records in Japan of where rain has reached 30 inches in twenty-four hours; in India where it has reached 40 inches in twenty-four hours.
The average rainfall in the United States is 35 inches.
There are certain places in India where the yearly rainfall averages over 470 inches; whereas other regions of India show less than 4 inches.
The higher the clouds are in the air, the larger the drops of rain when they reach the earth.
The heaviest annual rainfall recorded any place in the world is on the Khasi Hills in Bengal, where it registered 600 inches. The major part of this was in half of the year.
The greatest amount of rainfall is in the northwestern part of the United States; the least amount is in Arizona, the southwestern part. In some parts of Egypt and Arabia, the only moisture that is received there is in the form of dew.
The average cloudiness of the earth has been estimated between 50 and 55 per cent. This amount slightly exceeds the cloud conditions of the United States.
Unalaska has a record of extreme cloudiness for one whole month, February, 1880.
Sir J. C. Ross, an Arctic explorer, recorded a shower of nearly an hour’s duration on Christmas day, 1839, without a cloud in sight.
A similar record was made on June 30, 1877, at Vevay, Ind., where a shower lasted for five minutes in a cloudless sky.
A fall of yellow snow was recorded at South Bethlehem, Pa., in 1889. Examination showed this coloration to be due to the 82pollen of the pine trees which had been blown into the atmosphere before the fall.
Another record of yellow rainfall was recorded at Lynchburg on March 21, 1879.
Golden snow was recorded at Peckoloh, Germany, in 1877.
Green and red snows have been observed during Arctic explorations, due to a minute organism that was in the atmosphere.
When the temperature of the atmosphere is nearly 32° during a snow storm and the wind is blowing, the flakes being damp and the snowfall heavy, the flakes are apt to unite to form large masses of snow in the atmosphere or air, which accounts for some of the following records:
At Chapston, Wales, in January, 1888, the snowflakes measured 3.6 inches in length and 1.4 inches in breadth, and 1.3 inches in thickness. They amounted to 2½ cubic inches of water when melted.
There are some remarkable instances of where hailstones have cemented together, making large masses of ice. Some remarkable records of this kind have been recorded in India.
In Morganstown, Va., on April 28, 1877, hailstones 2 inches long and 1½ inches in diameter fell.
The mean yearly pressure of the United States ranges between 30 and 30.1 inches when reduced by ordinary methods to sea level.
In Unalaska, January 21, 1879, the barometer reading of 27.70 inches was recorded, and another low reading was made at Stykkisholm of 27.91 inches on February 1, 1877. On September 27, 1880, a ship on the China Sea experienced a terrific typhoon, during which the barometer went down in four hours from 29.64 to 27.04 inches.
The greatest temperature ranges recorded are in the interior of Siberia, where at Yakutsk they recorded a range of 181.4°.
The most remarkable changes recorded within twenty-four hours have been at Fort Maginnis, Mont., January 6, 1886, a fall of 56.40°; at Helena, Mont., January 6, 1886, a fall of 55° in sixteen hours; at Florence, Ariz., June 26, 1881, 65° rise. On the northern edge of the African desert the temperature of the air rose to 127.4°.
The lowest single temperature in the world was recorded at Werchojansk, Siberia, in January, 1885, when it was 90.4° below 83zero, while the average temperature for the month at the same place was 63.9° below zero.
Highest mean rainfall occurs in Sumatra, averaging about 130 inches; the rainfall of 493.2 inches per year occurs at Cherapunji, Assam, India, which is the largest in the world.
The lowest rainfall in the world occurs at Southeast California, West Arizona, and the valley of lower Colorado, where the rainfall averages less than 3 inches.
The most remarkable rainfall recorded in the United States for twenty-four hours occurred at Alexandria, La., June 15, 1886, when the rainfall reached the enormous amount of 21.4 inches. The most remarkable rainfall recorded in the world occurred at Purneah, Bengal, September 13, 1879, when the rainfall reached the unprecedented amount of 35 inches in twenty-four hours.
On August 17, 1876, at Fort Sully, Dakota, occurred one of the heaviest cloudbursts ever known. The water moved out of the canyon on the opposite side of the Missouri in a solid bank three feet deep and 200 feet wide. There are many other remarkable cloudbursts recorded doing great injury, drowning and killing many people.
Among the most remarkable wind velocity records is that of Cape Lookout on October 17, 1879, when the wind blew at a rate of 138 miles an hour.
One of the worst cyclones ever recorded in North America was the flood, as it is usually termed, at Galveston, Tex. This storm began on the 1st day of September, 1900, and lasted until the 12th. It reached its maximum destructive force on the 8th. Six thousand lives were lost and $30,000,000 worth of property was destroyed.
Even worse than any of these was the one at Calcutta in 1864, followed by a storm wave over 16 feet high, causing a death-rate of 45,000 persons.
The blizzard in Dakota of 1873 is one of the worst on record, but probably the most disastrous in the United States occurred in Montana, Dakota, and Texas on January 11, 1888. The loss of life exceeded 100 persons.
The United States is more liable to tornadoes than any other part of the globe. In the United States over 3,000 people have been killed by tornadoes and thousands more have been injured. The greatest loss of lives recorded by tornadoes was at Adams City, Miss., on June 16, 1842, when 500 lives were lost.
The most remarkable hail storm was that of July 13, 1788, through France to Belgium, and did a property damage of over five million dollars.
There have been many destructive hailstorms in the United States. One on July 6, 1878, at central New York extended into parts of Massachusetts, Rhode Island and Connecticut. Stones fell recorded to measure 7 inches in diameter.
Benjamin Franklin has been given credit for the discovery that storms have a rotary motion, and that they move from west to east. This discovery was made in 1747.
Franklin did not positively prove these facts, and it remained for Redfield, Espy, Maury, Abbe to substantiate the truth of this statement.
The first United States Weather Bureau was established in 1870. General Albert J. Myer was the first chief of the United States Weather Bureau.
It is estimated that we are 250,000 miles from the moon.
At high altitudes, the cover of a kettle must be weighted down in order to boil an egg hard. This is to enable the pressure of steam to allow temperature high enough for boiling. In other words, it would be impossible to boil an egg in an open vessel at a high altitude.
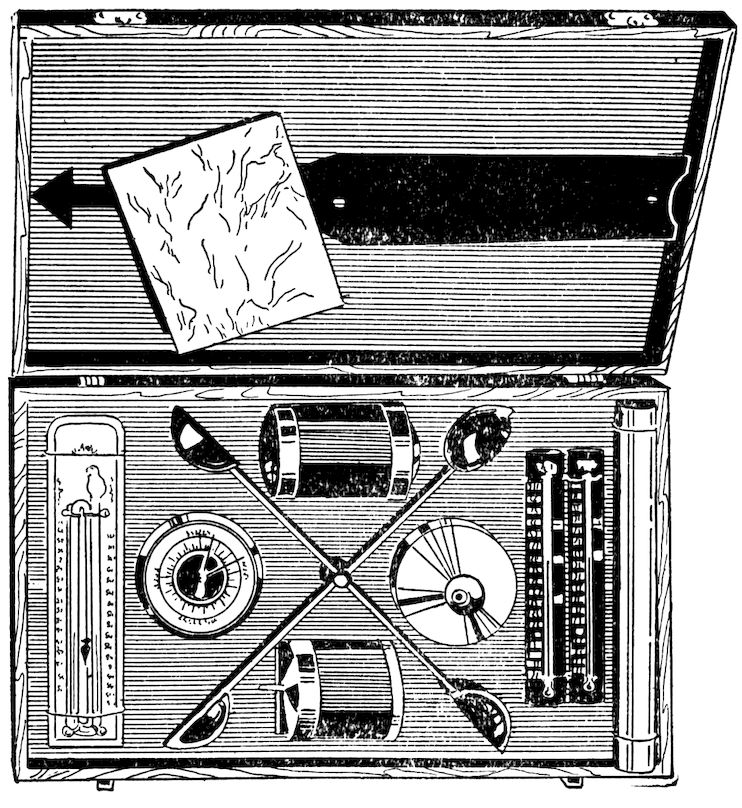
You do not like your ball game or picnic postponed just because of rain, do you? You want a bright day for that event. Then don’t guess what the weather will be on a certain day—know. Learn to use the
to read weather indications from instruments set up by yourself—in your own home. This is an outfit you will like immensely. Made specially for your use and to provide you with a new kind of play.
The fun you get in making records of changes in temperature, in humidity, and in making forecasts will surely be great. Your boy friends will listen to you with interest when you explain to them the cause of storms and how important it is to have a knowledge of climatic disturbances. The outfits contain all the necessary equipment and a big book on weather, telling you how to know when it’s going to storm and many other interesting things. Your dealer will show you the Gilbert Weather Bureau Sets. If he hasn’t them, write
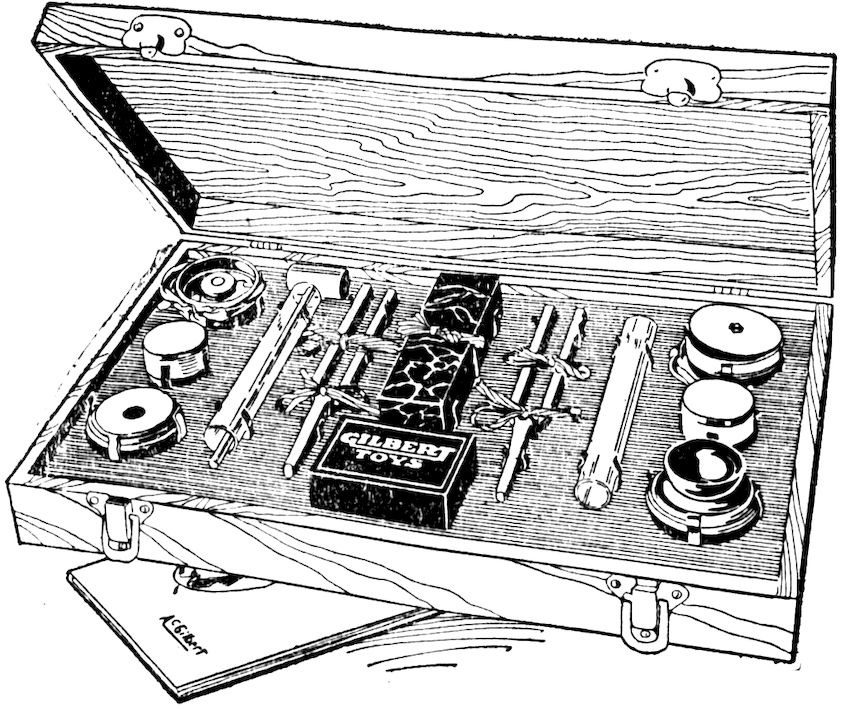
Do you know that hearing is just feeling with the ear? That in reality, the thing we call sound, which we think of as a noise or as a musical note, is just an impression on the brain? Very few boys know this, and if you would like to be one of the few that do, you surely want an outfit of
With one of these outfits you can find out just what sound is—how it is produced—why some pianos sound better than others—why a violin produces a musical tone, and many other things, including a number of startling table rapping tricks with which you can astonish your friends. A big book of instructions tells you how to perform every experiment. Get one of these outfits today. The best toy dealer in your town should have it; if not, write us and we’ll tell you where you can get it.
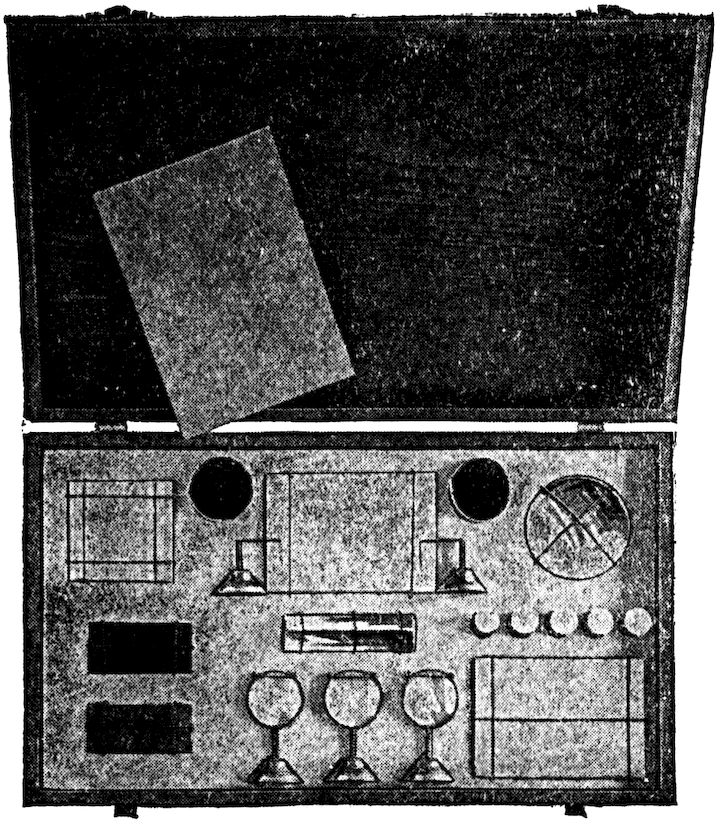
A knock on the head with a hatchet or a stab with a knife doesn’t sound pleasant, but you’ll enjoy apparent treatment of this kind and so will your friends who watch your shadow show. Make your boy friend rise in the air—change him into a bird or a cat—create freakish images. It’s easy! And laugh—your audience sure will enjoy it because it’s new—nothing like it. An entertainment made for boys who want real fun. But that’s only a few of the many things you can do with
One of these outfits will help you to understand a great many facts about light. You can perform a number of experiments which explain the laws of light. Learn about the movie machine, the telescope and other optical instruments. There’s a big book on Light with each set, it’s a handy size, just right to put in your pocket.
From this book and your set you’ll get a knowledge of light that will be helpful to you always. It’s great fun too, the kind you like. The outfit is complete with prisms, mirrors and all the apparatus you’ll need to perform the experiments.
Think of it! “Football Strategy,” by Walter Camp—“How to Pole Vault,” by Former World’s Champion, A. C. Gilbert—“Flying,” by Eddie Rickenbacker, and “Athletic Training,” by the famous Yale trainer, Johnny Mack. Chapters about signalling, wireless, wonderful heat, sound and light experiments, how to build a real weather bureau station of your own, chemistry for boys, electrical, hydraulic and pneumatic engineering and surveying, practical carpentry—all in one finely illustrated book. It’s yours for a quarter and worth dollars to you.