The Project Gutenberg EBook of The Nile in 1904, by William Willcocks

This eBook is for the use of anyone anywhere in the United States and
most other parts of the world at no cost and with almost no restrictions
whatsoever.  You may copy it, give it away or re-use it under the terms
of the Project Gutenberg License included with this eBook or online at
www.gutenberg.org.  If you are not located in the United States, you'll
have to check the laws of the country where you are located before using
this ebook.


Title: The Nile in 1904

Author: William Willcocks

Release Date: June 23, 2018 [EBook #57379]

Language: English

Character set encoding: ISO-8859-1

*** START OF THIS PROJECT GUTENBERG EBOOK THE NILE IN 1904 ***


Produced by Chris Curnow, Harry Lamé and the Online
Distributed Proofreading Team at http://www.pgdp.net (This
file was produced from images generously made available
by The Internet Archive)
Please see the Transcriber’s Notes at the end of this text.
BY
Sir WILLIAM WILLCOCKS, K.C.M.G., F.R.G.S.
LONDON
E. & F. N. SPON Limited, 57 Haymarket.
NEW YORK
SPON & CHAMBERLAIN, 123 Liberty Street.
Price 9s/- net.
Printed at the National Printing Department of Egypt, Cairo
1904.
[3]
Dedicated to my old Chief and Master in Irrigation, Sir Colin Scott-Moncrieff, K.C.S.I., K.C.M.G., under whom I had the privilege of working for 20 years in India and Egypt.
[5]
The publication of Sir William Garstin’s monumental work on the “Basin of the Upper Nile” is an event of such importance in the history of the Nile that the occasion should not be lost of bringing Lombardini’s work on the Nile to date. The information utilised by me in this book as far as the Upper Nile is concerned is obtained from Sir William’s Report; for the Blue Nile and Atbara I am indebted to M. Dupuis’ interesting appendix at the end of Sir William’s Report; and for the river north of Khartum to my own studies and surveys. As Sir William employed Capt. H.G. Lyons, R.E. to collaborate with him, the references to the works of previous writers and geographical details may be accepted without any misgivings. To M. Chélu Bey, Director of the Government Press, I am indebted for his ever ready aid; to Mr. Hansard of the Survey Department for the plates accompanying this work; and to Mr H.G.F. Beadnell, F.G.S, F.R.G.S, for having kindly written the description of the Egyptian oases and the geology of Egypt which form the fifth chapter of this book.
W. Willcocks.
Cairo, 12-10, 1904.
[6]
[7]
| Chapter I. The Nile—(Page 11). | |
| 1. | Introduction. |
| 2. | Nomenclature. |
| 3. | Description of the course of the Nile. |
| 4. | Slopes and velocities of the Nile in its different reaches. |
| 5. | Catchment basins of the Nile and its tributaries. |
| 6. | The climate of the Nile valley. |
| 7. | The geology of the Nile valley. |
| 8. | The discharges of the Nile and its tributaries. |
| Chapter II. The tributaries of the Nile—(Page 26). | |
| 9. | Lake Victoria Nyanza. |
| 10. | The Victoria Nile. |
| 11. | The Semliki river. |
| 12. | Lake Albert Nyanza. |
| 13. | The Albert Nile. |
| 14. | The Gazelle river. |
| 15. | The Zeraf river. |
| 16. | The Sobat river. |
| 17. | The Sudd region. |
| 18. | The White Nile. |
| 19. | The Blue Nile. |
| 20. | The Atbara. |
| 21. | The Nile from Khartoum to Assuân. |
| 22. | The Nile from Assuân to the Barrage. |
| 23. | The Rosetta and Damietta Branches. |
| Chapter III. The utilisation of the Nile—(Page 56).[8] | |
| 24. | The Nile in flood. |
| 25. | The Nile in low supply. |
| 26. | Nile water. |
| 27. | The soil of the Nile Valley. |
| 28. | Basin irrigation. |
| 29. | Perennial irrigation. |
| 30. | Flood protection. |
| Chapter IV. Projects—(Page 73). | |
| 31. | Projects. |
| 32. | The raising of the Assuân dam. |
| 33. | The Wady Rayan reservoir and escape. |
| 34. | The Albert Lake and Nile project. |
| 35. | Flood protection for Egypt. |
| 36. | Complete project for water storage and flood control. |
| 37. | Sir William Garstin’s projects. |
| 38. | The conversion of basin to perennial irrigation. |
| 39. | Development of the Sudan. |
| Chapter V. The oases and the geology of Egypt by H.J.L. Beadnell, F.G.S., F.R.G.S.—(Page 107). | |
| 40. | The oases. |
| 41. | Dakhla oasis. |
| 42. | Kharga oasis. |
| 43. | Baharia oasis. |
| 44. | Farafra oasis. |
| 45. | The geology of Egypt. |
| 46. | Igneous rocks. |
| 47. | Sedimentary rocks. |
| 48. | Upper cretaceous. |
| 49. | Eocene. |
| 50. | Oligocene and Miocene. |
| 51. | Pliocene, Pleistocene and Recent. |
| 52. | Economic products. |
| Table of Appendices (Page 117). | |
| Index (Page 221). | |
[9]
| Page. | ||
| I. | Plan of the Nile Valley | 12 |
| II. | Longitudinal Section of the Nile Valley | 14 |
| III. | Outlet of Lake Victoria | 26 |
| IV. | Cross sections of the Nile and its tributaries (1) | 28 |
| V. | Gauge diagrams of Lakes Victoria and Albert | 30 |
| VI. | The Sudd region | 34 |
| VII. | Outlet of Tsana Lake | 44 |
| VIII. | Gauge diagrams of the White and Blue Niles at Khartoum | 46 |
| IX. | Cross sections of the Nile and its tributaries (2) | 42 |
| X. | Longitudinal section of the Nile: Wady Halfa to Assuân | 48 |
| XI. | Cross sections of the Nile and its tributaries (3) | 52 |
| XII. | Longitudinal section of the Nile: Assuân to Cairo | 50 |
| XIII. | Typical cross sections of the Nile Valley | 50 |
| XIV. | Plan of typical basin irrigation in Egypt | 66 |
| XV. | Plan of the Fayoum and the Wady Rayan | 76 |
| XVI. | Longitudinal section of the Fayoum and the Wady Rayan | 80 |
| XVII. | Longitudinal section of the Rosetta Branch | 54 |
| XVIII. | Longitudinal section of the Damietta Branch | 54 |
| XIX. | Plan of typical perennial irrigation in Egypt | 68 |
| XX. | Possible tunnel at Lake Tsana | 103 |
| XXI. | The Egyptian oases | 108 |
[10]
[11]
THE NILE IN 1904.
—In the introduction to his brilliant essay on the Hydrology of the Nile[1], an essay, which, though written in 1865, foreshadowed much of what we know to day, Lombardini remarked, with much truth that, no river in the world lends itself to hydrological studies on so majestic a scale as the Nile. The most interesting river of the ancient world, it is still the most interesting river of our time; and, in spite of all that ancient and modern discoveries have unfolded, its discharges are to-day more difficult to unravel and weave together than those of any other stream in either hemisphere. These discharges are still a mystery, and it will need years and years of patient observation and study, at the hands of the Sudan Irrigation Department, to enable us to state with exactitude why its floods rise and fall with such regular and stately precision, why they are never sudden and abrupt, and why its summer supplies can never be completely cut off even in their traverse of over 3000 kilometres through the burning and parched Sahara. Though the mystery of the Nile is far from being solved to-day, still an enormous step in advance has been made by the publication of Sir William Garstin’s Report on the Basin of the Upper Nile[2]. This Report not only contains the results of three years’ observations of the Egyptian Survey Department in the Sudan, of Sir William Garstin’s own observations and studies, but also a mass of information of the Nile and its tributaries collected by Capt. H. G. Lyons. R. E., through four years of uninterrupted study. Those who know the intelligence and method with which Capt. Lyons works, will rate this information at its proper value.
[1] Saggio idrolico sul Nilo, by Elia Lombardini, Milan 1865.
[2] Report on the Basin of the Upper Nile by Sir William Garstin. Blue Book Egypt (2) 1904.
Lombardini gathered together all the information available at the time that Sir Samuel Baker announced the existence of the Albert Nyanza shortly after Speke and Grant had proclaimed to the world that the Victoria Nyanza was the true source of the Nile. From the[12] information then available he deduced the laws and operations of the great river. About twenty years later, just before the rebellion in the Sudan closed the Nile to the civilized world, a German savant, Joseph Chavanne[3], in his book on the rivers of Africa, collected and tabulated on clear and methodical lines much of the information available in 1883. Though many of his facts are erroneous, his method is clear and his ideas just. Sir William Garstin, in his Report, has developed the information at his disposal on such practical lines as are needed to study the question of insuring an abundant supply of water to the Nile in Egypt during the times of low supply.
[3] “Afrikas Ströme und Flüsse” by Joseph Chavanne. Wien 1883.
Having myself studied the Nile for fifteen years in order to solve the problems of water storage and flood control on the Nile, and having devoted the whole of my life to this very science of Hydraulics, I have been encouraged to attempt the continuation of Lombardini’s work; and, to the utmost of my ability, to bring it to the level of the knowledge of our day.
—The nomenclature of the tributaries of the Nile is difficult to follow. In this book I shall call the river the Victoria Nile from Lake Victoria to Lake Albert; the Albert Nile from Lake Albert to the Sobat mouth (this reach is known generally as the Bahr el Gebel); the White Nile from the Sobat mouth to Khartoum; and the Nile from Khartoum to the sea. The Blue Nile stretches from Lake Tsana in Abyssinia to Khartoum.
—Chapters II and III contain detailed descriptions of the Nile and its main tributaries, and this paragraph is a short epitome of what is written there about the course of the Nile. The Nile drains nearly the whole of north-eastern Africa, an area comprising 3 million square kilometres. Its main tributary, the White Nile, has its furthest sources in south latitude 4°, near Lake Tanganyika. Known as the Kagera, it is one of the feeders of Lake Victoria, and has a course of 600 kilometres before it reaches the lake. Lake Victoria, covering 60,000 square kilometres, is the first reservoir of the Nile. The Victoria Nile leaves Lake Victoria by the Ripon Falls and after a course of 400 kilometres enters Lake Albert at its northern corner. At its southern end Lake Albert is fed by the Semliki river which has its sources in Lake Edward. Its own area is 4,500 square kilometres. The Albert Nile leaves Lake Albert at its northern end and has a course of 1280 kilometres to the mouth of the Sobat river. Of this length, the first 200 kilometres up to Dufile have scarcely any slope, the next 150 kilometres are down a series of severe cataracts. From the foot of these cataracts to its tail the Albert Nile has a gentle slope and traverses the Sudd region where the bed of the stream is often barred by blocks of living vegetation. In this latter region the stream divides into two, of which the right hand one is known as the Bahr Zeraf. After a course of 270 kilometres the Bahr Zeraf joins the Albert Nile again. In the interval the Albert Nile receives as a left-hand feeder the Bahr Gazelle. The Sobat river has its sources in Gallaland and joins the Albert Nile at the termination of the Sudd region. From the junction of the Albert Nile and the Sobat, the river is known as the White Nile, which, after a course of 840 kilometres, with an exceedingly gentle slope, joins the Blue Nile at Khartoum.
[13]
The Blue Nile is the true parent of the land of Egypt. The deposits of its muddy waters have made Egypt. The Atbara has added its quota, but the Blue Nile is incomparably the chief contributor; fed by the timely and plentiful rains of southern and south-eastern Abyssinia, it contributes 65 per cent of the waters which pass Assuân. The furthest sources are those of the Abai, which, after a course of 110 kilometres falls into Lake Tsana. This lake has an area of 3,000 square kilometres and lies about 1,760 metres above sea level. The Blue Nile leaves it at its south-eastern corner and hurries down to the Sudan, fed by numerous Abyssinian rivers. At Rosaires, after a course of 750 kilometres, it has fallen 1,260 metres; and below the Rosaires cataract enters the plain country south of Khartoum. For its remaining 615 kilometres on to Khartoum, where it meets the White Nile, it is navigable for the greater part of the year. North of Sennaar it is fed by the Dinder and Rahad rivers.
Between Khartoum and El Damer, on a length of 320 kilometres, the Nile has its even passage broken by the 6th cataract at Shabluka. At El Damer the Nile receives the Atbara as a right hand tributary.
The Atbara is a very muddy torrent fed by the rains of north-eastern Abyssinia. It runs for 4 months per annum and is dry for 8 months. Rising within a few kilometres of Lake Tsana, it falls 1500 metres in its first 300 kilometres, and is then joined by the Salaama, and, 100 kilometres lower down, by the Settit river. After the junction with the Settit, the Atbara flows for 480 kilometres and joins the Nile at El Damer, contributing a fair quantity of water and a very considerable quantity of Nile mud to the river.
[14]
From the Atbara junction to the sea, the Nile has a course of 2,700 kilometres. In its first length of 1480 kilometres to Assuân it traverses the 5th and 4th cataracts between Berber and Dongola, the 3rd and 2nd cataracts between Dongola and Wady Halfa, and the 1st cataract at Assuân. All these cataracts are navigable in flood, but not so in summer. From Assuân to the Barrage at the head of the Delta north of Cairo, the Nile has a length of 970 kilometres and traverses Egypt without a cataract or interruption of any kind. At the Barrage, the Nile divides into the Rosetta and Damietta branches, and after a further course of about 240 kilometres in either branch, flows into the Mediterranean sea. Its greatest length from the sources of the Kagera river to the sea is 6350 kilometres, constituting it one of the longest rivers in the world.
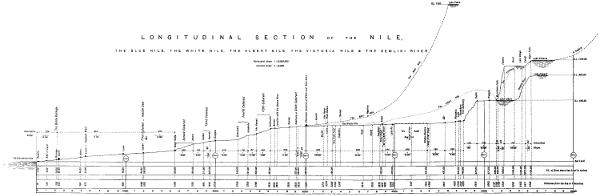
—Table 2 of Appendix B and Plate II comprise all the information available under this head which I have been able to collect. For the slopes I have adopted the following data:
| R. L. of | Lake Victoria | 1129 | metres | above mean sea |
| „ | Fowera | 1060 | „ | „ |
| „ | Lake Albert | 680 | „ | „ |
| „ | Khartoum (flood) | 389 | „ | „ |
From Khartoum to Wady Halfa I have adopted the generally accepted levels of the original Soudan railway survey. From Wady Halfa to the sea I have levelled myself. Upstream and downstream from the adopted levels I have carried the levels by the aid of slopes calculated from velocity and hydraulic mean depth data. It seems to me absurd to adopt a level for Lake Choga 50 metres above that for Fowera, and then to add, that in the 140 kilometres between the two places the Victoria Nile has a gentle slope, wide bed and gentle velocity. By a strange fatality, this very error has crept into the figures under Lake Choga on Plate II. The error is noted in the corrigenda attached to the Plate. The Section is drawn correctly but these wrong figures have been interpolated by an oversight.
The Victoria Nile Falls 450 metres in 400 kilometres, but has four reaches; the first 1⁄1200, the second 1⁄20000, the third 1⁄180 past the Murchison Falls, and the fourth 1⁄10000.
The Albert Nile falls 277 metres in 1290 kilometres. The first reach past Wadelai has a slope of 1⁄25000, the second over the Fola and following cataracts has a slope of 1⁄700, the third 1⁄12000, the fourth 1⁄20000, the fifth 1⁄25000, and the last below lake No of 1⁄75000 in flood.
PLATE II.
Lith. Sur. Dep. Cairo.
Larger illustration (180 kB)
ERRATUM.
Erase the two figures under Lake
Choga in the “Height” column.
LONGITUDINAL SECTION of the NILE,
THE BLUE NILE, THE WHITE NILE, THE ALBERT NILE, THE VICTORIA NILE & THE SEMLIKI RIVER
[15]
The White Nile falls 14 metres in 840 kilometres and has two slopes in flood; 1⁄50000 in its upper reach, and then 1⁄100000.
The Blue Nile falls 1370 metres in 1370 kilometres, which may roughly be divided into three reaches. The first from Lake Tsana to Rosaires on a length of 750 kilometres 1⁄600, the second Rosaires to Sennaar 1⁄4500, and the third 1⁄7000. These are very approximate indeed.
The Atbara falls 1640 metres in 880 kilometres. In the first 300 kilometres the slope is 1⁄200; in the next 300 kilometres the slope is 1⁄2500, and in the last reach of 280 kilometres it is 1⁄6000. These are approximate.
The Main Nile from Khartoum to Assuan falls 295 metres in 1810 kilometres; the so-called six cataracts occupy 565 kilometres with a slope of 1⁄3000; and the ordinary channel occupies 1245 kilometres and has a slope of 1⁄12000. From Assuân to the Barrage, on a length of 970 kilometres, the Nile falls 76 metres with a mean slope of 1⁄13000. The Rosetta and Damietta branches are each about 240 kilometres long and have a slope in flood of 1⁄13000, and of 1⁄12500 in extraordinarily high floods.
From the sources of the Kagera river to the sea, on a length of 6350 kilometres, the Nile falls 2000 metres, or has a slope of 1⁄3200. From Lake Victoria to the sea the length is 5535 kilometres and the fall 1129 metres, or the slope is 1⁄5000.
Table III of Appendix C. gives the velocities of the river in flood and low supply, in metres per second and kilometres per day, and also the time occupied in traversing the different reaches. There are two breaks. The first is at Lake Choga and the second is at Lake Albert. As the Victoria Nile traverses the eastern arm of the many-armed and peculiar Lake Choga with a perceptible current, and as, moreover, the lake is very shallow, we may give some figure to the velocity and make it half that of the Bahr Gazelle which is ·20 metres per second and is considered perceptible. With a velocity of ·10 metres per second or 8 kilometres per day, the 80 kilometres of the lake would be traversed in 10 days. The time of traverse from Lake Victoria to Lake Albert would be 15 days. With Lake Albert it is very different. A reference to Plate V will show that it takes the Victoria Nile 5 months to fill up Lake Albert before the Albert Nile can carry off the waters of the Victoria Nile, gauge for gauge. Under these conditions it will be wise to stop at Lake Albert and begin a new calculation from this lake.
The Albert Nile takes 22 days in flood and 25 days in low supply to traverse the distance from Lake Albert to the Sobat mouth. The White Nile takes 21 days in flood and 28 days in low supply to reach Khartoum.[16] Consequently from Lake Albert to Khartoum we have 43 days in flood and 53 days in low supply.
From Khartoum to Assuân the Nile takes 11 days in flood and 22 days in low supply, and consequently from Lake Albert to Assuân we have 54 days in flood and 75 days in low supply.
From Assuân to Cairo we have 6 days in flood and 12 days in low supply.
Table III is very interesting and well worth study. Through the Sudd region we have a velocity of ·6 metres per second, but only of ·35 metres per second in the White Nile. In Egypt the Nile in flood has a velocity of 1·75 metres per second, and in low supply of ·85 metres per second.
—Table I, of Appendix A gives the areas of the catchment basins of the Nile. The total area according to the table is 3,007,000 square kilometres. The limits of the basin are depicted on Plate I, and, with rare exceptions, they are now fairly well known everywhere. North of the 20th parallel of latitude the watershed on the west of the Nile is not far removed from the edge of the plateau skirting the Nile valley. The plateau falls away to the west, and occasional ravines find their way to the Nile down the reverse slope. On the east of the Nile the crest of the hills skirting the Red sea is the watershed. South of the 20th parallel of latitude the eastern watershed follows the crest of the hills on the west of the Red sea as far as Suakin. South of Suakin the watershed leaves the Red sea, to allow the Khor Barraka to flow into this sea. From the south east of Kassala, round by Addis Ababa, the watershed follows the crest of the high hills forming the eastern backbone of Abyssinia, and dividing the waters of the Nile from those flowing into the Indian Ocean. South west of Abyssinia the watershed travels in a south-westerly direction to the east of Gondokoro, and divides the Sobat from the rivers draining into Lake Rudolf. The watershed then moves due south to the western escarpment east of Lake Victoria. Mounts Kenia and Kilmanjaro are not within the basin of the Nile. Sweeping in a rough curve round Lake Victoria and nearly touching Lake Tangangyika in 4° south latitude, the watershed keeps close to the western shores of Lakes Edward and Albert to nearly opposite Wadelai. All the slopes of the Ruenzori mountains drain into the Nile.
From near Wadelai the watershed moves in a north-westerly direction along the hills dividing the waters of the tributaries of the Gazelle river from the Welle. Due west of the Sudd region the watershed has[17] reached its most westerly position and from there turns northwards along the Marrah hills in Darfur, dividing the scanty waters of the Bahr-el-Arab and its tributaries from the rivers draining into Lake Chad. From the Marrah hills the watershed travels in a north-easterly direction to a point close to the Nile on the 20th parallel of latitude near Hannek.
Of the lands enclosed within this watershed, all that are drained directly into the Main Nile are desert. There are occasional showers, and some of the valleys and ravines carry water for a few hours every year, others every second, third or fourth year, but they contribute practically nothing to the volume of the Nile. The rains generally come in the winter when the Nile is falling every day, and the steady fall of the Nile is never arrested by the waters of any or all of these watercourses. The country west of the White Nile past Kordofan and Darfur to the Marrah hills is steppe land producing scanty grasses and forests of low accacias in the south, and rising to a general height of about 600 metres at the Marrah hills. The lands drained by the Gazelle river and the Albert Nile north of Gondokoro are flat plains or swamps in the north and east, and wooded and broken ground in the west and south-west, where the tributaries of the Gazelle river rise in the Blue mountains at a general height of 1500 metres. The upper waters of the Sobat and its tributaries drain the well wooded and cultivated mountain masses of Gallaland and then traverse the marshes and flat lands which lie east of the Sudd region. The Blue Nile and its upper tributaries drain the choicest portions of the high Abyssinian mountain plateau lying over 2000 metres above sea level, and rising in places to 2500 metres and upwards. The lower courses of the Blue Nile, the Rahad and the Dinder are through the black cotton soil plains of the eastern Sudan, which are either wooded or covered with dense grass in the south. The Atbara and its tributaries in their upper courses drain the northern slopes of the Abyssinian plateau, and traverse the level plains of the eastern Sudan in a direction parallel to the Blue Nile.
The Albert Nile and its tributaries between Gondokoro and Lake Albert traverse the broken and hilly country which is cut through by the Albert Nile at the Fola and succeeding rapids. The catchment basins of Lakes Victoria and Albert are the undulating hills, the flat marshy valleys, the great lakes and, in parts, high hills which constitute[18] the highlands of Central Africa. The general level of the area may be taken as 1400 metres above sea level.
The area draining into Lake Victoria is 240,000 square kilometres. At the outlet of Lake Albert this has increased to 380,000, and at Gondokoro to 470,000. The Gazelle river drains 470,000 square kilometres, and the Sobat 160,000. The White Nile drains altogether 1,690,000 square kilometres, or more than half the total area of the catchment basin of the Nile. The Blue Nile drains 300,000 square kilometres and the Atbara 240,000. The Nile below the Atbara junction is draining 2,290,000 square kilometres. Between the Atbara mouth and the sea, the Nile drains whatever falls on a desert area of 720,000 square kilometres.
If we take 3,000 cubic metres per second as the average annual flow past Assuân we may say that the White Nile supplies 24% off more than half the area of the whole basin, the Blue Nile 65% off 1⁄10 the area, and the Atbara 11 % off 1⁄12 the area. The Gazelle river drains about 1⁄6 the total area and adds practically nothing to the discharge. Table 24 should be very carefully studied by any man who wants to understand the Nile. It does not pretend to exactitude, but embodies the best information I have been able to obtain.
—This paragraph would have been much more complete if Capt. Lyons’ monograph on the Meteorology of the Nile valley had been published. In considering the climate I shall follow the subdivisions of the catchment basin of the Nile contained in Table I.
In the catchment basins of Lakes Victoria and Albert, the mean annual rainfall may be taken as 1.25 metres, with great fluctuations between good and bad years. Neglecting here and through this paragraph, the light occasional falls of rain which are trying to travellers but which have no effect on the rivers, it may be said that in these basins there are two rainy seasons, the greater in March, April and May, and the lesser in October, November and December. The former are followed by dry southern winds, while north winds blow in the winter.
Along the whole of the Albert Nile, the mean annual rainfall may be taken as 1 metre, with severe famines in occasional years and heavy rainfall in others. The principal rains are between May and November, with the maximum between August 15 and September 15. In years of deficient rainfall, the June, July and August rains seem[19] to fail. The catchment basin of the Gazelle river may be credited with a mean annual rainfall of 75 centimetres between May and October, while the mean annual rainfall on the Arab river cannot be more than 30 centimetres between June and September. The Sobat river in its upper reaches enjoys an annual rainfall of about 1.25 metres and of ·75 metres in its lower reaches. The time of rain is between March and September. The lands draining into the White Nile north of Tewfikieh have an annual rainfall of about 20 centimetres between June and September.
The Abyssinian part of the catchment basin of the Blue Nile enjoys a good rainfall throughout nine months of the year from February to October, with generally heavy rain between May and September, and very occasionally in October. The rainfall here may be taken as 1.25 metres per annum. In the plains of the eastern Sudan traversed by the lower reaches of the Blue Nile and the Atbara the rainfall is very much lighter and may be considered as 30 centimetres between July and September; fairly constant and heavier in the south, and very inconstant and lighter in the north. The Atbara and its tributaries in their upper reaches on the northern slopes of Abyssinia, have rain from May to the end of August and occasionally into September. There are great fluctuations in the rainfall. The mean annual rainfall may be taken as 75 centimetres.
The desert area between Khartoum and Cairo has occasional winter rains especially in the parts near the Red sea, but as these rains are nearly all soaked up by the desert, and very little, here and there, reaches the Nile, we may neglect them altogether. Railways have to be provided with culverts and bridges where they cross the terminal reaches of the khors and wadis which run considerable bodies of water for a few hours after rain; but the effect on the Nile is practically nothing. Along the sea-board of the Mediterranean there are a few inches of rain every winter, sufficient as a rule to raise poor crops of barley.
In the catchment basins of Lakes Victoria and Albert the direction of the winds may be taken as north-east in winter and south-east in summer. The maximum monthly temperature may be taken as 35° and the minimum as 12°, with a mean for the year of 21°.
Along the Albert Nile the north wind blows through the winter, and southerly winds prevail from about the 15th of April to October. The temperature may be taken as ranging from a monthly maximum of 38° to a monthly minimum of 16°, with a mean of 27°.
[20]
Tables 75 to 81 give the principal meteorological data for many places in the Nile valley and compare the Bombay rainfall with the Assuân gauges. The latter show how closely the Assuân gauge in flood follows the rainfall at Bombay.
At Addis Ababa in the highlands of Abyssinia, the mean monthly temperature ranges between 19° and 15°, with a mean of 17°. The winds are south-east and east through the year. In 1902 the rainfall was 980 millimetres, and in 1903 it was 1340 millimetres. (Table 75).
At Wad Medani in the Grezireh south of Khartoum, the mean monthly temperature ranges between 35° and 24°, with a mean of 30°. The winds from October to April are from the north and from May to September from the south. In 1902 there were 350 millimetres of rain and in 1903 there were 310. (Table 76).
At Khartoum the mean monthly temperature ranges between 34° and 19°, with a mean of 28°. The winds from October to April are from the north and from May to September from the south. In 1902 there were 120 millimetres of rain and in 1903 there were 70. (Table 77).
For Alexandria, Cairo and Assuân, representing the Nile valley in Egypt, I have prepared the following table:—
| Month | ALEXANDRIA | CAIRO | ASSUAN | |||||||||
|---|---|---|---|---|---|---|---|---|---|---|---|---|
| THERMOMETER Centigrade. |
Rain- fall. |
THERMOMETER Centigrade. |
Rain- fall. |
THERMOMETER Centigrade. |
Rain- fall. |
|||||||
| Max. | Min. | Mean | Max. | Min. | Mean | Max. | Min. | Mean | ||||
| MILL. | MILL. | MILL. | ||||||||||
| January | 25·0 | 5·4 | 24·1 | 54 | 26·6 | -0·7 | 12·4 | 6 | 32·5 | 4·0 | 14·8 | .. |
| February | 29·7 | 6·2 | 14·8 | 22 | 35·3 | 1·2 | 14·2 | 3 | 37·0 | 5·0 | 22·0 | .. |
| March | 37·0 | 5·5 | 16·1 | 17 | 41·2 | 3·2 | 16·9 | 5 | 42·0 | 8·0 | 24·3 | .. |
| April | 38·9 | 11·0 | 18·5 | 2 | 42·6 | 5·7 | 20·9 | 2 | 46·6 | 11·0 | 27·3 | .. |
| May | 38·9 | 13·3 | 21·3 | 13 | 44·2 | 9·0 | 24·4 | 2 | 46·0 | 17·0 | 29·6 | .. |
| June | 39·4 | 13·8 | 24·0 | .. | 45·2 | 13·7 | 27·3 | .. | 47·0 | 20·0 | 34·2 | .. |
| July | 37·0 | 20·5 | 26·1 | .. | 44·3 | 17·4 | 28·5 | .. | 46·0 | 23·0 | 33·6 | .. |
| August | 35·0 | 20·3 | 26·6 | .. | 41·6 | 16·5 | 27·7 | .. | 46·0 | 21·0 | 35·1 | .. |
| September | 40·0 | 18·7 | 25·6 | .. | 40·6 | 14·0 | 25·3 | .. | 47·0 | 17·0 | 31·0 | .. |
| October | 37·8 | 15·0 | 23·7 | 9 | 42·1 | 12·1 | 23·2 | 1 | 42·0 | 18·0 | 28·7 | .. |
| November | 32·2 | 10·8 | 20·0 | 38 | 33·6 | 3·5 | 18·1 | 6 | 40·0 | 11·0 | 23·1 | .. |
| December | 28·9 | 6·8 | 16·0 | 80 | 29·4 | 1·3 | 14·4 | 6 | 34·0 | 6·0 | 19·0 | .. |
| Year | 40·0 | 5·5 | 20·6 | 235 | 45·2 | -0·7 | 21·1 | 31 | 47·0 | 4·0 | 26·9 | 0 |
From the above table we may conclude that at Alexandria, Cairo and Assuân the absolute maximum thermometers may be taken[21] as 40°, 45° and 47° Centigrade; or 104°, 113°, 116°, Farenheit. The minimum thermometers as 5·5°, -0·7°, 4·0° Centigrade; or 42°, 31°, 39° Farenheit. The rainfall at Alexandria, Cairo and Assuân respectively may be taken as 235, 31, and 0 millimetres; or 9, 11⁄4, and 0 inches. The heaviest rainfall in any individual year at Alexandria and Cairo respectively has been 308 and 55 millimetres; or 12 and 2 inches. The lightest rainfall at Alexandria and Cairo respectively in any individual year has been 108 and 7 millimetres; or 41⁄4 and 1⁄4 inches. Assuân is practically rainless. It does rain sometimes at Assuân, but there has been no rain during the last three years while meteorological observations have been taken.
—South of Gondokoro along the Victoria and Albert Niles, and at the lakes, the rocks are generally granites, crystalline schists and quartzites. The hills of Uganda are covered with red clay and marl on the higher lands, while the valleys consist of a rich black loam. All the cataracts are granites and granitic rocks or diorites. The Ruenzori range consists of lofty volcanoes. The surface of the ground is covered with a fine Kankar (nodulated limestone) in many places. North of Gondokoro the plains are formed of sandy deposits mixed with coarse peat in places. The hills of the Bahr-el-Gazelle and Arab river are all crystalline. Abyssinia is a volcanic plateau. It is the detritus of this rich volcanic soil swept down by the Blue Nile and Atbara which constitutes the richness of the soil of Egypt and of the water of the Nile. Those parts of the eastern Sudan south of Khartoum and El-Damer and at Kassala, which are the deltas of the Blue Nile, the Dinder, the Rahad, the Atbara, and the Gaäsh, are possessed of a soil in every sense similar to that of Egypt itself. At Khartoum and in the bed of the Blue Nile at Kamlin are extensive deposits of nodular limestone corresponding to the Kankars of India.
The main Nile from Khartoum to Assuân flows between low hills and tables of Nubian sandstone overlying crystalline rocks of gneiss, mica schists, hornblendic granite and red granite. Where the crystalline rocks come to the surface we have cataracts; where the Nubian sandstone is at the surface we have reaches of unbroken water.
From Assuân[4] to near Edfu the Nile flows between hills of Nubian sandstone, the best known of which is Gebel Silsila. From Edfu to[22] near Luxor, the Nubian sandstone which overlies the crystalline rocks dips under the Nile and its place along the Nile Valley is taken by green and grey clays containing nitrate and phosphate deposits. The former are inexhaustible and have constituted the manure of this part of the valley for thousands of years. With these deposits are thick banks of soft white limestone.
[4] Condensed from a description of the geology of the Nile Valley in Egypt written by Capt. Lyons for the second edition of “Egyptian Irrigation”.
From Luxor northwards the clays dip under the Nile and the Nile Valley is bounded by the superposed white eocene limestone up to Cairo.
The Nubian sandstone is always soft and porous. The limestone is generally soft, though hard siliceous beds are sometimes met with. North of Cairo there is no building stone of any value except the siliceous sandstone of Gebel Ahmar near Cairo and the basalt of Abu Zabel, a recent outcrop furnishing a black rock of great durability. The area covered by this rock is small.
Thick deposits of sand and gravel underlie the Nile mud deposits of the Nile Valley. All along the Nile, but especially south of Luxor, river deposits of dark sandy mud exist on either side of the Nile Valley considerably above the level of the deposit of to-day. The best known of these is the plain of Kom Ombos. The thickness of the layer of Nile mud in the valley is as much as 18 metres in places, but the average depth is, I should say, 10 metres.
—Reference should be made to tables 24 and 25 which embody the results of an exhaustive examination of the observed discharges, the cross sections, the gauges of the Nile Valley, and the calculated discharge tables made for these gauges. Many of these tables are founded on only two or three discharges and some on only one, but they have been prepared with the greatest care and referred to all the existing gauge observations, and are good working tables, which can be modified and improved as time places more information at our disposal. Until then they may be used as about the best approximations available to-day.
In 1902 the Albert Nile discharged 600 cubic metres per second as against 520 discharged by the Victoria Nile. In 1903 the Victoria Nile discharged 730 cubic metres per second and the Albert Nile 800. Leaving a poor year like 1902 which was much below the average, and taking 1903 which was all round a good average year and only slightly below the mean, we have the following results:—
The Victoria Nile was at its highest in July with 840 cubic metres[23] per second, while the Albert Nile at its head was at its highest in December with 1,060 cubic metres per second. Lake Albert took 5 months to fill up. At Gondokoro the Albert Nile was at its lowest in April when it discharged 700 cubic metres per second as against 550 cubic metres in the previous year. Swollen by timely and good rains south of Gondokoro the discharge at Gondokoro rose to 2,100 cubic metres per second in September after the river had scoured out its bed over a metre in depth. The mean discharge for the year at Gondokoro was 1,200 cubic metres per second.
The Gazelle river gave no discharge in the first half of the year and about 30 cubic metres per second in the latter half. Its mean discharge was 10 cubic metres per second for the year.
The Albert Nile at its tail above the Sobat junction gave as a minimum 350 cubic metres per second in March, which discharge rose to 430 cubic metres per second in September, but could not rise higher as the Saubat river was then in flood and the White Nile could not carry off much more than the discharge of the Sobat without putting the northern part of the Sudd region under 2 metres of water. This held back water helped later to maintain the discharge of the White Nile in January and February.
The Sobat river gave as a minimum a discharge of 40 cubic metres per second in April, and then rose to a maximum in November of 1,080 cubic metres per second.
At its tail, the Albert Nile gave a mean discharge for the year of 390 cubic metres per second and the Sobat of 550.
The White Nile at its head was at its lowest in April with 400 cubic metres per second and at its highest in December with 1,460 cubic metres per second, with a mean discharge of 940 cubic metres per second. At its tail near Khartoum the White Nile was at its lowest in May with 420 cubic metres per second and at its highest in October with about 1,700 cubic metres per second. As this latter figure was about 400 cubic metres per second more than it was receiving at its head, the additional water represented Blue Nile water which had run up the valley of the White Nile, been stored there while the Blue Nile was high and then been discharged into the Main Nile when the Blue Nile had fallen. The mean discharge at the tail of the White Nile was 830 cubic metres per second. This figure was much below that at the head and was due to the fact that in July, August and September the Blue Nile water was flowing up the White Nile.
[24]
The Blue Nile was at its lowest in April when it was discharging 120 cubic metres per second. During its maximum in August and September it was discharging 8,200 cubic metres per second. Of the discharge of the Blue Nile in July, August and September, a considerable part flowed up the White Nile which here has a slope of 1⁄100000 and a bed from 3,000 to 1,500 metres wide. It is for these reasons that the Blue Nile water does not hurry on to Assuân in its full strength. The mean discharge of the Blue Nile for the year was 2,350 cubic metres per second. Gauges and discharge tables at Kamlin on the Blue Nile, and north of Omdurman on the Main Nile, would be very much better than the Khartoum or Duem gauges of to-day which are both in back waters.
The Atbara river was dry from January to May, in June the discharge was 200 cubic metres per second, rising to 2,300 cubic metres per second in August. In October, November and December it was dry. The mean discharge for the year was 380 cubic metres per second. When the Atbara river rises in flood it cannot flow down the Nile to Egypt in its strength until it has filled up the trough of the Nile as far as the 6th Cataract. Gauges up and down stream of the 6th Cataract and at Shendy would be interesting when compared with Berber.
The minimum combined discharges of the White Nile, Blue Nile and Atbara river were 540 cubic metres per second in April. The maximum combined discharges of 10,900 cubic metres per second were in August. The mean combined discharges for the year were 3,560 cubic metres per second.
The minimum discharge of the main Nile above Assuân was 440 cubic metres per second in May and the maximum of 8,600 cubic metres per second was in September. The mean discharge for the year was 2,650 cubic metres per second.
Table 25 gives the actual daily minimum and maximum discharges during 1902 and 1903 for each stream, with their dates. For the Blue Nile in 1903 they were 100 and 9,600 cubic metres per second; for the White Nile 380 and 1,470; for the Atbara 0 and 3,100; and for the Nile above Assuân 420 and 9,000 cubic metres per second.
Table 26 compares the discharges for a maximum year like 1878, a minimum year like 1877, and a mean year, at Khartoum, Assuân and Cairo. The maximum discharges in 1877 were 5,300, 5,900 and 4,400 cubic metres per second, at Khartoum, Assuân and Cairo. In 1878[25] they were 12,500, 12,100 and 10,300 cubic metres per second respectively, while for a mean year they are 8,500, 9,200 and 7,200 cubic metres per second.
The modulus of the river at Assuân is 3,040 cubic metres per second, and at Cairo 2,640. After the very high flood of 1878, the lowest discharge in May 1879 at Assuân was 1,500 cubic metres per second.
The behaviour of the Nile after passing Assuân and entering Egypt may be described as follows:—of the mean discharge of 3,040 cubic metres per second which passes Assuân 400 cubic metres per second are utilised in Upper Egypt in the irrigation of 2,320,000 acres and 2,640 cubic metres per second pass Cairo. Of these again 540 cubic metres per second are utilised in the irrigation of 3,430,000 acres in Lower Egypt, and only 2,100 cubic metres per second reach the Mediterranean sea.
[26]
—Lake Victoria, the true source of the Nile, lies on the Equator, and fed by abundant rains and numerous streams, discharges its surplus waters over the Ripon Falls, and gives birth to the Victoria Nile. Its most important feeder, the Kagera, whose southernmost tributary rises in the Kangosi hills 2000 metres above sea level in south latitude 4°, has a length of some 600 kilometres. The direct line across the lake from the mouth of the Kagera to the Ripon Falls is 220 kilometres, so that in academical language the length of the Nile at the Ripon Falls is already 820 kilometres. Lake Victoria lies 1129 metres above sea level, and has an area of 60,000 square kilometres; though until the parallels of longitudes are definitely settled, the lake may be credited with an area of between 60,000 and 65,000 square kilometres, constituting it the largest fresh water lake in the old world. Its waters are beautifully clear and perfectly sweet. The depth of the lake is not great and it is covered with many islands. The greatest depth found by Commander Whitehouse in the northern half of the lake has been 73 metres, while the bays are shallow. The northern, southern and eastern shores of the lake, as described by Sir William Garstin, are generally clear, while the western shore, especially at the mouth of the Kagera, is flat, marshy and covered with papyrus. The country surrounding the lake is undulating or hilly and rises to a height of 700 metres above the lake at the south-east corner. The rocks are generally granites, chrystalline schists and quartzites, etc. The hills are covered with red clay and marl on the higher lands, while the valleys consist of a rich black loam.
The catchment basin of the lake is 244,000 square kilometres of which 60,000 are water. Most of the important streams feeding the lake traverse extensive marshes and swamps and must lose a great part of their waters by evaporation. According to Capt Lyons (Appendix III of Sir William Garstin’s report), the climate of the lake basin is typically that which is known as equatorial; two rainy seasons and two dry seasons make up the year, the rains coinciding more or less with the equinoxes and the dry seasons with the solstices, except that the second minor rains are delayed about 1 to 2 months after the autumn equinox. As Capt. Lyons hopes soon to publish a monograph on the meteorology of the Nile valley, I shall say little about the details of rainfall of the different catchment basins, contenting myself with broad principles and main features. March, April and May form the greater rainy season, and October, November and December the lesser. The rainfall of the former season may be considered twice as heavy as that of the latter, but it is the latter which practically decides the height of the lake in the following year. This, according to Capt. Lyons, is due to the fact that in the summer months, when the rainbelt lies to the north of the lake, the dry south winds must blow across the lake basin even though the diurnal reversal of winds on the lake is not mastered by them. These dry winds greatly increase the evaporation, and there is a marked diminution of the water between July and November, which must be primarily due to the increased evaporation.
PLATE III.
RIPON FALLS
Plan and Section
Scale 1 : 6.000

Lith. Sur. Dep. Cairo.
Larger illustration (210 kB)
Victoria Nile upstream of Ripon Falls
[27]
The rainfall in the catchment basin may be taken as 1250 millimetres per annum on the average. As the evaporation off the lake is probably the same, the area of the lake may be left out of the catchment altogether. The balance of the catchment basin amounts to 184,000 square kilometres, on which there is a mean annual rainfall of 230 cubic kilometres. The mean discharge of the Victoria Nile over the Ripon Falls appears to the approximately 580 cubic metres per second or 18 cubic kilometres per annum. This represents about 1⁄12 the mean rainfall. The greatest discharge of the lake seems to be about 850 cubic metres per second and the lowest 450. As the lake has risen in a single year 80 centimetres, which represents an increase of water of 48 cubic kilometres, and has fallen 60 centimetres which represents a decrease of water of 36 cubic kilometres, it will be seen that the discharges from the lake are factors of less importance in determining the level of the lake than the heavier rainfall and diminished evaporation in a year of good rain, and the lighter rainfall and increased evaporation in a year of poor rain. The great function of Lake Victoria in the economy of the Nile supply is the insuring of a nearly constant discharge of water into the Victoria Nile, and providing much of the evaporation which comes down in the catchment basin itself in the shape of rain.
[28]
The principal feeders of Lake Victoria are the following streams:—
| on the north | (1) | Lukos or Yala, |
| (2) | the Nzoia 250 kilometres long, | |
| (3) | the Sio. | |
| on the east | (1) | the Nyando, |
| (2) | the Inyayo, | |
| (3) | the Gori, | |
| (4) | the Mara Dabash, | |
| (5) | the Rawana. | |
| on the south | (1) | the Symiya, |
| (2) | the Moame. | |
| on the west | (1) | the Lohungati, |
| (2) | the Kagera, with its branches the Nyavarongo, the Akanyaru and the Ruvuvu, with a maximum length of 600 kilometres and a discharge varying between 140 and some 600 cubic metres per second. | |
| (3) | the Ruizi with a length of 280 kilometres traversing much marshy ground in its course. | |
| and | (4) | the Katonga 250 kilometres long. |
The northern and western feeders are generally perennial streams, while many of the southern and eastern are torrents.
—From the Ripon Falls to Lake Albert, the Victoria Nile has a length of 400 kilometres. The first 64 kilometres are down a steep slope, in a stream varying from 300 to 500 metres in width. Any project for a regulator at the Ripon Falls should contemplate development of electricity for working a railway along these 64 kilometres. The next 237 kilometres are through a flat marshy land, partly lake, partly swamps, but with the water never more than 4 to 6 metres deep. In this reach the Nile is navigable. This many-armed swamp is known as Lake Choga, whose western end is traversed for some 80 kilometres by the Nile with a perceptible current. These large sheets of papyrus and water, which cover an area of over 2000 square kilometres, must cause as much loss by evaporation as they receive by direct rainfall. The Victoria Nile leaves the lake in a broad stream some 900 metres wide, past Mruli station, on to Fowera. In the longitudinal section on Plate II, I have considered Fowera as 1060 metres above sea level, and the slope upstream of it as 1⁄20000. From Fowera to the foot of the Murchison Falls, the Nile falls 377 metres on a length of 68 kilometres, and then in the next 30 kilometres reaches Lake Albert. Considerable quantities of floating pistea weeds pass down the Victoria Nile from Lake Choga. They are well churned up between Fowera and the Murchison Falls, but finally enter Lake Albert. It would be easy to develop electricity to work a railway along these 68 kilometres.
PLATE IV.
CROSS SECTIONS of the NILE & its TRIBUTARIES
Horizontal Scale 1 : 2.000
Vertical Scale 1 : 600
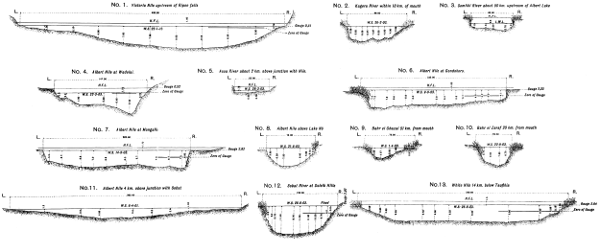
Lith. Sur. Dep. Cairo.
Larger illustration (300 kB)
| No. | 1. | Victoria Nile upstream of Ripon falls |
| No. | 2. | Kagera River within 10 km. of mouth |
| No. | 3. | Semliki River about 50 km. upstream of Albert Lake |
| No. | 4. | Albert Nile at Wadelai. |
| No. | 5. | Asua River about 2 km. above junction with Nile. |
| No. | 6. | Albert Nile at Gondokoro. |
| No. | 7. | Albert Nile at Mongalla |
| No. | 8. | Albert Nile above Lake Nô |
| No. | 9. | Bahr el Ghazal 51 km. from mouth |
| No. | 10. | Bahr el Zeraf 20 km. from mouth |
| No. | 11. | Albert Nile 4 km. above junction with Sobat |
| No. | 12. | Sobat River at Doleib Hills |
| No. | 13. | White Nile 14 km. below Taufikia |
[29]
The principal tributaries of the Victoria Nile are the following:—
On the right bank, the Gogonia, the marshy Kwania and Lenga, and the Duki. And on the left bank; the lake-like Sensiwa; the Kafu with its numerous feeders, large catchment basin but generally insignificant discharge; and the Titi. The Uganda rivers are more like sponges than rivers, and in all probability the tail of the Victoria Nile has a discharge only slightly in excess of that at the head.
—The Semliki river has its sources in Lake Edward just south of the Equator and flows into the southern end of Lake Albert, just as the Victoria Nile flows into the northern end. Lake Edward with the addition of Lake Dueru has an area of some 2500 square kilometres and lies about 965 metres above sea level. Its waters as described by Sir William Garstin, are green in colour and brackish. The Semliki river discharges the surplus waters of the lake, and may be considered as having a discharge of 100 cubic metres per second as a minimum and 400 cubic metres per second as a maximum. In some 120 kilometres of its length this river traverses the eastern end of the Congo forest, and the day may not be far distant when this timber will be floated down the Semliki, towed across Lake Albert and sent down the Albert Nile to Gondokoro and Khartoum. The fall of the Semliki, according to accepted levels is 285 metres in 260 kilometres. The feeders of Lake Edward are the following:—
On the west, none.
On the south, the Rutshuru and Ruendu.
On the east, the Msalala, the Wampuna, the Chambura, and the Mpanga which has its sources on the slopes of Ruenzori.
On the north, numerous glacier-fed torrents from the slopes of Ruenzori, the Nyamgasha and the Dibirra. The dry season discharges of all these rivers are small. The largest is under 10 cubic metres per second. The flood discharges are considerable.
—Lake Albert has an area of 4500 square kilometres and lies about 680 metres above sea level. We have left the high lands of Uganda and are in the stifling heat of tropical Africa. There are considerable deposits of salt along the east shore of Lake Albert, as there are also around Lake Edward. According to[30] Sir William Garstin, the waters of Lake Albert are brackish near the shores, but perfectly sweet and clear in the middle of the lake. It is due to the waters of Lake Victoria that those of Lake Albert are sweet. The catchment basin of the Albert Nile at its head where it leaves Lake Albert is about 379,000 square kilometres of which 244,000 square kilometres discharge into Lake Victoria. The rainfall over the additional 135,000 square kilometres may be considered as 1250 millimetres per annum, with seasons similar to those on Lake Victoria. The evaporation from Lake Albert must be greater than that from Lake Victoria, but if we exclude the joint areas of Lakes Victoria, Albert, Edward and Choga, and taking them as 70,000 square kilometres, consider that their rainfall is equalized by their evaporation, there remains from the 379,000 square kilometres of catchment basin about 309,000 square kilometres. An annual rainfall of 1250 millimetres means for 309,000 square kilometres a total rainfall of 380 cubic kilometres. The discharges of Lake Albert may be taken as varying from 500 cubic metres per second to 1100, with a mean of 800 cubic metres per second. This latter figure represents in one year 26 cubic kilometres or 1⁄15th the annual rainfall. We may compare with this the mean discharge of Lake Victoria of about 580 cubic metres per second and 1⁄12th of the annual rainfall of its catchment basin excluding the lake area.
A reference to Plate V will show how great is the regulating effect of Lake Albert on the Nile. Owing to the fact that an increase in the discharge of the Victoria Nile cannot pass down the Albert Nile before the whole area of Lake Albert has risen, the floods of the Victoria Nile are delayed nearly 5 months in their passage down the Albert Nile; a rise of 1 metre on Lake Albert meaning an increased cube of 4,500,000,000 cubic metres. If this takes place in one year, it represents an increased discharge of 150 cubic metres per second irrespective of what passes down the channel of Lake Albert.
If it were considered necessary to insure 1200 cubic metres per second as the discharge of the Albert Nile from the 15th January to the 15th May, it would mean adding 400 cubic metres per second to the mean discharge for 4 months, and deducting 200 cubic metres per second from the mean discharge for the remaining 8 months. By storing the surplus waters of good years by means of a weir capable of holding up 3 or 4 metres of water at the outlet of the lake, it would be possible to insure this discharge every year during the four months which decide the summer contingent of the White Nile to the Nile in Egypt during the months of April, May, June and July.
PLATE V.
GAUGE & DISCHARGE DIAGRAM of LAKES VICTORIA & ALBERT
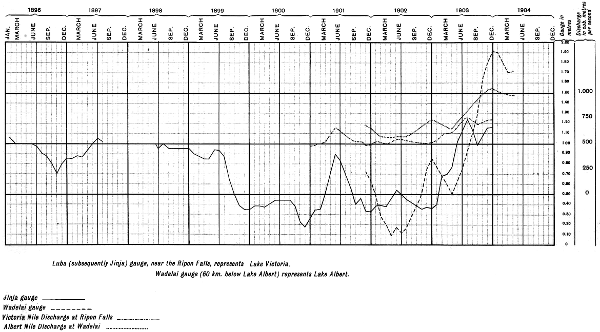
Lith. Sur. Dep. Cairo.
Larger diagram (270 kB)
Luba (subsequently Jinja) gauge, near the Ripon Falls, represents Lake Victoria.
Wadelai gauge (60 km. below Lake Albert) represents Lake Albert.
[31]
The shores of Lake Albert are generally steep and barren, though in places they are shelving and covered with papyrus, notably at the inlets of the Semliki river and the Victoria Nile. The Lake is fairly deep and admirably suited for a reservoir. At the outlet of the lake enormous quantities of pistea weeds, especially in high floods, enter the Albert Nile. The passage of these weeds through the future regulator of Lake Albert will be an exceedingly interesting engineering problem.
The principal feeders of the lake are:—
On the north, the Victoria Nile.
On the east, the Waiga, the Wakki, the Hoima, the Wahamba, the Horo, the Ngusi and Msisi, discharging between them under 20 cubic metres per second in the dry season, though good streams in flood.
On the south, the Semliki; and no streams worth mentioning on the west.
—The Albert Nile, or the Bahr-el-Gebel, has a length of 1280 kilometres from Lake Albert to the mouth of the Sobat river. For 218 kilometres, past Wadelai to Dufile, it has a broad stream with a sluggish current as a rule, and covered with islands and papyrus marshes. This reach of the Nile is navigable. The fall here must be very little, and it may be considered as 8 metres. In high floods enormous quantities of pistea weeds float down this reach of the Nile. Papyrus and ambatch are very common along the shores and on the islands.
At Dufile begin the Fola rapids followed by numerous cataracts up to Fort Berkeley. In this reach of 155 kilometres the river falls 223 metres. Sir William Garstin states that some of the falls have a width of only 12 metres. The depth must be extraordinary, while the velocity is terrific. The green water of the upper reaches is purified in its passage through these cataracts. The rock is granite. If the regulator for Lake Albert were constructed near Dufile, it should contemplate development of electricity for working a railway along these 155 kilometres.
South of Dufile the principal tributaries of the Albert Nile are on the right bank viz: the Achua and Umi. In the dry season they are dry, but after rains they may add some 50 cubic metres per second to[32] the river. Between Dufile and Fort Berkeley many rivers flow into the Albert Nile. The Asua, the Atappi, the Umi, the Karpetu, the Kweh and many others from the right bank bring down water in flood well laden with sand. In the dry season all but the Asua are dry. The left bank tributaries are numerous but insignificant. The volume discharged by these streams in the rainy season is very considerable, as will be seen if the discharges at Gondokoro north of Fort Berkeley are compared with those at Wadelai. They are between them capable of increasing the discharge of the Albert Nile for short intervals of time by 1500 cubic metres per second. All these streams are torrential. They rise and fall quickly.
From Fort Berkeley to Khartoum, the Albert and White Niles are navigable.
From Fort Berkeley to Bor past Gondokoro on a length of 206 kilometres the Albert Nile falls some 18 metres and has a good velocity and slope, and though the river is divided into two and more channels, it is within its banks and may be considered an ordinary river. The maximum discharge is about 2600 cubic metres per second and the minimum 550. In high floods the river scours out its bed and sides very considerably. The real flat lands begin at Gondokoro a little to the north of Fort Berkeley. The soil is light and sandy and capable of offering little resistance to the stream. Between Gondokoro and Bor the Albert Nile can lose some 30 per cent of its discharge when the river is high and capable of overflowing most of the islands and a great part of the valley. The main channel has a width of about 230 metres and depth of 3 or 4 metres when the discharge is below 600 cubic metres per second and well within banks. The main tributaries of the Albert Nile in this reach are on the east bank, the Kit, second only to the Asua, and the Lokadero; and on the west bank a number of unimportant torrents which however help to swell the river in flood.
From Bor to Ghaba Shambe on a length of 196 kilometres, the main stream of the Albert Nile flows between banks lower than those further south and more heavily inundated in flood, with a width of some 60 metres and depth of water of 5 metres. According to Sir William Garstin, the grass swamps end half way down this reach and the papyrus swamps begin. About 10 kilometres to the east of the main stream is another branch known as the Atem river fed by artificially maintained and natural spills from the main stream itself. These spills[33] are kept open by the Dinkas living along the Atem river. They were noted by Werne in 1842. The Atem river at its tail apparently divides into two branches, of which one feeds the Zeraf river and the other returns to the Nile at Ghaba Shambe.
Capt. Lyons has pointed out to me that all this course of the river is extraordinarily like the course of the Mississippi south of Vicksburg, with its severe curves and oxrings which correspond to the mayahs of the Albert Nile. Such mayahs or lagoons can be seen in the last 20 kilometres of the Rosetta branch of the Nile. Placed as they are between Bor and Ghaba Shambe, they mean that while south of Bor, the Albert Nile has more or less formed its delta; north of Bor, the delta is in a more embryonic stage, with probably the Atem river the more ancient of the two streams. North of Ghaba Shambe, the Zeraf river leaves the Albert Nile, and fed by the Atem Nile, takes off its water eastwards through marsh and swamp to again tail into the Albert Nile below Lake No. About 30 kilometres further north is the cut made by Sir Samuel Baker to enable him to enter the Albert Nile from the Zeraf river.
The real Sudd region lies between Ghaba Shambe and Lake No, on a length of 380 kilometres. Between Fort Berkeley and Gondokoro, the flood as well as the summer supplies are within banks. Between Gondokoro and Bor, the summer supply is well within banks, but the floods overflow the valley. Between Bor and Ghaba Shambe the summer supply is just within banks, but the floods overflow freely. Between Ghaba Shambe and Lake No the summer supply overflows the banks, and hence there result the periodical barrings or sudds of the Nile by the floating vegetation so common in this region. While the summer supply is within banks it can insure a clear waterway; but when not only the floods but the summer supplies ordinarily overflow the banks, the stream must be aided artificially if it is to keep its waterway clear.
The ordinary width of the river south of Hillet-el-Nuer is between 50 and 60 metres, but in the reach of the old sudd blocks numbers 16 to 19 it diminishes in places to 25 metres, and in the reach blocked by sudd block number 15 increases to 200. North of Hillet-el-Nuer, the width varies from 60 to 150 metres, but the mean width may be taken as from 75 to 80 metres. The velocity is about 75 centimetres per second, which is a good velocity for clear water; and Sir William Garstin remarks at one place that since the sudds were cleared the channel of[34] the Albert Nile seems to be deepening and widening itself, and he states in another place that the extent of overflow over the mayahs or side depressions is decreasing.
With proper training works and dredging it should be possible to reduce the length of the main channel of the Albert Nile between Gondokoro and Bor from 175 kilometres to 160; between Bor and Ghaba Shambe from 206 kilometres to 145; and between Ghaba Shambe and Lake No from 380 kilometres to 305. Or the length of channel from Gondokoro to Lake No might be reduced from 761 kilometres to 610. Some of the curves are nearly complete circles, needing but little work to cut off extensive lengths.
Between Ghaba Shambe and Lake No there were 19 sudd blocks of which all but one were removed by Major Peake, R. A., and Lieut. Drury, R. N., in 1900 and 1901. Their positions are indicated on Plate VI. South of Hillet-el-Nuer is sudd block No. 15, the only one remaining to be removed. Owing to this block, the Albert Nile leaves its true channel, which is from 5 to 6 metres deep, and, on a length of 43 kilometres, follows a series of mayahs, pools and marshes with a depth of from 11⁄4 to 2 metres. The original channel was closed by a boat laden with ivory sinking in the true channel during the Dervish domination. The boat has been found, the ivory recovered and the work of sudd clearing commenced, but the work has not yet been completed.
The maximum discharge of the Albert Nile at Hillet-el-Nuer may be taken as 450 cubic metres per second, and into Lake No as 320 cubic metres per second. The water of the river is dark-coloured and contains no sediment. Very little ambatch is met with north of Ghaba Shambe.
Between Ghaba Shambe and Lake No on the left bank, in the first 120 kilometres, three channels carrying very appreciable quantities of water flow into the Albert Nile. These are considered to be the tails of the river Yei. At Hillet-el-Nuer, about 170 kilometres north of Ghaba Shambe, a branch takes off from the west side of the Albert Nile, known as Gage’s channel, with 35 metres of clear waterway, 1 metre depth and 0·60 metre per second velocity, discharging 20 cubic metres per second. This stream flows westwards and is lost in the swamps. On the right bank, downstream of Ghaba Shambe, are the two heads of the Bahr Zeraf, one natural and the other artificial made by Sir Samuel Baker. About 90 kilometres north of Ghaba Shambe a few spills take water towards the Zeraf river.
PLATE VI.
THE ALBERT NILE.
FROM GONDOKORO TO THE SOBAT JUNCTION
Scale 1 : 2,000,000
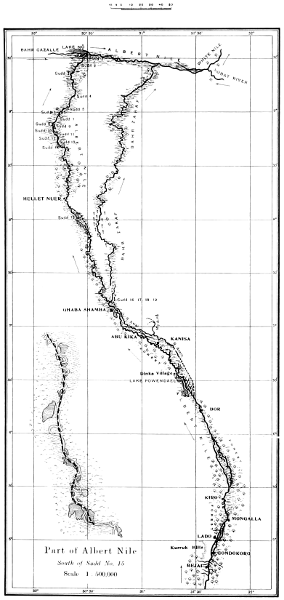
Lith. Sur. Dep. Cairo.
Larger map (200 kB)
Part of Albert Nile
South of Sudd No. 15
[35]
From Lake No to the Sobat mouth, on a length of 134 kilometres is the tail reach of the Albert Nile. The Albert Nile flows into Lake No in its south-eastern corner and leaves it on its east side. On the west side the Gazelle river flows into the lake. Lake No has an area of some 20 square kilometres in times of low supply and 100 square kilometres in flood. In low supply the depth is between 1·50 and 2·50 metres. In the reach between Lake No and the Sobat mouth, the river is very fairly straight; the summer channel is about 170 metres wide and as a rule about 5 metres deep upstream of the mouth of the Lolle, though in one place about 8 kilometres from Lake No it becomes only 50 metres wide for a short distance. Between the tail of the Lolle river and the mouth of the Sobat river, the summer width widens out to about 400 metres with 3 metres depth of water. However extensive the marshes may be, the high land forming the limit of the inundation is everywhere in this reach visible from the main stream. The Gazelle river, which flows into Lake No, has a discharge varying from 0 to 40 cubic metres per second. The Lolle river which flows in on the left bank upstream of the Sobat mouth is probably an arm of the Albert Nile or an overflow of the Gazelle and has a discharge varying from 0 to 40 cubic metres per second. On the right bank, the Zeraf river flows into the Albert Nile, with a discharge varying from 30 to 160 cubic metres per second. The Megahid river flows in 30 kilometres below the tail of the Zeraf river and adds an undetermined quota of water.
At its junction with the Sobat river, the Albert Nile discharges from 300 to 450 cubic metres in summer; it does not discharge much more in flood as the waters of the Sobat river in flood hold up the Albert River and make it overflow the low lands up to Lake No and beyond for a depth of 3 metres in high floods. This reach of the Nile is a flood reservoir, which empties itself ordinarily by the end of winter.
—The Gazelle river, which flows into Lake No, has a catchment basin of 240,000 square kilometres, with an annual rainfall of 75 millimetres; and an additional catchment basin of 230 square kilometres with an annual rainfall of 30 millimetres; and yet the river discharges nothing in summer and about 40 cubic metres per second in flood. It is the most extraordinary river in the world, often blocked by sudd and invisible. It has practically no banks in flood or in times of low supply, while the waterway varies in width from 6 metres to 90 and in depth from 2 metres to 6 metres. It makes its way between[36] interminable marshes of papyrus and water grasses. The Gazelle river is a deltaic river in a still more embryonic stage than the Albert Nile north of Ghaba Shambe. It, however, performs one good function. It keeps the swamps of the Sudd region full of water, year in and year out; and without it, the water of the Albert Nile would doubtless be lost by percolation in the Sudd region and the White Nile be left high and dry for 3 months every year.
Schweinfurth was the first to ascend and describe this river and its tributaries. Beginning from the east, its principal tributaries are:—the Rohl, the Dyow, the Tondy, the Kit, the Dyûr, the Dembo, the Humr and the Bahr el Arab. With courses of between 450 and 750 kilometres in length, the tributaries fall from 500 to 700 metres in their upper courses of from 300 to 500 kilometres, and in their remaining courses they traverse swamps. Certain of the tributaries may be discharging 10 cubic metres per second in summer and 250 cubic metres per second in flood, but the main stream of the Gazelle seems never to add more than 40 cubic metres per second to the Albert Nile. The whole of the water is evaporated from the weeds, papyrus, watergrasses and open sheets of water which cover a desolate area of 70,000 square kilometres. Evaporation and rainfall balance each other. If the «Singhara» or Indian water nut could be induced to grow in this waste of waters, some profit might be got out of them.
—The Bahr Zeraf is the right hand branch of the Albert Nile which leaves the latter river north of Ghaba Shambe and joins it again midway between Lake No and the Sobat river. It is fed largely by the escape water of the Atem river brought down in a traceable channel and in flood by torrents from the hilly region east of Gondokoro. Beginning with a series of marshes and swamps, it gradually establishes its right to be called a river and finally after a tortuous and meandering course of about 270 kilometres tails into the Albert Nile. In its lower reaches it is about 50 metres wide and from 2 to 4 metres deep in summer and 6 to 8 metres deep in flood. Its discharges vary from 30 cubic metres per second in summer to 160 cubic metres per second in flood. In its lower reaches the banks consist of solid earth, proving that at one time it carried water other than that brought down by the Albert Nile.
—This river drains 156,000 square kilometres lying between the catchment basins of Lake Rudolf and the Blue Nile. The rainfall in the mountainous region of Gallaland is plentiful[37] and especially heavy in autumn, and were it not for the extensive lakes and marshes in its middle course, it would be a torrent in flood. Regulated and restrained by the lakes and marshes, this river has an extraordinarily even rise and fall, as a reference to Table 24 will certify. It is unfortunate that the Nasser gauge has been read so interruptedly. The Doleb Hilla gauge is in the back water of the Albert Nile and not very reliable. The discharges of the last four years have varied from 40 cubic metres per second in low supply to 1000 cubic metres in flood, though there have been years when the discharges have fallen to zero in summer and when the flood must have exceeded 1500 cubic metres per second. April is the month of low supply and November of maximum flood.
In its last 50 kilometres, the river has a deep, well defined channel between high banks, which are never topped in the highest floods. The width of waterway is about 110 metres and the depth 7 metres in summer and about 10 to 11 metres in flood.
The principal tributaries of the Sobat are the Baro from the north-east and east, and the Akobo and Pibor from the south-east and south. All the tributaries meet and form extensive swamps from which the Sobat has its origin. The village of Nasser is situated on the Sobat near its origin. A gauge has been erected here.
—The Sudd region of the Albert Nile lies north of Ghaba Shambe and corresponds to that part of the river where not only do the floods overflow the banks, but the summer supplies can do so in many places. It is the delta of the river in a very embryonic stage. There are two main branches to the river, the Albert Nile proper and the Zeraf, which have both been already described. Both these rivers are liable to be blocked by sudd or blocks of living vegetation. These blocks are sometimes as much as 5 metres thick and capable of turning nearly the whole supply of the river out of its course. They are formed of papyrus, weeds and watergrasses, which grow on the half sandy half peaty banks of the lagoons and marshes traversed by the river, and which, under the double action of a rising flood and strong winds, are torn up and driven into the channels wherever they are confined in width, and there jammed into solid masses of floating weeds, filling the whole width of the river, very nearly the whole depth, and sometimes over a kilometre in length. In addition to the local weeds and grasses, there are always at hand in high floods dense masses of pistea weeds which have come from the upper waters of the Albert Nile south[38] of Dufile. While the sudd floats it is not so bad as when it sinks, as it has done at block No. 15 north of Gaba Shambe, where the Nile has left its course for 37 kilometres owing to sunken sudd. When the sudd sinks, its becomes putrid and especially loathsome.
The Sudd region is unmistakably, as Lombardini pointed out years ago, an old lake which has silted up and become full of peat and sand deposits. At one time the lake must have had an extreme length of 400 kilometres and width of 400 kilometres and been a larger sheet of water than lake Victoria. The Sobat river flowed into it, and the Blue Nile may have flowed backwards up the bed of the present White Nile for tens of thousands of years. The north-east corner has been better filled with deposit than any other part.
The dense masses of papyrus and water-grasses which shut out the horizon in every direction intimidated the expedition sent up the Nile by Nero, and it returned northwards without having accomplished anything. From Nero’s time to that of Mehemet Ali little was known of these regions. Mehemet Ali made a determined effort to discover what lay beyond these inhospitable regions, and sent up a well-equipped expedition under D’Arnaud.
One of the earliest descriptions of the Nile between the fifth and tenth parallels of latitude is by Werne, who accompanied D’Arnaud’s expedition sent by Mehemet Ali in 1840-1841. The expedition found the channel of the White Nile and Albert Nile easily navigable between December and March. The Albert Nile between 7° and 9° N. lat. had apparently a mean width of 120 metres, depth of 5 metres, and velocity of about 60 centimetres per second, giving a discharge of some 400 cubic metres per second. In this first description of the river the fact that strikes one most forcibly is the omission of the Bahr Zeraf. Neither the inlet nor the outlet are mentioned, though the Sobat, the Gazelle, and numerous insignificant streams are minutely recorded. Practically the whole of the water was confined to one stream, and that a good one. The water level in winter was found to be some 50 centimetres below the general level of the berm, and about 60 centimetres above this level in flood. The swamps contained offensive and fetid water, which mixed with the waters of the rising flood and helped to pollute the stream on the first rise of the river. Between the river and the swamps in its southern reaches were numerous cuts and openings, some natural and some artificial, made by the aborigines for fishing purposes. While traversing the swamps, the waters of the river in flood lost[39] their silt and became quite clear. On page 100 of Vol. II of Werne’s work there is this significant sentence: “The report that the natives below (i.e. in latitude 5° to 7°) had blocked the river to cut off our retreat, turned out to be unfounded.” From the above it will be noticed that the aborigines in 1840-1841 spoke of their ability to block the course of the river, while the training works in the side channels and spills for fishing purposes were described as solid works regulated by rows of strong stakes driven into the ground.
Between 1841 and 1863 the expeditions up the Nile considerably increased, while the aborigines were being brutally treated by the slave traders. What could be more natural than that, as a measure of protection, the aborigines should have widened and deepened the side channels and spills which took off from the river between latitudes 51⁄2° and 71⁄2°, so that they might escape from the traders. Subsequently, when the main river was patrolled by Government boats, the slave-traders themselves used these side channels for prosecuting their traffic. All the channels and spills tailed into the Bahr Zeraf, which now began to form an appreciable stream, and which was navigated over the lower part of its course by Petherick between 1853 and 1862. The Bahr Zeraf was however always described as sudded, while the Albert Nile was open to navigation. This action of dissipating the waters of the river went on increasing till 1863, when there occurred a very high flood indeed; the floating weeds brought down from the south were excessive, the waters escaped everywhere from the main stream, while the floating masses of creepers were confined by the grasses and papyrus to the main channel, and sudded it downstream of Lake No.
On ascending the White Nile and Albert Nile in January 1863, Sir Samuel Baker found the passage clear to the south. On returning in April 1865, he found the sudd of the flood of 1863 still in the Albert Nile downstream of Lake No. The sudd was 1000 metres long and had a passage 3 metres wide cut through the middle of it, down which the river ran like a mill race.
In February 1869, Dr. Schweinfurth and his party, on their way to the Gazelle, took six days to get through this sudd, though the main obstruction was now only 200 metres long. In July 1872, Dr. Schweinfurth on his way back found the sudd to the downstream of Lake No as before, and described the opening through it as “a narrow stream of water which rushed along as a wild brook. The depth of the fairway varied from 2 to 3 metres, and the boat nowhere touched the bottom.”
[40]
In February 1870 Sir Samuel Baker found the sudd in the Albert Nile impossible for his expedition of heavily laden boats and steamers. He found the Zeraf sudded in its southern 100 kilometres, and tried to cut his way through but failed. And yet the slave traders had means of getting slave boats down the Bahr Zeraf (“Ismailia” pages 61, 62 and 29). Baker returned in January 1871 to the Zeriba Kutchuk Ali on the Bahr Zeraf and had before him the 100 kilometres of sudded channel. With the aid of 1200 men he completed the work by March 13. The final operation was a canal through stiff clay 600 metres long (known to-day as Baker’s cut). The fall from the Albert Nile into the Bahr Zeraf was so great that, in order to get the boats and steamers across the final distance, Baker made a dam 120 metres long across the Zeraf by means of a double row of piles, sand bags and fascines of the tall grasses. He thus secured the necessary depth of water, and the flotilla sailed into the Albert Nile. On his way back in June 1873, he thus describes the appearance of the head of the Ziraf river where he had made the cut in March 1871:—
“On arrival at the Bahr Zeraf cut, we found that the canals which we had formerly cut were much improved by the force of the stream. Although these passages were narrow, they had become deep and we progressed with comparatively little trouble.” The rest of the journey down the Bahr Zeraf was easily performed.
In January 1874, when the river was low, the sudd in the Albert Nile was removed by Ismail Pacha Ayoub, Governor General of the Soudan.
From 1874 to 1878, while Gordon was Governor General, the Albert Nile was clear of sudd, but the wide stream of 1840 had dwindled down to a clear waterway free of weeds on a width of 6 metres over long reaches. The escape of water down numerous spills had deprived the Albert Nile of the power of keeping its channel clear and when the heavy flood of 1878 came down, the river was sudded.
In 1880 Gessi was blocked in the Bahr Gazelle. The sudd in this Bahr was cut by Marno, who also cut the sudd in the Albert Nile in April 1880.
Emin Pasha mentions the fact that the Albert Nile was free of sudd and navigated from 1880 to 1883. In 1884 he states that no steamers reached Lado, but he attributed that to the Mahdi’s rebellion.
During the early years of the Mahdi’s and Khalifa’s rule there was no sudd. In the Khalifa’s time a boat laden with ivory sank in the stream where sudd block No. 15 is, south of Hillet-el-Nuer, and caused the block to form.
[41]
In 1898 Lord Kitchener found the Albert Nile sudded south of Lake No, and in March 1899 Sparkes bey, of the Egyptian Army, steamed up the Bahr Zeraf to within 30 kilometres of its head.
At the same time Sir William Garstin thought the Bahr Zeraf a stronger stream than the Albert Nile.
Descending the Albert Nile from Uganda, Colonel Martyr found the Albert Nile sudded 30 kilometres north of Ghaba Shambe.
In 1900 and 1901 Major Peake, C. M. G., R. A., and Lieut. Drury, R. N., removed sudd blocks Nos. 1 to 14, and 16 to 19, between Lake No and Ghaba Shambe. There now remains only block No. 15 south of Hillet-el-Nuer.
The condition of the channel to-day has been described under the heading of the Albert Nile. It is a very fair channel except at the diversion round block No. 15, which Sir William Garstin is very eager to see removed.
—The White Nile stretches from the Sobat mouth to Khartoum and has a length of 838 kilometres and very little fall. It everywhere bears traces of having been the channel of the Blue Nile when in ancient times the Gebel-Royan hill had not been cut through by the Nile, and the Blue Nile itself flowed south into the great lake which is to-day the sudd region of the Albert Nile. If the Blue Nile discharged, as it does to-day, about 2500 cubic metres per second throughout the year, the Sobat 600 cubic metres, the Albert Nile 1000, the Gazelle tributaries 700, and the rainfall on the lake itself was 1 metre per annum, while the evaporation was 21⁄2 metres, (all reasonable figures), the water entering the lake was 300 cubic kilometres per annum and the evaporation was the same, provided the lake had an area of 120,000 square kilometres, which is, moreover, reasonable when we examine the plan. During the whole of this period, the valley of the Nile in Egypt received its water from the Atbara alone.
The waters of the Sobat river in flood give its name to the White Nile. At Tewfikieh, near the head of the White Nile, is a gauge. For the first 500 kilometres the river is described by Sir William Garstin as having a waterway of from 300 to 500 metres in width with numerous islands. The depth of water in summer is 5 metres and 7 metres in flood. On either side of the waterway is a low ridge swamped in flood, and beyond that on either side is a deep depression, deep in the centre and rising to the ridge on one side and to the high land and forest on[42] the other. Each depression may be 3 kilometres in width where it is wide and a few hundred metres where it is narrow, so that the flooded valley may have a width of 6 kilometres in places. The ridges are about 3 metres wide, and broken by openings through which the water passes in and out of the side marshy depressions. The depressions are covered by a dense growth of reeds and papyrus. When the reeds are burnt one can traverse the marshes on foot. South of Kaka (200 kilometres north of the Sobat mouth) the depressions are lower than they are further north, which, to me, goes to prove that the channel of to-day is formed within the channel of old days when the Blue Nile was flowing south into the Sudd region. At Gebelain (250 kilometres north of Kaka) the side depressions contract and the forests come nearer the river. At the Abu Zeid ford, 50 kilometres further to the north, is a serious obstacle to navigation when the river is low, in the shape of a very broad sheet of shingle studded thick with fresh-water oysters. This bar is 6 kilometres long, as hard as stone, and has in very low summer supplies a depth of water over it of only 50 centimetres. It is a wonder that a channel has not been blasted through it. The swamping now visibly decreases and the width of the river varies from 700 to 900 metres. Some 25 kilometres north of Abu Zeid the papyrus and sudd grasses disappear, and though there is flooding there are no swamps. We have now some well cultivated islands in the river for the negroes have come to an end and the Arabs inhabit the country. The summer channel may be now considered as 700 metres wide and the flood channel as 1300 metres. The summer depth of water is 4 metres. At Duem, 220 kilometres south of Khartoum, the width of the channel widens from 900 to 1000 and further north to 1500 metres, and finally to 3000 metres. We are in a lake rather than in a river, and in flood when the waters of the Blue Nile travel 300 kilometres up the White Nile, and wait for a fall in the Blue Nile to discharge themselves into the Nile, we are indeed in a pulsating lake and not in a river. It must have been in September, when the discharge of the Blue Nile had fallen from some 11,000 to 6,000 cubic metres per second, and the stored-up waters in the valley of the White Nile were forcing themselves down to take the place of those cut off from the Blue Nile, that Linant Pasha took his discharges of the Blue and White Niles and found them some 6000 and 5000 cubic metres per second respectively. The same remark may be made about M. Chélu’s discharge of the White Nile at Khartoum of 4000 cubic metres per second in September 1876 and mentioned in his book “Le Nil, le Soudan, l’Égypte,” page 17.
PLATE IX.
CROSS SECTIONS of the NILE & its TRIBUTARIES
Horizontal Scale 1 : 2.000
Vertical Scale 1 : 500
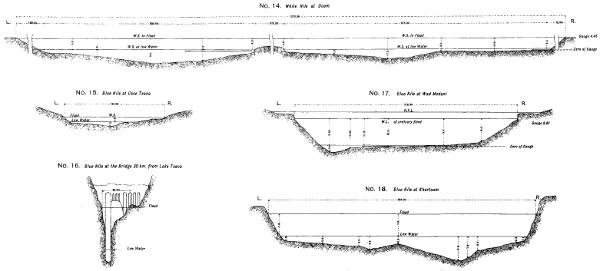
Lith. Sur. Dep. Cairo.
Large ilustratration (190 kB)
| No. | 14. | White Nile at Duem. |
| No. | 15. | Blue Nile at Lake Tsana |
| No. | 16. | Blue Nile at the Bridge 30 km. from Lake Tsana |
| No. | 17. | Blue Nile at Wad Medani |
| No. | 18. | Blue Nile at Khartoum |
[43]
In 1903 the minimum discharge of the White Nile at its head was 380 cubic metres per second in April and the maximum discharge was 1470 cubic metres per second in December. Table 24 gives the behaviour of the river. The minimum discharge of the White Nile at Khartoum may be taken as 300 cubic metres per second. The preceding paragraph will explain how difficult it will be to know its maximum discharge until a gauge and discharge table are established for the Blue Nile 100 kilometres above Khartoum well above back water, and a gauge and discharge table in the Main Nile north of Omdurman. The difference between these two discharges will be the true discharge of the White Nile which, with its slope of 1⁄100000 in flood, is not a river but a flood reservoir. The discharges taken at Duem on the White Nile and at Khartoum on the Blue Nile in 1902 and 1903 are interesting, but of little value for anything except the very date on which they were taken. They were all in backwaters.
—Compared to any river we have yet described, the Blue Nile is a true mountain stream. Draining the southern and more rainy half of Abyssinia, it is the principal source of the Nile in flood. Whatever waters it receives, it carries to the Nile and it is the true parent of the land of Egypt, for the deposit from its muddy waters is that Nile mud which has made Egypt. The Atbara carries waters which are probably more muddy than those of the Blue Nile, but compared to the Blue Nile the Atbara is a small river, and its quota is insignificant by the side of that of the larger stream. The principal tributary of the Blue Nile, the Abai, rises at a height of about 2,700 metres above sea level and after a course of 110 kilometres falls into Lake Tsana. Lake Tsana lies at a level of about 1,760 metres above sea level, and has an area of about 3,000 square kilometres and catchment basin of about 14,000 square kilometres irrespective of the lake area. On the 31st of January 1903, after a very poor rainfall, Mr. C. Dupuis found the discharge 42 cubic metres per second. Calculating from his cross section, it seems that the maximum discharge may be 200 cubic metres per second. As at Lake Victoria, possibly not more than 1⁄12th the rainfall finds its way into the lake; and, once there, the greater part is evaporated. Little seems to leave the lake, which would consequently make a very poor reservoir. The land rises from the lake in gently undulating downs as a rule. Wherever observed by Mr. Dupuis, the lake was[44] shallow. There are many islands and some of them considerable ones. The rivers feeding the lake are the following:—the Abai discharging 9 cubic metres per second in January 1903, the Reb 2 cubic metres, the Gumara 2, the Magetch 0·3, the Arno Garno 0·3, the Gelda 0·5, the Unfraz 1·2, and many smaller streams say 1·7, or 17 cubic metres per second in all. This of course was in the dry season. Mr. Dupuis considers the evaporation as 4 millimetres per day.
Between Lake Tsana and Rosaires, on a length of about 750 kilometres the Blue Nile falls some 1260 metres; between Rosaires and Sennar, on a length of 270 kilometres, it falls about 60 metres, and between Sennar and Khartoum on a length of 345 kilometres it falls about 50 metres. The cross sections of the river at Wad Medani, 200 kilometres above Khartoum, and at Khartoum are given on Plate IX.
In flood and early winter the river is navigable up to the Rosaires cataract. The width of channel may be considered as varying between 350 and 700 metres with an average width of 500 metres. The river rises from 9 to 12 metres in flood and has a velocity in high floods of 3 metres per second. Rivers with such velocities scour out their beds very severely in high floods and deposit silt in low floods, and for the discharges below 5 metres, cross sections should be annually established and discharge tables made depending on the sections. The summer discharge varies from 100 to 300 cubic metres per second and the flood from 7,500 to 12,500 cubic metres per second. The behaviour of the river is shown in Tables 24 and 25. The beginning of May is generally low water and the beginning of September high water. The winter discharge may be taken as 500 cubic metres per second.
The tributaries south of Rosaires are the following:—on the right bank, the Folassa, the Durra, the Fatsam, the Bir and the Temsha, veritable torrents; and on the left bank, numerous streams from north and north-west of Addis Ababa, the Anjur, and the Didessa, the latter from 100 to 150 metres wide. North of the last is the Tumat. The Didessa is about 350 kilometres long and the Tumat 200. It is not at all improbable that in the valley of the Didessa far better reservoir sites could be found than at Lake Tsana. Capt. Lyons tells me that there are important reaches here with very little slope. North of Rosaires there are two important tributaries on the right bank, the Dinder, north of Sennar, and the Rahad, just north of Wad Medani. Both these streams run only in flood and are dry in winter and summer. The Dinder has a bed width of about 120 metres, depth 4 metres in good flood and a velocity of 2 metres per second, which gives a discharge of about 1000 cubic metres per second in a high flood. The Rahad has a bed width of 60 metres, depth of 3 metres in a good flood and a velocity of 2 metres per second, which gives a discharge of 400 cubic metres per second in a good flood. The deltas of the Blue Nile, the Dinder and the Rahad are formed of the richest Nile mud. Such soil is rich in lime, potash and phosphates, but is poor in nitrates.
[45]
The velocity of the Blue Nile may be taken as 75 centimetres per second in low supply and 3 metres per second in high flood.
—The Atbara river flows into the Nile at El-Damer, south of Berber. It is essentially a torrent fed by the rains of north-eastern Abyssinia. The rains here begin early and end early, so that the Atbara is in high flood in August and falls quickly through September. Its floods last from June to October and the river is dry for the remaining months of the year. By dry it is meant that there is no running water, for the bed of the river contains numerous pools of water, which are nearly always deep and often very extensive.
Mr. Dupuis has given a rough longitudinal section of the Atbara river. Rising within 16 kilometres of Lake Tsana, at a height of about 2000 metres above sea level, in its first 300 kilometres it falls 1500 metres to 530 metres above sea level, where it is met by the Salaam river. In the next hundred kilometres it falls 40 metres and is joined by the Settit river, a larger and more permanent stream than the Atbara itself. Sixty kilometres lower down is the Khasm-el-Girba gauge, just upstream of Fasher and about 420 kilometres from the Nile. Two hundred kilometres below the Settit junction and about 280 kilometres from the Nile is Gosrejeb, and 150 kilometres lower down Adarma. Finally, after a total length of about 880 kilometres, the Atbara flows into the Nile.
The Settit junction is about 490 metres above sea level, Fasher 470 metres, Gosrejeb 410, Adarma 380, and El-Damer about 365 metres above sea level. In the last 280 kilometres there is therefore a fall of 45 metres or about 1⁄6000. In this reach the river has a width of about 330 metres and depth in flood of 6 metres.
Tables 24 and 25 give the behaviour of the river. In 1902 and 1904, two very low years, the maximum discharge was about 2000 cubic metres per second, and in 1903 about 3000 cubic metres. In high floods the Atbara can discharge 5000 cubic metres per second.
[46]
The principal tributaries of the Atbara are the Salaam and Settit already mentioned. On its right bank between Gosrejeb and Adarma it is joined by the Gaash river, which flows past Kassala and loses itself in the deserts. In years of extraordinary rainfall the Gaash reaches the Atbara. The Gaash at Kassala has a width of 150 metres, depth of 1 metre and approximate discharge of 300 cubic metres per second in an ordinary flood. It has a course of about 160 kilometres before it disappears in the desert.
—The Nile begins its course without any gauge to record its varying height. A gauge north of Omdurman, another upstream of the 6th cataract and a third downstream of the cataract are badly needed. Until these three gauges are erected and recorded, and another erected and recorded on the Blue Nile at Kamlin, about 100 kilometres above Khartoum, the behaviour of the Nile and its tributaries at their junction will never be exactly understood. Making use of the information which is obtainable, we may say that the Blue Nile is generally at its lowest between the 15th April and 15th May with a mean low-water discharge of about 200 cubic metres per second, falling to nearly zero in certain years; it is at its highest between the 15th August and 15th September with a mean maximum discharge of some 10,000 cubic metres per second, rising to 13,000 and falling to 6,500 in maximum and minimum years. If the larger figure is correct, the Blue Nile bank at Khartoum is over a metre too low, and the town is liable to be flooded out. If reference is made to Plate VIII it will be seen that the flood of the Blue Nile in July, August and September travels up the White Nile, holds back its waters and converts the valley of the White Nile into a flood reservoir. When the Blue Nile falls rapidly in October and November, the discharge of the Nile is maintained by the stored-up waters in the White Nile and by the White Nile flood which has slowly travelled down its almost level bed. Table 24 shows this more clearly than any description could. I do not think that the maximum discharge of the Main Nile on any given day is ever equal to the maximum discharge of the Blue Nile.
The Nile between Khartoum and Berber has a channel wider and deeper than that between Wady Halfa and Assuân and a gentler current. I have not taken, or seen any discharges which have been taken in this reach, but judging from what I saw I should say the channel was 800 metres wide on the average. At a distance of 86 kilometres from Khartoum is the Shabluka or 6th cataract. Here the Nile descends 6 metres on a length of 18 kilometres. Two hundred and twenty kilometres below the cataract the Atbara flows into the Nile and repeats on a very small scale what the Blue Nile does at Khartoum. The Atbara is a flood torrent and is dry from October to May. In flood it discharges from a low maximum of 1,700 to a high maximum of 5,000 cubic metres per second, with a mean maximum of 3,500 cubic metres.
PLATE VIII.
BLUE & WHITE NILE GAUGES
FLOOD OF 1903.
BLUE & WHITE NILE GAUGES
FLOOD OF 1904.
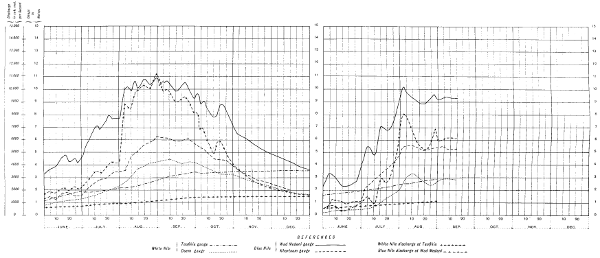
Lith. Sur. Dep. Cairo.
Larger graphs (190 kB)
[47]
In this reach the Nile has a maximum range of 81⁄2 metres and an ordinary range of 7 metres.
Twenty-four kilometres downstream of the Atbara junction is Berber, and 45 kilometres downstream of Berber is the beginning of the 5th cataract, which has a length of 160 kilometres and a drop of 55 metres with three principal rapids, the Solimania, Baggâra and Mograt. The village of Abu Hamed is situated at the foot of this Cataract. Between Abu Hamed and Dongola is the 4th Cataract, which begins at a point 97 kilometres downstream of Abu Hamed, and has a length of 110 kilometres with a drop of 49 metres. In this series of rapids are the Um Dâras and Guerendid. Between the 4th and 3rd Cataracts is a reach of 313 kilometres on a slope 1⁄12000. On this reach is the town of Dongola. The 3rd Cataract has a length of 72 kilometres and a drop of 11 metres with the Hannek and Kaibâr rapids, surveyed and levelled by De Gottberg in 1857. Upstream of the Hannek rapid, on the left bank of the Nile, is the termination of the long depression in the deserts which goes by the name of the Wady-el-Kab and is considered by many as lower than the Nile valley. Between the 3rd and 2nd Cataracts is an ordinary reach of 118 kilometres. West of this part of the Nile are the Selima Wells and according to some travellers an old abandoned course of the Nile slightly above the present high level of the river. This waterless river is said to terminate in the Oasis of Berys which is separated from the Khargeh Oasis by a limestone ridge.
The 2nd Cataract, known as the “Batn-el-Haggar” or “Belly of Stone,” has a length of 200 kilometres and a drop of 66 metres with the rapids of Amâra, Dal, Semna and Abka. At Semna are the rocks where Lepsius discovered the Nile gauges cut by one of the Pharaohs some 4,000 years ago. The Nile flood recorded there is 8 metres higher than any flood of to-day. As the Nile at Semna could be very easily barred by a dam, it struck me when I was there in 1892 that probably King Amenemhat (of Lake Mœris fame) had tried to bar the[48] river with a dam in the hope of creating a reservoir. At Wady Halfa, near the foot of the 2nd Cataract, a masonry gauge divided into metres has been erected and read since 1877. Its accidental zero is R. L. 116.69 and the mean low-water level, or true zero, is R. L. 117.89. Between the 1st and 2nd Cataracts, the Nile has a length of 345 kilometres and a slope of 1⁄12500. The mean width of the river is 500 metres, and the mean depths in flood and summer are 9 and 2 metres. The velocity in summer falls to 50 centimetres per second and rises to 2 metres per second in flood. The river in this reach is generally within sandstone, and the greater part is provided with gigantic spurs on both banks. These spurs perform the double work of collecting soil on the sides in flood and training the river in summer. They were probably put up by the great Rameses 3,000 years ago, as some of the most massive of them have evidently been constructed to turn the river on a curve out of its natural channel on to the opposite side in order to secure deep water in front of Rameses’ temple of Jerf Husain (“Jerf” means steep, scoured bank). The spurs have been constructed with care, and as the courses of roughly-dressed stone can be examined at fairly low water (I have never seen them at absolutely low water) it is evident that there has been no great degradation of the bed during the last 2,000 or 3,000 years. The first, or Assuân Cataract, has a drop of 5 metres on a length of 5 kilometres.
From Khartoum to Assuân, on a total length of 1809 kilometres, there are 565 kilometres of so-called cataracts with a total drop of 192 metres, and 1,244 kilometres of ordinary channel with a total drop of 103 metres.
At the head of the 1st Cataract is the Assuân dam, regulated on for the first time in October 1902. It has 140 openings of 2 metres × 7 metres and 40 openings of 2 metres × 31⁄2 metres.
At the foot of the 1st Cataract, opposite the town of Assuân, on the Island of Elephantine, has stood a Nile gauge from very ancient times. An officer belonging to the Roman garrison in the time of the Emperor Severus marked an extraordinarily high flood on the gauge. The maximum flood-mark at the time of the visit of Napoleon’s French savants was however 2.11 metres higher than the above. As the middle of Severus’ reign was A.D. 200, and the visit of French savants A. D. 1800, they concluded that the bed and banks of the Nile had risen 2.11 metres in 1600 years or 0.132 metres per 100 years. The new gauge divided into cubits and twenty-fourths was erected in 1869 and has been recorded daily since then (a cubit = 54 centimetres). The accidental zero of the gauge is R. L. 84.16. The mean low-water level or true zero is R. L. 85.00.
PLATE X.
LONGITUDINAL SECTION of the NILE from WADY HALFA to GEBEL SILSILAH
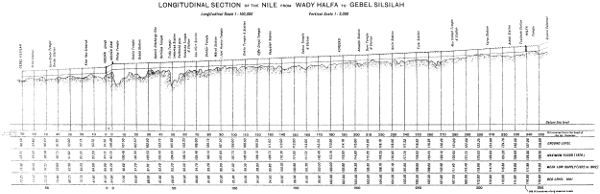
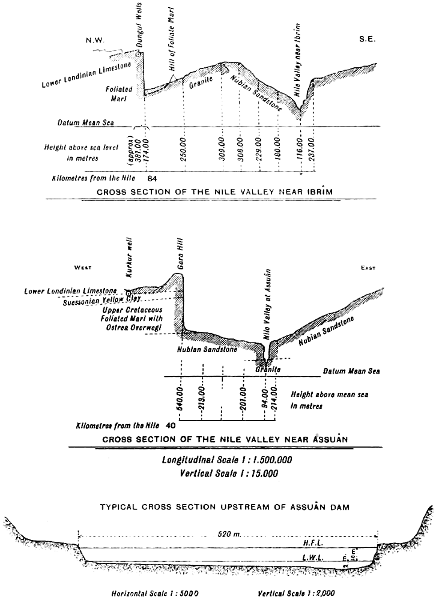
Lith. Sur. Dep. Cairo.
Larger longitudinal section (270 kB)
Larger cross sections (90 kB)
CROSS SECTION OF THE NILE VALLEY NEAR IBRÎM
CROSS SECTION OF THE NILE VALLEY NEAR ASSUÂN
TYPICAL CROSS SECTION UPSTREAM OF ASSUÂN DAM
[49]
—From Assuân to the Barrage, the length of the river is 973 kilometres in summer and 923 in flood. The slope in summer is 1⁄13000 and in flood 1⁄12200 The mean fall of the valley is 1⁄10800. The slopes vary in the different mean reaches, the least being 1⁄14800 in the Kena Mudiria and the greatest 1⁄11400 in Beni Suef. In a high flood with a rise of 9 metres at Assuân, the rise in Kena will be 9.5 metres and only 8.2 in Beni Suef. Table 42 gives the mean areas of cross sections of the Nile, while table 44 gives the mean widths. Neglecting spill channels, we may state that in a high flood the mean area of the section of the Nile is 7,500 square metres and the mean width 900 metres. In the Kena Mudiria, the area is 7,000 square metres and the width 800 metres, while in Beni Suef the mean area is 8,000 square metres and the mean width 1,000 metres. Speaking generally it may be stated that where the Nile valley is narrow the slope of the river is small, its depth great and width contracted; while where the valley is broad the slope is great, the depth small and the width enlarged. The mean velocity in flood ranges between 2.0 metres and 1.0 metre per second, while the velocity in summer varies from 0.5 to 0.9 metre per second. We may say that the Nile in soil has a natural section whose width in flood is 110 times its depth, while its mean velocity is 1.50 metres per second.
The natural canals, which take off the river and which never silt, have a mean velocity of some 65 centimetres per second, while the proportion of width to depth is about 12 to 1. Artificial canals of this section do not silt if their velocities are 80 centimetres per second, while silting takes place as readily when the velocity is greater as when it is less than the above. In muddy streams, like the Nile in flood, certain velocities demand certain proportions of width to depth, and if these are not given to it, they will make it for themselves by eating away the sides if they can, or, if they cannot eat away the sides, by silting up and raising the bed.
To the north of Assiout is situated the Assiout weir or barrage across the Nile with 111 openings of 5 metres and 10 metres depth of water in high flood. It was regulated on for the first time in August 1902.
[50]
On Roda island, opposite Cairo, has stood a gauge from the earliest times. It has been frequently reconstructed. The present gauge is reputed to have been erected in A.D. 861 with its zero at the same level as a more ancient one whose readings have been preserved since A.D. 641. When the gauge was constructed, a reading of 16 cubits meant the lowest level at which flood irrigation could be insured everywhere. The level to-day is 201⁄2 cubits on the gauge and the difference between them is 1.22 metres. As 1,026 years have elapsed since the construction of the gauge it means a rise of 12 centimetres per 100 years. This is slightly under the rise calculated at Assuân by the French savants.
The following table gives the means of the maximum flood and low water levels per century:—
| 7th | century | 17.5 | R. L. flood | 11.0 | R. L. low water | 6.5 | Difference. |
| 8th | „ | 17.4 | „ | 11.1 | „ | 6.3 | „ |
| 9th | „ | 17.5 | „ | 11.2 | „ | 6.3 | „ |
| 10th | „ | 17.5 | „ | 11.3 | „ | 6.2 | „ |
| 11th | „ | 17.5 | „ | 11.4 | „ | 6.1 | „ |
| 12th | „ | 17.7 | „ | 11.5 | „ | 6.2 | „ |
| 13th | „ | 17.7 | „ | 11.6 | „ | 6.1 | „ |
| 14th | „ | 17.9 | „ | 11.7 | „ | 6.2 | „ |
| 15th | „ | 18.2 | „ | 11.8 | „ | 6.4 | „ |
| 16th | „ | 18.4 | „ | 11.9 | „ | 6.5 | „ |
| 17th | „ | 18.8 | „ | 12.0 | „ | 6.8 | „ |
| 18th | „ | 19.1 | „ | 12.1 | „ | 7.1 | „ |
| 19th | „ | 19.5 | „ | 12.2 | „ | 7.3 | „ |
It is evident from the above that the head of the Delta, or the bifurcation of the Nile, was much nearer to Cairo in early days than just now, and the last three centuries have seen great changes. The fall of watersurface is very considerable at every bifurcation, and the difference between mean high and low supply at the Barrage to-day is 6.0 metres against 7.2 metres at Cairo. Judging from the above figures, I should say that from the 7th to the 13th century the bifurcation was gradually approaching Cairo, while since the 13th it has been receding.
PLATE XII.
LONGITUDINAL SECTION of the NILE from ASSUAN to CAIRO
ALONG CENTRE LINE OF FLOOD
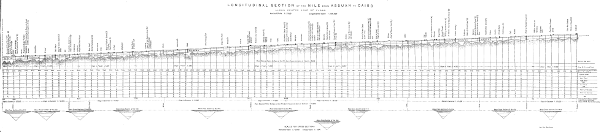
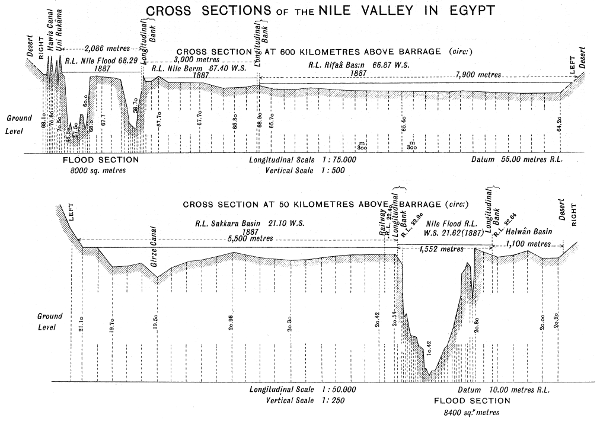
Lith. Sur. Dep. Cairo.
Larger longitudinal section (460 kB)
Larger cross sections (250 kB)
CROSS SECTIONS of the NILE VALLEY IN EGYPT
[51]
[52]
The following table gives the highest and lowest floods at Cairo in intervals of 25 years from A.D. 639 to A.D. 1904.
The gauges are in pics and kirats and are referred to mean low water or R. L. 12·25 metres above mean sea.
| Years A. D. |
HIGHEST MAXIMUM | LOWEST MAXIMUM | No of years recorded. |
Remarks. | ||||||||||
|---|---|---|---|---|---|---|---|---|---|---|---|---|---|---|
| Pics. | Kirats. | Metres R. L. |
Metres referred to zero at R. L. 12·25 |
Pics. | Kirats. | Metres R. L. |
Metres referred to zero at R. L. 12·25 |
|||||||
| 639 | - | 650 | 19 | .. | 18·16 | 5·91 | 14 | 21 | 16·74 | 4·49 | 11 | years | Max. year | 199 |
| 651 | - | 675 | 19 | 23 | 18·42 | 6·17 | 15 | 12 | 17·07 | 4·82 | 25 | „ | ||
| 676 | - | 700 | 18 | 17 | 18·08 | 5·83 | 13 | 6 | 15·87 | 3·62 | 25 | „ | ||
| 701 | - | 725 | 18 | 22 | 18·14 | 5·89 | 13 | 18 | 16·13 | 3·88 | 25 | „ | ||
| 726 | - | 750 | 18 | 13 | 18·04 | 5·79 | 14 | 1⁄2 | 16·28 | 4·03 | 25 | „ | ||
| 751 | - | 775 | 18 | 10 | 18·00 | 5·75 | 14 | 19 | 16·70 | 4·45 | 25 | „ | ||
| 776 | - | 800 | 18 | 4 | 17·93 | 5·68 | 14 | 1 | 16·29 | 4·04 | 25 | „ | ||
| 801 | - | 825 | 17 | 18 | 17·82 | 5·57 | 14 | 2 | 16·31 | 4·06 | 25 | „ | ||
| 826 | - | 850 | 17 | 12 | 17·76 | 5·51 | 13 | 5 | 15·85 | 3·60 | 25 | „ | ||
| 851 | - | 875 | 18 | 8 | 17·98 | 5·73 | 15 | 15 | 17·15 | 4·90 | 25 | „ | ||
| 876 | - | 900 | 17 | 22 | 17·86 | 5·61 | 14 | 22 | 16·76 | 4·51 | 25 | „ | ||
| 901 | - | 925 | 18 | 1 | 17·90 | 5·65 | 13 | 4 | 15·83 | 3·58 | 25 | „ | ||
| 926 | - | 950 | 19 | .. | 18·16 | 5·91 | 14 | 17 | 16·65 | 4·40 | 25 | „ | ||
| 951 | - | 975 | 18 | 5 | 17·94 | 5·69 | 14 | 19 | 16·60 | 4·45 | 24 | „ | ||
| 976 | - | 1000 | 26 | 23 | 21·65 | 9·40 | 15 | 2 | 16·85 | 4·60 | 25 | „ | ||
| 1001 | - | 1025 | 19 | 8 | 18·25 | 6·00 | 14 | 9 | 16·47 | 4·22 | 25 | „ | Min. year | 1070 |
| 1026 | - | 1050 | 18 | 6 | 17·95 | 5·70 | 15 | 9 | 17·01 | 4·76 | 25 | „ | ||
| 1051 | - | 1075 | 17 | 18 | 17·71 | 5·46 | 12 | 3 | 15·30 | 3·05 | 25 | „ | ||
| 1076 | - | 1100 | 18 | 16 | 18·07 | 5·82 | 13 | 17 | 16·11 | 3·86 | 24 | „ | Min. year | 1199 |
| 1101 | - | 1125 | 19 | 1 | 18·17 | 5·92 | 16 | 12 | 17·48 | 5·23 | 25 | „ | ||
| 1126 | - | 1150 | 18 | 18 | 18·09 | 5·84 | 16 | 9 | 17·45 | 5·20 | 24 | „ | ||
| 1151 | - | 1175 | 18 | 18 | 18·09 | 5·84 | 15 | 1 | 16·83 | 4·58 | 25 | „ | ||
| 1176 | - | 1200 | 18 | 14 | 18·05 | 5·80 | 12 | 21 | 15·68 | 3·43 | 25 | „ | ||
| 1201 | - | 1225 | 18 | 8 | 17·98 | 5·73 | 15 | 7 | 16·96 | 4·71 | 25 | „ | Max. year | 1359 |
| 1226 | - | 1250 | 18 | 8 | 17·98 | 5·73 | 14 | .. | 16·27 | 4·02 | 25 | „ | ||
| 1251 | - | 1275 | 18 | 17 | 18·08 | 5·83 | 16 | 12 | 17·48 | 5·28 | 23 | „ | ||
| 1276 | - | 1300 | 19 | 7 | 18·24 | 5·99 | 15 | 18 | 17·22 | 4·97 | 25 | „ | ||
| 1301 | - | 1325 | 18 | 19 | 18·10 | 5·85 | 16 | 2 | 17·37 | 5·12 | 25 | „ | ||
| 1326 | - | 1350 | 18 | 21 | 18·13 | 5·88 | 16 | 5 | 17·40 | 5·15 | 25 | „ | ||
| 1351 | - | 1375 | 24 | .. | 20·05 | 7·80 | 16 | 18 | 17·55 | 5·30 | 24 | „ | ||
| 1376 | - | 1400 | 20 | 3 | 18·46 | 6·21 | 16 | 13 | 17·50 | 5·25 | 25 | „ | Max. year | 1587 |
| 1401 | - | 1425 | 20 | 12 | 18·56 | 6·31 | 16 | 13 | 17·50 | 5·25 | 24 | „ | ||
| 1426 | - | 1450 | 20 | 21 | 18·67 | 6·42 | 15 | 7 | 16·96 | 4·71 | 23 | „ | ||
| 1451 | - | 1475 | 18 | 8 | 17·98 | 5·73 | .. | .. | .. | .. | 1 | „ | ||
| 1476 | - | 1500 | 20 | 21 | 18·67 | 6·42 | 19 | 17 | 18·55 | 6·30 | 2 | „ | ||
| 1501 | - | 1525 | 20 | 16 | 18·61 | 6·36 | 16 | .. | 17·35 | 5·10 | 19 | „ | ||
| 1526 | - | 1550 | .. | .. | .. | .. | .. | .. | .. | .. | .. | |||
| 1551 | - | 1575 | .. | .. | .. | .. | .. | .. | .. | .. | .. | |||
| 1576 | - | 1600 | 26 | .. | 21·13 | 8·88 | 18 | 8 | 17·98 | 5·73 | 11 | years | ||
| 1601 | - | 1625 | 24 | 5 | 20·16 | 7·91 | 17 | 23 | 17·88 | 5·63 | 19 | „ | „ | 1602 |
| 1626 | - | 1650 | 19 | .. | 18·16 | 5·91 | 15 | .. | 16·81 | 4·56 | 3 | „ | Max. year | 1669 |
| 1651 | - | 1675 | 22 | .. | 18·97 | 6·72 | .. | .. | .. | .. | 1 | „ | ||
| 1676 | - | 1700 | 24 | .. | 20·05 | 7·80 | 22 | .. | 18·97 | 6·72 | 3 | „ | „ | 1697 |
| 1701 | - | 1725 | 23 | 4 | 19·60 | 7·35 | 16 | .. | 17·35 | 5·10 | 18 | „ | Max. year | 1738 |
| 1726 | - | 1750 | 24 | 12 | 20·32 | 8·07 | 20 | 14 | 18·58 | 6·33 | 24 | „ | ||
| 1751 | - | 1775 | 24 | 12 | 20·32 | 8·07 | 18 | 17 | 18·08 | 5·83 | 25 | „ | „ | 1756 |
| 1776 | - | 1800 | 24 | .. | 20·05 | 7·80 | 12 | 12 | 15·49 | 3·24 | 25 | „ | „ | 1779 |
| 1801 | - | 1825 | 22 | .. | 18·97 | 6·72 | [5]8 | .. | 13·14 | 0·89 | 3 | „ | Min. year | 1809 |
| 1826 | - | 1850 | 24 | 9 | 20·26 | 8·01 | 18 | 23 | 18·15 | 5·90 | 25 | „ | Max. year | 1850 |
| 1851 | - | 1875 | 26 | 12 | 21·40 | 9·15 | 19 | 13 | 18·30 | 6·05 | 25 | „ | „ | 1874 |
| 1876 | - | 1900 | 26 | 6 | 21·27 | 9·02 | 17 | 3 | 17·65 | 5·40 | 25 | „ | „ | 1878 |
| 1901 | - | 1904 | .. | .. | 19·18 | 6·93 | .. | .. | 18·02 | 5·97 | 4 | „ | Min. year | 1877 |
[5] There is an error here in the records.
At Assuân the Nile has a mean range of 7.90 metres between high and low supply, with a maximum of 9·80 metres and a minimum of 6.40 metres. The high supply varies between 13,200 and 6,500 cubic metres per second, with a mean of 10,000 cubic metres per second, while the low supply varies between 350 and 1400 cubic metres per second with a mean of 590 cubic metres per second. September is generally the highest month and May the lowest. The mean low water level is R. L. 85.00.
At Cairo the Nile has a mean range of 7·00 metres with a maximum of 9·6 metres and a minimum of 5·3 metres. The high supply varies between 12,000 and 4,800 cubic metres per second with a mean of 7,600 cubic metres per second, while the low supply varies between 1,300 and 250 cubic metres per second, with a mean of 500 cubic metres per second. October is the highest month and June the lowest. The mean low water level is at R. L. 12·25.
PLATE XI.
CROSS SECTIONS of the NILE & its TRIBUTARIES
Horizontal Scale 1 : 2.000
Vertical Scale 1 : 500
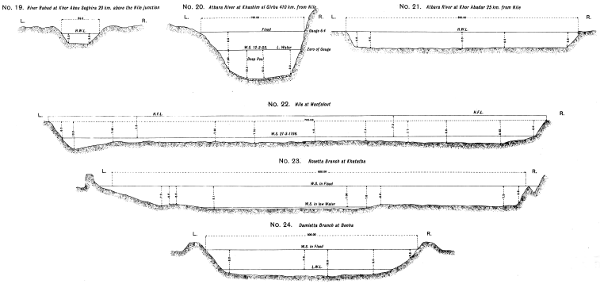
Lith. Sur. Dep. Cairo.
Larger cross sections (140 kB)
| No. | 19. | River Rahad at Khor Abou Seghire 20 km. above the Nile junction |
| No. | 20. | Atbara River at Khashim al Girba 410 km. from Nile |
| No. | 21. | Atbara River at Khor Abadar 25 km. from Nile |
| No. | 22. | Nile at Manfalout |
| No. | 23. | Rosetta Branch at Khatatba |
| No. | 24. | Damietta Branch at Benha |
[53]
Tables 41 to 52 refer to the Nile between Assuân and the Barrage at the head of the Delta proper.
Table 46 gives the Reduced Level of the mean low water level of the Nile at various points between Assuân and Cairo. If, for example, it is known that the water surface at any time of the year at Assiout is R. L. 50.80, we know the mean low water by the Irrigation Department levels is 45.05. The gauge is therefore 5.75, and by turning to Table 37 we know the discharge.
Table 37 gives the discharges of the river for gauges referred to the mean low water level. Between Esna and Kena the table is in excess of the truth, and between Assiout and Beni-Suef it is slightly under. Taken all round the table is reliable, calculated from the means of hundreds of discharges and carefully prepared.
Table 45 gives the slope of the water surface of the Nile in flood and in summer between Assuân and Cairo. Owing to the more winding track of the low supply than of the flood waters, the former is 948 kilometres and the flood 900. The slope in summer is 1⁄13000 and in high flood 1⁄12200.
The other tables need no explanation.
—Plates XVII and XVIII give longitudinal sections of the two branches of the Nile and their cross sections are given on Plate XI.
During winter, summer, and low floods, regulation at the Barrage interferes with the natural discharges of the two branches. The Damietta branch is gradually silting up and decreasing in size, while the Rosetta branch scours in high floods. The mean width of the Rosetta branch is 500 metres, and the mean area of the section in flood is 4000 square metres. The mean width of the Damietta branch is 270 metres and the mean section 2700 square metres. The mean velocity of the floods range from 1.00 metre to 1.60 metres per second. In summer the branches are hermetically closed at their heads and receive only the water which filters into them from the subsoil. This in the Rosetta branch amounts to 20 cubic metres per second, and less in the Damietta branch. It may be noted here that at Cairo the girder bridge at Kasr-el-Nil is 403 metres between the abutments and the smaller bridge is 178 metres, making a total width of 581 metres.[54] The width of the Kafr Zayat bridge on the Rosetta branch is 530 metres, while the old Benha bridge on the Damietta branch is 285 metres. The average depth of water in flood in the two branches may be taken as 7 metres.
The barrage at the head of the Rosetta branch has 61 openings of 5 metres each and one lock 15 metres wide and the other 12 metres. They are all open in high flood. The Damietta barrage has 61 openings of 5 metres and one lock of 12 metres. The depth of water in a high flood is 9 metres. The Rosetta barrage has 10 openings too few, and the Damietta barrage 15 openings too many.
Before the construction of the Barrage in the middle of the 19th century, the maximum discharges of the two branches at the head of the Delta were nearly the same. A little lower down, however, the Rosetta branch had considerably more water than the Damietta. About 2 kilometres below the Barrage there was a branch called the Shalakan branch which flowed from the Damietta into the Rosetta branch. About 20 kilometres below the Barrage, the Bahr Ferounieh took about 1⁄3 the total discharge of the Damietta branch and led it into the Rosetta branch. Both these were closed by Mehemet Ali, while at the same time the Bahrs Sirsawiah, Baguria, Shebin, Khadrawiah, Moes, Um-Salama, Bohia and Sogair were also completely closed or provided with regulating heads, which very considerably diminished their discharge. During the time that they had been open the Damietta branch had lost water at every kilometre as it approached the sea, and though 400 metres wide at the head it had a channel only 200 metres wide in its lower reaches. The Rosetta branch on the other hand received the tail waters of many Bahrs and had only one escape, the Bahr Saidi near its tail.
The closing of so many escapes on the Damietta branch has caused this branch in its upper reaches to carry so much water that its tail reaches can not carry it without having the surface of the water raised inordinately and dangerously above the level of the country. An examination of the longitudinal sections will show that while the Rosetta branch in its middle reaches is from 1.50 to 2.00 metres above the level of the country in a high flood, the Damietta branch is from 2.50 to 3.00 metres. They will also show how the slope in the early reaches of the Damietta branch is considerably less than that in the early reaches of the Rosetta branch, which results in the gradual silting up of the former as already noted. The Karanain regulator at the head of the old Bahr Shebin, taking from the Damietta branch below the Bahr Ferouniah, was built in 1842 by Linant Pasha, with its wing wall 60 centimetres higher than any previous flood. By 1870 the Damietta branch had risen 70 centimetres above the wing wall as measured by Linant Pasha. In 1878, though the Damietta branch was relieved by the Gizeh breach in the left bank of the Main Nile which drained into the Rosetta branch, the flood water surface of the Damietta branch at Karanain was 1.50 metres above the wing wall.
PLATE XVII.
LONGITUDINAL SECTION of the ROSETTA BRANCH
Longitudinal Scale 1 : 100,000
Vertical Scale 1 : 1,000
Measurement along the right bank
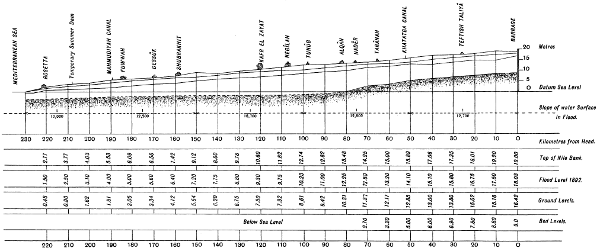
Larger longitudinal section (140 kB)
PLATE XVIII.
LONGITUDINAL SECTION of the DAMIETTA BRANCH
Longitudinal Scale 1 : 100,000
Vertical Scale 1 : 1,000
Measurement along the left bank
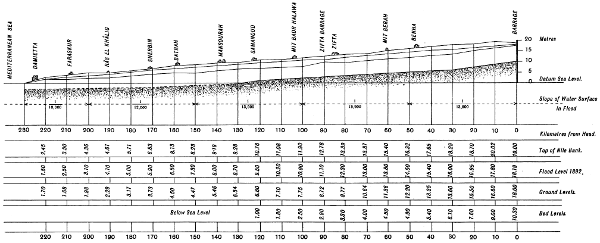
Larger longitudinal section (130 kB)
[55]
The maximum, minimum and mean floods in the Rosetta branch are 6,500, 2,600 and 4,000 cubic metres per second. In the Damietta branch they are 4,600, 1,300 and 2,300 cubic metres per second respectively.
[56]
—We are now in a position to apply our knowledge of the Nile and its tributaries to an examination of the behaviour of the rivers in flood and in time of low supply. Lake Victoria, the Victoria Nile, and Lake Albert may all be considered as the great equatorial regulators of the Nile. The river, as a river, begins at the outlet of Lake Albert, i.e., at the head of the Albert Nile. Generally at its lowest in April, it rises gradually and reaches its maximum in November. The mean minimum of 600 cubic metres per second is gradually increased to its mean maximum of 900 cubic metres. The regulating effect of the lakes is very evident.
Between Lake Albert and Gondokoro the heavier rains begin late in April and with a break in June and July continue to November. The mean minimum discharge of 600 cubic metres per second in April is increased by alternating rises and falls to the mean maximum of 1600 cubic metres per second in September, which has disappeared by the end of November, when the water of Lake Albert alone remains in the river.
The Gazelle river in no way affects the flood or the low supply. Its great function is to maintain the levels of the great swamps between latitudes 7° and 9°, saturate the soil, and prevent the complete disappearance of the waters of the Albert Nile between January and May. The functions this river performs are humble ones, but deprived of its aid, the Nile north of Khartoum would frequently be dry in April and May.
The Albert Nile at its tail just upstream of the mouth of the Sobat is at its lowest in April and May with a mean low discharge of 375 cubic metres per second, when it is joined by the Sobat river with an approximate mean low discharge of 125 cubic metres per second; making a joint discharge for the head of the White Nile of 500 cubic metres per second as a mean minimum. Now begins one of the most interesting operations of any in the whole valley of the Nile, exceeded only in interest by what happens at Khartoum lower down. The Albert Nile and the Sobat river both rise together, the Albert Nile on a very gentle slope freely overflowing its banks in the Sudd region,[57] and the Sobat river confined within its channel during its highest floods. The White Nile has a very gentle slope, little carrying capacity and is quite incapable of taking on both floods. The water rises at the junction and the Sudd region becomes a reservoir flooded to a depth of 3 metres. As the Sobat river increases its discharge gradually from 75 cubic metres per second in April to 1000 cubic metres per second in October and November (for it is confined to its channel), the Albert Nile decreases the actual discharge it sends down the White Nile and increases what it spreads over the Sudd region. The Albert Nile, having increased its quota for the White Nile from 375 in April to 450 cubic metres per second in September, gives less in October and November and gradually passes on its waters in December, January and February when the Sobat has fallen.
The White Nile at its head near Tewfikieh has its mean minimum of 500 cubic metres per second in April, and increases slowly to its mean maximum of 1500 cubic metres per second in December. During this interval its water surface is raised by 3·50 metres. This water travels very slowly on to Khartoum, where the mean minimum is 450 cubic metres per second in May, the slope is very insignificant, and the trough of the river is 1500 metres wide.
At Khartoum the White Nile meets the Blue Nile. No greater contrast exists in the world. If maximum discharges are alone considered, the little finger of the Blue Nile is thicker than the loins of the White Nile.
The Blue Nile is at its lowest on the 1st May with a mean minimum supply of 200 cubic metres per second rising to a mean maximum flood of 10,000 cubic metres per second on the 1st September. The flood has fallen to 2000 cubic metres per second by the middle of November.
Up to the middle of July the Blue and White Niles keep increasing their discharges steadily at Khartoum, but after that date the Blue Nile gauge and discharge rise rapidly together, and the Blue Nile not only feeds the Main Nile, but flows up the White Nile and arrests its discharge, so that at Duem, 200 kilometres above Khartoum, the White Nile discharge decreases in July and August while the Blue Nile is steadily flowing up the White Nile valley and converting it into a reservoir for the Nile in winter. It is only after the 15th September, when the Blue Nile has begun to fall steadily and continuously that the White Nile discharge really commences and reaches its mean maximum of some 2000 cubic metres per second in October.
[58]
The mean minimum discharge of the Nile of 650 cubic metres per second at Khartoum is obtained on the 1st May and the mean maximum of 9000 cubic metres per second on the 1st September. Fed by the White Nile reservoir the river falls comparatively slowly. Whether this peculiar relation of the two rivers to each other could not be taken advantage of to increase the supply in December, January and February, and decrease it in October and November by means of a regulating dam built across the White Nile at Khartoum is worthy of study.
I greatly prefer the idea of storing the flood waters of the White Nile at Khartoum to any storage of the Albert Nile water above the junction of the Sobat river. A regulator above the Sobat junction would store up a very considerable quantity of water, but the quality would be very doubtful and possibly dangerous to health.
At El Damer, south of Berber, the Atbara flows into the Nile. Dry from January to May, the flood begins in June and is at its maximum as a rule in the last week of August; with a mean high flood discharge of 3500 cubic metres per second. This water cannot come on to Assuân without filling up the 200 kilometres downstream of the 6th cataract where the slope of the Nile is gentle and the river lends itself to being used as a reservoir. It is owing to the fact that none of the main feeders of the Nile flow in immediately below cataracts that the rise and fall of the Nile in Egypt, is so regular and constant. If the Sobat, Blue Nile and Atbara all flowed into the White or Main Niles below cataracts we should have floods in Egypt whose sudden changes of level and fluctuations would be an unending source of danger to the country.
It is owing to the earliness of the Atbara high flood and the comparative lateness of the Nile high flood, that the ordinary maximum discharge of the Nile at Assuân is only 10,000 cubic metres per second. This is generally on the 5th September. When the monsoon is early the maximum at Assuân is reached before or on the 5th September; when the monsoon is late the maximum is reached about the 20th September. An early maximum at Assuân is generally followed by a low summer, while a late maximum is generally followed by a high summer supply. Only once has this rule been broken and that was in 1891 when there were two maxima, one on the 4th September and another on the 27th. In this year there must have been an extraordinary fall of rain in Abyssinia in September, for the flood of the 27th September was very muddy, while as a rule the river at Assuân is very muddy in August, less so in September, still less so in[59] October and much less in November when the White Nile is the ruling factor in the supply of the river.
If the September rains in Abyssinia are very heavy, an ordinary flood passes Assuân at the end of September and is disastrous for Egypt. This happened in 1878. Table 26 contains details of this flood, of the minimum flood year 1877 and the mean of the 20 years from 1873 to 1892.
At Assuân the Nile enters Egypt, and it now remains to consider it in its last 1,200 kilometres. The mean minimum discharge at Assuân is 590 cubic metres per second and is reached about the end of May. The river rises slowly till about the 20th July and then rapidly through August, reaching its maximum about the 5th September, and then falling very slowly through October and November. The deep perennial irrigation canals take water all the year round, but the flood irrigation canals are closed with earthen banks till the 15th August, and are then all opened. These flood canals, of which there are some 45, are capable of discharging 2,000 cubic metres per second at the beginning of an ordinary year, 3,600 cubic metres per second in a maximum year, and have an immediate effect on the discharge of the Nile. The channel of the Nile itself and its numerous branches and arms consume a considerable quantity of water (the cubic contents of the trough of the Nile between Assuân and Cairo are 7,000,000,000 cubic metres), the direct irrigation from the Nile between Assuân and Cairo takes 50 cubic metres per second, 130 cubic metres per second are lost by evaporation off the Nile, and 400 cubic metres per second by absorption. Owing to all these different causes, there is the net result that, from August 15th to October 1st, the Nile is discharging 2,400 cubic metres per second less at Cairo than Assuân. During October and November the flood canals are closed, and the basins which have been filled in August and September discharge back into the Nile, and in October the Nile at Cairo is discharging 900 cubic metres per second in excess of the discharge at Assuân and 500 cubic metres per second in excess in November.
The mean minimum discharge at Cairo is 500 cubic metres per second and is attained on the 15th of June; the river rises slowly through July and fairly quickly in August, and reaches its ordinary maximum on the 1st October when the basins are full and the discharge from the basins is just beginning. The ordinary maximum discharge at Cairo is about 7,600 cubic metres per second.[60] Through October the Nile at Cairo is practically stationary, and falls rapidly in November.
North of Cairo are the heads of the perennial canals which irrigate the Delta proper. The canals, with their feeders lower down, discharge 1,200 cubic metres per second, and the ordinary maximum flood at Cairo of 7,600 cubic metres per second is reduced by this amount between Cairo and the sea. Of the 6,400 cubic metres per second which remain, 4,100 cubic metres per second find their way to the sea down the Rosetta branch, and 2,300 cubic metres per second down the Damietta branch. During extraordinary floods the Damietta branch has discharged 4,300 cubic metres per second and the Rosetta branch 7,000 cubic metres per second.
—We have so far considered the Nile in flood, it now remains to quickly dispose of the low supply. After reaching its maximum, the Atbara, which is a torrential river, falls more rapidly than others, and by the end of September has practically disappeared; after the middle of September the Blue Nile falls quickly, while the White Nile with its large basin, gentle flow and numerous reservoirs, falls very deliberately. The mean minimum discharge of the White Nile at Gondokoro in an ordinary year, at the time of low supply, is 600 cubic metres per second. Of the Sobat river it is 100 cubic metres per second. By the time the water reaches Khartoum it is reduced to 450 cubic metres per second. The mean low supply of the Blue Nile is 200 cubic metres per second, giving a mean low supply to the Nile at Khartoum of 650 cubic metres per second. The Atbara supplies nothing. Between Khartoum and Assuân there is a further loss of 60 cubic metres per second, and the mean low supply delivered at Assuân is 590 cubic metres per second. In very bad years the discharge at Assuân has fallen to 400 cubic metres per second.
Lombardini was no untrue prophet when he wrote that he was convinced that the more carefully the discharges were taken and the results known, the more would engineers be astonished at the extraordinary amount of the subsoil water which filtered into the Nile from the head of the White Nile to the sea, and which gave back to the Nile in the months of deflux of the river, the water which had percolated into the soil during the afflux. He predicted that heavy as the evaporation was in April, May and June in the Nile valley, the influx of subsoil water would be found to counterbalance it. When we calculate the extent of the water used in irrigation along the[61] course of the Nile, and compare the discharges at Tewfikieh, Khartoum, Assuân, Cairo and at the tails of the Rosetta and Damietta branches during the time of low supply we can only admire the perspicacity of the greatest hydraulic engineer of the last century.
—For the following information I am principally indebted to M. J. Barois’ “Les irrigations en Egypte” just published, and to an article by Mr G. P. Foaden in the Journal of the Khedivial Agricultural Society for January 1903. The colour of Nile water is generally a pale yellow, but in June, when the first indications of the coming flood are given by a continuous gentle rise of the river from its minimum gauge, the water changes to green and remains so for two or three weeks. This green water has a very disagreeable taste and odour, and is especially objectionable when the Nile has been very low and the rise is a slow one. In June 1900 it was extraordinarily bad, and the river water was so poor in oxygen that standing on Kasr-el-Nil bridge at Cairo one could see the surface of the water covered with fish which apparently could only live near the surface. In the deep reaches near Kalabsha in Nubia, the fish died in myriads. This green water is attributed by some to the immense amount of vegetable matter brought down by the White Nile from the Sudd region. Some say that it comes principally with the first rise of the Sobat river. But the generally accepted theory to-day is that the green water is the result of vegetable growths from germs is the water itself, and that wherever or whenever the current becomes exceedingly slack they multiply greatly. Upstream of the Assuân dam in June 1903 the water was extraordinarily green and exceedingly objectionable. As it was shot out of the upper sluices of the dam and broken up into spray on the downstream side of the dam it became so purified that I found it difficult to understand that the water flowing past Elephantine Island was what I had seen at Shellal. The green water is followed by the red water of the Nile flood, which has always thoroughly established itself at Cairo by the 1st of August. This red water comes from the scourings of the volcanic plateau of Abyssinia by the Blue Nile and the Atbara. Rich in mud and rich in manures, this red water is the creator of Egypt. Egypt is nothing more than the deposit left by the Nile in flood. The water is most heavily charged with detritus in August, less in September, and still less in October.
Many analyses have been made of Nile water. Following M. Barois, I place side by side the analysis of Dr. Letheby of 1874/75 and[62] Dr. Mackenzie of 1896/97/98. The year 1874 was an extraordinarily high flood.
| Month. | PARTS IN 100,000 OF WATER | ||
|---|---|---|---|
| Dr. Mackenzie. |
Dr. Letheby. |
The Mean of the two |
|
| January | 31·0 | 16·7 | 27·4 |
| February | 25·3 | 12·6 | 22·1 |
| March | 12·7 | 5·3 | 10·9 |
| April | 15·8 | 6·6 | 13·5 |
| May | 14·7 | 4·8 | 12·2 |
| June | 14·1 | 6·9 | 12·3 |
| July | 13·9 | 17·8 | 14·8 |
| August | 159·0 | 149·2 | 156·6 |
| September | 156·1 | 53·3 | 130·4 |
| October | 110·0 | 37·8 | 92·8 |
| November | 70·8 | 34·4 | 61·7 |
| December | 47·0 | 28·9 | 42·4 |
| Mean | 56·0 | 31·3 | 49·8 |
From this last column M. Barois concludes that in high floods 100,000,000 tons of solid matter pass Assuân, and 88,000,000 in mean floods. It is unfortunate that we have no analyses of low floods like 1877, 88, 99, 1902 and 1904 which were extraordinarily muddy. The water had little sand but much mud. The sand is scoured out of the bed of the river itself in high floods.
After Dr. Letheby the composition of Nile deposit is as follows:—
| In flood. |
In low supply. |
|
|---|---|---|
| Organic matter | 15·02 | 10·37 |
| Phosphoric acid | 1·78 | ·57 |
| Lime | 2·06 | 3·18 |
| Magnesia | 1·12 | ·99 |
| Potash | 1·82 | 1·06 |
| Soda | ·91 | ·62 |
| Alumina and oxide of iron | 20·92 | 23·55 |
| Silica | 55·09 | 58·22 |
| Carbonic acid and loss | 1·28 | 1·44 |
| Total | 100·00 | 100·00 |
[63]
Comparative analyses of subsoil water in Egypt and Nile water in time of low supply are given below.
| Dissolved matter. | PARTS IN 100,000 | |
|---|---|---|
| Well water. |
Summer water in Nile. |
|
| Lime | 16·56 | 4·24 |
| Magnesia | 4·53 | 1·00 |
| Soda | 8·20 | 6·20 |
| Potash | ·37 | 1·44 |
| Chlorine | 13·60 | ·67 |
| Sulphuric acid | 5·93 | 2·16 |
| Nitric acid | ·17 | Traces |
| Silica, alumina and oxide of iron | 1·80 | ·97 |
| Organic Matters | ·60 | 1·75 |
| Carbonic oxide and loss | 12·26 | 4·03 |
| 64·02 | 22·46 | |
It must be remembered that Nile water in the time of low supply consists in a very appreciable part of subsoil water which has filtered into the Nile.
Mr. Foaden states that, speaking in round numbers, we may say that Nile deposit in flood contains
| Nitrogen | ·1 | per cent |
| Phosphoric acid | ·2 | „ |
| Potash | ·6 | „ |
He values the manure deposited by the Nile annually in a well irrigated basin at £·75. He concludes that Nile water in flood is rich in potash, fairly rich in phosphoric acid and poor in nitrogen.
—According to numerous analyses made of Egyptian soil in 1872 by MM. Payen, Champion and Gastinel, the soil of Egypt consists of
| Silica | 45 | per cent | ||
| Argile | 53 | „ | ||
| Magnesia | ·2 | to | 1·6 | „ |
| Lime | 1·3 | to | 4·9 | „ |
| Nitrogen | ·03 | to | ·10 | „ |
| Phosphoric acid | ·03 | to | ·32 | „ |
Some stiff soils contain 84 per cent argile and some light soils contain 68 per cent sand. As one approaches the Mediterranean the quantity of chloride of soda increases and runs from a fraction to 4, 5, and even 10 per cent.
[64]
From the means of ten samples of soil from Kena Mudirieh analysed for me in May by Mr. Frank Hughes of the Agricultural Society we gather that the constituents of the soil are as follows:—
| Ingredients. | Max %. |
Min %. |
Mean %. |
|---|---|---|---|
| Silica etc., insoluble in strong acid | 66 | 53 | 60 |
| Total Lime | 3·80 | 2·50 | 3·34 |
| Total Potash | 1·19 | ·46 | ·74 |
| Total Potash available | ·072 | ·020 | ·042 |
| Total Phosphoric Acid | ·49 | ·20 | ·35 |
| Total Phosphoric available | ·090 | ·029 | ·066 |
| Carbonic Acid = Chalk | 3·52 | 1·79 | 2·69 |
| Nitrogen | ·106 | ·056 | ·084 |
We have here a general sufficiency of phosphoric acid, plenty of potash and lime, and a low proportion of nitrogen.
The salts of the soil, when in excess, are chlorides and sulphates of soda: the carbonates are present in very small quantities indeed.
The following selection from a paper by Mr. Lang Anderson in the December 1903 number of the Journal of the Khedivial Agricultural Society is interesting.
“Voelcker’s analyses of the two samples of soil taken from the drained bed of what was Lake Edku near Alexandria give the following results:—
| No. 1. | No. 2. | ||
|---|---|---|---|
| Oxide of iron | 11·69 | 11·04 | |
| Iron pyrites | 0·08 | 0·11 | |
| Aluminium | 6·36 | 10·88 | |
| Lime | 2·08 | 7·73 | |
| Magnesia | 1·79 | 0·93 | |
| Soda | 0·79 | .. | |
| Sodium chloride | 8·11 | 8·56 | |
| Potash | 0·65 | 1·23 | |
| Sulphuric acid | 2·23 | 2·56 | |
| Carbonic acid | 0·19 | 4·75 | |
| Phosphoric acid | 0·16 | 0·19 | |
| Insoluble silicates and sand | 62·23 | 45·81 | |
| Organic matter | 3·64 | 6·21 | |
| Total | 100·00 | 100·00 | |
| Containing nitrogene | 0·035 | 0·070 | |
| „ ammonia | 0·042 | 0·079 | ” |
[65]
—Considering the times of flood and low supply, the climate of Egypt, the turbidity of the Nile flood, and the deltaic formation of the Nile valley, no better system than basin irrigation as practiced in Egypt could possibly have been devised. If the flood had come in April and May and been followed by a burning summer, or if the actual autumn floods had been followed by the frozen winters of Europe or the warm winters of the Sudan, basin irrigation would have been a failure or a very moderate success; but, given the Egyptian climate, basin irrigation has stood without a rival for 7000 years.
Basin irrigation, as it has been practised in Egypt for thousands of years, is the most efficacious method of utilising existing means of irrigation which the world has witnessed. It can be started by the sparsest of populations. It will support in wealth a multitude of people. King Menes made his first dyke when the Egyptian nation was in its infancy. Egypt, in Roman times, supported a population twice as dense as that of to-day. The direct labour of cultivation is reduced to an absolute minimum.
Shakespeare’s genius has crystallised the system for all time:—
If we cast back our view to the dawn of Egyptian history, we can picture the Nile Valley as consisting of arid plains, sand dunes, and marshy jungles, with reclaimed enclosures on all the highest lands. Every eight or ten years the valley was swept by a mighty inundation. The seeds of future success lay in the resolve of King Menes’ engineers to confine their attention to one bank of the river alone. It was the left bank of the river which history tells us was first reclaimed. A longitudinal dyke was run parallel to the stream, and cross dykes tied it to the Lybian hills. Into these basins or compartments the turbid waters of the flood were led by natural water-courses and artificial canals and allowed to deposit their rich mud and thoroughly saturate the soil; and meantime the whole of the right bank and the trough of[66] the river itself were allowed to be swept by the floods. It must have been on this wild eastern bank that were conducted all the hippopotamus hunts which are crowded on the wall pictures of buildings of the early dynasties. In all probability, the first six dynasties contented themselves with developing the left bank of the Nile. As, however, the population increased, and with it the demand for new lands, it became necessary to reclaim the right bank of the river as well. The task now was doubly difficult, as the river had to be confined to its own trough. This masterful feat was performed by the great Pharaohs of the XIIth Dynasty, the Amenemhats and the Usartsens, who, under the name of Sesostris, usurped the place of Menes in the imagination of the ancient world. They were too well advised to content themselves with repeating on the right bank what Menes had done on the left. By suddenly confining the river they would have exposed the low-lying lands of Memphis and Lower Egypt to disastrous inundations. To obviate this, they widened and deepened the natural channel which led to the Fayoum depression in the Lybian hills, and converted it into a powerful escape to carry off the excess waters of high floods; and so successful were they in their undertakings that the conversion of the Fayoum depression into Lake Mœris was long considered by the ancient world as one of its greatest wonders. They led the flood into the depression when it was dangerously high, and provided for its return to the river when the inundation had come to an end. By this means, they insured the lake against being at a high level during a period of flood. The gigantic dykes of entry and exit were only cut in times of emergency, and were reconstructed again at an expense of labour which even an Egyptian Pharaoh considered excessive. To understand how capable Lake Mœris was to control the floods, and turn a dangerous into a beneficial inundation, I should recommend a study of Sir Hanbury Brown’s “Fayoum and Lake Mœris.” As years rolled on the Nile widened and deepened its own trough, to which it was now confined; and, eventually, the time came when Lake Mœris could be dispensed with without danger. It was gradually reclaimed and converted into the Fayoum with its 350,000 acres of cultivated land.
Basin irrigation holds the flood waters for some 45 days per annum over the whole of the valley. The water is in places 3 metres deep, and in others only 30 centimetres deep, while the average depth is about 1 metre. Now the retention of this water over the land for a period of six weeks permits of the thorough saturation of the subsoil in places where the subsoil is of proper consistency; and this water can be drawn on, in winter and summer, for maturing certain crops and growing others. It was where the subsoil gave a plentiful supply of water, and permitted of intense cultivation throughout the year, that we find all the ancient capitals of Egypt. Abydos has the finest subsoil water in the Nile Valley; Memphis has an excellent supply; while Thebes has the only good subsoil water on the whole of the right bank. Good subsoil water was to the ancient Egyptian world what the presence of a rich gold mine is to one of our new colonies.
[67]
Subsoil water supplies the link between basin and perennial irrigation. It explains the reason why modern Egypt is not satisfied with the irrigation which has come down from the remotest antiquity, but is desirous of conferring on the length and breadth of the Nile Valley those advantages which gave Abydos, Memphis, and Thebes their pre-eminence in the past. Any country which possesses rivers and streams whose waters are in flood for six weeks per annum at a suitable season of the year can betake itself to basin irrigation with more or less profit. The science of dams, weirs, and regulators has received such development during recent years that there can be no problem so difficult that it cannot be solved by experience and originality. Basin irrigation allows of the thorough development of countries whose streams have short and turbid floods which precede a fairly cool season; whether such irrigation be the stately irrigation of the Nile Valley, perfected by the science and experience of 7,000 years; or the less perfect, but still highly developed and river-fed tank systems of Madras; or the primitive, but effective basins of Bundelkund, where the impounded water irrigates the crops on the down-stream sides of the basins for one season, and then allows of the basins themselves being dried and cultivated in the next.
The Nile in high flood rises 10 metres above its bed, in a mean flood 9 metres and in a poor flood 71⁄2 metres. The beds of the main basin canals are about 41⁄2 metres, and the cultivated land at the river’s edge about 9 metres above the river-bed. The basins have an average area of 7,000 acres. Where the valley is narrow, they average 2,000 acres each, and where it is wide 20,000 acres; while some of the tail basins are 40,000 acres in extent. Each canal has about seven or eight basins depending on it, of which the last is always the largest. There are masonry regulators at the canal heads, at each crossing of[68] the cross banks, and at the tail escapes into the river. In the more perfect basins the canals and escapes syphon under one another and overlap and supply each other’s deficiencies, so as to meet the requirements of every kind of flood which Egypt can experience. Colonel Ross’s work on the basin irrigation of Egypt is a monument of patient observation and a storehouse of information. Some of the canals like the Sohagia on Plate XIV are veritable rivers, discharging 450 cubic metres per second; but a good average canal discharges 30 cubic metres per second. The largest canal has a width of 75 metres, while the average width is 9 metres. Good basin canals discharge in an average year one cubic metre per second per 700 acres. Forty-five days suffice for a perfect irrigation. The cost of providing basin irrigation in Egypt for basins of 10,000 acres may be taken at £3 per acre thus made up:—Banks, £1·50.; canals, £·75.; masonry works, £·50.; and bank protection, £·25. If the basins are under 5,000 acres, the cost will be nearly double this. The annual cost of maintenance is £·10 per acre; while the lands themselves are rented at £3 per acre. In well irrigated basins no manures are needed, and alternate crops of cereals and legumins have been reaped for centuries without the land having been exhausted in any way whatever. Where the subsoil water is good and double cropping resorted to, then manures have to be applied.
—The foundation-stone of the conversion of the whole of Egypt from basin to perennial irrigation was laid by Mehemet Ali in 1833, when he began the construction of the Barrages across the Nile branches north of Cairo. These weirs were intended to raise the summer level of the Nile by 3 metres. As the ordinary summer level of the Nile was 1.50 metres above its bed, the weirs were expected to raise it 4.50 metres above the Nile bed. The old basin canals had to be considerably deepened to take in the summer supplies; while in other parts new perennial canals were dug. Perennial irrigation requires canals capable of discharging 1 cubic metre per second per 3500 acres, as against 700 acres for basin irrigation. Some of the perennial canals are very capacious. The two largest discharge 700 and 450 cubic metres per second respectively. There are no artificial canals in the world like them. All the canals are liberally provided with regulators and locks. The energies of the Irrigation Department during the last ten years have been chiefly directed to the provision of sufficient drains to meet that over-saturation of the soil, which all but the best regulated perennial irrigation invariably entails. After many years’ experience in India and Egypt, we are convinced that the construction of drains and escapes should precede, and not follow the canals. It seems fatuous for engineers to be always over-saturating and half-ruining tens of thousands of acres of low-lying lands, during the improvement of hundreds of thousands of acres of high-lying lands, when it would be perfectly easy, with a little foresight, to secure all the advantages without piling up disadvantages. The drains have generally one-third the capacity of the canals. Dry crops require 1 cubic metre per second per 3500 acres; and rice requires the same per 2000 acres. The drains in dry-cropped lands provide for 1 cubic metre per second per 10,000 acres, and in rice lands 1 cubic metre per second per 6000 acres.
[69]
While basin irrigation is followed by the winter crops of wheat, beans, clover, barley, flax, lentils, vetches and onions, perennial irrigation allows of all the above winter crops and in addition the summer crops of cotton, sugar-cane, oilseeds, gardens and orchards. It will readily be understood that all this double cropping necessitates a very free use of manures.
It would be a healthy innovation indeed, if the provision of suitable manures were to be considered as an essential part of a project for providing perennial irrigation. The day is not far distant, I believe, when governments which provide irrigation works will also provide manures, and sell the water and the manures together, one being as essential as the other; I know well, from observation, that a well-manured field needs only half the water that a poorly manured field does; and in years of drought and scarcity manures almost take the place of irrigation. Why should there not be a manure-rate as well as a water-rate? Here in Egypt, the numerous ruins of old-world cities have hitherto provided manure for a great part of the perennially irrigated lands; but these are being fast worked out, and other sources must be sought for. Farm-yard manure will never suffice for the intense cultivation in this country. In connection with this subject, I can recommend the study of a remarkably able paper on “Nile Cultivation and Nitrates,” read by Mr. J. B. Fuller, C.I.E., before the Agricultural Society of England, and embodied in the 3rd Series, Vol. VII., Part 4, 1896. Egypt possesses, in the vicinity of Luxor, natural beds of nitrates of unlimited extent, which come down to the river’s edge. These nitrate beds have been used from time immemorial, but were brought to the notice of the general public by Mr. Floyer.[70] They contain only about 6 per cent. of pure nitrates, but as they are on the edge of the Nile, in a perfectly cloudless and very dry country, it might be possible, with the aid of the plentiful supply of water always at hand to profitably extract pure nitrates. The demand for nitrates is without limit in the Nile Valley, as Nile water, though rich in everything else, is exceedingly poor in nitrates.
The perennial canals and collateral works have cost £4·50 per acre, and the maintenance charges are £·10 per acre. The perennially irrigated lands are let at £5 to £8 per acre per annum as against £3 to £5 for the basins lands.
—The Nile during high floods is considerably above the level of the country, which is protected by embankments stretching from Assouân to the sea. In Upper Egypt, a very high flood is one metre above the country; in Middle Egypt it is 2 metres, and the same on the Rosetta branch of the Nile. On the Damietta branch it is 3·50 metres in places.
In parts of Upper Egypt, but nearly everywhere in Lower Egypt, the Nile on curves is protected by stone spurs. These spurs contain each from 4,000 to 250 cubic metres. They are very effective where the Nile bank has been well thrown back below them to a distance of some 50 metres on a length of at least 100 metres. This allows the waters of the flood to swirl harmlessly in whirlpools below the spurs while the banks are far removed from their action.
When we first came to Egypt, we found that the policy was to spread the flood into as many channels as possible and protect the whole of them with tens of thousands of corvée, in addition to the corvée on the Nile banks. We changed that and concentrated our energies on the Rosetta and Damietta branches.
In 1861, 1863, 1866, 1869, 1874, and 1878 the Damietta branch was badly breached, There has been only one serious breach on the Rosetta branch, and that was in 1863. The great breach of 1878 on the Damietta branch was attended with serious loss of life; but far more serious was the breach of 1863 on the Rosetta branch not far from its head. The whole western half of the Delta proper was swept by the river, and as the canals there have not got good high banks, the people had no place of shelter to flee to and were drowned in very great numbers. The same thing would happen again if a breach were to occur now, only the damage would be far more serious. The country is covered with villas and rich plantations and[71] the low lands to the very edges of Lake Borrilos are being reclaimed and inhabited. The loss of life which would occur nowadays would be truly appalling. A breach anywhere within 100 kilometres of the Barrage on the east bank of the Rosetta branch or the west bank of the Damietta branch during a very high flood would be a national disaster.
The terror reigning over the whole country during a very high flood is very striking. The Nile banks are covered with booths at intervals of 50 metres. Each booth has two watchmen, and lamps are kept burning all night. Every dangerous spot has a gang of 50 or 100 special men. The Nile is covered with steamers and boats carrying sacks, stakes, and stone; while the banks along nearly their entire length are protected by stakes supporting cotton and Indian corn stalks, keeping the waves off the loose earth of the banks. In a settlement of a culvert in the Nile bank north of Mansourah in 1887 I witnessed a scene which must have once been more common than it is to-day. The news that the bank had breached spread fast through the village. The villagers rushed out on to the banks with their children, their cattle, and everything they possessed. The confusion was indescribable. A narrow bank covered with buffaloes, children, poultry, and household furniture. The women assembled round the local saint’s tomb, beating their breasts, kissing the tomb, and uttering loud cries, and every five minutes a gang of men running into the crowd and carrying off the first thing they could lay hands on wherewith to close the breach. The fellaheen meanwhile, in a steady, business-like manner, plunged into the breach, stood shoulder to shoulder across the escaping water, and with the aid of torn-off doors and windows and Indian corn stalks, closed the breach. They were only just in time. This is the way the fellaheen faced a breach. And this is how the old Governors of Egypt faced them. During the flood of 1887 I complimented an official on the Nile bank, whose activity was quite disproportionate to his apparent age. He told me that he was a comparatively young man, but he had had charge of the Nile bank at Mit Badr when the great breach occurred in 1878, and that Ismail Pasha had telegraphed orders to throw him and the engineer into the breach. He was given 12 hours’ grace by the local chief, and during that interval his hair had become white; subsequently he was pardoned. These were the senseless orders which used to petrify officials into stupidity.
[72]
The following estimate was made by me of the cost of protecting the Delta proper between the two branches of the Nile during the high flood of 1887:—
Cost of protection for 432 kilometres of bank or 1,200,000 acres of cultivation:—
| Materials paid for |
- | Sand bags | 60,000 | @ | £ | ·03 | = | £ | 1,800 | |
| Stone | 5,000 | @ | „ | ·50 | = | „ | 2,500 | |||
| Stakes | 55,000 | @ | „ | ·06 | = | „ | 3,300 | |||
| £ | 7,600 | |||||||||
| Materials not paid for |
- | Camel loads of stalk for 42 kilometres, 14,000 @ £ ·15 |
= | £ | 2,100 | |||||
| Total materials | £ | 9,700 | ||||||||
| 15 engineers @ £80 | = | £ | 1,200 | |||||||
| Unpaid corvee, 1,374,079 men @ £·03 | = | „ | 41,222 | |||||||
| Total labour | £ | 42,422 | ||||||||
| Total materials and labour | £ | 52,122 | ||||||||
This works out to £120 per kilometre of bank, or £·045 per acre of land protected. It is a very cheap insurance.
[73]
—No account of the Nile in 1904 would be complete without an enumeration and slight examination of the projects before the public for the provision of sufficient water to the Nile in times of low supply to insure the perennial irrigation of the whole of Egypt; to utilise these perennial waters by converting basin tracts into perennially irrigated ones; to protect the country from the dangers accompanying high floods; and to permit of the reclamation of the low salted lands of Lower Egypt which border the Mediterranean sea.
Egypt has a total irrigable area of 61⁄4 millions acres. Of this area, 1⁄4 of a million acres, which are to-day inundated in flood and lie along the edge of the deserts, must continue to be inundated in flood for all time, to prevent the sands of the desert from spreading over the Nile Valley. Their value is £5,000,000. Four million acres are perennially irrigated. They have a mean value of £55 per acre, and have a total value of £220,000,000. Of the remaining two million acres, two-thirds are irrigated only in flood and one-third is not irrigated at all. These 2 million acres have a mean value of £25 per acre, and are worth £50,000,000. The land of Egypt may be considered as worth £275,000,000 to-day. If it were possible to perennially irrigate the 2 million acres which are without such irrigation, their value would be increased by £30 per acre, or by £60,000,000.
The problem before us is how to provide perennial irrigation to these 2 million acres and so add £60,000,000 to the wealth of the country.
It has been calculated that each milliard of cubic metres of water stored in reservoirs situated in Egypt itself is sufficient to insure the conversion of half a million acres from flood to perennial irrigation. Egypt therefore requires reservoirs capable of storing 4 milliards of cubic metres of water.
In Mehemet Ali’s time, the great preoccupation of the Government was the pressing on of the cultivation of cotton, and as this crop needed perennial irrigation, the securing of an abundant supply of water all the year round was the problem of the day.
[74]
The fame of the ancient Lake Mœris had made a profound impression on the mind of Mehemet Ali, and he urged on his chief engineer the necessity of undertaking similar works. Linant Pasha first set himself to discover the site of the ancient lake, and then estimated roughly the cost of reconstructing it, but considered the cost prohibitive. He recommended Silsila as a suitable site for a weir and a canal head. The failure of the Barrage discouraged the Government from undertaking new works and the question dropped. In 1880 Count de la Motte proposed a dam at Silsila and a reservoir to the south of it. He also proposed putting a capacious depression to the east of Kalabsha in communication with the Nile by the aid of a dam at Kalabsha.
About two years later Mr. Cope Whitehouse suggested utilising the Wadi Rayan depression as a reservoir. This depression had been already mentioned by Linant Pasha in his book and located by him on his hydrological map. Financial difficulties prevented Sir Colin Scott-Moncrieff from immediately considering the question of reservoirs. The success of the Barrage repairs in 1887 however gave new life to the question of reservoirs and Sir Colin Scott-Moncrieff deputed Col. Western to give scope to the suggestion made by Mr. Cope Whitehouse, to make plans of the Wady Rayan and the deserts between it and the Nile, to find out the capacity of the reservoir, and see if it could be utilised. Col. Western’s report, plans and estimates were printed by the Egyptian Government in 1888. At the same time I was deputed to examine the other projects of Count de la Motte. In 1889 and 1891 I reported unfavourably on them, because I could find no depression near Kalabsha to put in communication with the Nile, and could find no rock at Silsila on which to build a dam. The Bergat Takham pan was the only depression near Kalabsha which could have been used as a reservoir and it was over 100 metres above the level of the Nile flood; while both in the Silsila pass and the Silsila gate I bored for rock and was everywhere still in sand 10 metres below the level at which the existence of rock was assumed by the Count’s engineers. On my report reaching Cairo, M. Prompt proposed using the trough of the Nile itself at Kalabsha as a reservoir in place of the depression which did not exist. Col. Western left the country in 1890 and I became Director General of Reservoir Studies. M. Prompt had supposed that rock could be met with at Kalabsha at a depth of 4 metres below low-water level. I could not find it at a depth of 26 metres.[75] After sounding and boring at every possible site on the Nile and surveying, boring, and levelling in the desert between Wadi Halfa and the Fayoum, I submitted my report in 1894, proposing an open dam at Assouan of a type which I trusted would meet the requirements of a Nile reservoir dam. Sir William Garstin approved of the site and the design, and the dam was built between 1898 and 1902 with Mr. Maurice Fitzmaurice C.M.G, as resident engineer.
The Assouan Reservoir at its present level contains one milliard of cubic metres of water which will suffice for the conversion of half a million acres to perennial irrigation, adding £15,000,000 to the wealth of the country. But though the dam was only completed at the end of 1902, already the whole of the water has been devoted to special tracts, and the Government is reluctantly compelled to refuse all applications for water.
—Egypt already possesses the germ of all the storage works she needs. Six years ago a few far-seeing men saw clearly what all of us understand to-day; but among the few, no man had greater faith in the future of the country than Sir Ernest Cassel. The Assouân Reservoir project had been lying buried for four years in official pigeon holes, when in 1898 Sir Ernest came forward with the funds, and with Sir John Aird & Co., as contractors, and Sir Benjamin Baker as Consulting Engineer, undertook to complete the Assouân dam and the Assiout weir by December 1903. The Egyptian Government, advised by Sir William Garstin, accepted his offer, and received the completed works by December 1902.
The Assouân dam is a granite structure 2,000 metres long which crosses the head of the Assouân cataract of the Nile in one continuous straight line. The dam is pierced by 140 under sluices of 7 metres by 2 metres for passing floods, and by 40 upper sluices of 31⁄2 metres by 2 metres for passing the high level water of the reservoir. The sluices are regulated by “Stoney” gates worked by winches at the roadway level.
While the red, muddy waters of the Nile flood are pouring down the river, the whole of the sluices are open and the river discharges itself through them without parting with its silt. This is the real object of the sluices, for if the dam were solid and the river forced to flow over the top, the reservoir would soon be filled with deposit and obliterated, while Egypt, deprived of this rich mud, would be considerably the poorer. This is the great feature of the dam. While the dam holds together, the reservoir will be free of silt.
[76]
When the turbid flood has passed and the comparatively clear winter supply of the river has begun to arrive, the sluices are gradually closed and the reservoir filled. Beginning about the 1st December, the reservoir is filled in 100 days. It will ordinarily be full on the 1st March. No additional water is needed for irrigation between March 1st and May 1st as the river naturally has enough for the requirements of the area at present under crop at this season. As the area under perennial irrigation will be gradually increased, the demand for water for the new lands will begin about the 1st of April. The demand increases through May and June, and the reservoir will then be aiding the river with its supplement. If the flood is very late, water may be required from the reservoir till the 10th July; if the flood is early no water will be needed after the 20th of June, as in 1903, the first year of the reservoir. The earlier the flood the more effective the reservoir. By the time the flood has begun to get turbid, the under and upper sluices will all be open and the muddy waters of the Nile will sweep through the dam without impediment.
The dam has worked for two years and given satisfaction. When the Nile was at its lowest in May 1903, the natural discharge of the river, supplemented by all the subsoil infiltration water which enters the river between Assouân and the sea, was 400 cubic metres per second. The reservoir was adding 200 cubic metres per second to the supply, raising the total supply available for irrigation to 600 cubic metres per second. The reservoir was supplying one-third of the water which was being utilized in Egypt. This water will suffice for an increase to the perennially irrigated area of 1⁄2 million acres.
At the time of designing the dam it was intended that it should be of such a section that it could be raised 6 metres in height and hold up another milliard of cubic metres of water. Such an operation, if performed to-day, would mean: the whole length of dam being raised 6 metres, the winches working the sluice gates being raised 6 metres and provided with new wire ropes; and new copings being given to the parapets. It would necessitate two more locks and three more lock gates, and nothing else. The expenditure incurred would be about £500,000.
—When the Assouân dam will have been raised, we shall be standing on the threshold of what it will be able to do. The projected Wady Rayan reservoir, or the modern Lake Mœris, will be well able to supply the two remaining milliards of cubic metres of water when working in conjunction with the Assuân Reservoir. The great weakness of this projected lake has lain in the fact that by itself it could give a plentiful discharge in April and May, less in June, and very little in July, and it was for this reason that in my report of 1894 to the Egyptian Government I had reluctantly to recommend that it be not carried out. But when the Assouân reservoir is capable of supplying two milliards of cubic metres of water it will be possible to utilise the Mœris Lake to its utmost capacity. The Assouan Reservoir, being high above the level of the Nile can give its supply at the beginning or end of the summer; it can give it slowly or with a rush; while the projected Lake Mœris, being directly in communication with the Nile, and only slightly above low Nile level, its discharge would depend entirely on the difference of level between it and the Nile, and consequently as the summer advanced its level would gradually fall and the lake would not be able to give at the end of the summer a quarter of the discharge it could give at the beginning.
PLATE XV
PROPOSED WADI RAYAN RESERVOIR
SHOWING THE FAYOUM
All R. L.s in metres, above (+) or below (-) mean sea.

Lith. Sur. Dep. Cairo.
Larger map (310 kB)
[77]
But let us imagine that the reservoir and the lake are both completed and full of water, and that it is the first of April. Lake Mœris will be opened on to the Nile and give all the water needed in that month, while the Assouan Reservoir will be maintained at its full level. In May, Lake Mœris will give nearly the whole supply and the reservoir will give a little. In June the lake will give little and the reservoir much; while in July the lake will give practically nothing and the reservoir the whole supply. Working together in this harmonious manner, the reservoir and the lake, which are the true complements of each other, will easily provide the whole of the water needed for Egypt.
The Wady Rayan is a depression in the deserts to the south of the Fayoum and separated from the Fayoum by a limestone ridge. In 1888 Col. Western recommended it very strongly as a reservoir. In this he was supported by Col. Ross, the first Inspector General of irrigation. On Col. Western’s leaving Egypt, the study was entrusted to me, and Messrs. Hewat and Clifton deputed to make a final project. The Wady Rayan project, with its plans and estimates, was published by the Egyptian Government in 1894. As I said before, I was reluctantly compelled to reject its adoption owing to the one radical defect already described. That defect will have been completely removed by the completion of the Assouân Reservoir, when it will be possible to undertake the construction of the modern lake Mœris.
[78]
The question of Lake Mœris has interested the world for centuries. For the ancients it was one of the world’s seven wonders. Sir Hanbury Brown, in his book on the “Fayoum and Lake Mœris,” has collected all the information available about the lake, and after a thorough examination of the question has declared in favour of the Wady Rayan being converted into a modern Lake Mœris.
Herodotus, writing about B.C. 450, was the first to describe the lake: “Now the Labyrinth being such as I have described, the lake named that of Mœris, causes still greater astonishment, on the bank of which the Labyrinth was built.
“The water in the lake is not derived from local sources, for the earth in that part is excessively dry and waterless, but it is brought in from the Nile by a canal. It takes six months filling and six months flowing back. During the six months of the return flow, it yields a talent of silver every day to the treasury, and during the flow twenty minæ for the fish.”
Strabo, writing in B. C. 20, remarks: “It has also a remarkable lake called the Lake of Mœris, large enough to be called a sea, and resembling the open sea in colour.
“Thus the Lake of Mœris is, from its size and depth, capable of receiving the overflow of the Nile at its rising, and preventing the flooding of houses and gardens; when the river falls, the lake again discharges the water by a canal at both mouths, and it is available for irrigation. There are regulators at both ends for controlling the inflow and outflow.”
Diodorus Siculus, writing at the same time, says:—“King Mœris dug a lake which is amazingly useful and incredibly large. For as the rising of the Nile is irregular, and the fertility of the country depends on its uniformity, he dug the lake for the reception of the superfluous water, and he constructed a canal from the river to the lake 80 furlongs in length and 300 feet in breadth. Through this he admitted or let out the water as required.”
At one time there was much discussion as to what was Lake Mœris, but since the publication of Sir Hanbury’s book there can be but one opinion. The lake covered the whole of the modern Fayoum below the level of the contour which is 221⁄2 metres above mean sea level. The common Nile shells are to be met in myriads at any point on this contour round the Fayoum that one cares to look for them. The ordinary high flood level of Kushesha basin to-day is 261⁄2 metres[79] above mean sea. In Amenemhat’s time, which was 4,000 years ago, the level was 4 metres lower, or at 221⁄2 metres above mean sea. This was the highest possible level the lake could have attained in his day. In the course of time the level of the Nile valley rose by about 10 centimetres per century, but the frequent occasions on which the canal was kept closed during poor and low floods gradually silted up the channel and made it less capacious. As there are no Nile shells above the contour of 221⁄2 metres above mean sea (except a few on the south side of the lake which have evidently been blown up by the north west winds in sand drifts) it is evident that the gradual silting up of the channel more than kept pace with the rising level of the Nile. Eventually the silting up exceeded the rise, and that at an accelerated rate, the canal became weaker and weaker, and the Fayoum Province gradually occupied the site of the lake. Lake Mœris had lasted over 2,000 years.
The connection between the Nile and the germ of the future Lake Mœris was in existence in King Menes’s time, as I have been informed by professor Sayce, but it was King Amenemhat, of the XIIth dynasty, who widened and deepened the canal, cleared away the rocky barriers, and converted the trifling lake of King Menes’s time into the mighty inland sea which controlled the highest floods of the Nile. Those ancient Pharaohs were giants in hydraulic engineering. They were, moreover, as wise as they were courageous.
Sir Hanbury Brown has well described the action of the lake. It had a surface of 2,500 square kilometres, and being drained back into the Nile and kept at a low level it was able to take from a very high flood 20 milliards of cubic metres of water. It was quite capable of reducing a very high flood to moderate dimensions; and if injudiciously or maliciously opened in a low flood, it was capable of depriving Lower Egypt of any flood irrigation at all; and in those days they had practically no irrigation except flood irrigation.
The Wady Rayan, as already stated, is a depression in the Lybian hills immediately south of the Fayoum. It has, at a level of about 29 metres above the sea, a surface of 700 square kilometres, or about one quarter the area of the ancient lake. Like the ancient lake, the lowest point of the Wady is 41 metres below sea level. When filled with water the greatest depth will be 70 metres. The uppermost four or five metres only will be utilised annually, or some 3 milliards of cubic metres of water out of a total volume of 20 milliards. Just as the[80] great size of the ancient lake was of inestimable value to a work whose principal use lay in moderating high floods, so the smaller area of the modern lake will render it far more useful as a work for feeding the low Nile. This lake, will render no mean aid in time of dangerous floods, but, in its early years, its main use will be the provision of water in summer. It will supply the two milliards which are needed to convert the whole of Egypt from basin to perennial irrigation.
In my book on “The Assuân Reservoir and Lake Mœris” I have worked out the cost of the project and estimated it at £2,600,000.
The rates I have allowed for the excavation work are considered too low by some critics. If the earthwork in the Nile Valley had to be excavated within 30-day rotations as on the running canals, I should be the first to agree; but the work will last three years and the contractors will be able to concentrate all the spare labour of the country on the works when demand for labour is slack, and in this way the rate of P.T. 3 per cubic metre which I have allowed will be found to be ample. In the hill of salted marl it will be possible to employ the American system of excavating by the aid of water issuing from nozzles under pressure. By this method it will be possible to do much work at P.T. 2 and P.T. 3 per cubic metre as it is done in America. I have allowed P.T. 5 per cubic metre. To this hydraulic pressure work the salted marls will be specially suited, and indeed the recollection of the ease with which Amenemhat dug his canal though this very material lasted long in the memory of Egyptians. Some 1,600 years after the canal was excavated, Herodotus was informed that the excavated material was thrown into the canal and transported by the running water. A 12-inch pump on the Yusufi canal lifting water on to the top of the hill, a number of spade men helping the water as it coursed down the hill and leading the liquid mud along wooden troughs into side ravines and depressions, and a steep slope on the western half of the hill where the rock had been blasted away would soon remove all the material required at a very low cost. I have allowed P.T. 10 per cubic metre for the soft limestone. Here it will be easy to work on a vertical face of some 7 metres, blast out the rock, carry it away on four lines of railway running down hill, deposit the rubble on the desert; and as each 7 metres depth is completed, to begin the next 7 metres in depth in the same way.
In my 1894 Report I had anticipated difficulties with the canal running through the salted marl. Since then I have thoroughly inspected the ravines in the Fayoum and seen the El-Bats ravine where it cuts through many kilometres of this very salted marl. The sides are absolutely vertical and deposits of mud and self-sown tamarisk bushes protect the vertical sides at places where the running water is nearly touching the marl. Such natural protection will be far superior to the masonry lining I proposed and far more effective. It will moreover cost nothing.
PL. XVI.
WADI RAYAN RESERVOIR
LONGITUDINAL SECTION OF PROPOSED CANAL

Larger illustration (220 kB)
LONGITUDINAL SECTION OF THE FAYOUM
[81]
To those critics who suggest that the waters of the lake might become salted or leak into the Fayoum I have to reply as follows: When the old Lake Mœris, or the present Fayoum, was full of water and 63 metres higher than the bottom of the Wady Rayan, and remained so for thousands of years, there was no question of the waters having become salted or having escaped into the Wady. The Wady was as dry as it is to-day and the great inland sea was always fresh. If there had been any serious infiltration from the ancient Lake Mœris into the Wady Rayan, there would have resulted a lake which could not have escaped the notice of the numerous travellers who visited the lake. No mention was ever made of such a lake. This body of water moreover would have been inhabited by fresh-water animals whose remains would have strewn its shores. No such remains are to be seen to-day. If therefore the ancient Lake Mœris with a head of 63 metres on to the Wady Rayan could not leak into the Wady, it is not likely that the Wady Rayan reservoir with a head of from 27 to 29 metres on the Garak side of the Fayoum will leak into that part of the area covered by the ancient lake. Any leakage into the Lake Kurun side is never contemplated by anybody, since many kilometres of compact limestone lie between the Wady Rayan and it, while about one or two kilometres of the same limestone lie between the Wady Rayan and the Garak depression.
—If we wish not only to irrigate the whole of Egypt, but to include the Sudan in the sphere of operations we must regulate the supply issuing from Lake Albert Nyanza and ensure its passage through the great swamp regions. To my mind no work in the Sudd regions will be of any substantial value unless the Albert reservoir dam is first built. Tabulating the information collected in the gauges and discharge tables we may state that the discharge of the Albert Nile in cubic metres per second between the 15th January and 15th May was as follows in:—
| 1901 | 1902 | 1903 | 1904 | |
|---|---|---|---|---|
| Discharge at Gondokoro | 600 | 600 | 700 | 1000 |
| Discharge above Sobat mouth | 300 | 300 | 350 | 435 |
[82]
In 1861 the discharge at Gondokoro was as low as 500 cubic metres per second. It will be seen that, in spite of the great waste, there is an increase at the northern end of the Sudd region even under present conditions when the discharge at the south end is increased in the interval between the 15th January and 15th May. The water which enters the White Nile during these months represents the summer contingent of the White Nile to the Nile in Egypt.
Now though an increase in April at the south end of the Sudd region is felt at the north end, no such increase is felt in September and October, and the reason has been given in Chapters II and III.
In April the Sobat river is discharging practically nothing, and the whole supply available in the Albert Nile can pass down the White Nile past the Sobat mouth. In September the Sobat river may be discharging 750 to 1,000 cubic metres per second, and as the White Nile cannot discharge the combined waters of the two rivers, the water of the Albert Nile is headed up and accumulated in the lowlands between Lake No and the Sobat mouth. This is greatly to the advantage of Egypt, for it is the discharge at the head of the White Nile between January 15 and May 15 which decides the White Nile contingent to the summer supply of the Nile in Egypt, and the greater the quantity of water above the head of the White Nile, in the absence of a regulator or barrage at Wadelai or Dufilé, the better the summer supply of Egypt. After the abnormally high flood of 1878, when Gordon was up the Nile, so great was the accumulation that the discharge at Assuân never fell below 1500 cubic metres per second in the summer of 1879. The Barrage was not regulated upon and yet all the Lower Egypt canals were full of water, and the cotton crop of Egypt for that year was quite abnormal for the seventies of the last century.
Now an expenditure of between £400,000 and £1,000,000, say £800,000, could secure a regulator for Lake Albert at any point between the outlet and Dufilé. Such a regulator would insure 1200 cubic metres per second every year to the Albert Nile at Gondokoro between the 15th January and the 15th May. With this supply insured, the training works in the Sudd region would soon begin to affect the discharge at the north end of this region where the White Nile begins.
The way in which this work of training should be carried out has been admirably laid down in page 174 of Sir William Garstin’s Report. “Alter the flood conditions of the Albert Nile (Bahr-el-Gebel) as little[83] as possible, let the excess flood water escape on both sides, but keep the summer supply in its channel.” This is, to my view, the soundest statement from an engineering point of view in the whole report. Hitherto we have always assumed a vast expenditure for keeping the flood supply in one channel; but with our attention devoted to the summer channel, we should have before us all the advantages of summer training works without any fear of inundations. The very wildness of the regions would be in our favour. To be able to train a river in summer without any nervousness about floods, is given to few engineers. I had never thought that any good thing could come out of the sudd region, but looked at from this point of view, we can, even in this inhospitable waste of waters, confirm Shakespeare’s saying that “there is some soul of goodness in things evil.”
The Lake Albert reservoir could easily insure 1200 cubic metres per second every year between the 15th January and the 15th May. To pass through the Sudd regions as much as possible of the 1200 cubic metres per second received at Gondokoro, the following works would be necessary:—
The first work to be done would be the removal of sudd block No. 15 which for 37 kilometres south of Hillet-el-Nuer has turned the Albert Nile out of its course. The importance of this is strongly insisted on by Sir William Garstin on page 55 of Appendix VI of his Report, which is the very last thing he wrote. With this block removed, the Albert Nile would be given a good opportunity of working out its own salvation.
The next point is one to which I attach the greatest importance. Indeed, I look upon it as the key of the whole region. The Albert Nile enters the south-east corner of Lake No and almost immediately afterwards leaves its east corner. Now Lake No is the final evaporating basin of the Bahr-el-Gazelle, probably the most unsatisfactory river in the whole world; and it is open to doubt whether in a year of deficient rainfall on its own catchment basin and a year of good supply down the Albert Nile, it does not evaporate a considerable quantity of the water of the Albert Nile. If the discharge of the Albert Nile north of Hillet Nuer was brought to 450 cubic metres per second in April, this lake might waste much of it. Such being the case, a cut of a maximum length of some 5 kilometres should be dredged south of the south-east corner of the lake, and the waters of the Albert Nile separated from those of the Gazelle. A cheap wooden lock and regulator would allow boats to pass, and take in any water from the Gazelle river when it had[84] it to give. The maximum water we have to deal with is zero in summer and 40 cubic metres per second in flood. If the Albert Nile were separated from the Gazelle, it might be found that the waters of the Gazelle river found their way into the Albert Nile through that mysterious and unsatisfactory river the Lolle. Some use might even be found for it. I have, since I wrote this, been informed by Capt. Lyons that Marno in 1881 proposed this cut round the south-east corner of Lake No. (Pet. Mitheil, 1881, page 425 and plate 20).
The Albert Nile to-day at Hillet-el-Nuer is capable of carrying 450 cubic metres per second. North of Hillet-el-Nuer, the Albert Nile has a mean width of 75 metres, but owing to want of training and papyrus swamps, the discharge dwindles down to 320 cubic metres per second. The Albert Nile has in this reach a very good section indeed and by beginning with the west bank and dredging round corners and closing spills by dredged earth, an improvement of section and slope, backed up by a permanent discharge of 450 cubic metres per second at Hillet-el-Nuer, might speedily result in this very discharge of 450 cubic metres per second being obtained south of Lake No. We are here in such swamped land that percolation would be practically zero. There are only 200 kilometres of channel with all its curves, or 160 kilometres of trained channel to work at, in which 75 per cent of the work is to hand; and we have to confine our attention to the low supply without worrying over the flood supplies.
Now the Bahr-el-Zeraf could be made capable of carrying 150 cubic metres per second by an improvement of the inlet at Baker’s channel and by dredging north of Ghaba Shambe, as will be seen by examining the measured discharges of the Bahr. With the Bahr-el-Zeraf carrying 150 cubic metres per second and the Albert Nile carrying 450 cubic metres per second, we should have ensured 600 cubic metres per second. As time went on, improvements in the channels would make themselves felt, as they are even doing to-day, and we might even have 700 and 800 cubic metres per second at the head of the White Nile below the Sobat mouth. We must always remember that it is assumed that the lake Albert reservoir dam has been constructed and a supply of 1,200 cubic metres per second assured at Gondokoro from January to May. If the Sobat river were capable of regulation downstream of the Pibor marshes, we might get an increase from that direction as well. The possibility of a good site for a reservoir upstream of Nasser is very great. The Nasser gauge rises and falls so slowly that there must be[85] very great natural accumulations of water upstream of it, which might be improved. The question of quality needs study.
The discharge of 435 cubic metres per second, which the rivers in their present state, aided by the Lake Albert reservoir, could deliver into the White Nile, would thus see itself gradually increased to 500, 550, and 600 cubic metres per second and even more, and would enter the White Nile past the Sobat mouth in February, March, April and May. During these months the whole of the supply would pass down the White Nile without throwing backwater on the rivers. Later on, when the Sobat river came down in flood and filled up the channel of the White Nile, the Albert Nile would have its waters reduced at the Albert regulator, and the waters of Lake Albert would again be stored for the day when the Sobat floods had fallen and the White Nile channel was free and ready to take in the waters of the Albert Nile.
While I had contemplated the training of the flood waters of the Albert Nile through the Sudd regions I had estimated the cost at £100,000 per annum, for 25 years, or at £2,500,000. Now, however, that Sir William Garstin has shown how we need only attend to the summer supplies, the sum may be reduced to half the former figure or to £1,200,000, and be more than ample. With £2,000,000 devoted to the Lake Albert reservoir and the training works in the Sudd region, the summer supply of Egypt and the northern Sudan would be put on a firm base.
Dr. Schweinfurth, the eminent African traveller and savant, was the first to call the attention of the Egyptian Government to the necessity of closing the spills from the White Nile to the north of Gondokoro, and so beginning the training of the river. He very rightly said:—“Many years would elapse before the desired result would be obtained by the strengthening of the banks, but the works would be increasingly felt every year in Egypt as the works progressed.”
—In paragraph 30 it was stated that the floods in the Delta or in Lower Egypt can rise to a height of from 2 to 31⁄2 metres above the level of the country. Such floods are really dangerous and means should be found for moderating them.
The Wady Rayan reservoir, when converted into the modern Lake Mœris and acting as a reservoir, will have one great advantage, it will be able to lower a high flood 30 centimetres for 50 days. This will[86] give relief to the Nile, a relief which will be much appreciated by the whole country from Beni Suef to the sea, and especially by Cairo.
I have already stated that the Damietta branch is especially dangerous and unfit to act as an escape under existing conditions. That branch could be regulated on at its head and treated like a canal. Thanks to Sir Hanbury Brown’s initiative the Barrages can be regulated on in flood as well as in summer, and by lowering the supply in the Damietta branch and turning the surplus down the Rosetta branch, the latter would become the flood escape of the Nile. It might be trained as Mr. Eads suggested that rivers should be treated.
Mr. Eads’ argument is very clear. He insists that rivers eat away their banks in places, not owing to the direct action of the water but by the alterations in the velocity of the current. When the river water is charged with sediment to its full carrying capacity it cannot take up more unless the rate of current be increased. If the channel be nearly uniform the river water cannot eat away any of its banks. If, however, the channel is varying, the silt deposits in the wide sections, and the water, free of some of its sediment, is ready to eat more. It is this alternate dropping silt and eating away of earth which does the harm. To treat the Rosetta branch according to Mr. Eads it would be necessary to fix the top width to be worked to, at say 550 metres. The river could be brought to this uniform top width by building light inexpensive permeable spurs on the sandy shoals. The land between the spurs would become cultivated and such river training would pay the Government, which taxes all cultivated land; it would even pay handsomely for any company to undertake the work once the rule about foreshores was understood. The Government would, however, always succeed; when it could not sell, it could always tax. Such training would permanently lower the flood.
In addition to the above it would be necessary to complete the system of spurs begun in 1884, and to throw back the banks as already recommended. It has been estimated that the completion of this work would cost £900,000 for spurs and banks, while the training works would pay for themselves in addition to greatly improving the channel and lowering the level of the flood.
It may be humiliating to make the confession, but from B.C. 2,200 to the Arab invasion of Egypt in A.D. 640, while Lake Mœris performed its allotted task and the Nile possessed training works such[87] as those we can see to-day in Nubia, Egypt was better protected from inundation, and the Nile better trained, than it is to-day. And yet we have many advantages which no Pharaoh possessed. By the aid of telegraphy we have knowledge of a coming flood a full fifteen days before it arrives in the Delta; the Khartoum gauge allows us to anticipate its very height. Meteorology is aiding us still further. In a paper I read at the Chicago International Exhibition I stated that years of heavy rainfall in India are years of high flood in Egypt, while years of poor rainfall in India are years of low flood in Egypt. Sir John Eliot, the Director General of the Meteorological Department of India, corrected this statement. He said that though this was not true of the Bengal monsoon, it was true of the Bombay monsoon. Years of heavy rainfall in Gujerat and Bombay are years of high flood on the Nile, and vice versà. As the rain falls in Bombay a month earlier than the Nile flood reaches Cairo, we have information of a high flood a month before it arrives, if we receive telegraphic information from Bombay.
—The complete project for water storage and flood protection for Egypt as proposed by me, contemplates the following works:—
| Raising the Assuân reservoir (2 years) | £ | 500,000 |
| Wady Rayan reservoir (4 years) | „ | 2,600,000 |
| Training the Rosetta branch | „ | 900,000 |
| Total | £ | 4,000,000 |
To these have to be added the approximate estimates of the proposed works on the Upper Nile:—
| Regulator for Lake Albert (4 years) | £ | 800,000 |
| Dredging and training works in the Albert Nile and the Zeraf river (12 years) | £ | 1,200,000 |
| Total | £ | 2,000,000 |
| Grand total of works on the Upper and Lower Nile | £ | 6,000,000 |
[88]
The total expenditure amounts to £6,000,000 spread over 12 years.
The great advantage of undertaking all those works together may be thus summarized. The increased supply from the Assuân reservoir will be felt in Egypt after a period of two years. Five years later the waters of the Wady Rayan will be added to those of the Assuân reservoir, and it will be possible to increase the cotton crop of Egypt from 6 million to 10 million cwt. It will be possible to allow the Sudan to thoroughly develop its agricultural resources, and with the aid of the 25,000 horse power as a minimum which the 6th cataract near Khartoum can supply, to utilise for its own consumption the waters which can be stored at that cataract; and, in addition to those, the available supplies from Lake Tsana provided that that lake is furnished with an outlet tunnel.
While all this life and activity will be developing themselves in Egypt and the Sudan, the effects of the regulator of Lake Albert and the training of the Albert Nile in the Sudd regions will be gradually asserting themselves; and, if the works are being steadily and perseveringly carried out, it is well within the range of possibility that before 10 or 12 years will have passed, the additional supplies from the upper waters of the White Nile will have become so ample, that it will be possible to dispense with the Wady Rayan as a reservoir. When this will have happened, the Wady Rayan with its canal will become the true flood escape of Egypt, like the ancient Lake Mœris, and will, with the Rosetta branch, afford complete protection to Egypt against the dangers of a high flood. Egypt, in the fullest meaning of the term, will be enjoying perennial irrigation and flood protection.
In my book on the “Assuân Reservoir and Lake Mœris” I had recommended a more extended programme, but the reading of Sir William Garstin’s Report has convinced me that useful as the Lake Victoria reservoir dam may be, its postponement as recommended by Sir William is sound, until all the other works have been executed. The really essential work is the Lake Albert reservoir dam, of which the study might indeed be commenced immediately. Sir William’s proposal to train the summer supply of the Albert Nile and allow the overflow of the floods to find its way through the Sudd region is so sound and convincing that the necessary training works in the Sudd region are greatly reduced. With these reductions the estimated cost of the project for water storage and flood protection for Egypt is reduced from £8,200,000 to £6,000,000. I have left the Wady Rayan[89] estimate as it was in my original programme. Mr. Webb’s criticism of the project was based on facts which are outside the project. He supposed that the Wady Rayan was to remain a reservoir for all time and that it was not to be aided by the works on the Upper Nile. Now the project I proposed and which I propose now, presupposes that the Wady Rayan will be a temporary reservoir and final flood escape for the Nile, and that it will be aided in years of very deficient flood by the gradual improvement of the Upper Nile owing to the works undertaken there.
—In the first appendix to his Report on the Upper Nile, Sir William Garstin, G.C.M.G., Adviser to the Ministry of Public Works, has drawn up a programme of works for water storage and flood control in the Nile valley. He approves of the raising of the Assuân dam for £500,000, and the conversion of the Rosetta branch of the Nile into a flood escape for £900,000. He then conditionally approves of a proposal suggested by Mr. J. S. Beresford, C.I.E., for making a straight cut from Bor on the Albert Nile to the mouth of the Sobat river at the tail of the Albert Nile. The line would be 340 kilometres in length and is estimated to cost £5,500,000, and carry 600 cubic metres per second in summer. In case of the line being found impracticable when it was surveyed and levelled, Sir William proposed abandoning the Albert Nile and thoroughly widening and deepening the Zeraf river for £3,400,000.
As a criticism of the Bor cut project I cannot write anything more convincing from my point of view than a letter written by me and published by “The Engineer” in October of this year.
“In your issue of the 16th September Sir Hanbury Brown has reviewed the scheme suggested by Mr. J. S. Beresford, C.I.E., and conditionally approved by Sir William Garstin, for diverting the waters of the Albert Nile (known as the Bahr-el-Gebel) from Bor to the mouth of the Sobat river, on a length 340 kilometres, and sending them down a canal capable of carrying 600 cubic metres per second, at an estimated cost of £5,500,000. In his review Sir Hanbury puts his finger on the weak point in the project, viz., the difficulty and loss of water entailed at the crossing of the Albert Nile just upstream of the Sobat mouth. The difficulty will be got over, as Sir Hanbury himself suggests, by an earthen embankment provided with a regulator. The loss of water cannot be got over.
[90]
“I have taken the following figures from Sir William’s report and from the gauge records of the Public Works Ministry:—
Discharge in Cubic Metres per Second During February, March,
and April of the Albert Nile.
| 1901. | 1902. | 1903. | 1904. | |
|---|---|---|---|---|
| At Gondokoro above Bor | 600 | 600 | 700 | 1,000 |
| Upstream of the mouth of the Sobat river | 300 | 300 | 350 | 435 |
“Now, in a year like 1901 or 1902, with 600 cubic metres per second passing Gondokoro, the diversion canal might be allowed to take in 500 cubic metres per second, leaving 100 cubic metres per second for the Albert Nile, Atem river, and all the Nuer, Dinka, and Shillook country between Gondokoro and the Sobat mouth. An allowance of 100 cubic metres per second would not be liberal, and would probably result in the water becoming stagnant and very impure; but we shall leave that alone. Starting with 500 cubic metres per second of clear water the high level diversion canal would never lose less than 50 cubic metres per second through percolation and evaporation before it reached the Sobat mouth. Many authorities would put the loss at 40 per cent., but we shall say 10 per cent.
“We should then have 450 cubic metres per second entering the White Nile at its head, just at the end of the Albert Nile and at the mouth of the Sobat river. At this point, however, under normal conditions the Albert Nile would have been discharging 300 cubic metres per second. This supply, after the opening of the diversion canal, would have failed utterly, as the waters of the Albert Nile would have been diverted down the diversion canal. Whatever water there was in the Albert Nile would, moreover, have been at so low a level that it could not have flowed down the White Nile together with the high level water of the diversion canal. We should therefore have had in a year like 1901 and 1902 a net gain of 450 less 300 cubic metres per second, or 150 cubic metres per second at the head of the White Nile. By the time this extra water reached Assuân it would have become 100 cubic metres per second.
“If this project, or any other project of any kind, is ever to be carried out on the upper waters of the White Nile, the very first thing[91] to be done will be to construct a weir or barrage at the outlet of the Albert Lake, at Wadelai, or lower down at Dufile. I should say, judging from the map and the cross section, that Wadelai itself would be an excellent site for a weir. I have advocated this project in season and out of season these ten years, and now that actual discharges and figures are before me I am more than ever convinced that I was no untrue prophet when I wrote in my book on “The Assuân Reservoir Dam and After” that “the point where Lake Albert ends and the Albert Nile begins to have a rapid and contracted stream will be the site of the future great regulator or barrage of the upper waters of the Nile. This work will be here or at Dufile.” Such a work would cost anything between £400,000 and £1,000,000.
“If such a work were carried out it would be possible to insure every year a discharge of between 1,000 and 1,500 cubic metres per second at Gondokoro from the 15th of January to the 15th of May, i.e., during the months which determine the summer water supply of the White Nile for Egypt. Such a quantity of water would insure 435 cubic metres per second at the head of the White Nile, as it has done this year, even under existing conditions; while with training and dredger work in the Albert Nile and Bahr Zeraf between Gondokoro and Lake No, it might be increased to 600 cubic metres per second, and even more. The way in which this work of training should be carried out has been admirably laid down on page 174 of Sir William’s Report”.
There are moreover other reasons I think for condemning the excavation of a straight cut 340 kilometres in length across the eastern corner of the Sudd regions. The reasons are to be found in Sir William Garstin’s Report itself. One of the most interesting features of this report is the number of actually measured discharges at different sites. Of all these sites Gondokoro, the southern key of the Sudd region, is the most interesting.
It is very evident from an examination of Sections Nos. 18, 19, 26 and 27, Plate VIII of Sir William’s Report, that the Albert Nile at Gondokoro scours out its bed very severely after a high flood like that of 1903. The width of the section is about 230 metres with vertical sides, and yet while a gauge of ·50 metres on the 1st April 1903 (after the low year of 1902) gave a section of 615 square metres; on the 9th September 1903 (after a good year), the section was 1,347 square metres for a gauge of 2.33 metres. In other words, a rise of[92] 1.83 metres gave an increased section of 732 square metres; while, if the bed had not scoured, it would have been 421 square metres. We have here an increase of 311 square metres, or more than 1 metre of scour. All this happened in 5 months, and proves that the clear water of the lakes, when in volume, has a fine cutting edge.
In footnote (2) of page 116 of his Report, Sir William Garstin says that in the parts of the river where the sudd has been cleared there are indications that a scour of the bed has set in. Again, on page 55 of the appendix, he says that the removal of the sudds has caused the levels of the shallow lakes to fall. All this proves that if the spills and escapes from the Albert Nile were closed with ambatch, as proposed by Sir William Garstin on page 175, and a few dredgers put into the Albert Nile and the Zeraf river the expenditure of a sum of money very moderate indeed compared with £5,500,000 would in all probability result in the two rivers being so widened and deepened that they could carry the full summer supply of the lakes, and so there would be a resulting economy of over £4,500,000 in the new channel from Bor which, when it began working, might introduce on an aggravated scale all the difficulties of to-day in the Albert Nile.
A good description of certain spills is given on page 112 of the Report, a good idea of scour in Plate XXIX., opposite page 110, while on page 181 Sir William Garstin makes the remark that the experience of American engineers has taught us that though in theory it may be possible to shorten or straighten a great river, in actual practice it is accompanied with almost insurmountable difficulties. If the new channel were dug and set working, in a few years it might be as crooked as the Albert Nile itself, unless it were protected with stone along its entire length.
In my project for deepening and widening both the Albert Nile and the Zeraf river to enable them to carry 600 cubic metres per second, I think I have given very solid reasons against abandoning the Albert Nile and sending the whole supply down the Zeraf river at a cost of £3,400,000.
I cannot but think that Sir William Garstin’s recent objections to the Albert Nile are founded on an oversight. He has, apparently, not kept the flood discharges of the Albert Nile at Gondokoro and above the Sobat mouth sufficiently apart from those of low supply. It is the Sobat flood, combined with the poor carrying capacity of the White Nile, which is the disturbing factor, and[93] not any inherent viciousness in the Albert Nile itself. The Albert Nile has a good section, and, if it were trained in conjunction with the Zeraf river, would, I feel confident, discharge all the water required with a very moderate expenditure of money. This, I always understood, was Sir William’s own opinion. In such projects it is wise to remember Horace’s saying, “Naturam furcâ expellas tamenusque recurrit.”
—No consideration of this question would be complete without first examining into the changes which would be made in the regimen of the Nile flood by the contemplated conversion of basin irrigation into perennial irrigation. This question was examined very thoroughly by me in 1892 and 1893 and I give here my arguments for not anticipating any serious difficulties.
We have to consider the effect of the introduction of perennial irrigation on the regime of the Nile. The perfection of the perennial irrigation of the Delta north of Cairo will in no way affect the Nile in flood. The canals will continue to run as they do at present, and the question of conversion in Lower Egypt is therefore quite independent of the subject of flood protection. In Upper Egypt, however, we have 1,460,000 acres of basin irrigation; and as each acre receives in a low flood 80 cubic metres of water per day, in an ordinary flood 130 cubic metres per day, and in an extraordinary flood 170 cubic metres per day, while the demands of perennial irrigation are only 25 cubic metres per acre per day, it will readily be understood that we are dealing with a quantity of water which demands the greatest attention.
To foretell with exactitude the anticipated changes in the regime of the Nile, it is necessary to know first the daily gauges of the Nile at Assuân and Cairo for a period of at least twenty years, and the discharges corresponding to these gauges. The difference between these discharges represents the consumption of water. We have next to determine the amount of water which passes into the canals, the amount utilised in filling up the trough of the Nile and covering the berms, and the amounts evaporated and absorbed. We know that the last three items are constant while the canal discharges are variable and depend on the system of irrigation and, if our data are correct, we can tell with moderate certainty what changes in the level of the Nile will follow certain changes in the system of irrigation.
[94]
Tables 65 and 67 of Appendix L contain the Assuân and Cairo gauges for typical years in a period of twenty years from 1873 to 1892, and the mean gauges of these twenty years. Finding it impossible to understand the Nile without first referring every gauge to some uniform standard, I have had to choose the line of reference. The mean high water level and the mean low water level are both available. In Egypt the mean high water level varies very considerably whether we take it in August and the early part of September when the basin canals are running full supply, or in the latter half of September when the canals are running only half supply, or in October when the basins are discharging back into the Nile. Early and quick rising floods have a different series of levels from slow and late floods; while again the recent works carried out in Upper Egypt by Col. Ross have so increased the discharging capacity of the canals that the flood gauges have been appreciably affected. All this points to the conclusion that the mean high flood is no satisfactory standard. The mean low flood on the other hand is much less liable to change and is very fairly constant from year to year. High floods are certainly followed by scouring out of the bed, and low floods by a silting up of the channel, but the changes are very moderate compared to those in high flood. I have chosen the mean low water level as the line of reference, and referred all gauges to it. From the mean of twenty years’ observations, this level at Assuân is R. L. 85 metres. By observations along the Nile generally, and by calculations at Cairo, I have fixed it at all important places north of Assuân. Table 46 of Appendix K gives the Reduced Levels at different places, while it is also drawn on the longitudinal section of the Nile in Plate XII. It was on this system that the ancient Egyptian engineers worked the Nile. They however chose the mean high water level during the early part of the flood as their standard of reference and consequently made the so called cubits in the flood reaches of the Cairo gauge half cubits. This means a discharge of 1600 cubic metres per second and fairly represents the discharges of the basin canals in flood. When it is considered that the level of the Nile valley is raised by about 10 centimetres per 100 years it will be seen that the old Cairo gauge, which was a living record 1500 years ago, is to-day a meaningless anachronism. It has also to be compared with the Assuân gauge which was erected in Ismail Pasha’s time with an arbitrary zero some 90 centimetres below mean low water level,[95] and which may be reading 17 cubits while Cairo may be recording 25 cubits. The Cairo gauges in winter and summer are no records of discharge as the afflux from the Barrage affects them. To find the discharge at Cairo during these months, I have added those of the Rosetta and Damietta branches and the Delta canals upstream of the Barrage. When the Nile falls below mean low water level, the gauges are recorded as minus quantities.
Discharge sites having been chosen for the Assuân, Assiout and Cairo gauges on the Nile, a continuous series of surface velocity observations, cross sections and slope measurements were made during 1892 and 1893 and the resulting discharges recorded. Curves of discharge have been drawn and referred to the gauges of twenty years and modified until finally a curve has been found which will suit any year whether it is a maximum or a minimum. In connection with this subject, it must be remembered that the Nile bed is raised by silt during low floods and scoured out during high floods and that consequently August and September discharges vary considerably at times from October and November discharges for the same gauge. In addition to this, it must also be borne in mind that the slope of water surface and that consequently the discharge of a flood during the rise is far greater than during the fall for the same gauge reading. Indeed the Nile often discharges more when it is 30 centimetres below its maximum and rising fast than when it has reached its maximum and begun to fall. It is owing to this fact that we often see the discrepancy of the Assuân gauge reaching its maximum a day before Halfa which is 350 kilometres higher up the river. The discharge depends on gauge and slope, and the gauge only records one element. Keeping these facts in my mind, I saw that it was of no use recording the gauges to two places of decimals and covering paper with useless figures, and consequently I have chosen the higher unit for a rising gauge and the lower for a falling gauge when I have been dealing with discharges.
Flood discharges have been taken of all the canals in Upper Egypt through 1892 and 1893 and have been recorded in >Tables 48 and 49 of Appendix K. From these tables, Table 47 has been compiled which gives rough approximate discharges of the canals corresponding to the Assuân gauges in the first half of the flood.
To obtain information about the trough of the Nile, the area exposed to evaporation and the area of absorption, a longitudinal section of the[96] Nile from Assuân to Cairo has been levelled, and cross sections taken at every 3 kilometres. The kilometrage on Plate XII counts from the Assuân gauge and is measured down the centre of discharge of the flood, since it is with flood discharges that we are principally dealing. As the Nile winds about considerably and is often broken into numerous channels, the areas of the cross sections vary very appreciably according as they are taken at right angles to the centre line of discharge or of the deep channel of the river. The former gives the more reliable results. I have taken 8 millimetres per day as the evaporation during flood in Upper Egypt. The absorption has been calculated from the water consumption during the floods of 1892 and 1893, and found to be about 300 cubic metres per second between Assuân and Assiout, where there is practically no perennial irrigation. Between Assiout and Cairo, where there is a considerable length of perennial irrigation on one bank and limestone rock on the other, the absorption is about 100 cubic metres per second.
When perennial irrigation has once established itself in Upper Egypt, we may assume that the absorption during flood will be halved in quantity for the reasons given above, and become 150 cubic metres per second between Assuân and Assiout, and 50 cubic metres per second between Assiout and Cairo. The amount of water expended in irrigation will be about 700 cubic metres per second. The evaporation during flood will be approximately 120 cubic metres per second. The quantity of water needed to fill the trough of the Nile will depend on the gauges and may be calculated from table 43 of Appendix K. The last item will be the only variable one and the others may be approximately tabulated as follows:—
Expenditure of water in flood in cubic metres per second:
| Between Assuân and Assiout. |
Between Assiout and Cairo. |
TOTAL | |
|---|---|---|---|
| Perennial irrigation | 350 | 350 | 700 |
| Evaporation | 65 | 55 | 120 |
| Absorption | 150 | 50 | 200 |
| Total of above | 565 | 455 | 1020 |
Taking these quantities and calculating directly for the filling of the trough from the gauges themselves, I have collected in Tables 50 to 52, the Cairo gauges corresponding to the Assuân gauges for[97] the high years 1874 and 1878 and the minimum year 1877. As far as the more important results are concerned, I tabulate them here:—
Gauges at Assuân and Cairo.
| Date. | 1874 | 1878 | 1892 | 1877 | |||||||||
|---|---|---|---|---|---|---|---|---|---|---|---|---|---|
| As- suan. |
Cairo with basin irriga- tion. |
Cairo with peren- nial irriga- tion. |
As- suan. |
Cairo with basin irriga- tion. |
Cairo with peren- nial irriga- tion. |
As- suan. |
Cairo with basin irriga- tion. |
Cairo with peren- nial irriga- tion. |
As- suan. |
Cairo with basin irriga- tion. |
Cairo with peren- nial irriga- tion. |
||
| August | 5 | 6.9 | .. | .. | 5.6 | .. | .. | 6.3 | .. | .. | 4.9 | .. | .. |
| 10 | 7.4 | 6.5 | 5.8 | 5.3 | 4.9 | 4.4 | 6.8 | 5.3 | 5.1 | 5.4 | 4.0 | 3.9 | |
| 15 | 8.5 | 6.9 | 6.4 | 7.2 | 5.4 | 5.2 | 6.7 | 5.8 | 5.8 | 5.8 | 4.7 | 4.6 | |
| 20 | 8.6 | 7.3 | 7.8 | 7.5 | 6.0 | 6.3 | 7.4 | 5.4 | 6.2 | 6.4 | 4.6 | 5.0 | |
| 25 | 8.7 | 7.5 | 7.9 | 8.1 | 6.3 | 6.5 | 8.3 | 5.8 | 6.5 | 6.1 | 5.3 | 5.5 | |
| 31 | 8.7 | 7.6 | 8.1 | 7.6 | 6.6 | 7.2 | 8.3 | 6.6 | 7.7 | 6.2 | 5.3 | 5.6 | |
| Sep- tember |
5 | 9.0 | 7.7 | 8.2 | 8.1 | 6.5 | 7.5 | 8.6 | 6.9 | 7.7 | 6.3 | 5.2 | 5.2 |
| 10 | 8.8 | 8.0 | 8.3 | 8.5 | 6.8 | 7.5 | 8.8 | 7.1 | 8.0 | 6.1 | 5.3 | 5.3 | |
| 15 | 8.7 | 8.2 | 8.4 | 8.9 | 7.2 | 8.0 | 8.8 | 7.5 | 8.3 | 6.0 | 5.2 | 5.5 | |
| 20 | 8.4 | 8.3 | 8.5 | 8.9 | 7.6 | 8.5 | 8.9 | 7.9 | 8.3 | 6.0 | 5.2 | 5.4 | |
| 25 | 8.4 | 8.4 | 8.2 | 9.0 | 7.9 | 8.5 | 8.6 | 8.1 | 8.4 | 6.3 | 5.1 | 5.4 | |
| 30 | 8.2 | 8.4 | 8.2 | 9.1 | 8.2 | 8.5 | 8.4 | 8.3 | 8.4 | 6.1 | 5.3 | 5.6 | |
| Oc- tober |
5 | 7.9 | 8.7 | 7.9 | 8.9 | 8.4 | 8.6 | 8.2 | 8.4 | 8.3 | 5.6 | 5.2 | 5.4 |
| 10 | 7.6 | 8.5 | 7.6 | 8.5 | 8.7 | 8.6 | 7.8 | 8.3 | 8.1 | 5.2 | 5.0 | 5.0 | |
| 15 | 7.2 | 8.3 | 7.4 | 7.9 | 8.4 | 8.4 | 7.4 | 8.1 | 7.7 | 4.9 | 4.9 | 4.6 | |
| 20 | 6.6 | 8.0 | 7.0 | 7.6 | 8.1 | 8.0 | 7.2 | 7.9 | 7.2 | 4.6 | 4.6 | 4.4 | |
| 25 | 6.2 | 7.7 | 6.3 | 7.4 | 7.9 | 7.4 | 6.8 | 7.9 | 7.0 | 4.5 | 4.4 | 4.0 | |
| 31 | 5.6 | 7.0 | 5.9 | 6.8 | 7.7 | 7.2 | 6.3 | 7.8 | 6.6 | 4.0 | 4.2 | 3.9 | |
[98]
To enable one to compare these figures which are in metres and referred to mean low water level, with the gauges as recorded at present, I add the following table:—
| ASSUAN | CAIRO | ||||
|---|---|---|---|---|---|
| Real gauge in metres. |
Gauge as recorded in cubits and 24ths. |
Real gauge in metres. |
Gauge as recorded in cubits and 24ths. |
||
| Cubits. | 24ths. | Cubits. | 24ths. | ||
| 0.0 | 1 | 13 | 0.0 | 6 | 9 |
| .5 | 2 | 12 | .5 | 7 | 7 |
| 1.0 | 3 | 10 | 1.0 | 8 | 5 |
| .5 | 4 | 8 | .5 | 9 | 4 |
| 2.0 | 5 | 6 | 2.0 | 10 | 2 |
| .5 | 6 | 4 | .5 | 11 | 0 |
| 3.0 | 7 | 3 | 3.0 | 12 | 0 |
| .5 | 8 | 1 | .5 | 13 | 0 |
| 4.0 | 8 | 23 | 4.0 | 13 | 23 |
| .5 | 9 | 21 | .5 | 14 | 21 |
| 5.0 | 10 | 20 | 5.0 | 15 | 19 |
| .5 | 11 | 18 | .5 | 17 | 12 |
| 6.0 | 12 | 16 | 6.0 | 19 | 8 |
| .5 | 13 | 14 | .5 | 21 | 4 |
| 7.0 | 14 | 12 | 7.0 | 22 | 12 |
| .5 | 15 | 11 | .5 | 23 | 10 |
| 8.0 | 16 | 9 | 8.0 | 24 | 9 |
| .5 | 17 | 7 | .5 | 5 | 7 |
| 9.0 | 18 | 5 | 9.0 | 26 | 5 |
| 16 | cubits | at | Assuân | corresponds | to | 7.8 | metres. | 16 | cubits | at | Cairo | corresponds | to | 5.1 | metres. |
| 17 | „ | „ | „ | „ | „ | 8.3 | „ | 22 | „ | „ | „ | „ | „ | 6.7 | „ |
| 18 | „ | „ | „ | „ | „ | 8.9 | „ | 23 | „ | „ | „ | „ | „ | 7.3 | „ |
| A cubit is known in Egypt as a pic. | 24 | „ | „ | „ | „ | „ | 7.8 | „ | |||||||
| 25 | „ | „ | „ | „ | „ | 8.3 | „ | ||||||||
| 251⁄2 | „ | „ | „ | „ | „ | 8.6 | „ | ||||||||
The flood of 1874 was an early one and the basins were discharged on a falling Nile, still they raised the Cairo gauge to 8·7 metres on the 5th October while it would have risen to 8·5 on the 15th September with perennial irrigation. The flood of 1878 was an exceedingly late one and the basins had to be discharged while the river was still very high. By the 10th October, the river had risen to 8·7 metres at Cairo when the banks were breached and all future rise stopped. With perennial irrigation, the maximum gauge of 8·6 metres would have been reached on the 10th October. The flood of 1892 was at Assuân 10 centimetres below that of 1874 and 20 centimetres below that of 1878, and midway between them in point of time. It was also under complete control owing to the new regulating works on the basins. It rose to 8·4 metres at Cairo on the 5th October and fell exceedingly slowly. With perennial irrigation, it would have risen to 8·4 at Cairo on the 30th September and then fallen rapidly.
Speaking generally, we may say that with perennial irrigation the very high floods at Cairo will be 15 days in advance of what they are[99] at present, that they will not rise higher, and that they will fall 15 days earlier than what they do now. With low floods there will be no appreciable difference as to date, but the floods will be slightly higher at Cairo. In ordinary floods, there will be an advance of from 20 to 25 days in the date of the maximum flood, and a maximum gauge at Cairo 50 or 60 centimetres under the maximum gauge at Assuân. We have so far considered Cairo only, as the Delta proper depends on the Cairo gauge. We now turn to the Nile in Upper Egypt itself: south of Sohag, there will be no serious change in levels, but the Sohagia and Ibrahimia canals between them carry at present 750 cubic metres per second in excess of what they would carry if there were perennial irrigation in Egypt, and the greater part of this water is not returned to the Nile until the Kushesha escape is reached. The reach of the Nile from Sohag to Kushesha is the one which will experience the greatest changes, and I calculate that there will be a rise of 40 centimetres as compared with the maximum gauges under basin irrigation.
It will be noted that at the beginning of this paragraph I stated that “the perfection of the perennial irrigation of the Delta north of Cairo will in no way affect the Nile in flood.” This had reference only to the quantity of water taken from the Nile in high floods. There is however one very serious aspect of this question. The regulation on the Barrage in low floods, which has gone on steadily since 1899 when Sir Hanbury Brown used the Barrages in flood for the first time, has enormously increased the value of the works, but it has certainly caused the Main Nile to silt, and probably also the branches, owing to a reduced discharge and velocity of the silt-bearing water, whose capacity to carry on that quantity of silt depends on its velocity. It seems to me that unless steps are taken to insure the scouring out of this silt by the clear water of November, December and January the consequences will be very serious. High floods scour out their beds, but if a very high flood were to come early before the silt had been scoured out, it might overflow the banks near Cairo or in the middle reaches of the Nile branches in the Delta.
Sir William Garstin has estimated the cost of converting the existing basins of Upper Egypt into perennially irrigated land at £7,000,000, thus made up:—
| Conversion of Upper Egypt basins | £ | 5,000,000 |
| Two barrages between Assyut and Kena | „ | 2,000,000 |
| Total | £ | 7,000,000 |
[100]
The resulting land tax from the improved irrigation in Upper or Lower Egypt he has estimated as follows:—
| Upper Egypt. | - | Basin land converted | 750,000 | acres | @ | £ | ·50 | = | £ | 375,000 | |
| Land irrigated by pumps | 100,000 | „ | @ | £ | ·30 | = | „ | 30,000 | |||
| Lower Egypt. | Reclaimed land | 800,000 | „ | @ | £ | 1.00 | = | „ | 800,000 | ||
| Total | £ | 1,205,000 | |||||||||
—Lord Cromer’s wise decision to construct the Suakin-Khartoum railway immediately and the Abu Hamed-Dongola railway as soon as possible, is the charter of the development of the Sudan. With these railways and especially the former in working order, we can arrange for irrigation works for the production of cotton and wheat for export, knowing that they can be exported at a cost of transport which will not be absolutely prohibitive. The soil of the Sudan along the Blue Nile, the Atbara, the Main Nile and a great part of the White Nile is the same as that of Egypt itself. It has all come from Abyssinia. When at Khartoum last February, I collected specimens of typical Gezireh soil from points 10 miles south of Khartoum and from near Khartoum itself. They were analysed by Mr. Frank Hughes and reported on by Mr. Foaden.
The specimens were numbered as follows:—
(1) Typical Gezireh soil from a point 10 miles south of Khartoum near the Blue Nile.
(2) Typical Gezireh soil from a point 2 miles south of Khartoum near the White Nile.
(3) White Nile side under cultivation in 1904.
(4) White Nile side below flood level.
(5) Blue Nile side, not so common as (1).
(6) The sandy soil generally within 5 miles of Khartoum.
Nos. 1, 2, 5, and 6 are above high flood level of both Niles.
“The nitrogen and salt were determined in the samples, as received, without drying.
| Nos. | 1 | 2 | 3 | 4 | 5 | 6 |
|---|---|---|---|---|---|---|
| Nitrogen | 0·078 | 0·059 | 0·062 | 0·057 | 0·056 | 0·052 |
| Common salt | 0·050 | 0·020 | 0·010 | 0·090 | 0·170 | 0·020 |
“All contain abundance of carbonate of lime; Nos. 1 and 2 might almost be called calcareous. All gave a strong reaction for phosphoric[101] acid, and there is therefore every reason to believe that they are rich in this ingredient. So far as the texture of the soils is concerned, little can be said except that they differ from those previously examined for Kena Mudirieh, in containing a large amount of coarse sand 1-3 m.m., which is entirely absent in most Egyptian soils; No. 6 would probably be too light for agricultural purposes in its present condition.
“The nitrogen is as high as one would expect but is lower than is necessary for fertile soils. It would be necessary therefore to encourage the growth of leguminous crops to increase the quantity of nitrogen in the soil and to employ nitrogenous manures. It must be borne in mind that in soils of this class the nitrogen is usually in a highly insoluble and un-nitrifiable form.
“The salt is in no case high; 0.25% is usually considered to be the limit for satisfactory growth; all the samples are well below this limit.”
I had complete analyses made of numbers (1) and (2). The results were as follows:
| No. 1 | No. 2 | |
|---|---|---|
| Silica etc. insol in mineral acid | 74.76 | 73.85 |
| Lime (Ca.O.) | 6.07 | 4.56 |
| Carbonic Acid (C.O.₂) | 3.64 | 2.40 |
| Equal to Chalk (Ca.C.O.³) | 8.27 | 5.46 |
| Potash | 0.23 | 0.34 |
| Phosphoric Acid | 0.14 | 0.12 |
| Organic Matter | 2.88 | 4.07 |
| Nitrogen | 0.075 | 0.062 |
| Calculated on soil dried at 100°. | ||
Though none of these specimens contained salt in excess, Nile deposit in certain localities has very large proportions of common salt and sulphate of soda. The dark soil near the Atbara mouth at El-Damer is largely exploited for common salt, while similar soil south of Khartoum is free from it.
The extent of this Nile deposit soil is very great indeed and if irrigation could be assured, there would be a great future before the Sudan.
In Mr. Dupuis’s Report which is the last appendix to Sir William Garstin’s Report, he speaks of this soil as being met with on the Blue Nile, on the Rahad, on the Atbara and on the Gaash. From Khartoum northwards the main Nile flows between berms of this soil.
The extent and quality of this soil may therefore be considered as an undisputed asset of the Sudan. We have next to consider the seasons.
[102]
A reference to tables 76, 77, and 80 will show how much warmer the Sudan is than Egypt, and any attempt to introduce Egyptian methods into the Sudan without modifications will not at once turn the Sudan into Egypt. I allow that extensive plains of irrigated land greatly moderate the heat as they have already done in Middle Egypt; but we have to begin from the beginning in the Sudan, and there are no extensive plains of irrigated land. Basin irrigation will be a failure in the Sudan unless it is supplemented by two or three waterings in the winter, for all crops except the cheapest and coarsest leguminous crops. Wheat must be irrigated in winter whether sown in a basin or on the Nile berm, except in a few choice, low and damp localities. Cotton, on the other hand, which has to be sown in spring in Egypt and reaped in autumn will need such an extraordinary quantity of water to pull it through the summer that it will be found preferable to grow it in June with the rising flood and reap it at the end of the winter. Irrigation therefore from June to October for Indian corn, from June to February for cotton, and from November to February for wheat will be essentials of a good harvest in the Sudan.
We now come to the question of the water supply. Unless permits are given for pumps to work from the 15th June to the 15 February, the cultivation of cotton and wheat on any scale in the northern part of the Gezireh, along the main Nile between Khartoum and Dongola, and on the lower reaches of the Atbara will be out of the question. Maize and millets and some of the coarser leguminous plants might be developed by pumps with permits to work from 15th June to 15th October, but it would pay no one to put up pumps on these terms.
Fortunately for the joint interests of Egypt and the Sudan, though Egypt cannot spare water between the 15th March and 30th June, which would correspond to 1st March and 15th June in the Sudan; she has enough to spare for pumps at other times, though she has not always enough to spare for large free flow schemes in the Sudan. Free flow schemes in the Sudan, except during high and good floods, have however yet to be found.
Speaking generally we may say that the agricultural success of the Sudan will depend on permits for pumping engines to work between the 1st June and the end of February. There should be no difficulty in the way of such permits being given. We have spoken so far of schemes within the power of individuals and companies. Of schemes which the Government alone could carry out by itself or in conjunction with powerful companies, the most promising seem to be those which are connected with the 6th cataract. This cataract seems well suited for the construction of a solid dam to create power and develop electricity to work pumps between it and Khartoum, and some 30 kilometres up the Blue Nile; and if possible to allow of a canal down the left bank of the Nile as far as Berber. This project might be studied with advantage and a greater amount of water storage for summer use be also obtained.
PLATE XX
Sketch Plan
of
COUNTRY ABOUT DELGI
N.W. of L. Tsana
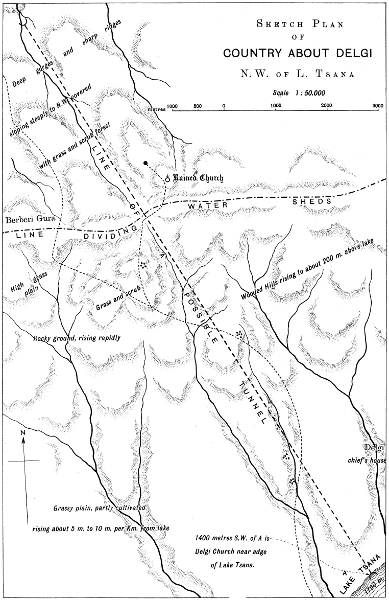
Lith. Sur. Dep. Cairo.
Larger map (380 kB)
[103]
Another scheme is the construction of a double barrage and weir near Wad Medani on the Blue Nile, with canals irrigating the Gezireh and the right bank of the Blue Nile and the Nile to Shabluka. Unfortunately no cross sections have been taken of the Blue Nile showing how high the Gezireh is above the bed and water surface of the Blue Nile at Wad Medani. A weir further south would, as Mr. Dupuis states, entail very expensive canals to irrigate the lands south of Khartoum.
Mr. Dupuis’s report on the Atbara is not very hopeful. Without reservoirs this torrential river could insure no crop except millets and Indian corn. The same may be said for the Gaash. Basins without winter irrigation would, I think, be most unsatisfactory.
Examining Mr. Dupuis’s figures and sections for the outlet of lake Tsana, I calculate that this reservoir would not supply a fraction of the water estimated by Mr. Dupuis. If I were wrong, and I should be pleased indeed to be wrong here, a tunnel along the alignment roughly surveyed by Mr. Dupuis, Plate XX, leading the waters of Lake Tsana into the Rahad river, and from there under the Blue Nile by a syphon, and branch canals irrigating both banks of the Rahad and both banks of the Blue Nile to Khartoum, would be one of the boldest projects in the world.
It will be noted that no mention has been made of the tracts between the foothills of Abyssinia and Wad-el-Medani which can produce good crops of Indian corn, millets and even cotton in nine years out of ten with the aid of rain without irrigation. If the land could lend itself to basins similar to those of Bundelkund or to river fed pans as in Madras, a development of this country would be possible. Ordinary Egyptian basin irrigation would be, I think, of no use.
The following quotations from a letter written by Messrs. Choremi, Benachi and Co., of Alexandria, to Mr. Foaden on the 8th February 1904, will give an idea of the estimation in which Sudan grown cotton is held in Alexandria:—
“The cotton generally is good and superior to any Sudan cotton I[104] have yet seen. Last year the best I saw was sent by the Sudan Government and grown in Miralai Stanton Bey’s garden, with artificial irrigation and quality was (first picking) class “good”, equal to Beni-Suef or Minieh cotton, but more woolly. In any case it is saleable cotton for coarse Nos. of Yarn, not what we call Bolton Spinners’ cotton.
“I now give you the following classification and values compared to Standard of Full Good Fair Lower Egypt which is the basis of “Futures” in our Market and Liverpool.
“On Upper Egypt the outturn in ginning on basis 315 lbs. per cwt. in seed runs from 100 to 104, and Lower Egypt 105-110 according to province grown and quality of seed.
| No. 1 | Outturn | 96 | Class “good”, value P.T. 5 over Delta fully good fair—colour rather light—good staple, better than Beni-Suef Ashmouni or even Afifi. |
| No. 2 | „ | 981⁄2 | Long staple and finish does not look grown from afifi seed but from superior quality, value about P.T. 15 over F.G.F. |
| No. 3 | „ | 99 | Class “good”, the seed of this is from Delta because mixed—there is also some Abassi in and does not look as from afifi seed because finer than any afifi grown in Minieh and Beni-Suef, value 5 to 10 over F.G.F. |
| No. 4 | „ | 1021⁄2 | “Good” in class, from mixed seed—some looks afifi, other better, probably Yannovich seed. There are traces of abassi—and is irregular in strength, value P.T. 15 to 20 over F.G.F. |
| No. 5 | „ | 100 | Also from mixed seed—I can trace afifi quality and Yannovich, also some abassi. Value over F.G.F. about 7 to 10 P.T. |
| No. 6 | „ | 1031⁄2 | About same as No. 5 and with same mixture. |
[105]
“From the above report you will see that quality generally is good—but I regret the seed got mixed—probably through mistakes in transport or if in single bags some broke and seed became mixed.
“The outturn in ginning I consider good and the seed I notice deteriorates but very little as you can see—though with that of Stanton Bey’s I examined with you last year, the deterioration was, if I remember right, something like 10% in one year. The seed from the non irrigated Sudan (I suppose near Khartoum) though from good Afifi seed, almost becomes unfit for sowing and the quality of this cotton had a very poor outturn of about 73%.
“Rain crops cannot be depended on, because if no rain for some time the quality will be totally spoilt.
“I fail to find any trace of sand in the samples—though the common Sudan non-irrigated cotton was very dirty and sandy.”
The following extracts from a letter written to me by Ibrahim Effendi Fahmy, originally a student of the Cairo Agricultural College and at the time of writing Government agriculturist at Khartoum and on leave in Cairo, will be found interesting.
“There are three seasons in the Sudan, which are different from those in Egypt. The seasons are:—1st the winter which extends from the 1st November to the end of February, in this season wheat, beans, barley, onions, Indian corn and millets are planted: 2nd, the summer which extends from 1st March to the 15th June, in this season, practically speaking, nothing is planted except a small quantity of millets, and in the middle of the season from the 1st May to the 15th June all agricultural work is stopped owing to the great heat and deficiency of water: and 3rd, the flood season or “Demera” from the 15 June to the end of October; in this season the rains fall, the Nile rises and the heat is decreased, two crops of millets can be taken and cotton, sesame and earthnuts are sown.
“Manures are the same as in Egypt.
“Cotton sown in March, April and May needs so much water through the summer that its cost is prohibitive. In the really hot weather it must be irrigated every three days. High winds and rain hurt the first open pods, and the pickings are on the 20th August, 20th September and 15th October. After 22 waterings a good field will give 41⁄2 cwt. per acre.
“Cotton sown in June and July has an even, regular growth. The rains and moisture in the air encourage the growth of the plant.[106] The height of the flood permits of easy irrigation even when it is lift. The plants grow to a great size but have many bolls. The following table will show the growth of the plants.
| Date of planting. |
No of waterings |
First picking. |
Last picking. |
|---|---|---|---|
| 25 June | 16 | 1st January | March 15 |
| 3 July | 16 | 15th January | March 31 |
| 30 July | 15 | 15th February | April 15 |
“The yield of a good field is 51⁄2 cwt. per acre. The fibre is better than that of the cotton sown in March and April.
“I consider that June and July are the best months for sowing, and that cotton sown from well-selected seed and well cultivated will prove itself a cotton of superior quality, ranking with Egyptian cottons.
“The following table gives the kinds of crops, other than cotton which can be profitably grown in the Sudan:—
| Crop | Time of sowing. |
Time of ripening. |
No of waterings |
Produce | ||
|---|---|---|---|---|---|---|
| Egyptian wheat | Nov. & Dec. | April | 3 | 5 | 1⁄2 | ardebs |
| Indian wheat | December | » | 3 | 5 | » | |
| Egyptian barley | » | March 31 | 2 | 11 | » | |
| Australian barley | » | » | 2 | 5 | » | |
| Beans | » | » | 3 | 5 | » | |
| Lentils | » | » | 3 | 3 | 1⁄2 | » |
| Earthnuts | July | January | 9 | 9 | » | |
| Indian corn | » | September | 4 | 6 | » | |
| American maize | » | October | 7 | 4 | » | |
| Potatoes | November | March | 3 | 150 | kantars | |
| Lucerne | March | March year | 12 | 1800 | » | |
| in 12 cuttings of 150 kantars each. |
||||||
“Fodder crops such as birseem and vetches (gilban) when well watered are satisfactory.
“If the land is not well tilled, manured and looked after, wheat will require 6 waterings and barley 4 waterings.
“If water can be obtained in the Sudan, the agricultural problem is very easy.”
I cannot do better than close this chapter with this thoroughly Egyptian remark of Ibrahim Effendi Fehmy.
[107]
—The chief oases[6] of the Libyan desert—Dakhla, Kharga, Baharia and Farafra,—occupy extensive depressions cut down through the horizontal Eocene strata[7] to the underlying saddle of Cretaceous rocks; some of the more porous beds of the latter are water-bearing and from them, either through natural passages or through artificial borings, the water rises to the surface, often under considerable pressure. The floor level varies considerably but the cultivated lands in general lie between 70 and 115 metres above sea level.
[6] See Geological Survey reports, P.W.M., Cairo.
[7] With the exception that Dakhla is almost entirely cut out in Cretaceous strata.
—This, by far the most important and prosperous of the Egyptian oases, lies three days’ march west of Kharga, or about 300 kilometres due west of Armant in the Nile valley. The site is a depression lying at the foot of the great east and west Cretaceous escarpment, bounded to the south by the undulating desert of Nubian sandstone, which stretches unchanged almost to the heart of the continent. The inhabitants of Dakhla, numbering over 17,000, are distributed among 12 villages and form a practically self-supporting community. The cultivable land within the oasis (400 square kilometres) amounts to nearly 50,000 acres, of which one half is under cultivation; in addition several extensive areas of alluvium covered ground exist outside the oasis proper, notably on the Gabbari road between Dakhla and Kharga. Owing to the difficulty of drainage, salines, saltyland, marshes and pools occupy some 7,000 acres.
There are nearly 130,000 adult palm trees in Dakhla, a large export trade in dates being carried on with the Nile valley; the finest crops of wheat and barley are raised, while the fruits of the oasis, oranges, apricots, mulberries, etc., are abundant and of excellent quality.
Taxes are levied as follows:—(1) Mature date-palms are taxed 11⁄2 piastres each per annum; (2) Modern wells (i.e. biyâr, made with the existing boring plant) pay 50 piastres per annum per qirat of water; (3) Ancient wells (aiyûn) pay the same, except that in some cases those used for irrigating palmgroves are exempt. There are 71⁄2 trees and 11⁄2 acres per inhabitant, and the total tax paid by the community is about £E. 2,500.
The water-supply of the oasis is derived from an underground bed of sandstone, 55 metres thick, underlying a dense impervious red clay 45 metres in[108] thickness; the upper part of the latter is conspicuous throughout the oasis, underlying the alluvium and forming the base of the surrounding escarpments in many localities. Below the water-bearing sandstone lies a black clay, never yet penetrated by the boring rods; it is probable that other water-tables exist below and such would be invaluable for the irrigation of those parts of the oasis where the present supply is unsatisfactory. There seem to be no natural springs extant at the present day, the whole of the water-supply being through boreholes, both ancient and modern. The old wells, known as ain, aiyûn, appear to be mostly of early Egyptian and Roman construction, and number over 400; exactly similar wells have been sunk by boring plant during the last few decades and are called bîr, biyâr; there are over 160 of these; all are true artesian wells. At the present day the method in vogue is as follows:—a two metre square timbered shaft is sunk by hand to the base of the red clay and within this is built up a watertight wooden pipe, 35 cm. in diameter, made of ‘sunt’ (a species of thorny acacia), the surrounding space being packed with clay. Sinking is continued in the sandstone with the boring machine until a satisfactory flow of water is obtained. Many of the older wells in the oasis have become choked up, and although some have been successfully cleaned out by the inhabitants, but the process is costly and laborious and frequently fails. The work is done by divers, a small but hardy class only found in Dakhla and Farafra.
The output of wells is determined in a somewhat rough and ready manner by measuring the depth of water passing over a weir fixed in the stream. It is reckoned in qirats, one qirat being a water-section of 64 square centimetres; from some test observations in Kharga Dr. Ball deduced the average value of a qirat, as measured in that oasis, as 230 litres a minute. The total water-output in Dakhla (1096 qirats) may thus be taken as approximately representing a discharge of 132 million cubic metres per annum, and taking the cultivated lands as 25,500 acres the duty is 6,130 acres per cubic metre per second. That the water-supply could be largely increased, and the limits of cultivation greatly extended, admit of no doubt, but with the free hand accorded the natives during the last few decades a considerable amount of damage has been done throughout the oasis by the injudicious sinking of wells. Promiscuous boring is fatal, and strict and efficient control of all boring operations imperative. Considering the number of wells abandoned owing to a slight fall in the water-level having caused them to cease running at the surface, the importance of lifting appliances, in the shape of shadûfs, saqias, or windmills, is evident, but until a few years ago the oasis was destitute of such appliances; a number of saqias have recently been fixed in the village of Mushîa and have met with success, but it is not an easy matter to persuade the inhabitants to have recourse to lifting appliances of any description.
Some of the Dakhla wells are of considerable depth; Bir-el-Dinaria, the most northerly in the oasis, is 144 metres deep and its water emerges with a temperature of 39·5° C. The best wells yield 9 or 10 qirats, though before the modern boring operations the output of some was as much as 16. The terms ‘artesian’ and ‘thermal’ may fairly be applied to the Dakhla wells, and it is noteworthy that the temperatures as a whole increase from south to north. The thermal character of the springs may be considered to be due to the great depths from which the water is derived, the actual temperature at the point of exit being dependent on local conditions, such as the depth of the well and the rate at which the water finds its way to the surface. It is probable that the water-bearing table has its outcrop in the rainy regions of Darfur, although some of its water may be derived by direct infiltration from the Nile in its upper reaches.
[109]
—Kharga, the easternmost of the two southern oases, is a north and south lying depression, mostly bounded by steep and lofty escarpments but open to the south and south-west. A great part of its floor, which is composed of the Nubian sandstone, is buried under sand accumulations. There are seven principal villages, besides numerous hamlets and smaller settlements, with a total population of under 8,000. Taxes are levied as in Dakhla and amount to slightly over £E. 1000. The adult palm trees in the oasis number about 60,000 and the cultivated lands have an area of some 4,500 acres, or half an acre and eight palm trees per inhabitant. The crops raised do not appear to be sufficient to support the population, as a certain amount of grain is imported from Dakhla. Dates are exported to the Nile valley, though in less quantities than from Dakhla and Baharia.
The general level of the floor of the oasis lies between 50 and 130 metres above sea level, though near Qasr Zaiyan a limited area appears to lie below sea level. Water is met with in most localities on digging to a moderate depth, but the best supplies are from deep wells; as in Dakhla the majority of the wells are of considerable antiquity, though some have been recently made with modern boring plant. With an increased water-supply cultivation could be very much extended, as there are large areas of unoccupied alluvium covered land within the oasis. The same difficulties exist in Kharga as in the other oases, though here perhaps aggravated by the encroachments and movements of blown sand, namely, the lack of control of the wells and water-supply and the apathy of the inhabitants generally.
, lying 180 kilometres west of Minia, is a large natural excavation 150 metres deep and entirely surrounded by escarpments. The cultivated lands bear a very small proportion to the total oasis-area; their general level is 110-115 metres above sea level, rising to 155 metres at Ain-el-Haiss in the southern part of the depression. There are four chief villages with a population, inclusive of outlying settlements, of just over 6,000. The standard of public health in this oasis is low, mainly owing to febrile disorders. The total area of cultivated land is about 2,500 acres (barely 1⁄2 an acre per inhabitant), largely made up of palmgroves; rice, wheat and barley are grown, but the area sown with cereals has of late years being decreasing in extent owing to a diminished output from the springs. Baharia is par excellence the date-producing oasis of Egypt and very large quantities are annually exported to the Nile valley; besides date-palms the gardens contain numbers of olive, apricot and other fruit trees. Taxation is on palm trees and land.
The water-supply is derived from the Cretaceous sandstones forming the floor of the depression, the water rising naturally to the surface of the lowest areas. In numerous cases long adits have been driven into the rock to obtain an[110] increased supply; these tunnels communicate with the surface of the ground by a series of air shafts; they mostly date from early times. No deep wells appear to exist in the oasis and certainly no borings have been made in modern times. The fall of the water-level is probably due to the gradual choking of the passages; an unsatisfactory and laborious method of cleaning out wells is in vogue but little trouble is taken to prevent the deterioration of the water-supply generally. Practically all the available land in this oasis is under cultivation, although with the reduced output of the springs the supply is barely sufficient for efficient irrigation.
occupies a large semicircular depression 300 kilometres west of Assiut. The floor is formed of the white chalk at the top of the Cretaceous, but at Ain-el-Wadi, a spring in the north part of the depression at 26 metres above sea level, the underlying beds are locally exposed. The solitary village of Qasr Farafra is situated on the western side at 76 metres above sea level, and contained 542 inhabitants at the last census. In the entire area there are some 20 springs, mostly grouped round the village, each irrigating a small patch of cultivated ground; the total area of the latter, including the few palmgroves, probably does not amount to 500 acres. Wheat, barley, durra, rice, onions and some fruit are grown, and small quantities of dates and olives are exported; formerly the olives of Farafra were celebrated for their quality, but of late years the trees have deteriorated.
The water rises as springs from the white chalk and does not necessitate the use of lifting appliances, though the output appears to be decreasing through natural causes. There are a few examples of horizontal conducting channels of ancient date and two or three of the springs appear to have deep vertical shafts as in the ancient wells of Dakhla. Sweet and brackish water-holes occur in several outlying localities within the depression, as well as in the neighbouring little known oasis of Iddaila to the west. Owing to the absence of waste pools and marshy land the climate of Farafra is more healthy than that of the other oases.
[8]. The north-east corner of Africa, lying between the Red Sea on the east and the sand merged portion of the Libyan Desert on the west, and stretching from the Mediterranean to the 22nd parallel of north latitude, both in its topographical and geological characters is distinctly tripartite, as follows:—
(1) A rugged broken undulating sandstone desert, forming the southern part of the country;
(2) Elevated plateaux, for the most part of limestone, stretching from lat. 25° N. (approximately) to the Mediterranean;
(3) The mountainous igneous range of the Red Sea Hills, with peaks over 1800 metres (6000 feet) in height.
[8] In writing this note at the request of Sir William Willcocks I have made free use of all sources, of information, but am chiefly indebted to the publications of Schweinfurth and the late Professor Zittel, Capt. Lyons, and my past and present colleagues on the Geological Survey of Egypt.
As a whole one of the most waterless and desolate areas in the world, the country is traversed from south to north by a narrow highly cultivated and thickly[111] populated strip of alluvial land, formed and watered by the Nile. In the southern sandstone country the river occupies only a shallow valley, but to the north flows over the floor of a deep gorge cut down from the surrounding limestone plateaux. On either side of the river are alluvial plains of varying extent, composed of the finest loam, a fertile soil for the most part formed by the disintegration of the volcanic rocks of the Abyssinian highlands, annually denuded by rains and brought down by the Atbara and Blue Nile floods and deposited in the lower courses of the river. Unlike most countries therefore, the soil of Egypt has no connection with the underlying rocks, being entirely of extraneous origin and owing its existence absolutely to the peculiar conditions of rainfall in Abyssinia and the direction of drainage from the watersheds of that country.
The most ancient rocks in Egypt are found in the central igneous ranges of the Red Sea Hills and in the crystalline floor underlying the sandstones in the southern part of the country.
In Nubia the crystalline rocks consist largely of granite and gneiss, with associated diorites and schists, traversed by basaltic and felsitic dykes. Cataracts have been formed at those points where the river crosses the hard igneous belts, which may be regarded as the summits of the higher ridges of an old eroded continental land surface.
In the Red Sea Hills the most ancient rocks are the gneisses, schists, and slates, constituting the metamorphic series of Jebel Meeteq. Next in succession is a volcanic group, consisting of dolerite and sheared diabases in the south and of dolerites, andesites, tuffs and agglomerates in the north. These volcanic rocks are underlaid and intruded by still younger quartz-diorites and grey granites, and like them are pierced by masses of red granite and dykes of quartz felsite and dolerite. The red granite is itself traversed by dykes of diabase, which are thus the youngest of all, except for the still more recent andesitic intrusions into the Eocene limestones (occasional occurrences of which are met with on the plateaux on both sides of the Nile valley), and the basaltic sheets which commonly mark the base of the Oligocene sandstones in the north of the country.
The whole of the Red Sea Hills igneous complex has been planed down by marine erosion, the oldest sedimentary deposits being laid on to the smoothed denuded surfaces.
Geologically the sedimentary deposits of Egypt are not of great age. Broadly they consist of a great development of Upper Cretaceous and Eocene strata, followed by more restricted deposits of Oligocene and Miocene age, the still younger formations being represented only by comparatively local though important, accumulations. As a general rule the different members of the Cretaceous and Tertiary succeed each other in regular order from south to north, the strata being undisturbed and dipping northwards at a very low angle.
The Cretaceous system in Egypt is divisible into three main groups, (1) a great thickness of freshwater arenaceous sediments known as the Nubian Sandstone, of Senonian age in the south (Dakhla, Nile valley, and southern part of Eastern Desert), and Cenomanian age in the north (Baharia, Abu Roash(?), and Wadi Araba); (2) 300 metres of argillaceous deposits with bone-beds near the base, of Senonian age; (3) a deep water foraminiferal[112] white chalk (Danian) 60 to 100 metres thick, especially developed in the region of the oases to the west of the Nile.
The Nubian Sandstone, the oldest sedimentary deposit in Egypt, occupies a very large area, especially in the south; wherever its base is exposed and has been critically examined, the sandstone is found to be laid on to the denuded surface of the underlying crystalline rocks. Thinner argillaceous bands are almost everywhere associated with the sandstones and the latter vary much in colour, texture, and hardness. In its widest sense the term “Nubian Sandstone” includes deposits of much greater age than Upper Cretaceous, undoubted Carboniferous fossils having been detected in some localities. The formation must be regarded as representing the slow accumulation of sediment in immense inland lakes during a great lapse of time. Although temporary marine invasions left their mark at intervals, it was not until the Cenomanian that continued depression caused a steady recession of the shore line from north to south, so that in Senonian times practically the whole of the country was occupied by the Cretaceous sea.
North of Silsila in the Nile valley the sandstones gradually give way to a series of flaggy ripple-marked sandstones alternating with sandy shales and clays, at the top of which are beds rich in bones and coprolites of fish, associated with hard oyster-limestones, overlain in Wadi Hammama, E.-N.-E. of Qena, by a limestone containing abundant remains of cephalopoda; these beds are of Upper Senonian (Campanian) age. East of Sabaia, in the Nile valley, they are followed by a 200 metre series of finely laminated clays, separated by bands of marly limestone, the greater part of which is of Cretaceous age and homotaxial with the Exogyra clays and white chalk (of Campanian—Danian age) which in the southern oases follow on the rich bonebeds overlying the Nubian Sandstone.
Anterior to and during the deposition of these clayey beds in the south, thick accumulations of limestone were being formed in the more open sea to the north and are visible to-day in the Cretaceous area of Abu Roash near the pyramids of Giza, (and to a lesser extent in Jebel Shebrewet on the Gulf of Suez), where a great complex of limestones of Turonian and Senonian ages occurs. Finally a deep sea deposit of white chalk forms the summit of the Cretaceous throughout the Western Desert.
Our knowledge of the junction of the Cretaceous and Eocene in several parts of the country leaves much to be desired. Where the Eocene is most fully developed its basal member consists of a group of green argillaceous deposits, known as the Esna shales, well seen at the base of the cliffs throughout the Esna-Qena reach of the valley. These beds everywhere pass conformably upwards into the Lower Eocene (Libyan) limestones above, but in the Nile Valley and the Eastern Desert the exact line of demarcation between them and the lithologically similar Cretaceous clays below is still somewhat obscure. In Kharga and Farafra they form a well-marked band between the White Chalk (and associated clays) at the top of the Cretaceous and the Libyan limestone of the Lower Eocene. The Esna shales may in fact be regarded as passage beds, and where they exist appear to bridge over the lapse of time which is represented by a decided unconformity between the Cretaceous and Eocene in the north of the country, as in Baharia Oasis and at Abu Roash.
[113]
The thick mass of limestone which forms the plateaux and cliffs on both sides of the valley from lat. 25° N. to Cairo is of Lower Eocene (Libyan stage) and Middle Eocene (Mokattam stage) age. These limestones, frequently nummulitic and typically marine calcareous accumulations, exceed 500 metres in thickness, and over a wide area are unrelieved by a single band of clay or sandstone. Towards the summit of the Middle Eocene, however, terrigenous deposits were laid down, the Upper Mokattam consisting of an alternating series of impure limestones, clays, and sandstones. In the Fayûm the Middle Eocene is followed by a great thickness of fluvio-marine deposits of Upper Eocene age, in which the remains of the animals that inhabited the land to the south and the adjoining seas at the time are abundantly preserved.
Throughout Oligocene and Miocene times conditions similar to those which led to the deposition of the Upper Eocene formation in the Fayûm prevailed, accompanied by a continual retreat of the sea to the north. In the littoral area marine beds were intermingled with the sediments brought down by rivers from the land to the south; and throughout these deposits the remains of land animals and great quantities of large silicified trees are common. A considerable part of the deserts east and west of the valley north of lat. 29° 30´ is covered with deposits of this age, and shallow water Miocene beds, unconformably overlying the Eocene, form marked flanking plateaux to some of the igneous ranges of the Red Sea Hills.
In Pliocene times the relative areas of land and sea approximated to those of to-day and powerful earth-movements initiated the formation of the lower part of the Nile Valley. The determining faults and the huge blocks of displaced rock are visible along the cliff walls in many parts of the valley, and at Gebelain isolated ridges of highly tilted limestone protrude above the floor of the trough, though as a rule, except near the cliffs, the faulted rocks are invisible, being buried under great thicknesses of lacustrine and fluviatile deposits. A few kilometres south of Jebel Silsila, however, Eocene and Cretaceous limestones are met with at river level in the centre of the valley and point to the Kom Ombo plain being let down by a fault of over 400 metres throw.
The Nile Valley trough or “grab” became a marine fiord in later Pliocene times, sea-beaches being formed up to 70 metres above present sea level. Extensive terraces of gravel, perched up on the surrounding slopes of the Fayûm, prove that the sea, or a great inland lake, stood at 180 metres in latest Pliocene or early Pleistocene times. From this time also dates the Red Sea (in its modern aspect), the highest Older Pleistocene coral reefs being now found at some 200 metres above sea-level; younger reefs associated with later Pleistocene gravels occur at a lower level. In later Pleistocene and early pre-human times, under the very moist climate which preceded the present desert conditions, the Nile Valley north of latitude 24° was occupied by a series of deep freshwater lakes, perhaps co-existent with that in which the Fayûm gravel terraces were accumulated. The denudation of the surrounding country was rapid, and tributary streams from the plateaux on either side brought down fine limestone detritus, which was deposited along the margins of the lakes in the form of compact beds[114] of re-made limestone, interbedded with frequent layers of conglomerate and gravel, washed down by the larger streams and by torrential floods. In the quieter parts of these lakes clays and calcareous tufas were laid down and are visible to-day from Kom Ombo to Heluan. Subsequently, owing to the breaking down of the dividing barriers, or as the result of a general slight elevation, drainage became more pronounced and the river cut its way down through these lacustrine deposits. It was probably at this time that, following the partial removal of the gravel ridge between the Fayûm and the valley, part of the drainage obtained access to the Fayûm depression and a lake, the precursor of the historical Mœris, was formed. Subsequently, under climatic conditions similar to those of to-day, the accumulation of Nile alluvium commenced within the wide trough cut out in the older lake beds. Flood plains were formed on either side of the river, and by successive deposits, at the rate of about twelve centimetres a century, were built up to their present level.
Limestones for building and other purposes are abundant in the Lower and Middle Eocene formations, though as a rule of only medium quality. The chief quarries are those of Jebel Mokattam, Tura, Heluan, Abu Foda, Harîdi, and el-Tarif. At Isawia, near Tahta, a fine tough freshwater tufaceous limestone of Pleistocene age occurs, and was largely used in the construction of the Assiut barrage. Clays of good quality are not widely extended, though certain bands of the Esna shales are very largely used near Qena in the manufacture of pottery. For bricks the Nile alluvium is used throughout the country.
Sandstone is quarried for local purposes at J. Ahmar near Cairo and in several localities in the south part of the country; it was formerly extensively quarried at J. Ahmar for the temples of the Delta, at J. Silsila for those of Upper Egypt, and at Girtassa, south of Assuân, for the Nubian monuments. Although a fairly hard and good weather-resisting stone when carefully selected, the frequent presence of soft uncemented and clayey laminae gives it an unreliable character, and a good deal of the decay of many of the ancient Egyptian monuments is attributable to this cause.
Numerous rocks in the Red Sea Hills and the Nile Valley were worked in Egyptian and Roman times for ornamental purposes; among them may be specially mentioned the purple imperial porphyry of J. Dokhan, the green breccia of Wadis Hammamat and Dib, the dolerite of Wadi Esh, and the hornblende granite of the first cataract. In modern times local granite was used throughout the Assuân dam and an Oligocene basalt is quarried at Abu Zabel and used for road-metal in the capital and other towns.
Old workings and mining camps are of common occurrence in many parts of the Eastern Desert and there is no doubt that considerable quantities of gold were extracted by convict labour. The quartz lodes traverse not only the metamorphic rocks but also some of the granites. Iron (hematite, limonite), copper (chrysocolla, copper pyrites) and lead (galena) bearing veins also occur, and turquoise, jasper and chrysolite are found in certain localities. Petroleum and sulphur occur sparsely near J. Zeit, and gypsum in large quantities in many parts of the country.
[115]
Phosphate deposits in the form of accumulations of bones, teeth and coprolites of fish in compact beds, have a wide distribution in the Eastern Desert, the Nile Valley and the southern oases, though these beds have not yet received the attention their importance deserves. Better known are the nitrate bearing clays which are so highly valued and largely used by the fellahin throughout the country. The chief horizons are the Esna shales and the underlying cretaceous clays, but disintegrated clays of every age are worked throughout the country, though their nitrate content may be very low and their salt content high; more prized still is the material from the middens marking the sites of ancient towns.
Natron (carbonate of soda) and salt are associated in considerable quantities in Wadi Natrun, and the latter is widely distributed in limited quantities throughout the country, the main supply being however obtained by evaporation from the shore lagoons along the coast of the delta. Rock salt of fine quality occurs in many localities, notably in the Eocene limestones three to four days east of Assiut.
[116]
[117]
| Tables | Pages | ||
|---|---|---|---|
| A. | I. | Areas of the catchment basins of the Nile | 119 |
| B. | II. | Slopes of the Nile in its different reaches | 120 |
| C. | III and IV. | Velocities of the Nile in its different reaches | 121 |
| D. | V to X. | Distances of places on the Nile from each other | 123 |
| E. | XI and XII. | Details of observed discharges | 129 |
| F. | XIII to XXIII. | Observed discharges referred to gauges | 131 |
| G. | XXIV. | Mean discharges of the Nile tributaries in 1902, 1903 and 1904 | 139 |
| H. | XXV. | Maximum and minimum discharges in 1902 and 1903 | 141 |
| I. | XXVI. | Monthly discharges at Khartoum, Assuân and Cairo | 142 |
| J. | XXVII to XL. | Discharge tables for the different gauges on the Nile | 143 |
| K. | XLI to LII. | Detailed information about the Nile, Assuân to Cairo | 153 |
| L. | LIII to LXIX. | Gauges of the Nile and its tributaries | 167 |
| M. | LXX and LXXI. | Assuân and Cairo gauges, metres corresponding to pics | 209 |
| N. | LXXII and LXXIII. | Table converting cubic metres per day to cubic metres per second and vice versa | 211 |
| P. | LXXIV. | Bombay rainfall referred to the Assuân gauge | 213 |
| Q. | LXXV to LXXXI. | Meteorological data in the Nile Valley | 214 |
N.B.—In Appendix L, the gauges are recorded in two different methods. If the fall or rise of water surface is gradual throughout the year, the gauges are recorded in five daily intervals. If, on the other hand, the rise and fall is gradual for the first four and last three months of the year, but the changes are abrupt in the remaining five months, the gauges are recorded in five daily intervals for seven months and daily for five months.
[118]
[119]
| River. | Area in square Kilometres |
||
|---|---|---|---|
| Area. | Total. | Grand Total. |
|
| Victoria Nile at Ripon Falls | 244,000 | 244,000 | ... |
| Additional area drained into Lake Albert | 135,000 | ... | ... |
| Albert Nile at outlet of Lake Albert | ... | 379,000 | ... |
| Albert Nile from Albert Lake to Gondokoro | 94,000 | ... | ... |
| Albert Nile at Gondokoro | ... | 473,000 | ... |
| Albert Nile, Gondokoro to above Sobat mouth | 202,000 | ... | ... |
| Gazelle River | 240,000 | ... | ... |
| Arab River | 231,000 | ... | ... |
| 673,000 | |||
| Albert Nile above Sobat River mouth | ... | 1,136,000 | ... |
| Saubat River | 156,000 | ... | ... |
| White Nile below Sobat River mouth | ... | 1,292,000 | ... |
| White Nile, Sobat River to Khartoum | 393,000 | ... | ... |
| White Nile at Khartoum | ... | 1,685,000 | 1,685,000 |
| Blue Nile in Abyssinian Hills and foot hills | 247,000 | ... | ... |
| Blue Nile foot hills to Khartoum | 53,000 | ... | ... |
| Total Blue Nile | ... | 300,000 | ... |
| Nile at Khartoum | ... | ... | 1,985,000 |
| Nile between Khartoum and Atbara junction | 54,000 | ... | ... |
| Nile above Atbara junction | ... | ... | 2,049,000 |
| Atbara River in Abyssinian hills and foot hills | 131,000 | ... | ... |
| Atbara River foothills to mouth | 106,000 | ... | ... |
| Total Atbara River | ... | 237,000 | ... |
| Nile below Atbara junction | ... | ... | 2,286,000 |
| Lybian Desert from Atbara junction to Sea | 335,000 | ... | ... |
| Arabian Desert from Atbara junction to Sea | 386,000 | ... | ... |
| Total Desert Area | ... | 721,000 | ... |
| Nile from its sources to its mouths | ... | ... | 3,007,000 |
| 3,007,000 | |||
[120]
| River. | From | To | Distance in kilomètres. |
Fall in metres. |
Slope. |
|---|---|---|---|---|---|
| Victoria Nile | Ripon Falls | Kakoji | 64 | 57 | 1⁄1200 |
| „ | Kakoji | Fowera | 237 | 12 | 1⁄20000 |
| „ | Fowera | Murchison Falls | 68 | 377 | 1⁄180 |
| „ | Murchison Falls | Lake Albert | 30 | 3 | 1⁄10000 |
| Albert Nile | Lake Albert | Dufile | 218 | 8 | 1⁄25000 |
| „ | Dufile | Fort Berkeley | 155 | 223 | 1⁄700 |
| „ | Fort Berkeley | Bôr | 206 | 18 | 1⁄12000 |
| „ | Bôr | Gaba Shamba | 196 | 10 | 1⁄20000 |
| „ | Gaba Shamba | Lake Nô | 380 | 16 | 1⁄25000 |
| „ | Lake Nô | Sobat | 134 | 2 | 1⁄75000 |
| White Nile | Sobat | 300 kilom. South of Khartum |
538 | 11 | 1⁄50000 |
| „ | 300 kilom. South of Khartum |
Khartum | 300 | 3 | 1⁄100000 |
| The Nile. | Khartum | Shabluka | 86 | 5 | 1⁄17000 |
| 6th Cataract | 18 | 6 | 1⁄3000 | ||
| „ | 6th Cataract | 5th Cataract | 285 | 17 | 1⁄17000 |
| „ | 160 | 55 | 1⁄3000 | ||
| „ | 5th Cataract | 4th Cataract | 97 | 9 | 1⁄11000 |
| „ | 110 | 49 | 1⁄2250 | ||
| „ | 4th Cataract | 3rd Cataract | 313 | 26 | 1⁄12000 |
| „ | 80 | 11 | 1⁄7250 | ||
| „ | 3rd Cataract | 2nd Cataract | 110 | 17 | 1⁄6500 |
| „ | 200 | 66 | 1⁄3000 | ||
| „ | Wadi Haifa | 1st Cataract | 345 | 28 | 1⁄12500 |
| „ | 5 | 6 | 1⁄800 | ||
| „ | Assuân | Barrage | 964 | 75·4 | 1⁄13000 |
| „ | Barrage | Mediterranean Sea | 236 | 18·6 | 1⁄12500 |
| 5535 | 1129 | 1⁄5000 |
[121]
| Name of River. |
From | To | Dis- tance in kilo- metres. |
VELOCITY IN METRES PER SEC. |
VELOCITY IN KILO- METRES PER DAY. |
TIME IN WHICH THE WATER TRAVELS IN DAYS. |
|||
|---|---|---|---|---|---|---|---|---|---|
| in flood. |
in low supply. |
in flood. |
in low supply. |
in flood. |
in low supply. |
||||
| Victoria Nile. | Ripon Falls | Kakoji | 64 | 1·2 | 1·2 | 100 | 100 | ·7 | ·7 |
| „ | Kakoji | Lake Choga | 47 | ·7 | ·6 | 60 | 50 | ·8 | ·9 |
| Lake Choga | 80 | .. | .. | .. | .. | .. | .. | ||
| „ | Lake Choga | Fowera | 110 | ·7 | ·6 | 60 | 50 | 1·8 | 2·2 |
| „ | Fowera | Murchison Falls | 68 | 1·2 | 1·2 | 100 | 100 | ·7 | ·7 |
| „ | Murchison Falls | Lake Albert | 30 | ·9 | ·7 | 80 | 60 | ·4 | ·5 |
| Lake Albert | 10 | .. | .. | .. | .. | .. | .. | ||
| Albert Nile. | Lake Albert | Dufile | 218 | ·7 | ·6 | 60 | 50 | 3·6 | 4·4 |
| „ | Dufile | Fort Berkeley | 155 | ·9 | ·7 | 80 | 60 | 1·9 | 2·6 |
| „ | Fort Berkeley | Bôr | 206 | 1·2 | ·9 | 100 | 75 | 2·1 | 2·7 |
| „ | Bôr | Gaba Shamba | 196 | ·9 | ·7 | 80 | 60 | 2·4 | 3·2 |
| „ | Gaba Shamba | Lake Nô | 380 | ·6 | ·6 | 50 | 50 | 7·6 | 7·6 |
| „ | Lake Nô | Sobat | 134 | ·35 | ·35 | 30 | 30 | 4·5 | 4·5 |
| White Nile. | Sobat | 300 kil. South of Khartum. | 538 | ·6 | ·35 | 50 | 30 | 10·7 | 17·9 |
| „ | 300 kil. South of Khartum. | Khartum | 300 | ·35 | ·35 | 30 | 30 | 10·0 | 10·0 |
| The Nile. | Khartum | Shabluka | 86 | 1·6 | ·8 | 140 | 70 | ·6 | 1·2 |
| „ | 6th Cataract | 18 | 2·3 | ·8 | 200 | 100 | ·1 | ·2 | |
| „ | 6th Cataract—5th Cataract | 285 | 1·6 | ·8 | 140 | 70 | 2·0 | 4·1 | |
| „ | 5th Cataract | 160 | 2·3 | 1·2 | 200 | 100 | ·8 | 1·6 | |
| „ | 5th Cataract—4th Cataract | 97 | 1·75 | ·85 | 150 | 75 | ·6 | 1·3 | |
| „ | 4th Cataract | 110 | 2·3 | 1·2 | 200 | 100 | ·6 | 1·1 | |
| „ | 4th Cataract—3rd Cataract | 313 | 1·75 | ·85 | 150 | 75 | 2·1 | 4·2 | |
| „ | 3rd Cataract | 80 | 2·1 | 1·0 | 180 | 90 | ·4 | ·9 | |
| „ | 3rd Cataract—2nd Cataract | 110 | 2·1 | 1·0 | 180 | 90 | ·6 | 1·2 | |
| „ | 2nd Cataract | 200 | 2·3 | 1·2 | 200 | 100 | 1·0 | 2·0 | |
| „ | Wady Haifa—1st Cataract | 345 | 1·75 | ·85 | 150 | 75 | 2·3 | 4·6 | |
| „ | 1st Cataract | 5 | 2·3 | 1·2 | 200 | 100 | 0·02 | 0·05 | |
| „ | Assuân—Barrage | 964 | 1·75 | ·85 | 150 | 75 | 6·4 | 13·0 | |
| Rosetta Branch. | Barrage—Mediterranean Sea | 236 | 1·75 | ·85 | 150 | 75 | 1·6 | 2·2 | |
[122]
| From | To | Days | Distance in kilo- metres. |
|
|---|---|---|---|---|
| in flood. |
in low supply. |
|||
| Lake Victoria | Lake Choga | 2 | 2 | 111 |
| Lake Choga | .. | .. | 80 | |
| Lake Choga | Lake Albert | 3 | 3 | 209 |
| Lake Albert | .. | .. | 9 | |
| Lake Albert | Gondokoro | 6 | 7 | 403 |
| Gondokoro | Sobat | 16 | 18 | 885 |
| Sobat | Khartum | 21 | 28 | 838 |
| Khartum | Assuan | 11 | 22 | 1,804 |
| Assuan | Cairo | 6 | 12 | 945 |
| Lake Albert | Cairo | 60 | 87 | 4,875 |
[123]
| Name of Place. | Distance from Barrage. |
Distance from Sea. |
Name of Place. | Distance from Barrage. |
Distance from Sea. |
|---|---|---|---|---|---|
| Damietta Branch. | Rosetta Branch. | ||||
| Birshams | 23 | 213 | Ashmun | 23 | 213 |
| Benha | 51 | 185 | Geres | 31 | 205 |
| Mitbera | 62 | 174 | Khatatbeh | 45 | 191 |
| Zifta | 88 | 148 | Gizaï | 63 | 173 |
| Samanûd | 124 | 112 | Tenoub | 95 | 141 |
| Mansurah | 142 | 94 | Kafr Zayat | 119 | 117 |
| Sherbin | 168 | 68 | Kuddabah | 140 | 96 |
| Ras el Khalig (Station) | 182 | 54 | Shibrakhit | 154 | 82 |
| Mit Abu Ghaleb | 194 | 42 | Dessouk | 168 | 68 |
| Faraskur | 203 | 33 | Fuah | 181 | 55 |
| Damietta | 221 | 15 | Atfé | 184 | 52 |
| Sea | 236 | 0 | Rosetta | 221 | 15 |
| Sea | 236 | 0 | |||
[124]
| Name of Place. |
Distance from Barrage. |
Distance from Assuan. |
|
|---|---|---|---|
| Barrage | 0 | 968 | |
| Kasr El Nil (Bridge)—Cairo | 23 | 945 | |
| Rodah gauge | 27 | 941 | |
| Badreshen | 46 | 922 | |
| Aiyat | 73 | 895 | |
| Wastah | 108 | 860 | |
| Beni Suef | 143 | 825 | |
| Maghagha | 199 | 769 | |
| Minieh | 268 | 700 | |
| Rodah | 308 | 660 | |
| Derüt Escape | 340 | 628 | |
| Manfalut | 377 | 591 | |
| Asyut | 420 | 548 | |
| Sohag | 520 | 448 | |
| Girga | 561 | 407 | |
| Baliyana | 579 | 389 | |
| Dishna | 665 | 303 | |
| Kena | 685 | 283 | |
| Luxor | 749 | 219 | |
| Armant | 768 | 200 | |
| Esna | 807 | 161 | |
| Edfou | 859 | 109 | |
| Gebel Silsila | 898 | 70 | |
| Kom Ombo | 925 | 43 | |
| Assuan | 968 | 0 |
[125]
| Name of Place. |
Distance from Assuan. |
Distance from Khartoum. |
|
|---|---|---|---|
| Assuan (Shellal) | 0 | 1804 | |
| Kalabsha | 57 | 1747 | |
| Dekka | 109 | 1695 | |
| Korosko | 187 | 1617 | |
| Der | 209 | 1595 | |
| Ibrim | 229 | 1575 | |
| Toski | 251 | 1553 | |
| Abu Simbel | 283 | 1521 | |
| Wadi Haifa | 345 | 1459 | |
| Kaibar | 663 | 1141 | |
| Hannek | 735 | 1069 | |
| Dongola | 795 | 1009 | |
| Abu Hamed | 1255 | 549 | |
| Berber | 1460 | 344 | |
| Atbara | 1484 | 320 | |
| Shendy | 1621 | 183 | |
| Shabluka | 1700 | 104 | |
| Khartoum | 1804 | 0 |
[126]
| Name of Place. |
Distance from Khartoum. |
Distance from Gondokoro. |
|
|---|---|---|---|
| Khartoum | 0 | 1723 | |
| Duem | 201 | 1522 | |
| Abou Zeid | 336 | 1387 | |
| Gebelain | 384 | 1339 | |
| Kaka | 639 | 1084 | |
| Kodok | 747 | 976 | |
| Tewfikieh | 830 | 893 | |
| Sobat | 838 | 885 | |
| Mouth of Zeraf | 886 | 837 | |
| Lake No | 972 | 751 | |
| Hillet Nuer | 1177 | 546 | |
| Sudd Block 15 | 1218 | 505 | |
| Gaba Shambe | 1352 | 371 | |
| Bor | 1548 | 175 | |
| Lado | 1711 | 12 | |
| Gondokoro | 1723 | 0 |
[127]
| Name of Place. |
Distance from Gondokoro. |
Distance from Ripon Falls. |
|
|---|---|---|---|
| Gondokoro | 0 | 803 | |
| Fort Berkeley | 31 | 772 | |
| Dufile | 186 | 617 | |
| Wadelai | 331 | 472 | |
| Lake Albert | 403 | 400 | |
| Murchison Falls | 434 | 369 | |
| Fowera | 501 | 302 | |
| Mruli | 611 | 192 | |
| Lake Choga | 691 | 112 | |
| Kakogi | 739 | 64 | |
| Ripon Falls | 803 | 0 |
[128]
| Name of Place. |
Distance from Khartoum. |
Distance from Rosaires. |
|
|---|---|---|---|
| Khartoum | 0 | 615 | |
| Kamlin | 98 | 517 | |
| Rufaa | 151 | 464 | |
| Abu-Haraz | 188 | 427 | |
| Rahad mouth | 190 | 425 | |
| Wad-Medani | 198 | 417 | |
| Dinder mouth | 265 | 350 | |
| Sennaar | 343 | 272 | |
| Karkoj | 462 | 153 | |
| Rosaires | 615 | 0 |
[129-
130]
| River. | Locality. | Gauge. | Date. | Area of Section. |
Velocity metres per second. |
Dis- charge m³ per second. |
|---|---|---|---|---|---|---|
| Victoria Nile | Above Ripon Falls | ·51 | 22·1·03 | 2312·0 | 0·237 | 548·0 |
| Murchison Falls | .. | 20·3·03 | 894·4 | 0·65 | 577·0 | |
| Uganda Streams: |
||||||
| Ruizi | .. | .. | 6·2·03 | 9·0 | 1·22 | 11·0 |
| Nyam Gasha | .. | .. | 16·2·03 | 8·9 | 0·55 | 4·9 |
| Lukoku | .. | .. | 24·2·03 | 5·4 | 0·53 | 2·8 |
| Mbuku | .. | .. | 25·2·03 | 6·1 | 1·16 | 7·1 |
| Hima | .. | .. | 25·2·03 | 1·1 | 0·70 | 0·7 |
| Ruimi | .. | .. | 26·2·03 | 5·8 | 0·74 | 4·3 |
| Mpangu | .. | .. | 26·2·03 | 3·0 | 0·88 | 2·6 |
| Msisi | .. | .. | 9·3·03 | 6·7 | 0·40 | 2·7 |
| Ngusi | .. | .. | 12·3·03 | 12·5 | 0·50 | 6·2 |
| Kagera | .. | .. | 26·2·03 | 412·0 | 0·35 | 143·0 |
| Semliki | Outlet of Lake Edward | .. | 18·2·03 | 130·0 | 0·70 | 90·0 |
| „ | Inlet of Lake Albert | .. | 4·3·03 | 121·0 | 0·96 | 116·0 |
| Albert Nile tributaries: |
||||||
| Umi | .. | .. | 22·3·03 | 15·1 | 1·20 | 12·3 |
| Asua | .. | .. | 28·3·03 | 18·7 | 0·58 | 10·8 |
| Kit | .. | .. | .. | .. | .. | 0 |
| Albert Nile | Wadeiai | ·52 | 22·3·03 | 770·9 | 0·84 | 646·0 |
| „ | Gondokoro | ·18 | 28·3·01 | 779·0 | 0·73 | 566·0 |
| „ | „ | ·84 | 9·9·02 | 1033·0 | 0·93 | 960·0 |
| „ | „ | ·50 | 1·4·03 | 615·0 | 1·07 | 641·0 |
| „ | „ | 2·33 | 9·9·03 | 1347·0 | 1·37 | 1847·0 |
| „ | „ | ·84 | 14·5·04 | .. | .. | 1138·0 |
| „ | Mongalla (north of Gondokoro) | .. | 14·9·03 | 1487·0 | 1·44 | 2046·0 |
| „ | Bôr | .. | 16·9·03 | 770·0 | 1·14 | 888·0 |
| „ | „ | 2·03 | 12·5·04 | .. | .. | 813·0 |
| „ | North of Gaba- | .. | 4·9·02 | 498·0 | 0·80 | 398·0 |
| „ | Shamba | .. | 18·9·03 | 669·0 | 0·80 | 532·0 |
| Albert Nile | Hillet Nûr | .. | 1·9·03 | 478·0 | 0·78 | 375·0 |
| „ | „ | .. | 13·4·03 | 392·0 | 0·88 | 346·0 |
| „ | North of Hillet-Nûr | .. | 1·4·01 | 485·0 | 0·54 | 262·0 |
| „ | „ | .. | 2·9·02 | 511·0 | 0·65 | 333·0 |
| „ | South of Lake Nô | .. | 14·4·00 | 262·0 | 0·84 | 219·0 |
| „ | „ | .. | 14·4·03 | 424·0 | 0·71 | 285·0 |
| „ | „ | .. | 31·8·03 | 441·0 | 0·72 | 318·0 |
| „ | „ | .. | 22·5·04 | .. | .. | 302·0 |
| Bahr El Gazal | 28 kil. from mouth | .. | 30·8·03 | 52·0 | 0·23 | 12·0 |
| „ | 32„ | .. | 21·9·03 | 104·0 | 0·19 | 20·0 |
| „ | 33„ | .. | 2·4·01 | 149·0 | 0·18 | 27·0 |
| „ | 33„ | .. | 31·8·02 | 86·0 | 0·17 | 15·0 |
| „ | 50„ | .. | 15·4·03 | 200·0 | 0·20 | 23·0 |
| „ | 51„ | .. | 1·4·00 | 161·0 | 0·21 | 34·0 |
| Bahr El Zeraf | 8„ | .. | 22·9·02 | 240·0 | 0·40 | 97·0 |
| „ | 14„ | .. | 29·8·03 | 180·0 | 0·61 | 110·0 |
| „ | 19„ | .. | 3·4·01 | 138·0 | 0·24 | 33·0 |
| „ | 20„ | .. | 16·4·03 | 179·0 | 0·30 | 50·0 |
| „ | 20„ | .. | 22·9·03 | 232·0 | 0·66 | 158·0 |
| „ | 96„ | .. | 25·3·00 | 91·0 | 0·35 | 32·0 |
| Albert Nile | Above Sobat junction | .. | 30·8·02 | 813·0 | 0·41 | 336·0 |
| „ | „ | .. | 22·9·02 | 1054·0 | 0·40 | 419·0 |
| „ | „ | .. | 22·9·03 | 1034·0 | 0·44 | 450·0 |
| „ | „ | .. | 16·4·03 | 710·0 | 0·49 | 349·0 |
| Sobat River | 25 kil. from mouth | 3·16 | 26·9·03 | 1030·0 | 0·87 | 895·0 |
| „ | 25„ | 2·70 | 26·8·03 | .. | .. | 769·0 |
| „ | 40„ | ·10 | 17·4·03 | 414·0 | 0·12 | 45·0 |
| „ | 45„ | .. | 6·4·01 | 401·0 | 0·22 | 87·0 |
| White Nile | Tewfikia | .. | 6·4·01 | 1081·0 | 0·28 | 381·0 |
| „ | „ | ·24 | 17·4·03 | 1068·0 | 0·35 | 368·0 |
| „ | „ | 2·65 | 26·8·03 | 2174·0 | 0·54 | 1046·0 |
| „ | „ | 3·38 | 26·9·03 | 2332·0 | 0·56 | 1304·0 |
| „ | „ | .. | 25·9·02 | 1983·0 | 0·66 | 1272·0 |
| Blue Nile | Outlet of Lake Tsana | .. | 31·1·03 | 65·0 | 0·64 | 41·8 |
[131]
1903
| Date of Discharge. |
Locality where taken. |
Gauge at Jinja | Discharge in metres³ per second. |
||
|---|---|---|---|---|---|
| Day of discharge. |
10 days before discharge. |
15 days before discharge. |
|||
| 22 January | Ripon Falls | ·51 | .. | .. | 548 |
| 20 March | Below the Murchison Falls | .. | ·66 | ·70 | 577 |
1903
| Date of Discharge. |
Gauge. | Discharge in metres³ per second. |
Remarks. |
|---|---|---|---|
| 22 March | ·52 | 646 |
[132]
| 1903 | ||||||||||
|---|---|---|---|---|---|---|---|---|---|---|
| Locality. | Kilo- metres from Gondo- koro. |
Date. | Mongalla gauge (32 kilom. north of Gondokoro) | Discharge m³ per second. |
||||||
| 5 days before. |
4 days before. |
3 days before. |
2 days before. |
1 day before. |
day of dis- charge. |
1 day after. |
||||
| Gondokoro | 0 | 1 April | .. | .. | .. | .. | .. | 0·83 | 0·83 | [9]693 |
| .. | 9 September | 2·73 | 2·85 | 2·90 | 3·02 | 3·16 | 3·14 | 3·08 | [10]1985 | |
| Mongalla | 32 | 14 September | 3·14 | 3·08 | 2·90 | 2·84 | 2·82 | 2·82 | 2·82 | 2046 |
| Derwish Dem | 156 | 16 September | 2·90 | 2·84 | 2·82 | 2·82 | 2·82 | 2·84 | 2·92 | 888 |
| North of Gaba-Shamba | 415 | 18 September | 2·82 | 2·82 | 2·82 | 2·84 | 2·92 | 3·06 | 3·12 | 532 |
| Hillet Nur | 538 | 1 September | 2·52 | 2·52 | ? | ? | ? | 2·52 | 2·45 | 375 |
| Hillet Nur | 542 | 13 April | 0·87 | 0·89 | 0·90 | 0·90 | 0·87 | 0·88 | 0·88 | 331 |
| South of Lake No | 741 | 14 April | 0·89 | 0·90 | 0·90 | 0·87 | 0·88 | 0·88 | 0·89 | 285 |
| South of Lake No | 742 | 31 August | 2·49 | 2·52 | 2·52 | ? | ? | ? | 2·52 | 318 |
| 1904 | ||||||||||
| Gondokoro | .. | 14 May | 1·89 | 1·89 | 1·96 | 2·03 | 2·10 | 2·03 | 2·07 | 1138 |
| Bôr | 165 | 12 May | 1·89 | 1·89 | 1·89 | 1·89 | 1·96 | 2·03 | 2·10 | 813 |
| South of Lake No | 742 | 22 May | 2·03 | 2·03 | 2·03 | 2·07 | 2·07 | 2·17 | 2·17 | 302 |
[133]
| Date of discharge. |
Gauge | Discharges m³ per second. |
Remarks. | |||
|---|---|---|---|---|---|---|
| Day. | 1 day after. |
2 days after. |
3 days after. |
|||
| 21 September | 3·31 | 3·33 | 3·35 | 3·36 | 20 | |
| 30 August | 2·74 | 2·75 | 2·76 | 2·77 | 12 | |
| 1903 | |||||
|---|---|---|---|---|---|
| Date of discharge. |
Gauge | Discharge m³ per second. |
Remarks. | ||
| 1 day before. |
Day. | 1 day after. |
|||
| 16 April | 0·24 | 0·24 | 0·24 | 50 | |
| 22 September | 3·31 | 3·33 | 3·35 | 158 | |
| 8 May | 0·25 | 0·26 | 0·26 | 61 | |
| 29 August | 2·68 | 2·70 | 2·72 | 110 | App. gauge |
| 1904 | |||||
| 23 May | 1·35 | 1·38 | 1·40 | 124 | |
[134]
| 1903 | |||||
|---|---|---|---|---|---|
| Date of discharge. |
Gauge | Discharge m³ per second. |
|||
| 1 day before. |
day. | 1 day after. |
|||
| 16 April | ·24 | ·24 | ·24 | 349 | |
| 22 September | 3·31 | 3·33 | 3·35 | 450 | |
| 1903 | |||||
|---|---|---|---|---|---|
| 17 April | .. | ·10 | .. | 45 | |
| 26 August | 2·70 | 2·71 | 2·74 | 769 | |
| 26 September | 3·16 | 3·17 | 3·19 | 895 | |
| 1903 | |||||
|---|---|---|---|---|---|
| 17 April | ·24 | ·24 | ·24 | 381 | |
| 26 August | 2·64 | 2·65 | 2·66 | 1046 | |
| 26 September | 3·37 | 3·38 | 3·40 | 1304 | |
[135]
| Date. | Duem Gauge - Gauge. |
Khartoum Gauges |
Dis- charge cubic metres per second. |
|||
|---|---|---|---|---|---|---|
| 3 days before. |
2 days before. |
day before. |
day of dis- charge. |
|||
| 1902 | ||||||
| May 13 | ·51 | -·06 | -·07 | -·04 | -·04 | 347 |
| June 11 | ·95 | ·76 | ·75 | ·77 | ·84 | 650 |
| July 8 | 1·42 | 1·70 | 1·70 | 1·85 | 2·03 | 788 |
| August 5 | 2·20 | 3·52 | 3·62 | 3·71 | 3·79 | 867 |
| September 2 | 3·48 | 5·30 | 5·30 | 5·20 | 5·20 | 330 |
| October 1 | 3·50 | 5·03 | 5·06 | 5·16 | 5·14 | 870 |
| October 28 | 2·50 | 3·35 | 3·30 | 3·23 | 3·16 | 802 |
| December 1 | 2·00 | 2·11 | 2·10 | 2·08 | 2·06 | 930 |
| December 29 | 2·04 | 1·54 | 1·50 | 1·48 | 1·45 | 1518 |
| 1903 | ||||||
| January 27 | 1·12 | 0·90 | 0·87 | 0·84 | 0·83 | 663 |
| February 24 | 0·86 | 0·36 | 0·32 | 0·29 | 0·28 | 462 |
| March 24 | 0·46 | 0·02 | 0·01 | 0·01 | 0·02 | 559 |
| April 21 | 0·38 | -0·14 | -0·12 | -0·12 | -0·16 | 415 |
| May 19 | 0·38 | -0·26 | -0·23 | -0·21 | -0·19 | 447 |
| June 16 | 1·09 | 1·41 | 1·56 | 1·65 | 1·75 | 658 |
| July 1 | 1·31 | 1·61 | 1·54 | 1·54 | 1·54 | 884 |
| „14 | 1·71 | 2·55 | 2·58 | 2·75 | 2·80 | 835 |
| August 4 | 2·46 | 3·50 | 3·80 | 4·05 | 4·40 | 768 |
| „ 11 | 3·28 | 4·95 | 5·06 | 5·06 | 5·10 | 579 |
| „ 18 | 3·70 | 5·55 | 5·70 | 5·80 | 5·70 | 534 |
| „ 23 | 4·08 | 5·80 | 5·90 | 5·95 | 6·00 | 654 |
| „ 28 | 4·18 | 6·03 | 6·08 | 6·00 | 6·05 | 710 |
| September 2 | 4·33 | 6·15 | 6·28 | 6·24 | 6·30 | 571 |
| „ 7 | 4·43 | 6·20 | 6·20 | 6·15 | 6·12 | 737 |
| „12 | 4·46 | 6·24 | 6·14 | 6·15 | 6·05 | 653 |
| „18 | 4·40 | 5·86 | 5·95 | 5·88 | 5·88 | 840 |
| „24 | 4·28 | 5·95 | 6·00 | 6·10 | 6·10 | 763 |
| October 7 | 3·93 | 5·57 | 5·40 | 5·32 | 5·10 | 1588 |
| November 3 | 3·11 | 3·90 | 3·85 | 3·75 | 3·65 | 1563 |
| „ 24 | 2·44 | 2·65 | 2·63 | 2·63 | 2·60 | 1665 |
| December 8 | 2·06 | 2·30 | 2·28 | 2·20 | 2·15 | 1462 |
| „ 22 | 1·80 | 1·90 | 1·90 | 1·88 | 1·88 | 1403 |
| 1904 | ||||||
| January 6 | 1·66 | 1·78 | 1·78 | 1·78 | 1·75 | 1508 |
| „ 20 | 1·54 | 1·48 | 1·48 | 1·48 | 1·55 | 1466 |
[136-
137]
| 1902 | ||||||
| Date of Discharge. |
WAD MEDANI GAUGES | Discharge m³ per second. |
Khartoum gauges. |
Remarks. | ||
|---|---|---|---|---|---|---|
| 2 days before. |
1 day before. |
Date of dis- charge. |
||||
| 9 May | ·39 | ·39 | ·37 | 184 | -0·05 | |
| 23 „ | ·71 | ·61 | ·65 | 194 | 0·16 | |
| 6 June | 2·07 | 2·03 | 1·97 | 604 | 0·76 | |
| 20 „ | 2·97 | 3·27 | 3·39 | 695 | 1·06 | |
| 27 „ | 3·04 | 3·89 | 4·29 | 837 | 1·30 | |
| 4 July | 3·80 | 3·70 | 3·80 | 1032 | 1·75 | |
| 11 „ | 4·56 | 4·38 | 4·48 | 1453 | 2·07 | |
| 18 „ | 4·80 | 5·10 | 5·20 | 1612 | 2·33 | |
| 25 „ | 5·70 | 5·66 | 5·76 | 1885 | 2·64 | |
| 1 August | 7·06 | 7·28 | 7·56 | 3420 | 3·34 | |
| 8 „ | 8·56 | 8·76 | 8·86 | 4880 | 4·20 | |
| 15 „ | 9·14 | 9·02 | 8·96 | 4720 | 4·50 | |
| 22 „ | 10·08 | 10·00 | 9·66 | 5540 | 4·93 | |
| 29 „ | 10·46 | 10·52 | 10·32 | 7180 | 5·34 | |
| 5 September | 10·42 | 10·32 | 10·30 | 6580 | 5·27 | |
| 12 „ | 10·40 | 10·28 | 10·60 | 5800 | 5·35 | |
| 19 „ | 10·32 | 10·00 | 10·30 | 5760 | 5·30 | |
| 26 „ | 10·00 | 10·10 | 9·90 | 4800 | 5·10 | |
| 3 October | 9·94 | 9·88 | 9·70 | 4880 | 5·03 | |
| 10 „ | 8·40 | 8·20 | 8·00 | 3250 | 3·45 | |
| 17 „ | 7·38 | 7·48 | 7·40 | 2460 | 3·73 | |
| 24 „ | 6·94 | 6·88 | 6·78 | 2030 | 3·40 | |
| 31 „ | 6·18 | 6·14 | 6·04 | 1244 | 3·00 | |
| 7 November | 5·66 | 5·60 | 5·50 | 1272 | 2·77 | |
| 14 „ | 5·10 | 5·06 | 5·00 | 1035 | 2·48 | |
| 21 „ | 4·74 | 4·74 | 4·70 | 802 | 2·23 | |
| 28 „ | 4·56 | 4·54 | 4·46 | 787 | 2·11 | |
| 5 December | 4·08 | 4·04 | 4·00 | 654 | 1·94 | |
| 12 „ | 3·73 | 3·74 | 3·66 | 486 | 1·80 | |
| 23 „ | 3·43 | 3·32 | 3·26 | 476 | 1·58 | |
| 1903 | ||||||
| 2 January | 2·90 | 2·88 | 2·84 | 348 | 1·39 | |
| 9 „ | 2·64 | 2·60 | 2·58 | 270 | 1·22 | |
| 16 „ | 2·48 | 2·46 | 2·44 | 248 | 1·09 | |
| 23 „ | 2·34 | 2·32 | 2·30 | 250 | 0·94 | |
| 6 February | 2·06 | 2·04 | 2·04 | 226 | 0·60 | |
| 20 „ | 1·86 | 1·84 | 1·84 | 152 | 0·39 | |
| 6 March | 1·60 | 1·60 | 1·58 | 202 | 0·18 | |
| 20 „ | 1·36 | 1·34 | 1·34 | 201 | 0·04 | |
| 3 April | 1·24 | 1·20 | 1·20 | 132 | 0̅·12 | |
| 17 „ | 1·08 | 1·04 | 1·04 | 154 | 0̅·16 | |
| 1 May | 0·98 | 0·98 | 0·96 | 121 | 0̅·16 | |
| 8 „ | 0·88 | 0·88 | 0·90 | Nil | 0̅·23 | |
| 15 „ | 0·88 | 0·92 | 0·98 | „ | 0̅·26 | |
| 22 „ | 1·40 | 1·66 | 1·70 | „ | 0̅·09 | |
| 28 „ | 2·74 | 1·51 | 3·43 | 374 | 0·53 | |
| 6 June | 4·05 | 3·61 | 3·65 | 970 | 1·40 | |
| 19 „ | 4·70 | 4·62 | 4·52 | 1500 | 1·90 | |
| 26 „ | 4·25 | 4·51 | 4·31 | 1089 | 1·58 | |
| 3 July | 4·71 | 5·27 | 5·61 | 1314 | 1·78 | |
| 10 „ | 6·45 | 6·55 | 6·67 | 1952 | 2·48 | |
| 17 „ | 6·74 | 6·57 | 6·91 | 2267 | 2·75 | |
| 24 „ | 7·97 | 7·81 | 7·87 | 3183 | 3·40 | |
| 31 „ | 7·77 | 7·67 | 7·70 | 2870 | 3·45 | |
| 5 August | 9·81 | 10·11 | 10·11 | 7584 | 4·60 | |
| 10„ | 10·15 | 9·99 | 9·89 | 7100 | 5·06 | |
| 14„ | 10·59 | 10·71 | 10·57 | 9340 | 5·65 | |
| 21„ | 10·49 | 10·73 | 10·71 | 9519 | 5·90 | |
| 28„ | 10·47 | 10·41 | 10·61 | 9544 | ? | |
| 4 September | 10·68 | 10·44 | 10·40 | 8474 | 6·20 | |
| 11„ | 10·74 | 10·52 | 10·46 | 8385 | 6·15 | |
| 18„ | 9·94 | 9·92 | 9·96 | 7070 | 5·88 | |
| 25„ | 10·52 | 10·46 | 10·32 | 8965 | 6·08 | |
| 2 October | 9·22 | 9·48 | 9·36 | 6581 | 5·53 | |
| 9„ | 9·14 | 9·04 | 8·64 | 5749 | 5·15 | |
| 16„ | 7·97 | 7·94 | 8·07 | 3812 | 4·45 | |
| 23„ | 8·90 | 8·64 | 8·54 | 4198 | 4·56 | |
| 30„ | 7·53 | 7·33 | 7·29 | 2893 | 4·00 | |
| 6 November | 6·86 | 6·68 | 6·32 | 2275 | 3·50 | |
| 13„ | 6·00 | 5·90 | 5·70 | 1790 | 3·10 | |
| 20„ | 5·71 | 5·65 | 5·55 | 1456 | 2·65 | |
| 4 December | 4·90 | 4·88 | 4·84 | 1102 | 2·35 | |
| 18„ | 4·36 | 4·30 | 4·28 | 789 | 1·90 | |
| 25„ | 3·90 | 3·88 | 3·84 | 722 | 1·88 | |
| 1904 | ||||||
| 1 January | 3·60 | 3·66 | 3·64 | 604 | 1·80 | |
| 15„ | 3·40 | 3·38 | 3·36 | 488 | 1·59 | |
[138]
| 1903 | ||||||||
| Date of Discharge. |
Gauges | Dis- charge m³ per second. |
Remarks | |||||
|---|---|---|---|---|---|---|---|---|
| 5 days before. |
4 days before. |
3 days before. |
2 days before. |
1 day before. |
Date of dis- charge. |
|||
| 16 July | 2·65 | 2·31 | 2·10 | 2·10 | 2·65 | 2·28 | 381 | |
| 23 „ | 2·37 | 2·55 | 2·74 | 2·83 | 2·70 | 2·70 | 538 | |
| 27 „ | 2·70 | 2·70 | 3·00 | 2·62 | 2·53 | 2·60 | 780 | |
| 2 August | 2·76 | 2·80 | 3·29 | 3·54 | 4·21 | 4·00 | 758 | |
| 5„ | 3·54 | 4·21 | 4·00 | 3·56 | 3·25 | 3·35 | 1448 | |
| 14„ | 3·29 | 3·72 | 4·61 | 4·37 | 4·53 | 4·60 | 2318 | |
| 15„ | 3·72 | 4·61 | 4·37 | 4·53 | 4·60 | 4·85 | 2931 | |
| 27„ | 5·12 | 4·82 | 4·54 | 4·35 | 4·20 | 4·80 | 2632 | |
| 30„ | 4·35 | 4·20 | 4·80 | 4·55 | 4·55 | 4·75 | 3088 | |
| 5 September | 4·45 | 4·52 | 4·52 | 4·60 | 4·70 | 4·55 | 2822 | |
| 12„ | 4·58 | 4·50 | 4·15 | 4·30 | 3·89 | 3·95 | 2091 | |
| 18„ | 3·80 | 3·84 | 3·71 | 3·88 | 4·36 | 4·20 | 1672 | |
| 25„ | 4·12 | 3·80 | 4·45 | 3·30 | 3·25 | 3·10 | 1267 | |
| 28„ | 3·30 | 3·25 | 3·10 | 2·89 | 3·42 | 3·10 | 902 | |
| 2 October | 3·42 | 3·10 | 3·13 | 3·05 | 2·88 | 2·78 | 925 | |
| 4„ | 3·13 | 3·05 | 2·88 | 2·78 | 2·78 | 2·90 | 754 | |
| 5„ | 3·05 | 2·88 | 2·78 | 2·78 | 2·90 | 2·75 | 703 | |
[139]
| 1902 | ||||||||||||||
| Month. | Victoria Nile at Ripon Falls. |
Albert Nile | Gazelle river app. |
Sobat river. |
White Nile at Tewfikia. |
White Nile at Khartoum. |
Blue Nile at Khartoum. |
Atbara river. |
Total for: White, Blue and Atbara rivers. |
Nile at: Halfa = 1st Jan.- 1st July. Assuân = 1st July- 1st Jan. |
Rosetta branch. |
Damietta branch. |
||
|---|---|---|---|---|---|---|---|---|---|---|---|---|---|---|
| Wadelai. | Gondo- koro. |
Above Sobat junction. |
||||||||||||
| January | 510 | 620 | 660 | .. | .. | .. | .. | 950 | 280 | 0 | 1230 | 1100 | 1000 | 20 |
| February | 510 | 580 | 640 | .. | .. | .. | .. | 550 | 240 | 0 | 790 | 720 | 290 | 40 |
| March | 500 | 570 | 660 | .. | .. | .. | .. | 420 | 190 | 0 | 610 | 600 | 40 | 40 |
| April | 530 | 540 | 550 | .. | .. | .. | .. | 370 | 190 | 0 | 560 | 530 | 0 | 0 |
| May | 560 | 560 | 630 | .. | .. | .. | .. | 350 | 180 | 0 | 530 | 510 | 0 | 0 |
| June | 550 | 550 | 550 | .. | .. | .. | .. | 600 | 600 | 50 | 1250 | 550 | 0 | 0 |
| July | 530 | 560 | 600 | .. | .. | .. | .. | 900 | 1500 | 500 | 2900 | 1100 | 0 | 0 |
| August | 520 | 580 | 1000 | 340 | .. | 570 | 910 | [11]600 | 5000 | 1200 | 6300 | 3600 | 800 | 400 |
| September | 510 | 610 | 820 | 420 | .. | 810 | 1230 | [11]600 | 6200 | 1200 | 8000 | 6600 | 2600 | 400 |
| October | 490 | 640 | 780 | .. | .. | .. | .. | 900 | 2800 | 80 | 3780 | 4950 | 2500 | 1300 |
| November | 500 | 710 | 900 | .. | .. | .. | .. | 850 | 1000 | 0 | 1850 | 2400 | 1400 | 700 |
| December | 490 | 740 | 860 | .. | .. | .. | .. | 1202 | 500 | 0 | 1700 | 1700 | 1600 | 140 |
| Year | 520 | 600 | 720 | .. | .. | .. | .. | 690 | 1560 | 250 | 2500 | 2030 | 850 | 340 |
| 1903 | ||||||||||||||
| January | 530 | 710 | 760 | 400 | 0 | 600 | 1000 | 1000 | 300 | 0 | 1300 | 1300 | 1300 | 20 |
| February | 610 | 680 | 740 | 370 | 0 | 230 | 600 | 600 | 240 | 0 | 840 | 880 | 500 | 20 |
| March | 630 | 660 | 700 | 350 | 0 | 130 | 480 | 500 | 180 | 0 | 680 | 620 | 100 | 30 |
| April | 650 | 640 | 700 | 360 | 0 | 40 | 400 | 420 | 120 | 0 | 540 | 480 | 0 | 0 |
| May | 740 | 670 | 900 | 390 | 0 | 100 | 490 | 420 | 280 | 0 | 700 | 440 | 0 | 0 |
| June | 800 | 710 | 1020 | 400 | 0 | 320 | 720 | 600 | 1200 | 200 | 2000 | 630 | 0 | 0 |
| July | 840 | 760 | 1100 | 410 | 10 | 410 | 820 | [11]700 | 2500 | 600 | 3800 | 1400 | 0 | 150 |
| August | 790 | 820 | 1600 | 420 | 10 | 680 | 1100 | [11]400 | 8200 | 2300 | 10900 | 5700 | 1500 | 300 |
| September | 730 | 870 | 2100 | 430 | 20 | 870 | 1300 | [11]600 | 8200 | 1500 | 10300 | 8600 | 3300 | 2000 |
| October | 770 | 970 | 1900 | 360 | 30 | 1040 | 1400 | 1700 | 4500 | 0 | 6200 | 6300 | 3500 | 2200 |
| November | 810 | 1040 | 1700 | 350 | 30 | 1080 | 1430 | 1600 | 1700 | 0 | 3200 | 3400 | 2500 | 1600 |
| December | 810 | 1060 | 1200 | 380 | 30 | 1080 | 1460 | 1450 | 800 | 0 | 2253 | 2000 | 1100 | 800 |
| Year | 730 | 800 | 1200 | 390 | 10 | 550 | 940 | 830 | 2350 | 380 | 3560 | 2650 | 1150 | 590 |
| 1902 | |||||||
| Month. | Victoria Nile at Ripon Falls. |
Albert Nile | Gazelle river app. |
Sobat river. |
White Nile at Tewfikia. |
||
|---|---|---|---|---|---|---|---|
| Wadelai. | Gondo- koro. |
Above Sobat junction. |
|||||
| January | 510 | 620 | 660 | .. | .. | .. | .. |
| February | 510 | 580 | 640 | .. | .. | .. | .. |
| March | 500 | 570 | 660 | .. | .. | .. | .. |
| April | 530 | 540 | 550 | .. | .. | .. | .. |
| May | 560 | 560 | 630 | .. | .. | .. | .. |
| June | 550 | 550 | 550 | .. | .. | .. | .. |
| July | 530 | 560 | 600 | .. | .. | .. | .. |
| August | 520 | 580 | 1000 | 340 | .. | 570 | 910 |
| September | 510 | 610 | 820 | 420 | .. | 810 | 1230 |
| October | 490 | 640 | 780 | .. | .. | .. | .. |
| November | 500 | 710 | 900 | .. | .. | .. | .. |
| December | 490 | 740 | 860 | .. | .. | .. | .. |
| Year | 520 | 600 | 720 | .. | .. | .. | .. |
| 1902 | |||||||
| Month. | White Nile at Khartoum. |
Blue Nile at Khartoum. |
Atbara river. |
Total for: White, Blue and Atbara rivers. |
Nile at: Halfa = 1st Jan.- 1st July. Assuân = 1st July- 1st Jan. |
Rosetta branch. |
Damietta branch. |
|---|---|---|---|---|---|---|---|
| January | 950 | 280 | 0 | 1230 | 1100 | 1000 | 20 |
| February | 550 | 240 | 0 | 790 | 720 | 290 | 40 |
| March | 420 | 190 | 0 | 610 | 600 | 40 | 40 |
| April | 370 | 190 | 0 | 560 | 530 | 0 | 0 |
| May | 350 | 180 | 0 | 530 | 510 | 0 | 0 |
| June | 600 | 600 | 50 | 1250 | 550 | 0 | 0 |
| July | 900 | 1500 | 500 | 2900 | 1100 | 0 | 0 |
| August | [11]600 | 5000 | 1200 | 6300 | 3600 | 800 | 400 |
| September | [11]600 | 6200 | 1200 | 8000 | 6600 | 2600 | 400 |
| October | 900 | 2800 | 80 | 3780 | 4950 | 2500 | 1300 |
| November | 850 | 1000 | 0 | 1850 | 2400 | 1400 | 700 |
| December | 1202 | 500 | 0 | 1700 | 1700 | 1600 | 140 |
| Year | 690 | 1560 | 250 | 2500 | 2030 | 850 | 340 |
| 1903 | |||||||
| Month. | Victoria Nile at Ripon Falls. |
Albert Nile | Gazelle river app. |
Sobat river. |
White Nile at Tewfikia. |
||
|---|---|---|---|---|---|---|---|
| Wadelai. | Gondo- koro. |
Above Sobat junction. |
|||||
| January | 530 | 710 | 760 | 400 | 0 | 600 | 1000 |
| February | 610 | 680 | 740 | 370 | 0 | 230 | 600 |
| March | 630 | 660 | 700 | 350 | 0 | 130 | 480 |
| April | 650 | 640 | 700 | 360 | 0 | 40 | 400 |
| May | 740 | 670 | 900 | 390 | 0 | 100 | 490 |
| June | 800 | 710 | 1020 | 400 | 0 | 320 | 720 |
| July | 840 | 760 | 1100 | 410 | 10 | 410 | 820 |
| August | 790 | 820 | 1600 | 420 | 10 | 680 | 1100 |
| September | 730 | 870 | 2100 | 430 | 20 | 870 | 1300 |
| October | 770 | 970 | 1900 | 360 | 30 | 1040 | 1400 |
| November | 810 | 1040 | 1700 | 350 | 30 | 1080 | 1430 |
| December | 810 | 1060 | 1200 | 380 | 30 | 1080 | 1460 |
| Year | 730 | 800 | 1200 | 390 | 10 | 550 | 940 |
| 1903 | |||||||
| Month. | White Nile at Khartoum. |
Blue Nile at Khartoum. |
Atbara river. |
Total for: White, Blue and Atbara rivers. |
Nile at: Halfa = 1st Jan.- 1st July. Assuân = 1st July- 1st Jan. |
Rosetta branch. |
Damietta branch. |
|---|---|---|---|---|---|---|---|
| January | 1000 | 300 | 0 | 1300 | 1300 | 1300 | 20 |
| February | 600 | 240 | 0 | 840 | 880 | 500 | 20 |
| March | 500 | 180 | 0 | 680 | 620 | 100 | 30 |
| April | 420 | 120 | 0 | 540 | 480 | 0 | 0 |
| May | 420 | 280 | 0 | 700 | 440 | 0 | 0 |
| June | 600 | 1200 | 200 | 2000 | 630 | 0 | 0 |
| July | [11]700 | 2500 | 600 | 3800 | 1400 | 0 | 150 |
| August | [11]400 | 8200 | 2300 | 10900 | 5700 | 1500 | 300 |
| September | [11]600 | 8200 | 1500 | 10300 | 8600 | 3300 | 2000 |
| October | 1700 | 4500 | 0 | 6200 | 6300 | 3500 | 2200 |
| November | 1600 | 1700 | 0 | 3200 | 3400 | 2500 | 1600 |
| December | 1450 | 800 | 0 | 2253 | 2000 | 1100 | 800 |
| Year | 830 | 2350 | 380 | 3560 | 2650 | 1150 | 590 |
[140]
| 1904 | ||||||||||||||
| Month. | Victoria Nile at Ripon Falls. |
Albert Nile | Gazelle river app. |
Sobat river. |
White Nile at Tewfikia. |
White Nile at Khartoum. |
Blue Nile at Khartoum. |
Atbara river. |
Total of: White, Blue and Atbara rivers. |
Nile at Assuân in flood. At Halfa in low supply. |
Rosetta branch. |
Damietta branch. |
||
|---|---|---|---|---|---|---|---|---|---|---|---|---|---|---|
| Wadelai. | Gondo- koro. |
Above Sobat junction. |
||||||||||||
| February | .. | 1030 | 1060 | 430 | 20 | 230 | 660 | 800 | 300 | 0 | 1100 | 1300 | 850 | 110 |
| March | .. | 1000 | 1020 | 430 | 20 | 130 | 560 | 520 | 210 | 0 | 730 | 850 | 110 | 250 |
| April | .. | 1000 | 1060 | 430 | 10 | 100 | 530 | 500 | 200 | 0 | 700 | 650 | 0 | 80 |
| May | .. | .. | 1200 | 430 | 0 | 160 | 590 | 500 | 300 | 0 | 800 | 600 | 0 | 10 |
| June | .. | .. | 1200 | [11]400 | 0 | 290 | 690 | 550 | 500 | 50 | 1050 | 950 | 0 | 30 |
| July | .. | .. | .. | .. | .. | .. | .. | .. | 2600 | 800 | .. | 1100 | 30 | 80 |
| August | .. | .. | .. | .. | .. | .. | .. | .. | 5500 | 1100 | .. | 5900 | 2000 | 1000 |
| September | .. | .. | .. | .. | .. | .. | .. | .. | .. | 700 | .. | .. | .. | .. |
| October | .. | .. | .. | .. | .. | .. | .. | .. | .. | .. | .. | .. | .. | .. |
| November | .. | .. | .. | .. | .. | .. | .. | .. | .. | .. | .. | .. | .. | .. |
| December | .. | .. | .. | .. | .. | .. | .. | .. | .. | .. | .. | .. | .. | .. |
| Year | .. | .. | .. | .. | .. | .. | .. | .. | .. | .. | .. | .. | .. | .. |
| 1904 | |||||||
| Month. | Victoria Nile at Ripon Falls. |
Albert Nile | Gazelle river app. |
Sobat river. |
White Nile at Tewfikia. |
||
|---|---|---|---|---|---|---|---|
| Wadelai. | Gondo- koro. |
Above Sobat junction. |
|||||
| February | .. | 1030 | 1060 | 430 | 20 | 230 | 660 |
| March | .. | 1000 | 1020 | 430 | 20 | 130 | 560 |
| April | .. | 1000 | 1060 | 430 | 10 | 100 | 530 |
| May | .. | .. | 1200 | 430 | 0 | 160 | 590 |
| June | .. | .. | 1200 | [11]400 | 0 | 290 | 690 |
| July | .. | .. | .. | .. | .. | .. | .. |
| August | .. | .. | .. | .. | .. | .. | .. |
| September | .. | .. | .. | .. | .. | .. | .. |
| October | .. | .. | .. | .. | .. | .. | .. |
| November | .. | .. | .. | .. | .. | .. | .. |
| December | .. | .. | .. | .. | .. | .. | .. |
| Year | .. | .. | .. | .. | .. | .. | .. |
| 1904 | |||||||
| Month. | White Nile at Khartoum. |
Blue Nile at Khartoum. |
Atbara river. |
Total of: White, Blue and Atbara rivers. |
Nile at Assuân in flood. At Halfa in low supply. |
Rosetta branch. |
Damietta branch. |
|---|---|---|---|---|---|---|---|
| February | 800 | 300 | 0 | 1100 | 1300 | 850 | 110 |
| March | 520 | 210 | 0 | 730 | 850 | 110 | 250 |
| April | 500 | 200 | 0 | 700 | 650 | 0 | 80 |
| May | 500 | 300 | 0 | 800 | 600 | 0 | 10 |
| June | 550 | 500 | 50 | 1050 | 950 | 0 | 30 |
| July | .. | 2600 | 800 | .. | 1100 | 30 | 80 |
| August | .. | 5500 | 1100 | .. | 5900 | 2000 | 1000 |
| September | .. | .. | 700 | .. | .. | .. | .. |
| October | .. | .. | .. | .. | .. | .. | .. |
| November | .. | .. | .. | .. | .. | .. | .. |
| December | .. | .. | .. | .. | .. | .. | .. |
| Year | .. | .. | .. | .. | .. | .. | .. |
[11] Blue Nile water flowing up the White Nile and decreasing the normal discharge.
[141]
| 1902 | |||||
| Name of River. |
Locality. | Minimum Summer Discharge m³ per second |
Maximum Flood Discharge m³ per second |
||
|---|---|---|---|---|---|
| Date. | Discharge. | Date. | Discharge. | ||
| Victoria Nile | Ripon Falls | December | 480 | May | 580 |
| Albert Nile | Wadelaï | April 5th | 530 | Dec. 10th | 760 |
| „ | Gondokoro | April 15th | 540 | Aug. 24th | 1360 |
| „ | Above Sobat | .. | .. | .. | .. |
| Sobat | Mouth | .. | .. | .. | .. |
| White Nile | Tewfikieh | April | app: 340 | .. | .. |
| „ | Duem | May, 11th | 340 | Dec. 29th | 1500 |
| Blue Nile | Khartoum | April 15th | 180 | Aug. 29th | 7200 |
| Atbara | Mouth | .. | .. | Sept. 8th | 2020 |
| Nile | Wadi Haifa | June 2nd | 490 | .. | .. |
| Assuân | .. | .. | Sept. 17th | 7000 | |
| 1903 | |||||
| Victoria Nile | Ripon Falls | January | 490 | July | 830 |
| Albert Nile | Wadelaï | April 5th | 630 | December | 1070 |
| „ | Gondokoro | April 10th | 680 | Sept. 23rd | 2600 |
| „ | Above Sobat | April | 430 | .. | 430 |
| Sobat | Mouth | April 15th | 40 | Sept. 15th | 1040 |
| White Nile | Tewfikieh | April | 380 | Dec. 15th | 1470 |
| „ | Duem | May 9th | 400 | Nov. 15th | 1670 |
| Blue Nile | Khartoum | May 5th | 100 | Aug. 28th | 9600 |
| Atbara | Mouth | .. | .. | Aug. 30th | 3100 |
| Nile | Wadi Haifa | May 21st | 420 | .. | .. |
| Assuân | .. | .. | Sept. 12th | 9000 | |
[142]
| Month | 1877-78 Minimum Year |
1878-79 Maximum Year |
Mean of 20 Years |
||||||
|---|---|---|---|---|---|---|---|---|---|
| Blue Nile at Khar- toum. |
Assuân. | Cairo. | Blue Nile at Khar- toum. |
Assuân. | Cairo. | Blue Nile at Khar- toum. |
Assuân. | Cairo. | |
| June | 1000 | 800 | 600 | 1000 | 500 | 250 | 1000 | 750 | 500 |
| July | 2800 | 2400 | 1100 | 3500 | 2000 | 900 | 2800 | 2200 | 1100 |
| August | 5300 | 5600 | 3900 | 8200 | 7900 | 5200 | 7000 | 7900 | 5300 |
| September | 4700 | 5900 | 4400 | 12500 | 12100 | 8600 | 8500 | 9200 | 7200 |
| October | 2500 | 4000 | 3900 | 8000 | 9300 | 10300 | 4500 | 6000 | 6900 |
| November | .. | 2400 | 2550 | .. | 4700 | 6500 | .. | 3300 | 3700 |
| December | .. | 1500 | 1600 | .. | 3200 | 3600 | .. | 2200 | 2300 |
| January | .. | 1200 | 1300 | .. | 2400 | 2600 | .. | 1600 | 1600 |
| February | .. | 800 | 800 | .. | 2100 | 2100 | .. | 1200 | 1200 |
| March | .. | 600 | 550 | .. | 1900 | 1900 | .. | 850 | 800 |
| April | .. | 500 | 400 | .. | 1600 | 1600 | .. | 700 | 620 |
| May | .. | 400 | 300 | .. | 1500 | 1500 | .. | 600 | 520 |
| Mean | .. | 2175 | 1783 | .. | 4100 | 3754 | .. | 3041 | 2645 |
Note.—The very high discharges at Assuân and Cairo in April and May 1879; the minimum discharge of that year was about 1500 cubic metres per second. There has never been any discharge like that since.
[143]
| Gauge. | Discharge m³ per second. |
Remarks. |
|---|---|---|
| 0·0 | 380 | This discharge table is the mean of two alternative tables; one assuming that the width of the
sill of the Ripon Falls was 127 metres as stated by Sir William Garstin, the other assuming that only half this width was the
working sill, the rest being more or less shallow water. The constant has been taken as ·57. Sir William Garstin makes the
width of the sill 70 + 40 + 13 = 127 metres, while Chavanne gives it as 82 + 14 + 55 + 22 = 173
metres. The wider the sill, the quicker is the rise of discharge from the measured discharge at the gauge of ·51. |
| ·1 | 410 | |
| ·2 | 450 | |
| ·3 | 480 | |
| ·4 | 520 | |
| ·5 | 550 | |
| ·6 | 580 | |
| ·7 | 620 | |
| ·8 | 660 | |
| ·9 | 700 | |
| 1·0 | 740 | |
| ·1 | 780 | |
| ·2 | 820 | |
| ·3 | 860 | |
| ·4 | 900 | |
| ·5 | 950 | |
| ·6 | 990 | |
| ·7 | 1040 | |
| ·8 | 1090 | |
| ·9 | 1140 | |
| 2·0 | 1190 |
[144]
| Gauge. | Discharge cubic metres per second. |
Gauge. | Discharge cubic metres per second. |
Gauge. | Discharge cubic metres per second. |
|---|---|---|---|---|---|
| 0·0 | 520 | 1·0 | 780 | 2·0 | 1090 |
| ·1 | 544 | ·1 | 810 | ·1 | 1104 |
| ·2 | 568 | ·2 | 840 | ·2 | 1118 |
| ·3 | 592 | ·3 | 870 | ·3 | 1132 |
| ·4 | 616 | ·4 | 900 | ·4 | 1146 |
| ·5 | 640 | ·5 | 930 | ·5 | 1160 |
| ·6 | 668 | ·6 | 962 | .. | .. |
| ·7 | 696 | ·7 | 994 | .. | .. |
| ·8 | 724 | ·8 | 1026 | .. | .. |
| ·9 | 752 | ·9 | 1058 | .. | .. |
| Gauge. | Discharge cubic metres per second. |
Remarks. |
|---|---|---|
| 0·0 | 550 | There is a scour of a metre and upwards at this gauge site during a high flood. The pit is apparently filled with sand during a low flood. |
| ·2 | 600 | |
| ·4 | 660 | |
| ·6 | 740 | |
| ·8 | 820 | |
| 1·0 | 900 | |
| ·2 | 1060 | |
| ·4 | 1220 | |
| ·6 | 1380 | |
| ·8 | 1540 | |
| 2·0 | 1700 | |
| ·2 | 1900 | |
| ·4 | 2100 | |
| ·6 | 2300 | |
| ·8 | 2500 | |
| 3·0 | 2700 |
[145]
| Gauge. | Discharge cubic metres per second. |
Gauge. | Discharge cubic metres per second. |
Remarks. |
|---|---|---|---|---|
| 0·0 | 500 | 2·0 | 1100 | This is a better site than Gondokoro. |
| ·2 | 540 | ·2 | 1300 | |
| ·4 | 580 | ·4 | 1500 | |
| ·6 | 620 | ·6 | 1700 | |
| ·8 | 660 | ·8 | 1900 | |
| 1·0 | 700 | 3·0 | 2100 | |
| ·2 | 780 | ·2 | 2300 | |
| ·4 | 860 | ·4 | 2500 | |
| ·6 | 940 | ·6 | 2700 | |
| ·8 | 1020 | .. | .. |
| Gauge. | Discharge in m³ per second. |
|---|---|
| 0·0 | 30 |
| ·2 | 58 |
| ·4 | 86 |
| ·6 | 112 |
| ·8 | 142 |
| 1·0 | 170 |
| ·2 | 218 |
| ·4 | 266 |
| ·6 | 314 |
| ·8 | 362 |
| 2·0 | 410 |
| ·2 | 500 |
| ·4 | 590 |
| ·6 | 680 |
| ·8 | 790 |
| 3·0 | 860 |
| ·2 | 950 |
| ·4 | 1040 |
| ·6 | 1130 |
| ·8 | 1220 |
| 4·0 | 1310 |
This gauge is in backwater when the north
end of the Sudd region is flooded.
[146]
| Gauge. | Discharge in m³ per second. |
|---|---|
| -1·0 | 150 |
| 0·0 | 330 |
| ·2 | 376 |
| ·4 | 422 |
| ·6 | 468 |
| ·8 | 514 |
| 1·0 | 560 |
| ·2 | 616 |
| ·4 | 672 |
| ·6 | 728 |
| ·8 | 784 |
| 2·0 | 840 |
| ·2 | 906 |
| ·4 | 972 |
| ·6 | 1038 |
| ·8 | 1104 |
| 3·0 | 1170 |
| ·2 | 1270 |
| ·4 | 1370 |
| ·6 | 1470 |
| ·8 | 1570 |
| 4·0 | 1670 |
| ·2 | 1770 |
| ·4 | 1870 |
| ·6 | 1970 |
| ·8 | 2070 |
| 5·0 | 2170 |
| Gauge. | Discharge in m³ per second. |
Remarks. |
|---|---|---|
| 0·0 | 330 | This gauge is in backwater when the Blue Nile is high. |
| ·1 | 354 | |
| ·2 | 370 | |
| ·3 | 402 | |
| ·4 | 426 | |
| ·5 | 450 | |
| ·6 | 480 | |
| ·7 | 515 | |
| ·8 | 555 | |
| ·9 | 600 | |
| 1·0 | 650 |
This table is only very approximative.
[147]
| Gauge. | Discharge in m³ per second |
|
|---|---|---|
| River rising. |
River Falling and Stationary. |
|
| 0·0 | 50 | 50 |
| ·2 | 80 | 64 |
| ·4 | 110 | 78 |
| ·6 | 140 | 92 |
| ·8 | 170 | 106 |
| 1·0 | 200 | 120 |
| ·2 | 240 | 146 |
| ·4 | 280 | 172 |
| ·6 | 320 | 198 |
| ·8 | 360 | 224 |
| 2·0 | 400 | 250 |
| ·2 | 450 | 284 |
| ·4 | 500 | 318 |
| ·6 | 550 | 352 |
| ·8 | 600 | 380 |
| 3·0 | 650 | 420 |
| ·2 | 720 | 406 |
| ·4 | 790 | 512 |
| ·6 | 860 | 558 |
| ·8 | 930 | 604 |
| 4·0 | 1000 | 650 |
| ·2 | 1100 | 720 |
| ·4 | 1200 | 790 |
| ·6 | 1300 | 860 |
| ·8 | 1400 | 930 |
| 5·0 | 1500 | 1000 |
| ·2 | 1630 | 1100 |
| ·4 | 1760 | 1200 |
| ·6 | 1890 | 1300 |
| ·8 | 2020 | 1400 |
| 6·0 | 2150 | 1500 |
| ·2 | 2320 | 1620 |
| ·4 | 2490 | 1740 |
| ·6 | 2600 | 1800 |
| ·8 | 2830 | 1980 |
| 7·0 | 3000 | 2100 |
| ·2 | 3200 | 2340 |
| ·4 | 3400 | 2580 |
| ·6 | 3600 | 2820 |
| ·8 | 3800 | 3060 |
| 8·0 | 4000 | 3300 |
| ·2 | 4300 | 3540 |
| ·4 | 4600 | 3780 |
| ·6 | 4900 | 4020 |
| ·8 | 5200 | 4200 |
| 9·0 | 5500 | 4500 |
| ·2 | 5900 | 4840 |
| ·4 | 6300 | 5180 |
| ·6 | 6700 | 5520 |
| ·8 | 7100 | 5860 |
| 10·0 | 7500 | 6200 |
| ·2 | 8000 | 6580 |
| ·4 | 8500 | 6960 |
| ·6 | 9000 | 7340 |
| ·8 | 9500 | 7720 |
| 11·0 | 10000 | 8100 |
| ·2 | 10600 | 8540 |
| ·4 | 11200 | 8980 |
| ·6 | 11800 | 9420 |
| ·8 | 12400 | 9800 |
| 12·0 | 13000 | 10300 |
(1) These discharges include the Rahad river. They represent the discharges below the Rahad river junction referred to the Wad Medani gauge.
(2) During a high flood the river scours, and it silts during a low flood; consequently for exact discharges below 5 metres, the section of the river should be taken annually in December.
[148]
| Gauge. | River rising |
River falling and Stationary |
|---|---|---|
| Discharge in m³ per second. |
Discharge in m³ per second. |
|
| - ·2 | 100 | 100 |
| +0·0 | 175 | 120 |
| ·2 | 260 | 145 |
| ·4 | 360 | 170 |
| ·6 | 470 | 195 |
| ·8 | 580 | 220 |
| 1·0 | 700 | 250 |
| ·2 | 860 | 340 |
| ·4 | 1020 | 430 |
| ·6 | 1180 | 520 |
| ·8 | 1340 | 610 |
| 2·0 | 1500 | 700 |
| ·2 | 1720 | 880 |
| ·4 | 1940 | 1060 |
| ·6 | 2160 | 1240 |
| ·8 | 2380 | 1420 |
| 3·0 | 2600 | 1600 |
| ·2 | 2980 | 1840 |
| ·4 | 3360 | 2080 |
| ·6 | 3740 | 2320 |
| ·8 | 4120 | 2560 |
| 4·0 | 4500 | 2800 |
| ·2 | 4980 | 3180 |
| ·4 | 5460 | 3560 |
| ·6 | 5940 | 3940 |
| ·8 | 6420 | 4320 |
| 5·0 | 6900 | 4700 |
| ·2 | 7560 | 5220 |
| ·4 | 8220 | 5740 |
| ·6 | 8880 | 6260 |
| ·8 | 9540 | 6780 |
| 6·0 | 10200 | 7300 |
| ·2 | 11000 | 7940 |
| ·4 | 11800 | 8580 |
| ·6 | 12600 | 9220 |
| ·8 | 13400 | 9860 |
| 7·0 | 14200 | 10500 |
| ·2 | ... | 11140 |
| ·4 | ... | 11780 |
| ·6 | ... | 12420 |
This gauge is in backwater when the White Nile is discharging more than the Blue Nile.
[149]
| Gauge. | Discharge. |
|---|---|
| 0·0 | 0·0 |
| ·2 | 20 |
| ·4 | 40 |
| ·6 | 60 |
| ·8 | 80 |
| 1·0 | 100 |
| ·2 | 150 |
| ·4 | 200 |
| ·6 | 250 |
| ·8 | 300 |
| 2·0 | 350 |
| ·2 | 444 |
| ·4 | 538 |
| ·6 | 632 |
| ·8 | 726 |
| 3·0 | 820 |
| ·2 | 1012 |
| ·4 | 1204 |
| ·6 | 1396 |
| ·8 | 1588 |
| 4·0 | 1780 |
| ·2 | 2078 |
| ·4 | 2376 |
| ·6 | 2674 |
| ·8 | 2972 |
| 5·0 | 3270 |
| ·2 | 3596 |
| ·4 | 3922 |
| ·6 | 4248 |
| ·8 | 4574 |
| 6·0 | 4900 |
[150]
The gauges are in metres and are referred to mean low-water level as zero.
| The zero is: | |||
| at Assuân | R. L. | 85·00 | |
| at Assiut | „ | 45·55 | |
| at Cairo | „ | 12·25 | |
N.B.—At Assiut R. L. 45·55, according to the reservoir levels, is R. L. 45·05 according to the 4th Circle levels.
(The discharges are in cubic metres per second.)
This discharge table may be used approximately for any gauge on the Nile north of Assuân with its zero at mean low-water level; adding ·5 to the gauge in Kena Province, and deducting ·5 from the gauge in Minieh and Beni-Suef.
If the river is rising, take the discharge corresponding to the higher gauge; if falling or stationary to the lower one.
| Gauge. | Discharge. |
|---|---|
| -1·0 | 360 |
| - ·8 | 406 |
| - ·6 | 452 |
| - ·4 | 498 |
| - ·2 | 544 |
| 0·0 | 590 |
| ·2 | 668 |
| ·4 | 746 |
| ·6 | 824 |
| ·8 | 902 |
| 1·0 | 980 |
| ·2 | 1086 |
| ·4 | 1192 |
| ·6 | 1298 |
| ·8 | 1404 |
| 2·0 | 1510 |
| ·2 | 1652 |
| ·4 | 1794 |
| ·6 | 1936 |
| ·8 | 2078 |
| 3·0 | 2220 |
| ·2 | 2408 |
| ·4 | 2596 |
| ·6 | 2784 |
| ·8 | 2972 |
| 4·0 | 3160 |
| ·2 | 3404 |
| ·4 | 3648 |
| ·6 | 3892 |
| ·8 | 4136 |
| 5·0 | 4380 |
| ·2 | 4674 |
| ·4 | 4968 |
| ·6 | 5262 |
| ·8 | 5556 |
| 6·0 | 5850 |
| ·2 | 6150 |
| ·4 | 6450 |
| ·6 | 6800 |
| ·8 | 7200 |
| 7·0 | 7600 |
| ·2 | 8000 |
| ·4 | 8400 |
| ·6 | 8800 |
| ·8 | 9300 |
| 8·0 | 9800 |
| ·2 | 10300 |
| ·4 | 10900 |
| ·6 | 11500 |
| ·8 | 12100 |
| 9·0 | 12800 |
| ·2 | 13600 |
[151]
Discharge Table of the Wady Halfa Gauge, for use at Assuân when the Assuân Dam is being regulated on, and consequently the Assuân Gauge no longer represents the normal discharge of the Nile. At this stage of the river it may be assumed that the water travels normally between Wady Halfa and Assuân in 3 or 4 days.
| Gauge. | Discharge cubic metres per second. |
|---|---|
| 0·8 | 370 |
| 1·0 | 440 |
| ·2 | 516 |
| ·4 | 592 |
| ·6 | 688 |
| ·8 | 804 |
| 2·0 | 920 |
| ·2 | 1048 |
| ·4 | 1176 |
| ·6 | 1314 |
| ·8 | 1462 |
| 3·0 | 1610 |
| ·2 | 1800 |
| ·4 | 1990 |
| ·6 | 2180 |
| ·8 | 2370 |
| 4·0 | 2560 |
| ·2 | 2802 |
| ·4 | 3044 |
| ·6 | 3286 |
| ·8 | 3528 |
| 5·0 | 3770 |
| 1890 | |
| Gauge. | Discharge m³ per second. |
|---|---|
| 0·00 | 0 |
| ·25 | 50 |
| ·50 | 100 |
| ·75 | 150 |
| 1·00 | 200 |
| ·25 | 287 |
| ·50 | 375 |
| ·75 | 463 |
| 2·00 | 550 |
| ·25 | 700 |
| ·50 | 850 |
| ·75 | 1000 |
| 3·00 | 1150 |
| ·25 | 1312 |
| ·50 | 1475 |
| ·75 | 1638 |
| 4·00 | 1800 |
| ·25 | 1975 |
| ·50 | 2150 |
| ·75 | 2325 |
| 5·00 | 2500 |
| ·25 | 2700 |
| ·50 | 2900 |
| ·75 | 3100 |
| 6·00 | 3300 |
| ·25 | 3525 |
| ·50 | 3750 |
| ·75 | 3975 |
| 7·00 | 4200 |
| ·25 | 4450 |
| ·50 | 4700 |
| ·75 | 4950 |
| 8·00 | 5200 |
| ·25 | 5475 |
| ·50 | 5750 |
| ·75 | 6025 |
| 9·00 | 6300 |
Zero of the gauge R. L. 10·00 metres above mean sea.
[152]
| 1890 | |
| Gauge. | Discharge m³ per second. |
|---|---|
| 0·00 | 0 |
| ·25 | 20 |
| ·50 | 40 |
| ·75 | 60 |
| 1·00 | 80 |
| ·25 | 110 |
| ·50 | 140 |
| ·75 | 170 |
| 2·00 | 200 |
| ·25 | 262 |
| ·50 | 325 |
| ·75 | 388 |
| 3·00 | 450 |
| ·25 | 537 |
| ·50 | 625 |
| ·75 | 712 |
| 4·00 | 800 |
| ·25 | 925 |
| ·50 | 1050 |
| ·75 | 1175 |
| 5·00 | 1300 |
| ·25 | 1450 |
| ·50 | 1600 |
| ·75 | 1750 |
| 6·00 | 1900 |
| ·25 | 2075 |
| ·50 | 2250 |
| ·75 | 2425 |
| 7·00 | 2600 |
| ·25 | 2800 |
| ·50 | 3000 |
| ·75 | 3200 |
| 8·00 | 3400 |
| ·25 | 3625 |
| ·50 | 3850 |
| ·75 | 4075 |
| 9·00 | 4300 |
Note.—Zero of the gauge R. L. 10·00 metres above mean sea.
[153]
| Year. | Minimum summer |
Maximum flood |
||
|---|---|---|---|---|
| Date. | Gauge. | Date. | Gauge. | |
| 1873 | 5 June | -0·37 | 1 September | 7·66 |
| 1874 | 30 May | -0·64 | 6 September | 8·97 |
| 1875 | 23 May | -0·17 | 11 September | 8·36 |
| 1876 | 15 June | +0·13 | 7 September | 8·68 |
| 1877 | 27 May | +0·10 | 20 August | 6·40 |
| 1878 | 23 June | -0·71 | 1 October | 9·15 |
| 1879 | 23 May | +1·88 | 13 September | 8·59 |
| 1880 | 9 June | +0·82 | 4 September | 7·82 |
| 1881 | 14 May | +0·00 | 4 September | 8·14 |
| 1882 | 23 June | -0·55 | 28 August | 8·00 |
| 1883 | 22 June | +0·04 | 17 September | 8·18 |
| 1884 | 27 May | +0·37 | 1 September | 7·73 |
| 1885 | 21 June | -0·44 | 28 August | 8·05 |
| 1886 | 3 June | -0·06 | 22 September | 8·04 |
| 1887 | 8 May | -0·03 | 1 September | 8·81 |
| 1888 | 8 June | -0·08 | 24 August | 7·08 |
| 1889 | 24 June | -0·60 | 2 September | 8·36 |
| 1890 | 8 June | -0·60 | 2 September | 8·72 |
| 1891 | 19 May | -0·21 | 27 September | 7·84 |
| 1892 | 18 June | -0·64 | 20 September | 8·88 |
| 1893 | 18 June | +0·35 | 14 September | 7·75 |
| 1894 | 16 June | +0·06 | 18 September | 8·61 |
| 1895 | 23 June | +0·78 | 10 September | 8·68 |
| 1896 | 13 June | +0·49 | 3 September | 8·63 |
| 1897 | 31 May | +0·62 | 1 September | 7·80 |
| 1898 | 23 June | -0·25 | 29 August | 8·63 |
| 1899 | 1 June | +0·15 | 4 September | 6·67 |
| 1900 | 15 May | -0·93 | 19 August | 7·91 |
| 1901 | 10 May | -0·46 | 6 September | 7·82 |
| 1902 | 12 May | -0·48 | 17 September | 6·72 |
| 1903 | 16 April | -0·68 | 27 August | 7·93 |
| 1904 | 5 June | -0·20 | 13 August | 6·97 |
Zero is R. L. 85·00 metres or mean low water level.
[154]
| Locality. | Length in kilo- metres. |
MEAN AREA IN SQUARE METRES | |||||
|---|---|---|---|---|---|---|---|
| Below zero. |
Below 6 metres. |
Below 7 metres. |
Below 8 metres. |
Below 8.5 metres. |
Below 9 metres. |
||
| Assuân to Ramâdi | 81 | 1024 | 4930 | 5808 | 6754 | 7337 | 7993 |
| Ramâdi to Esna | 76 | 674 | 4554 | 5461 | 6398 | 6966 | 7695 |
| Esna to Kena | 115 | 852 | 4476 | 5336 | 6221 | 6726 | 7363 |
| Kena to Sohâg | 158 | 973 | 4718 | 5600 | 6535 | 7121 | 7873 |
| Sohâg to Assiout | 98 | 1037 | 5220 | 6305 | 7705 | 8683 | 9749 |
| Assiout to Minia | 138 | 899 | 5149 | 6205 | 7783 | 8845 | 9937 |
| Minia to Beni-Suêf | 117 | 915 | 5035 | 6007 | 7315 | 8196 | 9140 |
| Beni-Suêf to Koshesha | 34 | 665 | 5040 | 6080 | 7532 | 8379 | 9247 |
| Koshesha to Cairo | 81 | 1031 | 5364 | 6388 | 7813 | 8648 | 9495 |
| Cairo to the Barrage | 24 | 1402 | 5414 | 6628 | 8346 | 9258 | 10184 |
| Assuân to Assiout | 528 | 920 | 4760 | 5680 | 6690 | 7310 | 8080 |
| Assiout to Koshesha | 289 | 870 | 5080 | 6100 | 7550 | 8510 | 9520 |
| Koshesha to Cairo | 81 | 1030 | 5360 | 6380 | 7810 | 8640 | 9490 |
| Assuân to Cairo | 898 | 910 | 4930 | 5890 | 7080 | 7830 | 8690 |
[155]
| Locality. | Length in kilo- metres. |
CONTENTS IN MILLIONS OF CUBIC METRES |
CONTENTS IN MILLIONS OF CUBIC METRES |
||||||||||
|---|---|---|---|---|---|---|---|---|---|---|---|---|---|
| Below zero. |
From zero to 6.0 |
From 6.0 to 7.0 |
7.0 to 8.0 |
8.0 to 8.5 |
8.5 to 9.0 |
Below zero. |
Below 6.0 |
Below 7.0 |
Below 8.0 |
Below 8.5 |
Below 9.0 |
||
| Assuân to Ramadi | 81 | 83 | 316 | 711 | 77 | 47 | 53 | 83 | 399 | 470 | 547 | 594 | 647 |
| Ramadi to Esna | 76 | 51 | 295 | 69 | 71 | 43 | 56 | 51 | 346 | 415 | 486 | 529 | 585 |
| Esna to Kena | 115 | 98 | 417 | 99 | 102 | 58 | 73 | 98 | 514 | 614 | 715 | 773 | 847 |
| Kena to Sohag | 128 | 154 | 592 | 139 | 148 | 83 | 119 | 154 | 745 | 885 | 1032 | 1125 | 1244 |
| Sohag to Assiout | 98 | 102 | 410 | 106 | 137 | 96 | 104 | 102 | 512 | 618 | 755 | 851 | 955 |
| Assiout to Minieh | 138 | 124 | 586 | 146 | 218 | 147 | 151 | 124 | 710 | 856 | 1074 | 1220 | 1371 |
| Minieh to Beni Suêf | 117 | 107 | 482 | 114 | 153 | 103 | 110 | 107 | 589 | 703 | 856 | 859 | 1069 |
| Beni Suêf to Kushesha | 34 | 23 | 149 | 35 | 49 | 29 | 29 | 23 | 171 | 207 | 256 | 285 | 314 |
| Kushesha to Cairo | 81 | 84 | 351 | 83 | 115 | 68 | 69 | 84 | 434 | 517 | 633 | 700 | 769 |
| Cairo to the Barrage | 28 | 34 | 96 | 29 | 41 | 22 | 22 | 34 | 130 | 159 | 200 | 222 | 244 |
| Assuân to Assiout | 528 | 487 | 2030 | 484 | 534 | 327 | 405 | 487 | 2517 | 3001 | 3535 | 3862 | 4267 |
| Assiout to Kushesha | 289 | 254 | 1217 | 295 | 420 | 278 | 291 | 254 | 1471 | 1766 | 2186 | 2464 | 2755 |
| Kushesha to Cairo | 81 | 84 | 351 | 83 | 115 | 68 | 69 | 84 | 435 | 518 | 633 | 701 | 770 |
| Assuân to Cairo | 898 | 825 | 3598 | 862 | 1069 | 673 | 765 | 825 | 4423 | 5285 | 6354 | 7027 | 7792 |
[156]
| From. | To. | Mean width of water surface | |||||
|---|---|---|---|---|---|---|---|
| 0 | 6·0 | 7·0 | 8·0 | 8·5 | 9·0 | ||
| Assuân | Ramadi | 400 | 840 | 880 | 1030 | 1270 | 1400 |
| Ramadi | Esna | 340 | 850 | 890 | 1030 | 1260 | 1620 |
| Esna | Kena | 350 | 820 | 850 | 940 | 1120 | 1400 |
| Kena | Sohag | 380 | 870 | 890 | 1000 | 1300 | 1560 |
| Sohag | Assiout | 400 | 1000 | 1170 | 1720 | 2080 | 2170 |
| Assiout | Minieh | 390 | 970 | 1180 | 1890 | 2060 | 2080 |
| Minieh | Beni Suêf | 490 | 960 | 1300 | 1550 | 1800 | 1840 |
| Beni Suêf | Kushesha | 500 | 1000 | 1390 | 1690 | 1720 | 1730 |
| Kushesha | Cairo | 450 | 960 | 1100 | 1570 | 1700 | 1700 |
| Cairo | Barrage | 440 | 940 | 1460 | 1840 | 1860 | 1890 |
| Assuân | Assiout | 370 | 880 | 940 | 1140 | 1410 | 1630 |
| Assiout | Kushesha | 460 | 980 | 1290 | 1710 | 1860 | 1880 |
| Kushesha | Cairo | 450 | 960 | 1100 | 1570 | 1700 | 1700 |
| Assuân | Cairo | 430 | 940 | 1110 | 1470 | 1660 | 1740 |
| Area of water surface in millions of square metres. | |||||||
| Assuân | Assiout | 200 | 470 | 500 | 600 | 740 | 860 |
| Assiout | Cairo | 130 | 280 | 370 | 490 | 540 | 540 |
| Assuân | Cairo | 400 | 840 | 1000 | 1320 | 1490 | 1560 |
[157]
| From. | To. | Distance in kilo- metres down the centre line of the flood. |
Distance in kilo- metres down the summer channel. |
Slope in flood. |
Slope in summer. |
|---|---|---|---|---|---|
| Assuân | Silsila | 70 | 72 | 1⁄11500 | 1⁄12600 |
| Silsila | Kasr-es-Saad | 250 | 258 | 1⁄14800 | 1⁄14800 |
| Kasr-es-Saad | Khazindaria | 150 | 159 | 1⁄12300 | 1⁄13400 |
| Khazindaria | Assiout | 60 | 63 | 1⁄11800 | 1⁄14500 |
| Assiout | Beni Mazâr | 180 | 196 | 1⁄11000 | 1⁄11800 |
| Beni Mazâr | Ashmant | 90 | 94 | 1⁄11000 | 1⁄11400 |
| Ashmant | Cairo | 100 | 106 | 1⁄11600 | 1⁄12300 |
| Cairo | Barrage | 23 | 25 | 1⁄10800 | 1⁄20000 |
| Assuân | Cairo | 900 | 948 | 1⁄12200 | 1⁄13000 |
[158]
| Distance from Assuân along centre of flood. |
Name of Locality. |
R. L. According to reservoir levels. |
R. L. According to inspectors of irrigation. |
Distance from Assuân along summer Channel. |
|---|---|---|---|---|
| 0 | Assuân | 85·0 | 85·0 | 0 |
| 70 | Gebel Silsila | 79·3 | 79·4 | 72 |
| 106 | Edfu | 76·7 | 77·0 | .. |
| 157 | Esna | 73·1 | 72·6 | .. |
| 194 | Armant | 70·1 | 69·6 | .. |
| 213 | Luxor | 69·0 | 68·5 | .. |
| 272 | Kena | 65·3 | 64·8 | .. |
| 320 | Kasr-es-Saad | 61·7 | 61·2 | 330 |
| 328 | Heu | 61·2 | 60·7 | .. |
| 333 | Naga Hamadi | 61·0 | 60·5 | .. |
| 365 | Abu Shusha | 58·6 | 58·1 | .. |
| 373 | Balyana | 58·3 | 57·8 | .. |
| 390 | Girga | 56·9 | 56·5 | .. |
| 429 | Sohâg | 53·8 | 53·2 | .. |
| 470 | Khazindaria | 49·9 | 49·4 | 489 |
| 505 | Aboutig Escape | 47·7 | 47·1 | .. |
| 530 | Assiout[12] | 45·55 | 45·05 | 552 |
| 598 | Derut Escape | 39·1 | 38·5 | .. |
| 627 | Roda | 36·3 | 35·7 | .. |
| 666 | Minia | 32·6 | 32·0 | .. |
| 710 | Beni Mazâr | 28·9 | .. | 748 |
| .. | Beni Suêf[13] | 22·1 | 21·8 | .. |
| 800 | Ashmant | 20·5 | 20·2 | 842 |
| .. | Kushesha Escape | 18·9 | 18·6 | .. |
| .. | El-Ayât | 15·8 | 15·5 | .. |
| 898 | Cairo gauge | 12·10 | 12·25 | .. |
| 900 | Cairo | 12·00 | 12·1 | 948 |
[12] Downstream of the Assiout weir.
[13] The Beni Suêf gauge is unreliable in summer as it is on a branch of the river which is dammed by the villagers.
[159]
| A low Nile flood is | 6·4 | metres | - | at Assuân. | |
| A mean Nile flood is | 7·5 | „ | |||
| A high Nile flood is | 8·3 | „ |
The discharges of the Upper Egypt canals corresponding to the Assuân gauges are approximately as follows: —
| Assuân | 6·0 | 1300 | |
| ·1 | 1370 | ||
| ·2 | 1440 | ||
| ·3 | 1510 | ||
| ·4 | 1580 | —Low Nile flood. | |
| ·5 | 1650 | ||
| ·6 | 1620 | ||
| ·7 | 1790 | ||
| ·8 | 1860 | ||
| ·9 | 1930 | ||
| 7·0 | 2000 | ||
| ·1 | 2070 | ||
| ·2 | 2140 | ||
| ·3 | 2210 | ||
| ·4 | 2280 | ||
| ·5 | 2350 | —Mean Nile flood. | |
| ·6 | 2420 | ||
| ·7 | 2490 | ||
| ·8 | 2560 | ||
| ·9 | 2630 | ||
| 8·0 | 2700 | ||
| ·1 | 2770 | ||
| ·2 | 2840 | ||
| ·3 | 2910 | —High Nile flood. | |
| ·4 | 2980 | ||
| ·5 | 3050 | ||
| ·6 | 3120 | ||
| ·7 | 3190 | ||
| ·8 | 3260 | ||
| ·9 | 3330 | ||
| 9·0 | 3400 | ||
| R. L. of zero in R. L. 85·00 metres. | |||
[160]
DISCHARGES OF THE CANALS IN UPPER EGYPT IN 1892.
| Name of Canal. | AUGUST | SEPTEMBER | ||||||||
|---|---|---|---|---|---|---|---|---|---|---|
| 15 | 20 | 25 | 31 | 5 | 10 | 15 | 20 | 25 | 30 | |
| Ramadi | 55 | 66 | 80 | 76 | 82 | 85 | 89 | 91 | .. | .. |
| Um-Ads | 8 | 9 | 12 | 13 | 16 | 18 | 20 | .. | .. | .. |
| Afsûn | 25 | 29 | 37 | 39 | 42 | 43 | 45 | .. | .. | .. |
| Fadilia | 12 | 26 | 44 | 49 | 52 | 55 | 50 | .. | .. | .. |
| Toukh | 10 | 19 | 37 | 42 | 44 | 58 | 60 | .. | .. | .. |
| Rannan | 28 | 36 | 53 | 59 | 62 | 67 | 70 | .. | .. | .. |
| Dumrania | 26 | 35 | 56 | 62 | 65 | 70 | 74 | .. | .. | .. |
| Rashwania | 35 | 41 | 58 | 61 | 64 | 70 | 73 | .. | .. | .. |
| Kasra | 49 | 62 | 104 | 133 | 138 | 150 | 150 | .. | .. | .. |
| Zarzria | 24 | 30 | 64 | 76 | 77 | 90 | 90 | .. | .. | .. |
| Girgawia | 54 | 59 | 84 | 95 | 96 | 120 | 120 | .. | .. | .. |
| Sohagia | 380 | 386 | 470 | 485 | 492 | 520 | 500 | .. | .. | .. |
| Tahta | 44 | 45 | 66 | 75 | 77 | 82 | 85 | .. | .. | .. |
| Shatura | 25 | 24 | 39 | 47 | 49 | 45 | 40 | .. | .. | .. |
| Ibrahimia | 460 | 440 | 540 | 600 | 640 | 700 | 740 | .. | .. | .. |
| Waladia | 6 | 6 | 14 | 20 | 24 | 24 | 24 | .. | .. | .. |
| Minor Canals | 10 | 15 | 20 | 30 | 30 | 30 | 20 | .. | .. | .. |
| Total left bank | 1250 | 1320 | 1790 | 1980 | 2060 | 2250 | 2270 | .. | .. | .. |
| Kilibia | 6 | 11 | 17 | 20 | 24 | 28 | 32 | .. | .. | .. |
| Maala | 5 | 5 | 18 | 22 | 26 | 30 | 32 | .. | .. | .. |
| Bayadiâ | 30 | 36 | 62 | 69 | 77 | 85 | 90 | .. | .. | .. |
| Shanhuria | 46 | 55 | 98 | 108 | 116 | 120 | 125 | .. | .. | .. |
| Shekhia | 5 | 6 | 10 | 11 | 12 | 12 | 12 | .. | .. | .. |
| Gilasi | 19 | 30 | 58 | 64 | 68 | 70 | 72 | .. | .. | .. |
| Samatha | 12 | 19 | 41 | 48 | 52 | 60 | 60 | .. | .. | .. |
| Tarif | 10 | 15 | 20 | 25 | 25 | 25 | 25 | .. | .. | .. |
| Hawis | 15 | 22 | 38 | 41 | 44 | 51 | 56 | .. | .. | .. |
| Ahaiwia | 10 | 15 | 20 | 25 | 25 | 25 | 25 | .. | .. | .. |
| Isaiwia | 35 | 35 | 55 | 60 | 63 | 70 | 70 | .. | .. | .. |
| Khizindaria | 63 | 62 | 86 | 96 | 98 | 110 | 95 | .. | .. | .. |
| Maanah | 35 | 41 | 58 | 67 | 71 | 80 | 85 | .. | .. | .. |
| Sant | 6 | 7 | 8 | 10 | 10 | 12 | 12 | .. | .. | .. |
| Minor Canals | 4 | 8 | 12 | 15 | 15 | 15 | 15 | .. | .. | .. |
| Total right bank | 300 | 370 | 600 | 680 | 730 | 800 | 810 | .. | .. | .. |
| Total both banks | 1550 | 1690 | 2390 | 2660 | 2790 | 3050 | 3080 | .. | .. | .. |
[161]
DISCHARGES OF THE CANALS IN UPPER EGYPT IN 1892.
| Name of Canal. | AUGUST | SEPTEMBER | ||||||||
|---|---|---|---|---|---|---|---|---|---|---|
| 15 | 20 | 25 | 31 | 5 | 10 | 15 | 20 | 25 | 30 | |
| Beni-Husain | 13 | 16 | 20 | 30 | 35 | 40 | .. | .. | .. | .. |
| Abu-Bakra | 53 | 38 | 60 | 80 | 85 | 93 | .. | .. | .. | .. |
| Sultani | 18 | 10 | 20 | 37 | 38 | 40 | .. | .. | .. | .. |
| Nina | 9 | 5 | 10 | 20 | 20 | 20 | .. | .. | .. | .. |
| Bahabshin | 12 | 8 | 14 | 27 | 28 | 33 | .. | .. | .. | .. |
| Magnuna | 15 | 15 | 22 | 40 | 45 | 45 | .. | .. | .. | .. |
| Kusheha | 70 | 70 | 70 | 70 | 70 | 70 | .. | .. | .. | .. |
| Zawia | 11 | 7 | 16 | 27 | 28 | 33 | .. | .. | .. | .. |
| Girza | 40 | 38 | 70 | 95 | 100 | 100 | .. | .. | .. | .. |
| Zumr | 13 | 12 | 14 | 19 | 20 | 19 | .. | .. | .. | .. |
| Minor Canals | 2 | 2 | 4 | 4 | 4 | 4 | .. | .. | .. | .. |
| Total left bank | 260 | 220 | 320 | 450 | 480 | 500 | .. | .. | .. | .. |
| Aly Bey | 14 | 13 | 28 | 33 | 20 | 18 | .. | .. | .. | .. |
| Khassâb | 19 | 14 | 25 | 35 | 40 | 46 | .. | .. | .. | .. |
| Minor Canals | 7 | 6 | 12 | 12 | 14 | 14 | .. | .. | .. | .. |
| Total right bank | 40 | 30 | 70 | 80 | 80 | 80 | .. | .. | .. | .. |
| Total both banks | 300 | 250 | 390 | 530 | 560 | 580 | .. | .. | .. | .. |
| Canal discharges between Assuân and Cairo. | ||||||||||
| Left bank | 1510 | 1540 | 2110 | 2430 | 2540 | 2750 | .. | .. | .. | .. |
| Right bank | 340 | 400 | 670 | 760 | 810 | 880 | .. | .. | .. | .. |
| Total | 1850 | 1940 | 2780 | 3190 | 3390 | 3630 | .. | .. | .. | .. |
| Assuân gauge | 6.7 | 7.4 | 8.3 | 8.3 | 8.6 | 8.8 | 8.7 | .. | .. | .. |
| Assiout gauge | 6.1 | 5.9 | 6.8 | 7.2 | 7.4 | 7.7 | 8.1 | .. | .. | .. |
| Cairo gauge | 5.8 | 5.5 | 5.8 | 6.7 | 7.0 | 7.2 | 7.7 | .. | .. | .. |
[162]
DISCHARGES OF THE CANALS IN UPPER EGYPT IN 1893.
| Name of Canal. | AUGUST | SEPTEMBER | OCTOBER | ||||||||||||
|---|---|---|---|---|---|---|---|---|---|---|---|---|---|---|---|
| 15 | 20 | 25 | 31 | 5 | 10 | 15 | 20 | 25 | 30 | 5 | 10 | 15 | 25 | ||
| Ramadi | 50 | 56 | 58 | 56 | 55 | 60 | 64 | 61 | 64 | 61 | .. | .. | .. | .. | |
| Um-Ads | 10 | 12 | 12 | 12 | 13 | 14 | 15 | 15 | 15 | 15 | .. | .. | .. | .. | |
| Asfun | 28 | 33 | 34 | 33 | 31 | 33 | 35 | 33 | 34 | 33 | .. | .. | .. | .. | |
| Fadilia | 17 | 24 | 26 | 26 | 22 | 24 | 29 | 24 | 22 | 20 | .. | .. | .. | .. | |
| Toukh | 19 | 24 | 26 | 27 | 21 | 24 | 24 | 22 | 27 | 26 | .. | .. | .. | .. | |
| Rannan | 20 | 26 | 29 | 28 | 25 | 25 | 30 | 27 | 30 | 28 | .. | .. | .. | .. | |
| Dumrania | 33 | 39 | 44 | 43 | 39 | 41 | 46 | 43 | 46 | 44 | .. | .. | .. | .. | |
| Rashwania | 45 | 52 | 60 | 55 | 50 | 53 | 68 | 60 | 65 | 60 | .. | .. | .. | .. | |
| Kasra | 70 | 72 | 82 | 79 | 72 | 76 | 87 | 82 | 87 | 82 | .. | .. | .. | .. | |
| Zarzuria | 38 | 44 | 47 | 46 | 45 | 47 | 52 | 46 | 52 | 46 | .. | .. | .. | .. | |
| Gergawia | 55 | 55 | 59 | 58 | 56 | 56 | 62 | 57 | 62 | 57 | .. | .. | .. | .. | |
| Sohagia | 390 | 380 | 400 | 390 | 350 | 360 | 420 | 390 | 430 | 410 | .. | .. | .. | .. | |
| Tahta | 45 | 46 | 47 | 46 | 44 | 45 | 51 | 44 | 52 | 47 | .. | .. | .. | .. | |
| Shatura | 20 | 23 | 26 | 25 | 22 | 17 | 28 | 25 | 29 | 28 | .. | .. | .. | .. | |
| Ibrahimia | 520 | 520 | 560 | 560 | 540 | 540 | 600 | 580 | 600 | 600 | .. | .. | .. | .. | |
| Waladia | 10 | 11 | 12 | 12 | 11 | 11 | 11 | 12 | 12 | 12 | .. | .. | .. | .. | |
| Minor Canals | 10 | 15 | 20 | 20 | 20 | 20 | 20 | 20 | 20 | 20 | .. | .. | .. | .. | |
| Total left bank | 1380 | 1430 | 1550 | 1510 | 1420 | 1440 | 1640 | 1540 | 1650 | 1590 | .. | .. | .. | .. | |
| Kilibia | 11 | 13 | 15 | 14 | 14 | 15 | 17 | 16 | 16 | 16 | .. | .. | .. | .. | |
| Maala | 11 | 12 | 13 | 12 | 13 | 14 | 16 | 16 | 16 | 16 | .. | .. | .. | .. | |
| Bayadia | 36 | 44 | 48 | 46 | 40 | 45 | 52 | 44 | 42 | 30 | .. | .. | .. | .. | |
| Shanhuria | 56 | 64 | 69 | 63 | 62 | 64 | 70 | 50 | 40 | 30 | .. | .. | .. | .. | |
| Shekhia | 6 | 7 | 9 | 8 | 6 | 6 | 4 | 5 | 6 | 6 | .. | .. | .. | .. | |
| Gilasi | 24 | 32 | 34 | 32 | 29 | 30 | 35 | 31 | 34 | 33 | .. | .. | .. | .. | |
| Samatha | 17 | 24 | 27 | 25 | 22 | 24 | 28 | 25 | 27 | 26 | .. | .. | .. | .. | |
| Tarif | 12 | 14 | 16 | 15 | 14 | 15 | 17 | 16 | 17 | 16 | .. | .. | .. | .. | |
| Hawis | 24 | 27 | 29 | 29 | 27 | 27 | 29 | 27 | 25 | 16 | .. | .. | .. | .. | |
| Ahaiwia | 15 | 16 | 16 | 16 | 12 | 12 | 10 | 7 | 4 | 4 | .. | .. | .. | .. | |
| Isawia | 30 | 37 | 40 | 37 | 37 | 39 | 40 | 40 | 43 | 40 | .. | .. | .. | .. | |
| Khazindaria | 60 | 62 | 67 | 66 | 60 | 60 | 66 | 65 | 55 | 50 | .. | .. | .. | .. | |
| Maanah | 20 | 30 | 32 | 32 | 29 | 32 | 33 | 34 | 24 | 24 | .. | .. | .. | .. | |
| Sant | 6 | 6 | 9 | 8 | 7 | 7 | 7 | 7 | 7 | 7 | .. | .. | .. | .. | |
| Minor Canals | 4 | 7 | 10 | 10 | 10 | 10 | 10 | 10 | 10 | 10 | .. | .. | .. | .. | |
| Total right bank | 340 | 400 | 430 | 410 | 390 | 400 | 430 | 390 | 370 | 320 | .. | .. | .. | .. | |
| Total both banks | 1720 | 1830 | 1980 | 1920 | 1810 | 1840 | 2070 | 1930 | 2020 | 1910 | .. | .. | .. | .. | |
[163]
DISCHARGES OF THE CANALS IN UPPER EGYPT IN 1893.
| Name of Canal. | AUGUST | SEPTEMBER | OCTOBER | ||||||||||||
|---|---|---|---|---|---|---|---|---|---|---|---|---|---|---|---|
| 15 | 20 | 25 | 31 | 5 | 10 | 15 | 20 | 25 | 30 | 5 | 10 | 15 | 20 | 25 | |
| Beni Husain | 17 | 18 | 19 | 20 | 14 | 12 | 16 | 17 | 17 | 17 | .. | .. | .. | .. | .. |
| Abu-Bakra | 63 | 50 | 63 | 64 | 60 | 58 | 68 | 65 | 64 | 64 | .. | .. | .. | .. | .. |
| Sultani | 17 | 16 | 17 | 17 | 16 | 15 | 17 | 17 | 17 | 17 | .. | .. | .. | .. | .. |
| Nina | 9 | 8 | 9 | 10 | 10 | 9 | 9 | 9 | 9 | 9 | .. | .. | .. | .. | .. |
| Bahabshin | 11 | 9 | 11 | 12 | 12 | 10 | 12 | 11 | 13 | 14 | .. | .. | .. | .. | .. |
| Magnuna | 21 | 20 | 20 | 20 | 24 | 23 | 28 | 29 | 30 | 30 | .. | .. | .. | .. | .. |
| Kushâska | 70 | 70 | 50 | 30 | 0 | 0 | 0 | 0 | 0 | 0 | .. | .. | .. | .. | .. |
| Zawia | 11 | 8 | 13 | 12 | 13 | 12 | 13 | 15 | 16 | 17 | .. | .. | .. | .. | .. |
| Girza | 50 | 45 | 50 | 55 | 60 | 60 | 50 | 50 | 40 | 30 | .. | .. | .. | .. | .. |
| Zumr | 10 | 10 | 10 | 10 | 6 | 6 | 7 | 12 | 14 | 15 | .. | .. | .. | .. | .. |
| Minor Canals | 2 | 2 | 2 | 2 | 2 | 2 | 2 | 2 | 2 | 2 | .. | .. | .. | .. | .. |
| Total left bank | 280 | 260 | 260 | 250 | 220 | 210 | 220 | 220 | 220 | 220 | .. | .. | .. | .. | .. |
| Ali bey | 16 | 20 | 27 | 28 | 15 | 12 | 15 | 17 | 20 | 20 | .. | .. | .. | .. | .. |
| Khassab | 20 | 20 | 20 | 22 | 19 | 15 | 19 | 15 | 15 | 18 | .. | .. | .. | .. | .. |
| Minor Canals | 6 | 6 | 6 | 6 | 7 | 7 | 7 | 7 | 7 | 7 | .. | .. | .. | .. | .. |
| Total right bank | 40 | 50 | 50 | 60 | 40 | 30 | 40 | 40 | 40 | 50 | .. | .. | .. | .. | .. |
| Total both banks | 320 | 310 | 310 | 310 | 260 | 240 | 260 | 260 | 260 | 270 | .. | .. | .. | .. | .. |
| Canal discharges between Assuan and Cairo. | |||||||||||||||
| Left bank | 1660 | 1690 | 1810 | 1760 | 1640 | 1650 | 1960 | 1760 | 1870 | 1810 | .. | .. | .. | .. | .. |
| Right bank | 380 | 450 | 480 | 470 | 430 | 430 | 470 | 430 | 410 | 370 | .. | .. | .. | .. | .. |
| Total | 2040 | 2140 | 2290 | 2230 | 2070 | 2080 | 2330 | 2190 | 2280 | 2180 | .. | .. | .. | .. | .. |
| Assuân gauge | 7.0 | 7.3 | 7.4 | 7.3 | 7.2 | 7.5 | 7.6 | 7.4 | 7.1 | 7.3 | 7.1 | 7.3 | 6.9 | 6.3 | 6.0 |
| Assiout gauge | 6.2 | 6.2 | 6.4 | 6.3 | 6.2 | 6.3 | 6.5 | 6.5 | 6.6 | 6.6 | 6.4 | 6.5 | 6.7 | 6.7 | .. |
| Cairo gauge | 5.8 | 5.6 | 5.9 | 6.0 | 6.0 | 5.8 | 6.0 | 6.0 | 6.1 | 6.3 | 6.2 | 6.1 | 6.4 | 6.5 | 2.7 |
[164]
| 1874. | |||||||||
| Date at Assuân. |
Gauges at Assuân. |
Discharges at Assuân. |
Water con- sumption Assuân to Cairo. |
Trough of Nile Assuân to Cairo. |
Discharge at Cairo. |
Gauges at Cairo. |
Date at Cairo. |
||
|---|---|---|---|---|---|---|---|---|---|
| August | 5 | 6·9 | 7600 | -1020 | -1000 | 5580 | 5·8 | 10th | August. |
| „ | 10 | 7·4 | 8600 | do | do | 6580 | 6·4 | 15th | „ |
| „ | 15 | 8·5 | 11500 | do | do | 9480 | 7·8 | 20th | „ |
| „ | 20 | 8·6 | 11800 | do | do | 9780 | 7·9 | 25th | „ |
| „ | 25 | 8·7 | 12100 | do | do | 10080 | 8·1 | 31st | „ |
| „ | 31 | 8·7 | 12100 | do | do | 10080 | 8·2 | 5th | September. |
| September | 5 | 9·0 | 12800 | do | do | 10780 | 8·3 | 10th | „ |
| „ | 10 | 8·8 | 11800 | do | 0 | 10780 | 8·4 | 15th | „ |
| „ | 15 | 8·7 | 11500 | do | +500 | 10980 | 8·5 | 20th | „ |
| „ | 20 | 8·4 | 10600 | do | do | 10080 | 8·2 | 25th | „ |
| „ | 25 | 8·4 | 10600 | do | do | 10080 | 8·2 | 30th | „ |
| „ | 30 | 8·2 | 10050 | do | do | 9430 | 7·9 | 5th | October. |
| October | 5 | 7·9 | 9300 | do | do | 8780 | 7·6 | 10th | „ |
| „ | 10 | 7·6 | 8600 | do | +700 | 8280 | 7·4 | 15th | „ |
| „ | 15 | 7·2 | 7800 | do | do | 7480 | 7·0 | 20th | „ |
| „ | 20 | 6·6 | 6600 | do | do | 6280 | 6·3 | 25th | „ |
| „ | 25 | 6·2 | 6000 | do | do | 5680 | 5·9 | 31st | „ |
| „ | 31 | 5·6 | 5100 | do | do | 4780 | 5·3 | 5th | November. |
| November | 5 | 5·2 | 4500 | do | do | 4780 | 4·3 | 10th | „ |
[165]
| 1877 | |||||||||
| Date at Assuân. |
Gauges at Assuân. |
Discharges at Assuân. |
Water con- sumption Assuân to Cairo. |
Trough of Nile Assuân to Cairo. |
Discharge at Cairo. |
Gauges at Cairo. |
Date at Cairo. |
||
|---|---|---|---|---|---|---|---|---|---|
| August | 5 | 4·8 | 4200 | - 800 | -300 | 3100 | 3·9 | 10th | August. |
| „ | 10 | 5·4 | 5100 | -1020 | do | 3780 | 4·6 | 15th | „ |
| „ | 15 | 5·8 | 5700 | do | do | 4380 | 5·0 | 20th | „ |
| „ | 20 | 6·4 | 6500 | do | do | 5180 | 5·5 | 25th | „ |
| „ | 25 | 6·1 | 5800 | do | do | 4480 | 5·1 | 31st | „ |
| „ | 31 | 6·2 | 6000 | do | do | 4680 | 5·2 | 5th | September. |
| September | 5 | 6·3 | 6200 | do | do | 4880 | 5·3 | 10th | „ |
| „ | 10 | 6·1 | 5800 | do | +200 | 4980 | 5·5 | 15th | „ |
| „ | 15 | 6·1 | 5700 | do | do | 4880 | 5·4 | 20th | „ |
| „ | 20 | 6·0 | 5700 | do | do | 4880 | 5·4 | 25th | „ |
| „ | 25 | 6·3 | 6200 | do | do | 5380 | 5·6 | 30th | „ |
| „ | 30 | 6·1 | 5800 | do | do | 4980 | 5·4 | 5th | October. |
| October | 5 | 5·6 | 5100 | do | do | 4280 | 5·0 | 10th | „ |
| „ | 10 | 5·2 | 4500 | do | do | 3680 | 4·6 | 15th | „ |
| „ | 15 | 4·9 | 4200 | -950 | do | 3450 | 4·4 | 20th | „ |
| „ | 20 | 4·6 | 3800 | -900 | do | 3100 | 4·0 | 25th | „ |
| „ | 25 | 4·5 | 3600 | -850 | do | 2950 | 3·9 | 31st | „ |
| „ | 31 | 4·0 | 3100 | -800 | do | 2500 | 3·5 | 5th | November. |
| November | 5 | 3·7 | 2800 | -700 | do | 2300 | 3·3 | 10th | „ |
[166]
| 1878 | |||||||||
| Date at Assuân. |
Gauges at Assuân. |
Discharges at Assuân. |
Water con- sumption Assuân to Cairo. |
Trough of Nile Assuân to Cairo. |
Discharge at Cairo. |
Gauges at Cairo. |
Date at Cairo. |
||
|---|---|---|---|---|---|---|---|---|---|
| August | 5 | 5·6 | 5400 | -1020 | -800 | 3580 | 4·4 | 10th | August. |
| „ | 10 | 5·3 | 6500 | do | do | 4680 | 5·2 | 15th | „ |
| „ | 15 | 7·2 | 8200 | do | do | 6380 | 6·3 | 20th | „ |
| „ | 20 | 7·5 | 8600 | do | do | 6780 | 6·5 | 25th | „ |
| „ | 25 | 8·1 | 10000 | do | do | 8180 | 7·3 | 31st | „ |
| „ | 31 | 7·6 | 8800 | do | +800 | 8580 | 7·5 | 5th | September. |
| September | 5 | 8·1 | 10300 | do | -600 | 8580 | 7·5 | 10th | „ |
| „ | 10 | 8·5 | 11500 | do | do | 9880 | 8·0 | 15th | „ |
| „ | 15 | 8·9 | 12800 | do | do | 11180 | 8·5 | 20th | „ |
| „ | 20 | 8·9 | 12500 | do | do | 10880 | 8·4 | 25th | „ |
| „ | 25 | 9·0 | 12800 | do | do | 11180 | 8·5 | 30th | „ |
| „ | 30 | 9·1 | 13200 | do | do | 11580 | 8·6 | 5th | October. |
| October | 5 | 8·9 | 12100 | do | +400 | 11480 | 8·6 | 10th | „ |
| „ | 10 | 8·5 | 10900 | do | +800 | 10680 | 8·4 | 15th | „ |
| „ | 15 | 7·9 | 9300 | do | do | 9080 | 8·0 | 20th | „ |
| „ | 20 | 7·6 | 8600 | do | do | 3380 | 7·4 | 25th | „ |
| „ | 25 | 7·4 | 8200 | do | do | 7980 | 7·2 | 31st | „ |
| „ | 31 | 6·8 | 7000 | do | do | 6780 | 6·6 | 5th | November. |
| November | 5 | 6·3 | 6200 | do | do | 5980 | 6·1 | 10th | „ |
[167]
| Months. | 1898 | 1899 | 1900 | 1901 | 1902 | 1903 | 1904 | ||||||||||||||
|---|---|---|---|---|---|---|---|---|---|---|---|---|---|---|---|---|---|---|---|---|---|
| Maxi- mum. |
Mini- mum. |
Mean. | Maxi- mum. |
Mini- mum. |
Mean. | Maxi- mum. |
Mini- mum. |
Mean. | Maxi- mum. |
Mini- mum. |
Mean. | Maxi- mum. |
Mini- mum. |
Mean. | Maxi- mum. |
Mini- mum. |
Mean. | Maxi- mum. |
Mini- mum. |
Mean. | |
| January | .. | .. | .. | 0·95 | 0·89 | 0·90 | 0·44 | 0·34 | 0·39 | 0·41 | 0·28 | 0·35 | 0·40 | 0·34 | 0·38 | 0·57 | 0·33 | 0·42 | .. | .. | .. |
| February | .. | .. | .. | 0·91 | 0·84 | 0·87 | 0·43 | 0·33 | 0·39 | 0·38 | 0·30 | 0·36 | 0·43 | 0·36 | 0·39 | 0·71 | 0·62 | 0·68 | .. | .. | .. |
| March | .. | .. | .. | 0·89 | 0·83 | 0·85 | 0·43 | 0·33 | 0·38 | 0·58 | 0·42 | 0·48 | 0·41 | 0·34 | 0·37 | 0·77 | 0·66 | 0·71 | .. | .. | .. |
| April | .. | .. | .. | 0·94 | 0·83 | 0·84 | 0·48 | 0·38 | 0·42 | 0·89 | 0·46 | 0·66 | 0·44 | 0·39 | 0·43 | 0·93 | 0·72 | 0·78 | .. | .. | .. |
| May | .. | .. | 1·05 | 1·05 | 0·85 | 0·94 | 0·48 | 0·42 | 0·45 | 0·95 | 0·81 | 0·89 | 0·60 | 0·44 | 0·54 | 1·10 | 0·84 | 1·00 | .. | .. | .. |
| June | .. | .. | 0·96 | 1·02 | 0·86 | 0·93 | 0·47 | 0·41 | 0·45 | 0·93 | 0·74 | 0·83 | 0·55 | 0·45 | 0·50 | 1·22 | 1·07 | 1·15 | .. | .. | .. |
| July | .. | .. | 0·99 | 0·91 | 0·79 | 0·86 | 0·46 | 0·44 | 0·45 | 0·76 | 0·61 | 0·68 | 0·46 | 0·41 | 0·44 | 1·37 | 1·17 | 1·24 | .. | .. | .. |
| August | .. | .. | 0·96 | 0·85 | 0·56 | 0·64 | 0·46 | 0·43 | 0·45 | 0·64 | 0·46 | 0·57 | 0·45 | 0·38 | 0·42 | 1·22 | 1·00 | 1·14 | .. | .. | .. |
| September | 0·99 | 0·93 | 0·95 | 0·56 | 0·43 | 0·48 | 0·43 | 0·30 | 0·38 | 0·51 | 0·27 | 0·39 | 0·41 | 0·37 | 0·39 | 1·03 | 0·95 | 0·98 | .. | .. | .. |
| October | 0·98 | 0·91 | 0·95 | 0·43 | 0·33 | 0·38 | 0·30 | 0·17 | 0·24 | 0·51 | 0·33 | 0·45 | 0·40 | 0·32 | 0·35 | 1·17 | 0·99 | 1·07 | .. | .. | .. |
| November | 0·99 | 0·91 | 0·95 | 0·36 | 0·33 | 0·35 | 0·19 | 0·11 | 0·16 | 0·36 | 0·29 | 0·33 | 0·41 | 0·33 | 0·37 | 1·27 | 1·05 | 1·16 | .. | .. | .. |
| December | 0·99 | 0·98 | 0·95 | 0·38 | 0·33 | 0·35 | 0·38 | 0·15 | 0·26 | 0·43 | 0·34 | 0·40 | 0·43 | 0·28 | 0·36 | 1·24 | 1·12 | 1·16 | .. | .. | .. |
| Mean. | .. | .. | .. | .. | .. | 0·70 | .. | .. | 0·37 | .. | .. | 0·53 | .. | .. | 0·41 | .. | .. | 0·96 | .. | .. | .. |
| Months. | 1898 | 1899 | 1900 | 1901 | ||||||||
|---|---|---|---|---|---|---|---|---|---|---|---|---|
| Maxi- mum. |
Mini- mum. |
Mean. | Maxi- mum. |
Mini- mum. |
Mean. | Maxi- mum. |
Mini- mum. |
Mean. | Maxi- mum. |
Mini- mum. |
Mean. | |
| January | .. | .. | .. | 0·95 | 0·89 | 0·90 | 0·44 | 0·34 | 0·39 | 0·41 | 0·28 | 0·35 |
| February | .. | .. | .. | 0·91 | 0·84 | 0·87 | 0·43 | 0·33 | 0·39 | 0·38 | 0·30 | 0·36 |
| March | .. | .. | .. | 0·89 | 0·83 | 0·85 | 0·43 | 0·33 | 0·38 | 0·58 | 0·42 | 0·48 |
| April | .. | .. | .. | 0·94 | 0·83 | 0·84 | 0·48 | 0·38 | 0·42 | 0·89 | 0·46 | 0·66 |
| May | .. | .. | 1·05 | 1·05 | 0·85 | 0·94 | 0·48 | 0·42 | 0·45 | 0·95 | 0·81 | 0·89 |
| June | .. | .. | 0·96 | 1·02 | 0·86 | 0·93 | 0·47 | 0·41 | 0·45 | 0·93 | 0·74 | 0·83 |
| July | .. | .. | 0·99 | 0·91 | 0·79 | 0·86 | 0·46 | 0·44 | 0·45 | 0·76 | 0·61 | 0·68 |
| August | .. | .. | 0·96 | 0·85 | 0·56 | 0·64 | 0·46 | 0·43 | 0·45 | 0·64 | 0·46 | 0·57 |
| September | 0·99 | 0·93 | 0·95 | 0·56 | 0·43 | 0·48 | 0·43 | 0·30 | 0·38 | 0·51 | 0·27 | 0·39 |
| October | 0·98 | 0·91 | 0·95 | 0·43 | 0·33 | 0·38 | 0·30 | 0·17 | 0·24 | 0·51 | 0·33 | 0·45 |
| November | 0·99 | 0·91 | 0·95 | 0·36 | 0·33 | 0·35 | 0·19 | 0·11 | 0·16 | 0·36 | 0·29 | 0·33 |
| December | 0·99 | 0·98 | 0·95 | 0·38 | 0·33 | 0·35 | 0·38 | 0·15 | 0·26 | 0·43 | 0·34 | 0·40 |
| Mean. | .. | .. | .. | .. | .. | 0·70 | .. | .. | 0·37 | .. | .. | 0·53 |
| Months. | 1902 | 1903 | 1904 | ||||||
|---|---|---|---|---|---|---|---|---|---|
| Maxi- mum. |
Mini- mum. |
Mean. | Maxi- mum. |
Mini- mum. |
Mean. | Maxi- mum. |
Mini- mum. |
Mean. | |
| January | 0·40 | 0·34 | 0·38 | 0·57 | 0·33 | 0·42 | .. | .. | .. |
| February | 0·43 | 0·36 | 0·39 | 0·71 | 0·62 | 0·68 | .. | .. | .. |
| March | 0·41 | 0·34 | 0·37 | 0·77 | 0·66 | 0·71 | .. | .. | .. |
| April | 0·44 | 0·39 | 0·43 | 0·93 | 0·72 | 0·78 | .. | .. | .. |
| May | 0·60 | 0·44 | 0·54 | 1·10 | 0·84 | 1·00 | .. | .. | .. |
| June | 0·55 | 0·45 | 0·50 | 1·22 | 1·07 | 1·15 | .. | .. | .. |
| July | 0·46 | 0·41 | 0·44 | 1·37 | 1·17 | 1·24 | .. | .. | .. |
| August | 0·45 | 0·38 | 0·42 | 1·22 | 1·00 | 1·14 | .. | .. | .. |
| September | 0·41 | 0·37 | 0·39 | 1·03 | 0·95 | 0·98 | .. | .. | .. |
| October | 0·40 | 0·32 | 0·35 | 1·17 | 0·99 | 1·07 | .. | .. | .. |
| November | 0·41 | 0·33 | 0·37 | 1·27 | 1·05 | 1·16 | .. | .. | .. |
| December | 0·43 | 0·28 | 0·36 | 1·24 | 1·12 | 1·16 | .. | .. | .. |
| Mean. | .. | .. | 0·41 | .. | .. | 0·96 | .. | .. | .. |
[168]
| Year. | Date. | Jan. | Feb. | Mar. | Apr. | May. | Jun. | Jul. | Aug. | Sep. | Oct. | Nov. | Dec. |
|---|---|---|---|---|---|---|---|---|---|---|---|---|---|
| 1901 | 1 | .. | .. | .. | .. | .. | .. | .. | .. | .. | .. | .. | 0·74 |
| 5 | .. | .. | .. | .. | .. | .. | .. | .. | .. | .. | .. | 0·66 | |
| 10 | .. | .. | .. | .. | .. | .. | .. | .. | .. | .. | 0·69 | 0·66 | |
| 15 | .. | .. | .. | .. | .. | .. | .. | .. | .. | .. | 0·69 | 0·64 | |
| 20 | .. | .. | .. | .. | .. | .. | .. | .. | .. | .. | 0·67 | 0·62 | |
| 25 | .. | .. | .. | .. | .. | .. | .. | .. | .. | .. | 0·75 | 0·58 | |
| 30 | .. | .. | .. | .. | .. | .. | .. | .. | .. | .. | 0·74 | 0·58 | |
| Mean | .. | .. | .. | .. | .. | .. | .. | .. | .. | .. | 0·72 | 0·63 | |
| 1902 | 1 | 0·58 | 0·30 | 0·25 | 0·13 | 0·10 | 0·15 | 0·10 | 0·20 | 0·29 | 0·33 | 0·71 | 0·86 |
| 5 | 0·55 | 0·32 | 0·28 | 0·09 | 0·13 | 0·15 | 0·11 | 0·19 | 0·43 | 0·41 | 0·71 | 0·89 | |
| 10 | 0·53 | 0·27 | 0·25 | 0·09 | 0·14 | .. | 0·08 | 0·25 | 0·51 | 0·38 | 0·61 | 0·91 | |
| 15 | 0·43 | 0·22 | 0·18 | 0·08 | 0·16 | 0·10 | 0·18 | 0·18 | 0·33 | 0·52 | 0·81 | 0·86 | |
| 20 | 0·38 | 0·25 | 0·20 | 0·10 | 0·25 | 0·08 | 0·27 | 0·20 | 0·33 | 0·66 | 0·86 | 0·85 | |
| 25 | 0·36 | 0·28 | 0·20 | 0·11 | 0·23 | 0·13 | 0·20 | 0·33 | 0·30 | 0·51 | 0·75 | 0·82 | |
| 30 | 0·32 | .. | 0·13 | 0·10 | 0·18 | 0·10 | 0·19 | 0·28 | 0·33 | 0·65 | 0·86 | 0·76 | |
| Mean | 0·44 | 0·26 | 0·20 | 0·09 | 0·17 | 0·12 | 0·15 | 0·24 | 0·37 | 0·49 | 0·76 | 0·85 | |
| 1903 | 1 | 0·76 | 0·69 | 0·58 | 0·53 | 0·53 | 0·56 | 1·02 | 1·07 | 1·07 | 1·60 | 1·70 | 1·93 |
| 5 | 0·76 | 0·69 | 0·61 | 0·51 | 0·56 | 0·61 | 0·84 | 1·12 | 1·07 | 1·60 | 1·70 | 1·93 | |
| 10 | 0·76 | 0·67 | 0·57 | 0·53 | 0·56 | 0·76 | 0·89 | 1·07 | 1·12 | 1·60 | 1·83 | 1·93 | |
| 15 | 0·74 | 0·61 | 0·56 | 0·46 | 0·58 | 0·79 | 0·84 | 1·17 | 1·37 | 1·60 | 1·83 | 1·93 | |
| 20 | 0·74 | 0·63 | 0·55 | 0·51 | 0·66 | 0·79 | 0·89 | 1·14 | 1·45 | 1·57 | 1·88 | 1·93 | |
| 25 | 0·74 | 0·61 | 0·53 | 0·48 | 0·61 | 0·81 | 1·12 | 1·12 | 1·52 | 1·65 | 1·90 | 1·90 | |
| 30 | 0·76 | .. | 0·53 | 0·53 | 0·61 | 1·00 | 1·07 | 1·07 | 1·60 | 1·68 | 1·93 | 1·90 | |
| Mean | 0·75 | 0·64 | 0·56 | 0·50 | 0·59 | 0·77 | 0·95 | 1·12 | 1·32 | 1·63 | 1·84 | 1·92 | |
| 1904 | 1 | 1·90 | 1·90 | 1·70 | 1·70 | .. | 1·74 | .. | .. | .. | .. | .. | .. |
| 5 | 1·90 | 1·90 | 1·73 | 1·70 | .. | .. | .. | .. | .. | .. | .. | .. | |
| 10 | 1·90 | 1·87 | 1·69 | 1·70 | .. | .. | .. | .. | .. | .. | .. | .. | |
| 15 | 1·90 | 1·78 | 1·68 | 1·71 | .. | .. | .. | .. | .. | .. | .. | .. | |
| 20 | 1·90 | 1·73 | 1·68 | 1·71 | .. | .. | .. | .. | .. | .. | .. | .. | |
| 25 | 1·90 | 1·74 | 1·68 | 1·74 | .. | .. | .. | .. | .. | .. | .. | .. | |
| 30 | 1·90 | .. | 1·71 | 1·74 | .. | .. | .. | .. | .. | .. | .. | .. | |
| Mean | 1·90 | 1·80 | 1·69 | 1·71 | .. | .. | .. | .. | .. | .. | .. | .. |
[169-
172]
| 1901 | |||||||||
| Date. | Month. | Date. | May. | June. | July. | Au- gust. |
Sep- tem- ber. |
Date. | Month. |
|---|---|---|---|---|---|---|---|---|---|
| Jan. | Oct. | ||||||||
| 1 | ·22 | 1 | 0·34 | 0·44 | 0·33 | 0·34 | 0·63 | 1 | 0·41 |
| 5 | ·20 | 2 | 0·34 | 0·42 | 0·33 | 0·34 | 0·63 | 5 | 0·39 |
| 10 | ·18 | 3 | 0·38 | 0·43 | 0·32 | 0·35 | 0·64 | 10 | 0·51 |
| 15 | ·17 | 4 | 0·40 | 0·43 | 0·33 | 0·34 | 0·63 | 15 | 0·60 |
| 20 | ·12 | 5 | 0·71 | 0·45 | 0·33 | 0·43 | 0·63 | 20 | 0·71 |
| 25 | ·12 | 6 | 0·56 | 0·43 | 0·60 | 0·54 | 0·69 | 25 | 0·67 |
| 30 | ·12 | 7 | 0·52 | 0·41 | 0·47 | 0·44 | 0·63 | 30 | 0·69 |
| Mean | ·15 | 8 | 0·46 | 0·41 | 0·37 | 0·47 | 0·67 | Mean | 0·60 |
| Feb. | 9 | 0·42 | 0·41 | 0·59 | 0·64 | 0·67 | Nov. | ||
| 1 | ·12 | 10 | 0·42 | 0·41 | 0·39 | 0·63 | 0·67 | 1 | 0·64 |
| 5 | ·12 | 11 | 0·42 | 0·41 | 0·35 | 0·62 | 0·65 | 5 | 0·67 |
| 10 | ·12 | 12 | 0·56 | 0·41 | 0·34 | 0·46 | 0·66 | 10 | 0·64 |
| 15 | ·11 | 13 | 0·38 | 0·40 | 0·34 | 0·41 | 0·63 | 15 | 0·49 |
| 20 | ·10 | 14 | 0·38 | 0·40 | 0·56 | 0·48 | 0·63 | 20 | 0·57 |
| 25 | ·10 | 15 | 0·40 | 0·40 | 0·52 | 0·46 | 0·56 | 25 | 0·59 |
| 28 | ·09 | 16 | 0·36 | 0·40 | 0·56 | 0·48 | 0·47 | 30 | 0·60 |
| Mean | ·11 | 17 | 0·34 | 0·40 | 0·61 | 1·09 | 0·43 | Mean | 0·61 |
| March | 18 | 0·36 | 0·40 | 0·43 | 1·09 | 0·41 | Dec. | ||
| 1 | ·11 | 19 | 0·34 | 0·40 | 0·35 | 0·62 | 0·39 | 1 | 0·61 |
| 5 | ·10 | 20 | 0·34 | 0·40 | 0·35 | 0·46 | 0·36 | 5 | 0·59 |
| 10 | ·10 | 21 | 0·36 | 0·40 | 0·36 | 0·44 | 0·43 | 10 | 0·57 |
| 15 | ·12 | 22 | 0·46 | 0·40 | 0·34 | 0·72 | 0·45 | 15 | 0·53 |
| 20 | ·26 | 23 | 0·40 | 0·40 | 0·34 | 0·52 | 0·49 | 20 | 0·49 |
| 25 | ·22 | 24 | 0·40 | 0·40 | 0·35 | 0·54 | 0·45 | 25 | 0·47 |
| 30 | ·27 | 25 | 0·42 | 0·36 | 0·34 | 0·43 | 0·45 | 30 | 0·45 |
| Mean | ·18 | 26 | 0·52 | 0·42 | 0·36 | 1·24 | 0·43 | Mean | 0·52 |
| April | 27 | 0·42 | 0·54 | 0·35 | 0·67 | 0·41 | |||
| 1 | 0·08 | 28 | 0·46 | 0·40 | 0·35 | 0·66 | 0·39 | ||
| 5 | 0·08 | 29 | 0·46 | 0·34 | 0·35 | 0·62 | 0·41 | ||
| 10 | 0·14 | 30 | 0·46 | 0·34 | 0·35 | .. | 0·41 | ||
| 15 | 0·32 | 31 | 0·46 | .. | 0·35 | .. | .. | ||
| 20 | 0·44 | Mean | 0·43 | 0·40 | 0·40 | 0·57 | 0·53 | ||
| 25 | 0·42 | ||||||||
| 30 | 0·30 | ||||||||
| Mean | 0·25 | ||||||||
| 1902 | |||||||||
| Date. | Month. | Date. | May. | June. | July. | Au- gust. |
Sep- tem- ber. |
Date. | Month. |
| Jan. | Oct. | ||||||||
| 1 | 0·45 | 1 | 0·19 | 0·06 | -0·01 | 0·44 | 0·54 | 1 | 0·48 |
| 5 | 0·43 | 2 | 0·20 | 0·08 | 0·02 | 0·36 | 0·52 | 5 | 0·26 |
| 10 | 0·43 | 3 | 0·22 | 0·14 | 0·02 | 0·44 | 0·74 | 10 | 0·54 |
| 15 | 0·47 | 4 | 0·26 | 0·11 | 0·04 | 0·54 | 1·04 | 15 | 0·79 |
| 20 | 0·45 | 5 | 0·24 | 0·09 | 0·71 | 0·49 | 0·94 | 20 | 0·80 |
| 25 | 0·41 | 6 | 0·19 | 0·09 | 0·34 | 0·42 | 0·90 | 25 | 0·76 |
| 30 | 0·41 | 7 | 0·19 | -0·03 | 0·08 | 0·48 | 1·24 | 30 | 0·99 |
| Mean | 0·43 | 8 | 0·14 | 0·04 | 0·04 | 1·54 | 0·96 | Mean | 0·71 |
| Feb. | 9 | 0·16 | 0·09 | 0·04 | 1·09 | 0·84 | Nov. | ||
| 1 | 0·39 | 10 | 0·18 | 0·06 | -0·01 | 1·52 | 1·04 | 1 | 1·07 |
| 5 | 0·36 | 11 | 0·34 | 0·03 | -0·01 | 1·49 | 0·99 | 5 | 0·77 |
| 10 | 0·35 | 12 | 0·60 | 0·07 | 0·04 | 1·44 | 0·77 | 10 | 0·84 |
| 15 | 0·33 | 13 | 0·48 | 0·02 | 0·04 | 1·42 | 0·74 | 15 | — |
| 20 | 0·33 | 14 | 0·44 | -0·01 | 0·24 | 1·46 | 0·84 | 20 | 1·23 |
| 25 | 0·36 | 15 | 0·51 | -0·06 | 0·04 | 1·42 | 0·96 | 25 | 0·99 |
| 28 | 0·40 | 16 | 0·45 | -0·03 | 0·02 | 1·42 | 1·28 | 30 | 0·96 |
| Mean | 0·35 | 17 | 0·39 | -0·01 | -0·01 | 1·44 | 0·94 | Mean | 1·00 |
| March | 18 | 0·53 | -0·08 | -0·01 | 1·38 | 0·94 | Dec. | ||
| 1 | 0·34 | 19 | 0·57 | -0·06 | 0·09 | 1·32 | 0·84 | 1 | 0·94 |
| 5 | 0·36 | 20 | 0·64 | -0·03 | 0·12 | 1·38 | 0·89 | 5 | 0·94 |
| 10 | 0·38 | 21 | 0·46 | -0·06 | 0·40 | 1·46 | 0·82 | 10 | 0·92 |
| 15 | 0·46 | 22 | 0·39 | -0·09 | 0·87 | 1·52 | 0·76 | 15 | 0·89 |
| 20 | 0·50 | 23 | 0·30 | -0·14 | 0·48 | 1·62 | 0·62 | 20 | 0·85 |
| 25 | 0·34 | 24 | 0·27 | +0·04 | 0·30 | 1·74 | 0·64 | 25 | 0·81 |
| 30 | 0·26 | 25 | 0·24 | 0·01 | 0·26 | 1·52 | 0·91 | 30 | 0·74 |
| Mean | 0·40 | 26 | 0·19 | 0·02 | 0·24 | 0·54 | 0·66 | Mean | 0·87 |
| April | 27 | 0·16 | -0·06 | 0·22 | 0·94 | 0·62 | |||
| 1 | 0·14 | 28 | 0·14 | -0·04 | 0·22 | 0·74 | 0·54 | ||
| 5 | 0·13 | 29 | 0·11 | -0·01 | 0·46 | 0·70 | 0·54 | ||
| 10 | 0·04 | 30 | 0·07 | -0·02 | 0·54 | 0·57 | |||
| 15 | -0·01 | 31 | 0·04 | .. | 0·58 | 0·60 | .. | ||
| 20 | 0·19 | Mean | 0·30 | 0·01 | 0·19 | 1·09 | 0·82 | ||
| 25 | 0·05 | ||||||||
| 30 | 0·13 | ||||||||
| Mean | 0·07 | ||||||||
| 1903 | |||||||||
| Date. | Month. | Date. | May. | June. | July. | Au- gust. |
Sep- tem- ber. |
Date. | Month. |
| Jan. | Oct. | ||||||||
| 1 | 0·74 | 1 | 0·72 | 1·15 | 1·37 | 1·55 | 1·86 | 1 | 2·18 |
| 5 | 0·71 | 2 | 1·70 | 1·06 | 1·38 | 1·57 | 1·82 | 5 | 2·11 |
| 10 | 0·66 | 3 | 0·68 | 1·06 | 1·46 | 1·65 | 1·90 | 10 | 2·12 |
| 15 | 0·63 | 4 | 0·68 | 1·06 | 1·43 | 1·65 | 2·54 | 15 | 2·45 |
| 20 | 0·63 | 5 | 0·70 | 1·00 | 1·39 | 1·72 | 2·24 | 20 | 2·06 |
| 25 | 0·61 | 6 | 0·98 | 1·10 | 1·44 | 1·61 | 2·23 | 25 | 2·20 |
| 30 | 0·63 | 7 | 0·92 | 1·61 | 1·46 | 1·73 | 2·71 | 30 | 2·20 |
| Mean | 0·65 | 8 | 0·85 | 1·36 | 1·51 | 2·16 | 2·50 | Mean | 2·16 |
| Feb. | 9 | 0·89 | 1·35 | 1·49 | 2·08 | 2·33 | Nov. | ||
| 1 | 0·62 | 10 | 1·06 | 1·10 | 1·46 | 2·03 | 2·29 | 1 | 2·20 |
| 5 | 0·61 | 11 | 0·80 | 1·07 | 1·41 | 2·50 | 2·24 | 5 | 2·13 |
| 10 | 0·63 | 12 | 1·42 | 1·06 | 1·45 | 2·03 | 2·16 | 10 | 2·05 |
| 15 | 0·58 | 13 | 1·48 | 1·09 | 1·56 | 2·07 | 2·09 | 15 | 1·92 |
| 20 | 0·59 | 14 | 0·85 | 1·08 | 1·49 | 1·86 | 2·07 | 20 | 1·91 |
| 25 | 0·56 | 15 | 0·85 | 1·06 | 1·35 | 2·12 | 2·20 | 25 | 1·90 |
| 28 | 0·53 | 16 | 0·89 | 1·55 | 1·40 | 1·99 | 2·23 | 30 | 1·77 |
| Mean | 0·59 | 17 | 0·86 | 1·47 | 1·35 | 1·90 | 2·37 | Mean | 1·96 |
| March | 18 | 0·85 | 1·44 | 1·40 | 1·93 | 2·48 | Dec. | ||
| 1 | 0·51 | 19 | 0·85 | 1·40 | 1·40 | 1·86 | 2·57 | 1 | 1·77 |
| 5 | 0·51 | 20 | 0·86 | 1·44 | 1·40 | 1·85 | 2·70 | 5 | 0·89 |
| 10 | 0·51 | 21 | 0·86 | 1·40 | 1·41 | 1·90 | 2·76 | 10 | 0·86 |
| 15 | 0·51 | 22 | 1·35 | 1·52 | 1·52 | 1·95 | 2·76 | 15 | 0·81 |
| 20 | 0·52 | 23 | 1·52 | 1·40 | 1·61 | 1·86 | 2·96 | 20 | 0·79 |
| 25 | 0·51 | 24 | 1·02 | 1·40 | 1·52 | 1·82 | 2·96 | 25 | 0·79 |
| 30 | 0·50 | 25 | 1·00 | 1·37 | 1·55 | 1·83 | 2·58 | 30 | 0·76 |
| Mean | 0·51 | 26 | 0·97 | 1·27 | 1·56 | 2·20 | 2·45 | Mean | 0·88 |
| April. | 27 | 1·03 | 1·30 | 1·67 | 2·16 | 2·33 | |||
| 1 | 0·50 | 28 | 1·00 | 1·32 | 1·61 | 2·07 | 2·23 | ||
| 5 | 0·48 | 29 | 0·90 | 1·43 | 1·65 | 1·82 | 2·20 | ||
| 10 | 0·48 | 30 | 0·89 | 1·35 | 1·63 | 1·88 | 2·18 | ||
| 15 | 0·55 | 31 | 0·91 | .. | 1·52 | 1·90 | .. | ||
| 20 | 0·57 | Mean | 0·95 | 1·27 | 1·48 | 1·91 | 2·36 | ||
| 25 | 0·57 | ||||||||
| 30 | 0·64 | ||||||||
| Mean | 0·53 | ||||||||
| 1904 | |||||||||
| Date. | Month. | Date. | May. | June. | |||||
| Jan. | |||||||||
| 1 | 0·79 | 1 | 0·68 | 0·90 | |||||
| 5 | 0·78 | 2 | 0·68 | 0·90 | |||||
| 10 | 0·78 | 3 | 0·70 | 0·90 | |||||
| 15 | 0·76 | 4 | 0·70 | 0·90 | |||||
| 20 | 0·84 | 5 | 0·70 | 0·90 | |||||
| 25 | 0·84 | 6 | 0·70 | 0·88 | |||||
| 30 | 0·82 | 7 | 0·68 | 0·84 | |||||
| Mean. | 0·80 | 8 | 0·68 | 0·80 | |||||
| Feb. | 9 | 0·68 | 0·76 | ||||||
| 1 | 0·82 | 10 | 0·68 | 0·76 | |||||
| 5 | 0·80 | 11 | 0·78 | 0·74 | |||||
| 10 | 0·74 | 12 | 0·78 | 0·72 | |||||
| 15 | 0·72 | 13 | 0·84 | 0·74 | |||||
| 20 | 0·70 | 14 | 0·84 | 0·72 | |||||
| 25 | 0·68 | 15 | 0·80 | 0·72 | |||||
| 28 | 0·74 | 16 | 0·80 | 0·70 | |||||
| Mean. | 0·73 | 17 | 0·76 | 0·70 | |||||
| March | 18 | 0·78 | 0·70 | ||||||
| 1 | 0·68 | 19 | 0·80 | 0·74 | |||||
| 5 | 0·70 | 20 | 0·80 | 0·82 | |||||
| 10 | 0·66 | 21 | 0·84 | 0·70 | |||||
| 15 | 0·66 | 22 | 0·88 | 0·70 | |||||
| 20 | 0·66 | 23 | 0·88 | 0·74 | |||||
| 25 | 0·84 | 24 | 0·88 | 0·78 | |||||
| 30 | 0·90 | 25 | 1·00 | 0·74 | |||||
| Mean. | 0·71 | 26 | 0·88 | 0·88 | |||||
| April. | 27 | 0·84 | 0·78 | ||||||
| 1 | 0·74 | 28 | 0·84 | 0·84 | |||||
| 5 | 0·72 | 29 | 0·84 | 0·82 | |||||
| 10 | 0·72 | 30 | 0·90 | 0·88 | |||||
| 15 | 0·80 | 31 | .. | .. | |||||
| 20 | 0·84 | Mean. | 0·79 | 0·79 | |||||
| 25 | 0·74 | ||||||||
| 30 | .. | ||||||||
| Mean. | 0·77 | ||||||||
[173-
174]
| 1903 | |||||||||
| Date. | Month. | Date. | May. | June. | July. | Au- gust. |
Sep- tem- ber. |
Date. | Month. |
|---|---|---|---|---|---|---|---|---|---|
| January. | October. | ||||||||
| 1 | 1 | 1·65 | 1·93 | 2·19 | 2·52 | 1 | 2·83 | ||
| 5 | 2 | 1·47 | 1·89 | 2·50 | 2·45 | 5 | 2·83 | ||
| 10 | 3 | 1·47 | 1·79 | 2·34 | 2·58 | 10 | 2·81 | ||
| 15 | 4 | 1·51 | 1·86 | 2·30 | 2·73 | 15 | 2·91 | ||
| 20 | 5 | 1·75 | 1·91 | 2·28 | 2·85 | 20 | 2·80 | ||
| 25 | 6 | 1·96 | 1·86 | 2·21 | 2·90 | 25 | 2·80 | ||
| 30 | 7 | 1·75 | 1·82 | 2·14 | 3·02 | 30 | 2·87 | ||
| Mean. | 8 | 1·91 | 1·75 | 2·12 | 3·16 | Mean. | 2·83 | ||
| February. | 9 | 1·89 | 1·84 | 2·59 | 3·14 | Nov. | |||
| 1 | 10 | 1·89 | 1·84 | 2·63 | 3·08 | 1 | 2·84 | ||
| 5 | 11 | 1·58 | 1·82 | 2·73 | 2·90 | 5 | 2·81 | ||
| 10 | 12 | 1·58 | 1·75 | 2·73 | 2·84 | 10 | 2·81 | ||
| 15 | 13 | 1·61 | 1·75 | 2·68 | 2·82 | 15 | 2·79 | ||
| 20 | 14 | 1·61 | 1·93 | 2·66 | 2·82 | 20 | 2·66 | ||
| 25 | 15 | 1·98 | 1·86 | 2·63 | 2·82 | 25 | 2·35 | ||
| 28 | 16 | 1·98 | 1·86 | 2·52 | 2·84 | 30 | 2·27 | ||
| Mean. | 17 | 2·10 | 1·89 | 2·56 | 2·92 | Mean. | 2·64 | ||
| March. | 18 | 2·10 | 1·82 | 2·56 | 3·06 | Dec. | |||
| 1 | 19 | 2·10 | 1·96 | 2·63 | 3·12 | 1 | 2·26 | ||
| 5 | 20 | 1·82 | 1·93 | 2·63 | 3·18 | 5 | 2·21 | ||
| 10 | 21 | 1·95 | 2·00 | 2·59 | 3·30 | 10 | 2·17 | ||
| 15 | 22 | 1·89 | 2·00 | 2·65 | 3·40 | 15 | 2·14 | ||
| 20 | 23 | 1·86 | 2·05 | 2·66 | 3·52 | 20 | 2·10 | ||
| 25 | 24 | 1·82 | 2·05 | 2·63 | 3·54 | 25 | 2·03 | ||
| 30 | 25 | 1·75 | 2·07 | 2·61 | 3·42 | 30 | 2·02 | ||
| Mean. | 26 | 1·72 | 2·07 | 2·49 | 3·32 | Mean. | 2·13 | ||
| April. | |||||||||
| 1 | 0·83 | 27 | 1·75 | 2·12 | 2·52 | 3·18 | |||
| 5 | 0·87 | 28 | 1·68 | 2·13 | 2·52 | 3·05 | |||
| 10 | 0·90 | 29 | 1·89 | 2·16 | .. | 3·00 | |||
| 15 | 0·89 | 30 | 1·93 | 2·21 | .. | 2·92 | |||
| 20 | 0·96 | 31 | .. | 2·21 | |||||
| 25 | 1·14 | Mean. | 1·82 | 1·96 | 2·49 | 2·97 | |||
| 30 | 0·99 | ||||||||
| Mean. | 0·92 | ||||||||
| 1904 | |||||||||
| Date. | Month. | Date. | May. | June. | July. | Au- gust. |
Sep- tem- ber. |
Date. | Month. |
| January. | October. | ||||||||
| 1 | 2·03 | 1 | 1·91 | 2·17 | |||||
| 5 | 2·00 | 2 | 1·89 | 2·24 | |||||
| 10 | 1·98 | 3 | 1·89 | 2·17 | |||||
| 15 | 1·97 | 4 | 1·89 | 2·21 | |||||
| 20 | 1·96 | 5 | 1·89 | 2·17 | |||||
| 25 | 1·92 | 6 | 1·96 | 2·17 | |||||
| 30 | 1·91 | 7 | 1·89 | 2·14 | |||||
| Mean. | 1·97 | 8 | 1·89 | 2·10 | |||||
| February. | 9 | 1·89 | 2·07 | ||||||
| 1 | 1·91 | 10 | 1·89 | 2·03 | |||||
| 5 | 1·89 | 11 | 1·96 | 2·00 | |||||
| 10 | 1·86 | 12 | 2·03 | 2·00 | |||||
| 15 | 1·82 | 13 | 2·10 | 2·00 | |||||
| 20 | 1·82 | 14 | 2·03 | 2·00 | |||||
| 25 | 1·82 | 15 | 2·07 | 2·00 | |||||
| 28 | 1·82 | 16 | 2·03 | 1·96 | |||||
| Mean. | 1·85 | 17 | 2·03 | 1·96 | |||||
| March. | 18 | 2·03 | 1·96 | ||||||
| 1 | 1·82 | 19 | 2·03 | 2·10 | |||||
| 5 | 1·81 | 20 | 2·07 | 2·03 | |||||
| 10 | 1·79 | 21 | 2·07 | 2·00 | |||||
| 15 | 1·82 | 22 | 2·17 | 1·98 | |||||
| 20 | 1·77 | 23 | 2·17 | 1·98 | |||||
| 25 | 1·79 | 24 | 2·17 | 2·00 | |||||
| 30 | 1·96 | 25 | 2·21 | 2·07 | |||||
| Mean. | 1·82 | 26 | 2·21 | 2·07 | |||||
| April. | |||||||||
| 1 | 1·93 | 27 | 2·17 | 2·10 | |||||
| 5 | 1·82 | 28 | 2·14 | 2·10 | |||||
| 10 | 1·82 | 29 | 2·12 | 2·07 | |||||
| 15 | 1·93 | 30 | 2·10 | 2·03 | |||||
| 20 | 2·07 | 31 | 2·21 | ||||||
| 25 | 1·96 | Mean. | 2·03 | 2·07 | |||||
| 30 | 1·89 | ||||||||
| Mean. | 1·91 | ||||||||
[175]
| Year. | Date. | Jan. | Feb. | Mar. | Apr. | May. | Jun. | Jul. | Aug. | Sep. | Oct. | Nov. | Dec. |
|---|---|---|---|---|---|---|---|---|---|---|---|---|---|
| 1903 | 1 | .. | .. | .. | .. | .. | .. | .. | .. | .. | .. | 6·30 | .. |
| 5 | .. | .. | .. | .. | .. | .. | .. | .. | .. | .. | 6·30 | .. | |
| 10 | .. | .. | .. | .. | .. | .. | .. | .. | .. | .. | 6·28 | .. | |
| 15 | .. | .. | .. | .. | .. | .. | .. | .. | .. | .. | 6·24 | .. | |
| 20 | .. | .. | .. | .. | .. | .. | .. | .. | .. | .. | 6·18 | .. | |
| 25 | .. | .. | .. | .. | .. | .. | .. | .. | .. | 6·46 | 6·14 | .. | |
| 30 | .. | .. | .. | .. | .. | .. | .. | .. | .. | 6·29 | .. | .. | |
| Mean | .. | .. | .. | .. | .. | .. | .. | .. | .. | .. | 6·23 | .. | |
| 1904 | 1 | 5·11 | 2·02 | 1·26 | 2·00 | 1·96 | 4·59 | .. | .. | .. | .. | .. | .. |
| 5 | 4·99 | 1·92 | 1·34 | 2·00 | 2·26 | 4·68 | .. | .. | .. | .. | .. | .. | |
| 10 | 4·49 | 1·82 | 1·40 | 1·82 | 2·88 | 4·82 | .. | .. | .. | .. | .. | .. | |
| 15 | 3·88 | 1·60 | 1·86 | 1·90 | 3·42 | 5·02 | .. | .. | .. | .. | .. | .. | |
| 20 | 2·92 | 1·50 | 2·14 | 2·38 | 4·10 | .. | .. | .. | .. | .. | .. | .. | |
| 25 | 2·24 | 1·36 | 1·88 | 2·38 | .. | .. | .. | .. | .. | .. | .. | .. | |
| 30 | 2·10 | .. | 2·00 | 2·00 | .. | .. | .. | .. | .. | .. | .. | .. | |
| Mean | 3·43 | 1·64 | 1·71 | 2·07 | .. | .. | .. | .. | .. | .. | .. | .. |
[176]
| Year. | Date. | Jan. | Feb. | Mar. | Apr. | May. | Jun. | Jul. | Aug. | Sep. | Oct. | Nov. | Dec. |
|---|---|---|---|---|---|---|---|---|---|---|---|---|---|
| 1903 | 1 | .. | .. | .. | .. | 0·00 | 1·11 | 1·71 | 2·30 | 2·80 | 3·26 | 3·48 | 3·52 |
| 5 | .. | .. | .. | .. | 0·09 | 1·22 | 1·80 | 2·39 | 2·86 | 3·27 | 3·48 | 3·52 | |
| 10 | .. | .. | .. | .. | 0·28 | 1·36 | 1·87 | 2·45 | 2·93 | 3·36 | 3·49 | 3·53 | |
| 15 | .. | .. | .. | .. | 0·40 | 1·53 | 1·95 | 2·52 | 3·05 | 3·42 | 3·49 | 3·54 | |
| 20 | .. | .. | .. | .. | 0·62 | 1·56 | 2·08 | 2·57 | 3·11 | 3·44 | 3·50 | 3·53 | |
| 25 | .. | .. | .. | .. | 0·81 | 1·65 | 2·18 | 2·70 | 3·16 | 3·45 | 3·50 | 3·51 | |
| 30 | .. | .. | .. | .. | 1·00 | 1·70 | 2·28 | 2·74 | 3·26 | 3·47 | 3·51 | 3·45 | |
| Mean | .. | .. | .. | .. | 0·47 | 1·46 | 1·99 | 2·54 | 3·03 | 3·40 | 3·49 | 3·51 | |
| 1904 | 1 | 3·42 | 1·92 | 0·93 | 0·88 | 0·81 | 1·56 | 2·00 | .. | .. | .. | .. | .. |
| 5 | 3·36 | 1·65 | 0·87 | 0·88 | 0·73 | 1·65 | .. | .. | .. | .. | .. | .. | |
| 10 | 3·19 | 1·42 | 0·88 | 0·86 | 0·86 | 1·67 | .. | .. | .. | .. | .. | .. | |
| 15 | 3·04 | 1·24 | 0·91 | 0·78 | 0·99 | 1·72 | .. | .. | .. | .. | .. | .. | |
| 20 | 2·74 | 1·12 | 0·97 | 0·81 | 1·21 | 1·83 | .. | .. | .. | .. | .. | .. | |
| 25 | 2·36 | 1·00 | 1·00 | 0·90 | 1·39 | 1·90 | .. | .. | .. | .. | .. | .. | |
| 30 | 2·01 | .. | 0·91 | 0·84 | 1·49 | 1·98 | .. | .. | .. | .. | .. | .. | |
| Mean | 2·77 | 1·30 | 0·92 | 0·85 | 1·08 | 1·76 | .. | .. | .. | .. | .. | .. |
[177]
| Year. | Date. | Jan. | Feb. | Mar. | Apr. | May. | Jun. | Jul. | Aug. | Sep. | Oct. | Nov. | Dec. |
|---|---|---|---|---|---|---|---|---|---|---|---|---|---|
| 1903 | 1 | .. | .. | .. | .. | 0·24 | 1·19 | 1·71 | 2·11 | 2·76 | 3·47 | 3·53 | 3·56 |
| 5 | .. | .. | .. | .. | 0·24 | 1·30 | 1·78 | 2·15 | 2·86 | 3·55 | 3·54 | 3·58 | |
| 10 | .. | .. | .. | .. | 0·34 | 1·42 | 1·88 | .. | 3·07 | 3·39 | 3·54 | 3·58 | |
| 15 | .. | .. | .. | .. | 0·53 | 1·51 | 1·89 | .. | 3·20 | 3·41 | 3·55 | 3·59 | |
| 20 | .. | .. | .. | 0·22 | 0·74 | 1·58 | 2·01 | .. | 3·26 | 3·46 | 3·56 | 3·59 | |
| 25 | .. | .. | .. | 0·24 | .. | 1·61 | 2·09 | .. | 3·37 | 3·50 | 3·55 | 3·58 | |
| 30 | .. | .. | .. | 0·24 | .. | 1·69 | 2·16 | .. | 3·46 | 3·52 | 3·56 | 3·57 | |
| Mean | .. | .. | .. | .. | .. | 1·48 | 1·94 | .. | 3·15 | 3·44 | 3·55 | 3·58 | |
| 1904 | 1 | 3·57 | 2·07 | 0·97 | 0·91 | 0·84 | 1·56 | .. | .. | .. | .. | .. | .. |
| 5 | 3·54 | 1·76 | 0·91 | 0·91 | 0·74 | 1·67 | .. | .. | .. | .. | .. | .. | |
| 10 | 3·48 | 1·48 | 0·92 | 0·89 | 0·86 | 1·69 | .. | .. | .. | .. | .. | .. | |
| 15 | 3·36 | 1·25 | 0·94 | 0·81 | 1·02 | 1·74 | .. | 2·79 | .. | .. | .. | .. | |
| 20 | 3·10 | 1·09 | 1·00 | 0·84 | 1·25 | 1·87 | .. | 2·87 | .. | .. | .. | .. | |
| 25 | 2·69 | 1·07 | 1·03 | 0·93 | 1·43 | 1·94 | .. | 2·92 | .. | .. | .. | .. | |
| 30 | 2·23 | .. | 0·97 | 0·84 | 1·53 | 2·02 | .. | 2·98 | .. | .. | .. | .. | |
| Mean | 3·16 | 1·37 | 0·96 | 0·88 | 1·11 | 1·79 | .. | .. | .. | .. | .. | .. |
[178]
| Year. | Date. | Jan. | Feb. | Mar. | Apr. | May. | Jun. | Jul. | Aug. | Sep. | Oct. | Nov. | Dec. |
|---|---|---|---|---|---|---|---|---|---|---|---|---|---|
| 1901 | 1 | .. | 0·91 | 0·66 | 0·43 | 0·61 | 0·59 | 1·43 | 2·88 | 4·10 | 3·40 | 2·40 | 2·12 |
| 5 | .. | 0·90 | 0·66 | 0·40 | 0·64 | 0·66 | 1·44 | 3·18 | 4·28 | 3·36 | 2·35 | 2·10 | |
| 10 | .. | 0·88 | 0·60 | 0·46 | 0·62 | 0·77 | 1·54 | 3·38 | 4·16 | 2·90 | 2·33 | 2·00 | |
| 15 | .. | 0·85 | 0·51 | 0·27 | 0·51 | 0·91 | 1·78 | 3·80 | 4·22 | 2·70 | 2·28 | 1·86 | |
| 20 | .. | 0·80 | 0·47 | 0·36 | 0·52 | 1·08 | 1·96 | 4·12 | 4·08 | 2·85 | 2·30 | 1·80 | |
| 25 | .. | 0·75 | 0·45 | 0·46 | 0·52 | 1·22 | 1·98 | 4·12 | 3·70 | 2·38 | 2·30 | 1·64 | |
| 30 | .. | 0·68 | 0·45 | 0·58 | 0·51 | 1·32 | 2·48 | 4·04 | 3·46 | 2·42 | 2·14 | 1·46 | |
| Mean | .. | 0·82 | 0·54 | 0·42 | 0·56 | 0·94 | 1·80 | 3·65 | 4·00 | 2·84 | 2·30 | 1·85 | |
| 1902 | 1 | 1·38 | 0·78 | 0·60 | 0·59 | 0·56 | 0·77 | 1·28 | 2·12 | 3·52 | 3·50 | 2·36 | .. |
| 5 | 1·24 | 0·74 | 0·58 | 0·62 | 0·52 | 0·81 | 1·40 | 2·20 | 3·49 | 3·48 | 2·26 | .. | |
| 10 | 1·16 | 0·73 | 0·51 | 0·58 | 0·49 | 0·95 | 1·48 | 2·55 | 3·62 | 3·36 | 2·20 | .. | |
| 15 | 1·07 | 0·66 | 0·54 | 0·58 | 0·54 | 1·04 | 1·60 | 2·82 | 3·72 | 3·00 | 2·14 | 2·02 | |
| 20 | 0·95 | 0·60 | 0·60 | 0·55 | 0·59 | 1·08 | 1·72 | 2·91 | 3·72 | 2·68 | 2·11 | 1·99 | |
| 25 | 0·90 | 0·60 | 0·66 | 0·61 | 0·66 | 1·14 | 1·89 | 3·17 | 3·58 | 2·57 | 2·00 | 2·01 | |
| 30 | 0·80 | 0·60 | 0·62 | 0·57 | 0·74 | 1·24 | 2·10 | 3·52 | 3·51 | 2·45 | 2·00 | 1·98 | |
| Mean | 1·07 | 0·67 | 0·59 | 0·58 | 0·58 | 1·00 | 1·64 | 2·75 | 3·60 | 3·00 | 2·15 | .. | |
| 1903 | 1 | 1·90 | 1·04 | 0·72 | 0·41 | 0·38 | 0·74 | 1·31 | 1·27 | 4·33 | 4·18 | 3·13 | 2·34 |
| 5 | 1·90 | 1·02 | 0·71 | 0·40 | 0·34 | 0·82 | 1·34 | 2·62 | 4·30 | 4·01 | 3·02 | 2·16 | |
| 10 | 1·75 | 0·99 | 0·64 | 0·42 | 0·33 | 0·98 | 1·54 | 3·18 | 4·48 | 3·82 | 2·82 | 1·96 | |
| 15 | 1·45 | 0·89 | 0·55 | 0·41 | 0·36 | 1·07 | 1·74 | 3·70 | 4·38 | 3·62 | 2·66 | 1·92 | |
| 20 | 1·39 | 0·88 | 0·48 | 0·38 | 0·41 | 1·20 | 1·80 | 3·84 | 4·18 | 3·36 | 2·56 | 1·84 | |
| 25 | 1·20 | 0·80 | 0·47 | 0·37 | 0·52 | 1·28 | 2·03 | 4·12 | 4·28 | 3·40 | 2·42 | 1·76 | |
| 30 | 1·06 | 0·77 | 0·42 | 0·37 | 0·61 | 1·33 | 2·24 | 4·22 | 4·22 | 3·41 | 2·36 | 1·70 | |
| Mean | 1·52 | 0·90 | 0·57 | 0·40 | 0·42 | 1·06 | 1·70 | 3·42 | 4·30 | 3·70 | 2·70 | 1·95 | |
| 1904 | 1 | 1·70 | 1·38 | 0·88 | 0·26 | 0·19 | 0·24 | 0·50 | 2·00 | 2·64 | .. | .. | .. |
| 5 | 1·66 | 1·32 | 0·66 | 0·30 | 0·18 | 0·30 | 0·51 | 2·90 | 2·80 | .. | .. | .. | |
| 10 | 1·62 | 1·28 | 0·50 | 0·28 | 0·16 | 0·40 | 0·70 | 3·40 | 3·00 | .. | .. | .. | |
| 15 | 1·60 | 1·20 | 0·35 | 0·25 | 0·15 | 0·41 | 0·95 | 3·15 | .. | .. | .. | .. | |
| 20 | 1·54 | 1·14 | 0·30 | 0·22 | 0·14 | 0·48 | 1·30 | 2·70 | .. | .. | .. | .. | |
| 25 | 1·46 | 1·00 | 0·28 | 0·21 | 0·22 | 0·49 | 1·55 | 2·45 | .. | .. | .. | .. | |
| 30 | 1·40 | 0·94 | 0·26 | 0·19 | 0·24 | 0·50 | 1·90 | 2·64 | .. | .. | .. | .. | |
| Mean | 1·57 | 1·18 | 0·46 | 0·24 | 0·18 | 0·40 | 1·06 | 2·75 | .. | .. | .. | .. |
[179-
182]
| 1901 | |||||||||
| Date. | Month. | Date. | May. | June. | July. | Au- gust. |
Sept. | Date. | Month. |
|---|---|---|---|---|---|---|---|---|---|
| January | .. | .. | .. | .. | .. | .. | October. | ||
| .. | .. | .. | .. | .. | .. | 1 | .. | ||
| .. | .. | .. | .. | .. | .. | 5 | .. | ||
| .. | .. | .. | .. | .. | .. | 10 | .. | ||
| .. | .. | .. | .. | .. | .. | 15 | .. | ||
| .. | .. | .. | .. | .. | .. | 20 | .. | ||
| .. | .. | .. | .. | .. | .. | 25 | .. | ||
| .. | .. | .. | .. | .. | .. | 30 | .. | ||
| .. | .. | .. | .. | .. | .. | Mean. | .. | ||
| February | .. | .. | .. | .. | .. | .. | Novemb. | ||
| .. | .. | .. | .. | .. | .. | 1 | 4·49 | ||
| .. | .. | .. | .. | .. | .. | 5 | 4·19 | ||
| .. | .. | .. | .. | .. | .. | 10 | 3·85 | ||
| .. | .. | .. | .. | .. | .. | 15 | 3·53 | ||
| .. | .. | .. | .. | .. | .. | 20 | 3·25 | ||
| .. | .. | .. | .. | .. | .. | 25 | 3·07 | ||
| .. | .. | .. | .. | .. | .. | 30 | 3·01 | ||
| .. | .. | .. | .. | .. | .. | Mean. | 3·58 | ||
| March | .. | .. | .. | .. | .. | .. | Decemb. | ||
| .. | .. | .. | .. | .. | .. | 1 | 2·89 | ||
| .. | .. | .. | .. | .. | .. | 5 | 2·67 | ||
| .. | .. | .. | .. | .. | .. | 10 | 2·47 | ||
| .. | .. | .. | .. | .. | .. | 15 | 2·33 | ||
| .. | .. | .. | .. | .. | .. | 20 | 2·19 | ||
| .. | .. | .. | .. | .. | .. | 25 | 2·05 | ||
| .. | .. | .. | .. | .. | .. | 30 | 1·91 | ||
| .. | .. | .. | .. | .. | .. | Mean. | 2·33 | ||
| April | .. | .. | .. | .. | .. | .. | |||
| 1902 | |||||||||
| Date. | Month. | Date. | May. | June. | July. | Au- gust. |
Sept. | Date. | Month. |
| January. | October. | ||||||||
| 1 | 1·89 | 1 | 0·39 | 1·59 | 3·80 | 7·56 | 9·62 | 1 | 9·94 |
| 5 | 1·81 | 2 | 0·33 | 2·11 | 3·80 | 7·86 | 10·12 | 5 | 9·30 |
| 10 | 1·69 | 3 | 0·33 | 2·11 | 3·70 | 7·94 | 10·42 | 10 | 8·00 |
| 15 | 1·61 | 4 | 0·37 | 2·07 | 3·80 | 8·32 | 10·32 | 15 | 7·38 |
| 20 | 1·55 | 5 | 0·39 | 2·03 | 4·16 | 8·42 | 10·30 | 20 | 7·08 |
| 25 | 1·49 | 6 | 0·41 | 1·97 | 4·46 | 8·56 | 10·10 | 25 | 6·68 |
| 30 | 1·39 | 7 | 0·39 | 1·91 | 4·68 | 8·76 | 10·40 | 30 | 6·14 |
| Mean. | 1·62 | 8 | 0·39 | 1·97 | 4·64 | 8·86 | 10·50 | Mean. | 7·65 |
| February. | 9 | 0·37 | 2·25 | 4·56 | 9·00 | 10·40 | Nov. | ||
| 1 | 1·37 | 10 | 0·35 | 2·15 | 4·38 | 9·10 | 10·40 | 1 | 5·90 |
| 5 | 1·31 | 11 | 0·41 | 2·00 | 4·48 | 9·14 | 10·28 | 5 | 5·66 |
| 10 | 1·21 | 12 | 0·48 | 1·77 | 4·28 | 9·16 | 10·60 | 10 | 5·24 |
| 15 | 1·13 | 13 | 0·51 | 1·67 | 4·56 | 9·14 | 10·70 | 15 | 4·94 |
| 20 | 1·07 | 14 | 0·61 | 1·61 | 4·70 | 9·02 | 10·48 | 20 | 4·74 |
| 25 | 1·03 | 15 | 0·77 | 1·65 | 4·86 | 8·96 | 10·28 | 25 | 4·60 |
| 28 | 0·99 | 16 | 0·89 | 1·99 | 4·80 | 8·66 | 10·32 | 30 | 4·28 |
| Mean. | 1·15 | 17 | 0·87 | 2·57 | 5·10 | 8·66 | 10·32 | Mean. | 5·02 |
| March. | 18 | 1·01 | 2·97 | 5·20 | 8·96 | 10·00 | Dec. | ||
| 1 | 0·98 | 19 | 0·95 | 3·27 | 5·40 | 9·48 | 10·30 | 1 | — |
| 5 | 0·91 | 20 | 0·93 | 3·39 | 5·48 | 10·08 | 10·26 | 5 | 4·00 |
| 10 | 0·79 | 21 | 0·71 | 3·39 | 5·42 | 10·00 | 10·00 | 10 | 3·73 |
| 15 | 0·87 | 22 | 0·61 | 3·19 | 5·66 | 9·66 | 9·80 | 15 | 3·54 |
| 20 | 1·01 | 23 | 0·65 | 3·04 | 5·70 | 9·46 | 9·80 | 20 | 3·40 |
| 25 | 0·84 | 24 | 0·61 | 2·94 | 5·66 | 9·52 | 10·00 | 25 | 3·18 |
| 30 | 0·67 | 25 | 0·57 | 3·04 | 5·76 | 9·92 | 10·10 | 30 | 2·94 |
| Mean. | 0·87 | 26 | 0·61 | 3·89 | 5·74 | 10·26 | 9·90 | Mean. | 3·51 |
| April. | |||||||||
| 1 | 0·63 | 27 | 0·65 | 4·29 | 5·72 | 10·46 | 9·95 | ||
| 5 | 0·55 | 28 | 0·71 | 4·24 | 6·36 | 10·52 | 10·00 | ||
| 10 | 0·43 | 29 | 0·91 | 4·24 | 6·79 | 10·32 | 10·26 | ||
| 15 | 0·43 | 30 | 0·11 | 4·28 | 7·06 | 10·02 | 10·26 | ||
| 20 | 0·51 | 31 | 0·21 | 7·28 | 9·72 | ||||
| 25 | 0·57 | Mean. | 0·56 | 2·65 | 5·09 | 9·21 | 10·20 | ||
| 30 | 0·41 | ||||||||
| Mean. | 0·50 | ||||||||
| 1903 | |||||||||
| Date. | Month. | Date. | May. | June. | July. | Au- gust. |
Sept. | Date. | Month. |
| January. | October. | ||||||||
| 1 | 2·88 | 1 | 0·96 | 3·15 | 4·71 | 7·75 | 11·02 | 1 | 9·48 |
| 5 | 2·70 | 2 | 0·96 | 3·25 | 5·27 | 9·11 | 10·68 | 5 | 8·84 |
| 10 | 2·56 | 3 | 0·94 | 3·85 | 5·61 | 9·81 | 10·44 | 10 | 8·42 |
| 15 | 2·46 | 4 | 0·92 | 4·05 | 5·81 | 10·11 | 10·40 | 15 | 7·94 |
| 20 | 2·36 | 5 | 0·90 | 3·61 | 5·85 | 10·11 | 10·50 | 20 | 8·84 |
| 25 | 2·26 | 6 | 0·88 | 3·65 | 6·10 | 10·07 | 10·64 | 25 | 8·25 |
| 30 | 2·16 | 7 | 0·88 | 3·49 | 6·23 | 10·21 | 10·56 | 30 | 7·33 |
| Mean. | 2·42 | 8 | 0·90 | 3·41 | 6·45 | 10·15 | 10·50 | Mean. | 8·41 |
| February. | 9 | 0·86 | 3·63 | 6·55 | 9·99 | 10·74 | Nov. | ||
| 1 | 2·12 | 10 | 0·82 | 3·79 | 6·57 | 9·89 | 10·52 | 1 | 7·19 |
| 5 | 2·04 | 11 | 0·84 | 3·90 | 6·81 | 10·19 | 10·46 | 5 | 6·68 |
| 10 | 2·00 | 12 | 0·86 | 4·20 | 7·03 | 10·59 | 10·40 | 10 | 6·12 |
| 15 | 1·90 | 13 | 0·88 | 4·30 | 7·13 | 10·71 | 10·06 | 15 | 5·70 |
| 20 | 1·84 | 14 | 0·92 | 4·42 | 6·77 | 10·57 | 9·96 | 20 | 5·55 |
| 25 | 1·72 | 15 | 0·98 | 4·64 | 6·74 | 10·32 | 9·92 | 25 | 5·14 |
| 28 | 1·70 | 16 | 1·02 | 4·82 | 6·57 | 10·49 | 9·94 | 30 | 4·96 |
| Mean. | 1·91 | 17 | 1·06 | 4·70 | 6·91 | 10·41 | 9·92 | Mean. | 5·83 |
| March. | 18 | 1·14 | 4·62 | 7·05 | 10·49 | 9·96 | Dec. | ||
| 1 | 1·68 | 19 | 1·26 | 4·52 | 7·05 | 10·49 | 10·12 | 1 | 4·92 |
| 5 | 1·60 | 20 | 1·40 | 4·32 | 7·39 | 10·73 | 10·32 | 5 | 4·80 |
| 10 | 1·52 | 21 | 1·66 | 4·30 | 8·01 | 10·71 | 10·42 | 10 | 4·54 |
| 15 | 1·44 | 22 | 1·76 | 4·28 | 7·97 | 10·71 | 10·56 | 15 | 4·40 |
| 20 | 1·34 | 23 | 1·92 | 4·28 | 7·81 | 10·47 | 10·52 | 20 | 4·10 |
| 25 | 1·32 | 24 | 2·06 | 4·25 | 7·87 | 10·39 | 10·46 | 25 | 3·84 |
| 30 | 1·30 | 25 | 2·20 | 4·51 | 7·75 | 10·39 | 10·32 | 30 | 3·60 |
| Mean. | 1·44 | 26 | 2·74 | 4·31 | 7·77 | 10·47 | 10·18 | Mean. | 4·28 |
| April. | 27 | 1·51 | 4·21 | 7·80 | 10·41 | 9·72 | |||
| 1 | 1·24 | 28 | 3·43 | 4·17 | 7·73 | 10·61 | 9·42 | ||
| 5 | 1·10 | 29 | 3·39 | 4·13 | 7·77 | 10·67 | 9·24 | ||
| 10 | 1·10 | 30 | 3·34 | 4·41 | 7·67 | 10·80 | 9·22 | ||
| 15 | 1·08 | 31 | 3·25 | 7·70 | 10·92 | ||||
| 20 | 1·04 | Mean. | 1·50 | 4·10 | 6·92 | 10·28 | 10·23 | ||
| 25 | 0·98 | ||||||||
| 30 | 0·98 | ||||||||
| Mean. | 1·06 | ||||||||
| 1904 | |||||||||
| Date. | Month. | Date. | May. | June. | July. | Au- gust. |
Sept. | ||
| January. | |||||||||
| 1 | 3·64 | 1 | 1·50 | 2·36 | 4·24 | 9·60 | 9·50 | ||
| 5 | 3·56 | 2 | 1·48 | 2·50 | 4·58 | 10·30 | 9·58 | ||
| 10 | 3·48 | 3 | 1·66 | 2·88 | 4·82 | 10·10 | 9·50 | ||
| 15 | 3·36 | 4 | 1·66 | 3·32 | 5·22 | 9·90 | 9·50 | ||
| 20 | 3·15 | 5 | 1·64 | 3·40 | 5·52 | 9·70 | 9·40 | ||
| 25 | 3·08 | 6 | 1·64 | 3·28 | 5·52 | 9·60 | 9·30 | ||
| 30 | 2·80 | 7 | 1·62 | 3·24 | 5·22 | 9·40 | 9·30 | ||
| Mean. | 3·28 | 8 | 1·64 | 3·08 | 4·92 | 9·50 | 9·20 | ||
| February. | 9 | 1·56 | 2·98 | 4·82 | 9·50 | 9·20 | |||
| 1 | 2·76 | 10 | 1·62 | 3·00 | 4·96 | 9·40 | 9·29 | ||
| 5 | 2·58 | 11 | 1·66 | 2·86 | 5·80 | 9·30 | 9·30 | ||
| 10 | 2·46 | 12 | 1·76 | 2·78 | 6·18 | 9·20 | 9·30 | ||
| 15 | 2·22 | 13 | 1·80 | 2·78 | 6·10 | 9·20 | 9·40 | ||
| 20 | 2·06 | 14 | 2·00 | 2·46 | 6·48 | 9·20 | 9·44 | ||
| 25 | 1·86 | 15 | 2·00 | 2·34 | 7·12 | 9·00 | |||
| 28 | 1·78 | 16 | 1·88 | 2·32 | 6·92 | 8·80 | |||
| Mean. | 2·23 | 17 | 1·88 | 2·30 | 6·90 | 8·80 | |||
| March. | 18 | 1·82 | 2·34 | 6·80 | 8·90 | ||||
| 1 | 1·72 | 19 | 1·64 | 2·34 | 6·70 | 8·96 | |||
| 5 | 1·70 | 20 | 1·70 | 2·34 | 6·80 | 9·10 | |||
| 10 | 1·64 | 21 | 1·72 | 2·50 | 7·10 | 9·00 | |||
| 15 | 1·50 | 22 | 1·72 | 2·42 | 7·30 | 9·10 | |||
| 20 | 1·44 | 23 | 1·68 | 2·48 | 7·20 | 9·20 | |||
| 25 | 1·70 | 24 | 1·76 | 2·52 | 7·40 | 9·10 | |||
| 30 | 1·80 | 25 | 1·98 | 2·54 | 7·50 | 9·30 | |||
| Mean. | 1·64 | 26 | 2·46 | 2·68 | 8·04 | 9·72 | |||
| April. | 27 | 2·50 | 2·80 | 8·22 | 9·50 | ||||
| 1 | 1·80 | 28 | 2·52 | 2·94 | 8·00 | 9·30 | |||
| 5 | 1·76 | 29 | 2·48 | — | 8·04 | 9·20 | |||
| 10 | 1·64 | 30 | 2·46 | 3·98 | 8·70 | 9·30 | |||
| 15 | 1·58 | 31 | 2·36 | 9·20 | 9·30 | ||||
| 20 | 1·50 | Mean. | 1·86 | 2·76 | 6·52 | 9·34 | |||
| 25 | 1·50 | ||||||||
| 30 | 1·50 | ||||||||
| Mean. | 1·60 | ||||||||
[183]
| Date | 1874 | 1877 | 1878 | |||||||||||||||
|---|---|---|---|---|---|---|---|---|---|---|---|---|---|---|---|---|---|---|
| May | June | July | Aug. | Sept. | Oct. | May | June | July | Aug. | Sept. | Oct. | May | June | July | Aug. | Sept. | Oct. | |
| 1 | .. | 1·01 | 2·50 | 5·60 | 7·18 | 6·66 | .. | ·97 | 2·81 | 5·20 | 4·97 | 4·30 | .. | ·02 | 2·63 | 4·30 | 6·46 | 7·20 |
| 2 | .. | 1·06 | 2·50 | 5·65 | 7·18 | 6·66 | .. | ·97 | 2·77 | 4·79 | 4·97 | 4·30 | .. | ·08 | 2·54 | 4·41 | 6·59 | 7·11 |
| 3 | .. | 1·22 | 2·50 | 5·78 | 7·22 | 6·55 | .. | ·97 | 2·68 | 4·79 | 4·84 | 4·25 | .. | ·61 | 2·50 | 4·70 | 6·64 | 7·18 |
| 4 | .. | 1·44 | 2·59 | 5·85 | 7·27 | 6·50 | .. | ·97 | 2·54 | 4·54 | 4·88 | 4·21 | .. | ·79 | 2·45 | 5·11 | 6·75 | 7·00 |
| 5 | .. | 1·55 | 2·68 | 6·01 | 7·27 | 6·41 | .. | ·97 | 2·54 | 4·43 | 4·88 | 4·21 | .. | 1·13 | 2·45 | 5·31 | 6·82 | 6·82 |
| 6 | .. | 1·60 | 2·68 | 6·14 | 7·20 | 6·30 | .. | ·92 | 2·68 | 4·43 | 4·88 | 4·21 | .. | 1·42 | 2·68 | 5·38 | 6·89 | 6·73 |
| 7 | .. | 1·60 | 2·75 | 6·23 | 7·13 | 6·26 | .. | 1·01 | 2·86 | 4·66 | 4·97 | 4·12 | .. | 1·49 | 2·77 | 5·51 | 6·98 | 6·68 |
| 8 | ·07 | 1·80 | 2·86 | 6·32 | 7·18 | 6·19 | .. | ·88 | 2·95 | 4·84 | 4·97 | 4·12 | .. | 1·55 | 2·95 | 5·51 | 6·95 | 6·64 |
| 9 | ·14 | 1·98 | 2·99 | 6·46 | 7·18 | 6·08 | .. | ·83 | 3·04 | 4·84 | 4·97 | 3·98 | .. | 1·89 | 2·97 | 5·51 | 7·04 | 6·59 |
| 10 | ·50 | 1·98 | 3·04 | 6·55 | 7·13 | 5·92 | ·02 | ·83 | 3·22 | 4·84 | 4·97 | 3·98 | ·05 | 1·62 | 2·97 | 5·51 | 7·09 | 6·55 |
| 11 | ·50 | 1·76 | 3·22 | 6·68 | 7·09 | 5·78 | ·02 | ·88 | 3·35 | 4·97 | 4·97 | 3·98 | ·05 | 1·62 | 3·04 | 5·85 | 7·16 | 6·64 |
| 12 | ·86 | 1·76 | 3·31 | 6·77 | 7·13 | 5·65 | ·02 | 1·24 | 3·35 | 5·06 | 5·00 | 3·98 | ·05 | 1·62 | 3·29 | 5·94 | 7·25 | 6·35 |
| 13 | ·97 | 1·76 | 3·22 | 6·84 | 7·22 | 5·65 | ·02 | 1·37 | 3·22 | 5·06 | 5·06 | 3·98 | ·05 | 1·64 | 3·44 | 6·03 | 7·25 | 6·30 |
| 14 | ·97 | 1·76 | 3·49 | 6·84 | 7·18 | 5·60 | ·02 | 1·37 | 3·22 | 5·06 | 5·06 | 3·87 | ·05 | 1·73 | 3·51 | 6·05 | 7·31 | 5·26 |
| 15 | ·99 | 1·80 | 3·80 | 6·91 | 7·09 | 5·51 | ·02 | 1·60 | 3·58 | 4·97 | 5·11 | 3·87 | ·05 | 1·80 | 3·51 | 6·12 | 7·31 | 6·19 |
| 16 | 1·04 | 1·85 | 4·03 | 7·04 | 7·04 | 5·44 | ·02 | 1·73 | 3·62 | 4·97 | 5·11 | .. | ·05 | 1·80 | 3·51 | 6·21 | 7·36 | 6·12 |
| 17 | 1·15 | 1·91 | 4·12 | 7·13 | 7·04 | 5·38 | ·02 | 2·05 | 3·67 | 4·97 | 5·06 | .. | ·05 | 1·78 | 3·51 | 6·21 | 7·40 | 6·08 |
| 18 | 1·28 | 1·91 | 4·25 | 7·04 | 7·04 | 5·31 | ·02 | 1·96 | 3·67 | 4·97 | 4·97 | .. | ·05 | 1·73 | 3·51 | 6·14 | 7·47 | 6·03 |
| 19 | 1·35 | 1·91 | 4·52 | 7·00 | 6·93 | 5·11 | ·02 | 1·87 | 3·89 | 4·97 | 4·97 | .. | ·05 | 1·69 | 3·76 | 6·08 | 7·47 | 5·96 |
| 20 | 1·58 | 1·91 | 4·61 | 7·04 | 6·89 | 4·97 | ·02 | 1·87 | 4·03 | 4·97 | 4·97 | .. | ·05 | 1·71 | 4·03 | 6·01 | 7·56 | 5·92 |
| 21 | 1·77 | 1·96 | 4·84 | 6·91 | 6·89 | 4·84 | ·11 | 1·87 | 4·12 | 4·93 | 4·97 | .. | ·05 | 1·80 | 4·07 | 6·01 | 7·58 | 5·78 |
| 22 | 1·60 | 1·96 | 4·88 | 7·00 | 6·82 | 4·70 | ·34 | 1·96 | 4·21 | 4·93 | 4·84 | .. | -·02 | 1·76 | 4·05 | 5·78 | 7·58 | 5·72 |
| 23 | 1·46 | 2·00 | 4·97 | 6·93 | 6·82 | 4·61 | ·38 | 2·05 | 4·30 | 5·02 | 4·84 | .. | 0·0 | 1·82 | 4·10 | 5·67 | 7·52 | 5·65 |
| 24 | 1·33 | 2·05 | 5·11 | 6·91 | 6·86 | 4·43 | ·68 | 2·27 | 4·12 | 5·02 | 4·79 | .. | 0·0 | 2·05 | 4·30 | 5·76 | 7·43 | 5·56 |
| 25 | 1·26 | 2·09 | 5·11 | 6·98 | 6·82 | 4·30 | ·90 | 2·27 | 4·12 | 5·02 | 4·75 | .. | ·14 | 2·21 | 4·30 | 5·92 | 7·43 | 5·46 |
| 26 | 1·19 | 2·18 | 5·31 | 7·00 | 6·82 | 4·21 | 1·01 | 2·14 | 4·12 | 5·15 | 4·70 | .. | ·11 | 2·25 | 4·21 | 5·92 | 7·43 | 5·38 |
| 27 | 1·19 | 2·36 | 5·42 | 7·00 | 6·73 | 4·10 | 1·19 | 2·14 | 4·21 | 5·15 | 4·66 | .. | ·05 | 2·27 | 4·21 | 5·94 | 7·38 | 5·49 |
| 28 | 1·19 | 2·41 | 5·51 | 7·00 | 6·66 | 4·10 | 1·33 | 2·14 | 4·43 | 5·15 | 4·57 | .. | -·02 | 2·41 | 4·21 | 6·14 | 7·38 | 5·24 |
| 29 | 1·08 | 2·41 | 5·51 | 7·13 | 6·66 | 4·10 | 1·28 | 2·41 | 4·61 | 5·24 | 4·57 | .. | ·05 | 2·50 | 4·23 | 6·14 | 7·38 | 5·20 |
| 30 | 1·01 | 2·41 | 5·51 | 7·09 | 6·66 | 4·10 | 1·19 | 2·72 | 4·70 | 5·24 | 4·39 | .. | ·02 | 2·61 | 4·30 | 6·32 | 7·27 | .. |
| 31 | 1·01 | .. | 5·56 | 7·13 | .. | 4·10 | 1·06 | .. | 4·77 | 5·06 | .. | .. | ·02 | .. | 4·30 | 6·44 | .. | .. |
| Mean | .. | 1·85 | 3·98 | 6·67 | 7·01 | 5·34 | .. | 1·54 | 3·60 | 4·95 | 4·89 | .. | .. | 1·62 | 3·49 | 5·74 | 6·87 | 6·16 |
[184-
187]
| 1901 | |||||||||
| Date. | Month. | Date. | May. | June. | July. | Au- gust. |
Sept. | Date. | Month. |
|---|---|---|---|---|---|---|---|---|---|
| January. | October. | ||||||||
| 1 | 1·51 | 1 | 0·45 | 0·47 | 2·35 | 4·90 | 6·10 | 1 | 4·36 |
| 5 | 1·44 | 2 | 0·48 | 0·50 | 2·58 | 4·96 | 6·10 | 5 | 4·04 |
| 10 | 1·30 | 3 | 0·46 | 0·60 | 2·75 | 5·00 | 6·05 | 10 | 3·60 |
| 15 | 1·17 | 4 | 0·42 | 0·64 | 2·70 | 5·05 | 5·08 | 15 | 3·44 |
| 20 | 1·05 | 5 | 0·42 | 0·81 | 2·57 | 5·05 | 6·08 | 20 | 3·28 |
| 25 | 0·93 | 6 | 0·42 | 0·82 | 2·60 | 5·12 | 5·94 | 25 | 3·12 |
| 30 | 0·84 | 7 | 0·40 | 0·85 | 2·60 | 5·28 | 5·88 | 30 | 2·91 |
| Mean. | 1·15 | 8 | 0·39 | 0·84 | 2·70 | 5·40 | 5·91 | Mean. | 3·48 |
| February. | 9 | 0·37 | 0·80 | 2·82 | 5·47 | 5·95 | Novem. | ||
| 1 | 0·84 | 10 | 0·34 | 0·77 | 2·90 | 5·55 | 5·98 | 1 | 2·83 |
| 5 | 0·81 | 11 | 0·34 | 0·98 | 2·92 | 5·45 | 5·92 | 5 | 2·67 |
| 10 | 0·73 | 12 | 0·32 | 1·28 | 2·97 | 5·40 | 5·98 | 10 | 2·43 |
| 15 | 0·67 | 13 | 0·37 | 1·39 | 3·00 | 5·56 | 5·98 | 15 | 2·28 |
| 20 | 0·60 | 14 | 0·25 | 1·51 | 3·08 | 5·70 | 6·00 | 20 | 2·16 |
| 25 | 0·45 | 15 | 0·25 | 1·70 | 3·17 | 5·85 | 5·96 | 25 | 2·00 |
| 28 | 0·44 | 16 | 0·25 | 1·60 | 3·30 | 5·89 | 5·93 | 30 | 1·87 |
| Mean. | 0·66 | 17 | 0·19 | 1·49 | 3·30 | 5·96 | 5·82 | Mean. | 2·29 |
| March | 18 | 0·08 | 1·47 | 3·38 | 5·96 | 5·74 | Decem. | ||
| 1 | 0·43 | 19 | 0·08 | 1·50 | 3·43 | 5·96 | 5·56 | 1 | 1·87 |
| 5 | 0·39 | 20 | 0·14 | 1·55 | 3·50 | 6·10 | 5·40 | 5 | 1·83 |
| 10 | 0·28 | 21 | 0·19 | 1·63 | 3·50 | 6·05 | 5·18 | 10 | 1·75 |
| 15 | 0·20 | 22 | 0·22 | 1·80 | 3·57 | 5·98 | 5·18 | 15 | 1·58 |
| 20 | 0·15 | 23 | 0·12 | 2·05 | 3·54 | 6·01 | 5·10 | 20 | 1·50 |
| 25 | 0·09 | 24 | 0·15 | 2·26 | 3·54 | 6·05 | 5·00 | 25 | 1·35 |
| 30 | 0·08 | 25 | 0·20 | 2·20 | 3·58 | 5·97 | 4·89 | 30 | 1·16 |
| Mean. | 0·22 | 26 | 0·18 | 2·00 | 3·74 | 5·80 | 4·84 | Mean. | 1·56 |
| April | 27 | 0·25 | 1·95 | 4·10 | 5·68 | 4·78 | |||
| 1 | 0·06 | 28 | 0·27 | 1·98 | 4·28 | 5·68 | 4·70 | ||
| 5 | 0·05 | 29 | 0·34 | 1·98 | 4·65 | 5·85 | 4·58 | ||
| 10 | -0·05 | 30 | 0·45 | 2·10 | 4·83 | 5·89 | 4·49 | ||
| 15 | -0·07 | 31 | 0·45 | .. | 4·85 | 6·03 | .. | ||
| 20 | 0·11 | Mean. | 0·30 | 1·38 | 3·32 | 5·63 | 5·57 | ||
| 25 | 0·27 | ||||||||
| 30 | .. | ||||||||
| Mean. | 0·09 | ||||||||
| 1902 | |||||||||
| Date. | Month. | Date. | May. | June. | July. | Au- gust. |
Sept. | Date. | Month. |
| January. | October. | ||||||||
| 1 | 1·13 | 1 | 0·05 | 0·10 | 1·80 | 3·34 | 5·20 | 1 | 5·14 |
| 5 | 1·03 | 2 | 0·05 | 0·23 | 1·87 | 3·52 | 5·20 | 5 | 4·88 |
| 10 | 0·84 | 3 | 0·04 | 0·41 | 1·79 | 3·62 | 5·23 | 10 | 4·45 |
| 15 | 0·73 | 4 | 0·01 | 0·55 | 1·75 | 3·71 | 5·27 | 15 | 3·86 |
| 20 | 0·63 | 5 | 0·02 | 0·74 | 1·70 | 3·79 | 5·27 | 20 | 3·63 |
| 25 | 0·54 | 6 | -0·10 | 0·76 | 1·76 | 3·94 | 5·27 | 25 | 3·35 |
| 30 | 0·50 | 7 | -0·08 | 0·78 | 1·85 | 4·00 | 5·28 | 30 | 3·05 |
| Mean. | 0·75 | 8 | -0·05 | 0·76 | 2·03 | 4·20 | 5·33 | Mean. | 3·97 |
| February. | 9 | -0·05 | 0·75 | 2·13 | 4·30 | 5·40 | Novemb. | ||
| 1 | 0·48 | 10 | -0·06 | 0·77 | 2·16 | 4·38 | 5·40 | 1 | 3·00 |
| 5 | 0·45 | 11 | -0·07 | 0·84 | 2·07 | 4·40 | 5·36 | 5 | 2·84 |
| 10 | 0·38 | 12 | -0·04 | 1·00 | 2·09 | 4·50 | 5·35 | 10 | 2·60 |
| 15 | 0·33 | 13 | -0·04 | 0·84 | 2·05 | 4·48 | 5·38 | 15 | 2·44 |
| 20 | 0·25 | 14 | -0·01 | 0·78 | 2·14 | 4·50 | 5·50 | 20 | 2·24 |
| 25 | 0·19 | 15 | 0·01 | 0·75 | 2·17 | 4·50 | 5·42 | 25 | 2·18 |
| 28 | 0·15 | 16 | 0·04 | 0·72 | 2·24 | 4·48 | 5·40 | 30 | 2·08 |
| Mean. | 0·32 | 17 | 0·03 | 0·69 | 2·29 | 4·45 | 5·40 | Mean. | 2·46 |
| March. | 18 | 0·08 | 0·74 | 2·33 | 4·39 | 5·40 | Decemb. | ||
| 1 | 0·14 | 19 | 0·18 | 0·84 | 2·34 | 4·50 | 5·30 | 1 | 2·06 |
| 5 | 0·10 | 20 | 0·14 | 1·06 | 2·36 | 4·61 | 5·39 | 5 | 1·94 |
| 10 | 0·09 | 21 | 0·14 | 1·24 | 2·52 | 4·87 | 5·30 | 10 | 1·83 |
| 15 | 0·07 | 22 | 0·16 | 1·36 | 2·54 | 4·93 | 5·24 | 15 | 1·71 |
| 20 | 0·15 | 23 | 0·16 | 1·27 | 2·56 | 4·93 | 5·12 | 20 | 1·62 |
| 25 | 0·19 | 24 | 0·09 | 1·29 | 2·62 | 4·90 | 5·10 | 25 | 1·55 |
| 30 | 0·07 | 25 | 0·10 | 1·21 | 2·64 | 4·90 | 5·10 | 30 | 1·43 |
| Mean. | 0·11 | 26 | 0·11 | 1·15 | 2·69 | 5·00 | 5·10 | Mean. | 1·71 |
| April. | 27 | 0·16 | 1·30 | 2·69 | 5·17 | 5·05 | |||
| 1 | 0·07 | 28 | 0·14 | 1·59 | 2·79 | 5·30 | 5·03 | ||
| 5 | -0·02 | 29 | 0·09 | 1·75 | 2·94 | 5·34 | 5·06 | ||
| 10 | 0·01 | 30 | 0·10 | 1·73 | 2·96 | 5·30 | 5·16 | ||
| 15 | -0·07 | 31 | 0·11 | .. | 3·24 | 5·30 | .. | ||
| 20 | -0·01 | Mean. | 0·05 | 0·90 | 2·30 | 4·50 | 5·26 | ||
| 25 | -0·04 | ||||||||
| 30 | 0·01 | ||||||||
| Mean. | -0·01 | ||||||||
| 1903 | |||||||||
| Date. | Month. | Date. | May. | June. | July. | Au- gust. |
Sept. | Date. | Month. |
| January. | October. | ||||||||
| 1 | 1·40 | 1 | -0·16 | 1·05 | 1·54 | 3·50 | 6·24 | 1 | 5·50 |
| 5 | 1·30 | 2 | -0·20 | 1·05 | 1·60 | 3·80 | 6·30 | 5 | 5·40 |
| 10 | 1·21 | 3 | -0·23 | 0·98 | 1·78 | 4·05 | 6·15 | 10 | 5·15 |
| 15 | 1·10 | 4 | -0·26 | 0·98 | 1·95 | 4·40 | 6·20 | 15 | 4·50 |
| 20 | 1·02 | 5 | -0·26 | 1·16 | 2·13 | 4·60 | 6·20 | 20 | 4·48 |
| 25 | 0·87 | 6 | -0·23 | 1·40 | 2·10 | 4·75 | 6·15 | 25 | 4·40 |
| 30 | 0·73 | 7 | -0·23 | 1·40 | 2·10 | 4·87 | 6·12 | 30 | 4·00 |
| Mean. | 1·07 | 8 | -0·23 | 1·36 | 2·20 | 4·95 | 6·15 | Mean. | 4·74 |
| February. | 9 | -0·22 | 1·30 | 2·35 | 5·06 | 6·24 | Novem. | ||
| 1 | 0·65 | 10 | -0·24 | 1·25 | 2·48 | 5·06 | 6·14 | 1 | 3·85 |
| 5 | 0·61 | 11 | -0·28 | 1·25 | 2·55 | 5·10 | 6·15 | 5 | 3·60 |
| 10 | 0·47 | 12 | -0·24 | 1·30 | 2·58 | 5·35 | 6·05 | 10 | 3·25 |
| 15 | 0·42 | 13 | -0·26 | 1·41 | 2·75 | 5·55 | 5·96 | 15 | 3·00 |
| 20 | 0·39 | 14 | -0·25 | 1·56 | 2·80 | 5·65 | 5·90 | 20 | 2·65 |
| 25 | 0·25 | 15 | -0·26 | 1·65 | 2·80 | 5·55 | 5·86 | 25 | 2·60 |
| 28 | 0·22 | 16 | -0·26 | 1·75 | 2·75 | 5·70 | 5·95 | 30 | 2·45 |
| Mean. | 0·43 | 17 | -0·23 | 1·85 | 2·75 | 5·80 | 5·88 | Mean. | 3·01 |
| March. | 18 | -0·21 | 2·00 | 2·75 | 5·70 | 5·88 | Decem. | ||
| 1 | 0·22 | 19 | -0·19 | 1·90 | 2·85 | 5·80 | 5·85 | 1 | 2·40 |
| 5 | 0·19 | 20 | -0·18 | 1·85 | 2·95 | 5·80 | 5·90 | 5 | 2·30 |
| 10 | 0·13 | 21 | -0·14 | 1·70 | 3·05 | 5·90 | 5·95 | 10 | 2·09 |
| 15 | 0·08 | 22 | -0·09 | 1·60 | 3·25 | 5·95 | 6·00 | 15 | 1·93 |
| 20 | 0·04 | 23 | -0·02 | 1·55 | 3·40 | 6·00 | 6·10 | 20 | 1·90 |
| 25 | -0·05 | 24 | 0·12 | 1·55 | 3·40 | 6·00 | 6·10 | 25 | 1·88 |
| 30 | -0·11 | 25 | 0·26 | 1·56 | 3·40 | 6·03 | 6·08 | 30 | 1·80 |
| Mean. | 0·06 | 26 | 0·33 | 1·58 | 3·42 | 6·08 | 6·02 | Mean. | 2·01 |
| April. | 27 | 0·40 | 1·60 | 3·42 | 6·00 | 5·85 | |||
| 1 | -0·11 | 28 | 0·53 | 1·61 | 3·42 | .. | 5·80 | ||
| 5 | -0·13 | 29 | 0·90 | 1·54 | 3·45 | .. | 5·60 | ||
| 10 | -0·10 | 30 | 0·98 | 1·54 | 3·45 | 6·15 | 5·55 | ||
| 15 | -0·14 | 31 | 1·01 | .. | 3·45 | 6·28 | .. | ||
| 20 | -0·12 | Mean. | -0·01 | 1·47 | 2·73 | 5·36 | 6·01 | ||
| 25 | -0·16 | ||||||||
| 30 | -0·18 | ||||||||
| Mean. | -0·13 | ||||||||
| 1904 | |||||||||
| Date. | Month. | Date. | May. | June. | July. | Au- gust. |
Sept. | Date. | Month. |
| January. | |||||||||
| 1 | 1·80 | 1 | 0·15 | 0·61 | 1·35 | 5·00 | 5·48 | .. | .. |
| 5 | 1·78 | 2 | 0·15 | 0·60 | 1·55 | 5·30 | 5·58 | .. | .. |
| 10 | 1·70 | 3 | 0·15 | 0·60 | 1·79 | 5·50 | 5·58 | .. | .. |
| 15 | 1·59 | 4 | 0·10 | 0·63 | 2·15 | 5·50 | 5·54 | .. | .. |
| 20 | 1·55 | 5 | 0·10 | 0·70 | 2·40 | 5·55 | 5·54 | .. | .. |
| 25 | 1·50 | 6 | 0·12 | 0·92 | 2·68 | 5·60 | 5·50 | .. | .. |
| 30 | 1·50 | 7 | 0·29 | 1·17 | 2·76 | 5·58 | 5·50 | .. | .. |
| Mean. | 1·59 | 8 | 0·10 | 1·23 | 2·76 | 5·58 | 5·46 | .. | .. |
| February. | 9 | 0·00 | 1·22 | 2·74 | 5·58 | 5·36 | .. | .. | |
| 1 | 1·48 | 10 | -0·01 | 1·20 | 2·76 | 5·58 | 5·34 | .. | .. |
| 5 | 1·47 | 11 | +0·05 | 1·17 | 2·70 | 5·64 | 5·34 | .. | .. |
| 10 | 1·35 | 12 | 0·08 | 1·16 | 2·84 | 5·55 | 5·34 | .. | .. |
| 15 | 1·15 | 13 | 0·08 | 1·15 | 3·05 | 5·48 | 5·34 | .. | .. |
| 20 | 1·13 | 14 | 0·08 | 1·15 | 3·07 | 5·48 | 5·40 | .. | .. |
| 25 | 1·08 | 15 | 0·10 | 1·16 | 3·15 | 5·44 | 5·40 | .. | .. |
| 28 | 1·07 | 16 | 0·10 | 1·16 | 3·40 | 5·30 | .. | .. | .. |
| Mean. | 1·23 | 17 | 0·24 | 1·16 | 3·62 | 5·20 | .. | .. | .. |
| March | 18 | 0·29 | 1·02 | 3·63 | 5·30 | .. | .. | .. | |
| 1 | 1·05 | 19 | 0·31 | 0·96 | 3·63 | 5·30 | .. | .. | .. |
| 5 | 0·80 | 20 | 0·21 | 1·00 | 3·63 | 5·22 | .. | .. | .. |
| 10 | 0·53 | 21 | 0·19 | 1·00 | 3·65 | 5·25 | .. | .. | .. |
| 15 | 0·37 | 22 | 0·21 | 1·03 | 3·75 | 5·25 | .. | .. | .. |
| 20 | 0·31 | 23 | 0·24 | 1·02 | 3·95 | 5·30 | .. | .. | .. |
| 25 | 0·25 | 24 | 0·25 | 1·06 | 4·00 | 5·30 | .. | .. | .. |
| 30 | 0·31 | 25 | 0·30 | 1·07 | 4·02 | 5·30 | .. | .. | .. |
| Mean. | 0·48 | 26 | 0·32 | 1·07 | 4·15 | 5·45 | .. | .. | .. |
| April | 27 | 0·40 | 1·06 | 4·38 | 5·45 | .. | |||
| 1 | 0·10 | 28 | 0·48 | 1·08 | 4·45 | 5·62 | .. | ||
| 5 | 0·29 | 29 | 0·57 | 1·16 | 4·45 | 5·48 | .. | ||
| 10 | 0·25 | 30 | 0·61 | 1·20 | 4·45 | 5·43 | .. | ||
| 15 | 0·18 | 31 | 0·60 | 4·75 | 5·45 | .. | |||
| 20 | 0·20 | Mean. | 0·22 | 1·02 | 5·41 | .. | |||
| 25 | 0·18 | ||||||||
| 30 | 0·15 | ||||||||
| Mean. | 0·21 | ||||||||
[188-
189]
| 1903 | ||||||||||||
| Date. | Jan. | Feb. | Mar. | Apr. | May. | Jun. | Jul. | Aug. | Sep. | Oct. | Nov. | Dec. |
|---|---|---|---|---|---|---|---|---|---|---|---|---|
| 1 | .. | .. | .. | .. | .. | 1·00 | 2·20 | 4·21 | 4·52 | 2·88 | .. | .. |
| 2 | .. | .. | .. | .. | .. | 0·93 | 2·18 | 4·00 | 4·52 | 2·78 | .. | .. |
| 3 | .. | .. | .. | .. | .. | 0·85 | 2·15 | 3·56 | 4·60 | 2·78 | .. | .. |
| 4 | .. | .. | .. | .. | .. | 0·85 | 2·74 | 3·25 | 4·70 | 2·90 | .. | .. |
| 5 | .. | .. | .. | .. | .. | 0·89 | 2·60 | 3·35 | 4·55 | 2·75 | .. | .. |
| 6 | .. | .. | .. | .. | .. | 0·89 | 2·30 | 3·27 | 4·66 | 2·67 | .. | .. |
| 7 | .. | .. | .. | .. | .. | 0·86 | 2·10 | 3·30 | 4·58 | 2·50 | .. | .. |
| 8 | .. | .. | .. | .. | .. | 0·97 | 2·10 | 3·07 | 4·50 | 2·50 | .. | .. |
| 9 | .. | .. | .. | .. | .. | 1·05 | 2·51 | 3·29 | 4·15 | 2·38 | .. | .. |
| 10 | .. | .. | .. | .. | .. | 1·11 | 2·35 | 3·72 | 4·30 | 2·30 | .. | .. |
| 11 | .. | .. | .. | .. | .. | 1·00 | 2·65 | 4·61 | 3·89 | 2·22 | .. | .. |
| 12 | .. | .. | .. | .. | .. | 0·97 | 2·31 | 4·37 | 3·95 | 2·17 | .. | .. |
| 13 | .. | .. | .. | .. | .. | 0·90 | 2·10 | 4·53 | 3·80 | 2·17 | .. | .. |
| 14 | .. | .. | .. | .. | .. | 0·90 | 2·10 | 4·60 | 3·84 | 2·08 | .. | .. |
| 15 | .. | .. | .. | .. | .. | 0·93 | 2·65 | 4·85 | 3·71 | 2·05 | .. | .. |
| 16 | .. | .. | .. | .. | .. | 0·98 | 2·28 | 4·80 | 3·88 | 2·10 | .. | .. |
| 17 | .. | .. | .. | .. | .. | 1·20 | 2·40 | 4·90 | 4·36 | 2·10 | .. | .. |
| 18 | .. | .. | .. | .. | .. | 1·50 | 2·37 | 5·50 | 4·20 | .. | .. | .. |
| 19 | .. | .. | .. | .. | .. | 1·70 | 2·55 | 5·50 | 4·00 | 2·05 | .. | .. |
| 20 | .. | .. | .. | .. | .. | 1·98 | 2·74 | 5·75 | 4·12 | .. | .. | .. |
| 21 | .. | .. | .. | .. | .. | 1·88 | 2·83 | 5·47 | 3·80 | .. | .. | .. |
| 22 | .. | .. | .. | .. | .. | 1·70 | 2·70 | 5·12 | 3·45 | .. | .. | .. |
| 23 | .. | .. | .. | .. | .. | 1·90 | 2·70 | 4·82 | 3·30 | .. | .. | .. |
| 24 | .. | .. | .. | .. | .. | 1·84 | 3·00 | 4·54 | 3·25 | .. | .. | .. |
| 25 | .. | .. | .. | .. | .. | 2·20 | 2·62 | 4·35 | 3·10 | .. | .. | .. |
| 26 | .. | .. | .. | .. | .. | 1·93 | 2·53 | 4·20 | 2·89 | .. | .. | .. |
| 27 | .. | .. | .. | .. | .. | 2·24 | 2·60 | 4·80 | 3·42 | .. | .. | .. |
| 28 | .. | .. | .. | .. | .. | 2·20 | 2·76 | 4·55 | 3·10 | .. | .. | .. |
| 29 | .. | .. | .. | .. | .. | 2·43 | 2·80 | 4·55 | 3·13 | .. | .. | .. |
| 30 | .. | .. | .. | .. | .. | 2·20 | 3·29 | 4·75 | 3·05 | .. | .. | .. |
| 31 | .. | .. | .. | .. | .. | .. | 3·54 | 4·45 | .. | .. | .. | .. |
| 1904 | ||||||||||||
| 1 | .. | .. | .. | .. | .. | -1·00 | 1·57 | 3·79 | 2·70 | .. | .. | .. |
| 2 | .. | .. | .. | .. | .. | -1·00 | 1·89 | 3·85 | 2·65 | .. | .. | .. |
| 3 | .. | .. | .. | .. | .. | -0·80 | 1·80 | 3·93 | 2·55 | .. | .. | .. |
| 4 | .. | .. | .. | .. | .. | -0·56 | 1·93 | 3·90 | 2·90 | .. | .. | .. |
| 5 | .. | .. | .. | .. | .. | -0·10 | 2·04 | 4·04 | 3·50 | .. | .. | .. |
| 6 | .. | .. | .. | .. | .. | +0·19 | 2·08 | 4·08 | 3·40 | .. | .. | .. |
| 7 | .. | .. | .. | .. | .. | 0·31 | 2·45 | 4·00 | 3·30 | .. | .. | .. |
| 8 | .. | .. | .. | .. | .. | 0·50 | 2·72 | 4·00 | 2·92 | .. | .. | .. |
| 9 | .. | .. | .. | .. | .. | 0·40 | 2·83 | 3·80 | 2·86 | .. | .. | .. |
| 10 | .. | .. | .. | .. | .. | 0·38 | 2·97 | 3·20 | 2·98 | .. | .. | .. |
| 11 | .. | .. | .. | .. | .. | 0·35 | 2·88 | 3·93 | 2·60 | .. | .. | .. |
| 12 | .. | .. | .. | .. | .. | 0·30 | 2·80 | 2·90 | 2·52 | .. | .. | .. |
| 13 | .. | .. | .. | .. | .. | 0·30 | 2·80 | 2·71 | 2·85 | .. | .. | .. |
| 14 | .. | .. | .. | .. | .. | 0·30 | 3·10 | 2·63 | 2·79 | .. | .. | .. |
| 15 | .. | .. | .. | .. | .. | 0·29 | 3·03 | 2·70 | 2·09 | .. | .. | .. |
| 16 | .. | .. | .. | .. | .. | 0·28 | 2·74 | 3·39 | .. | .. | .. | .. |
| 17 | .. | .. | .. | .. | .. | 0·32 | 2·91 | 3·39 | .. | .. | .. | .. |
| 18 | .. | .. | .. | .. | .. | 0·55 | 3·36 | 3·39 | .. | .. | .. | .. |
| 19 | .. | .. | .. | .. | .. | 0·40 | 3·30 | 3·28 | .. | .. | .. | .. |
| 20 | .. | .. | .. | .. | .. | 0·80 | 2·10 | 3·20 | .. | .. | .. | .. |
| 21 | .. | .. | .. | .. | .. | 0·80 | 3·12 | 3·20 | .. | .. | .. | .. |
| 22 | .. | .. | .. | .. | .. | 0·70 | 3·20 | 3·18 | .. | .. | .. | .. |
| 23 | .. | .. | .. | .. | .. | 0·85 | 3·50 | 2·80 | .. | .. | .. | .. |
| 24 | .. | .. | .. | .. | .. | 0·96 | 3·72 | 2·83 | .. | .. | .. | .. |
| 25 | .. | .. | .. | .. | .. | 0·95 | 3·13 | 2·90 | .. | .. | .. | .. |
| 26 | .. | .. | .. | .. | .. | 1·15 | 3·05 | 2·91 | .. | .. | .. | .. |
| 27 | .. | .. | .. | .. | .. | 1·30 | 3·36 | 2·96 | .. | .. | .. | .. |
| 28 | .. | .. | .. | .. | .. | 1·45 | 3·76 | 3·30 | .. | .. | .. | .. |
| 29 | .. | .. | .. | .. | .. | 1·51 | 3·69 | 3·50 | .. | .. | .. | .. |
| 30 | .. | .. | .. | .. | .. | 1·50 | 4·15 | 3·10 | .. | .. | .. | .. |
| 31 | .. | .. | .. | .. | .. | .. | 3·80 | 3·08 | .. | .. | .. | .. |
| Zero = 10·00 metres on the gauge. | ||||||||||||
[190-
193]
| 1901 | |||||||||
| Date. | Month. | Date. | May. | June. | July. | Au- gust. |
Sept. | Date. | Month. |
|---|---|---|---|---|---|---|---|---|---|
| January. | October. | ||||||||
| 1 | 2·43 | 1 | 0·96 | 0·97 | 2·92 | 6·25 | 7·80 | 1 | 5·93 |
| 5 | 2·35 | 2 | 0·98 | 1·00 | 2·89 | 6·30 | 7·79 | 5 | 5·45 |
| 10 | 2·23 | 3 | 1·00 | 1·03 | 3·00 | 6·40 | 7·82 | 10 | 5·08 |
| 15 | 2·07 | 4 | 1·02 | 1·05 | 3·20 | 6·48 | 7·75 | 15 | 4·73 |
| 20 | 1·93 | 5 | 1·04 | 1·07 | 3·40 | 6·56 | 7·70 | 20 | 4·44 |
| 25 | 1·82 | 6 | 1·06 | 1·10 | 3·55 | 6·79 | 7·70 | 25 | 4·20 |
| 30 | 1·70 | 7 | 1·05 | 1·18 | 3·60 | 6·67 | 7·62 | 30 | 4·00 |
| Mean. | 2·06 | 8 | 1·05 | 1·27 | 3·65 | 6·79 | 7·64 | Mean. | 4·74 |
| February. | 9 | 1·07 | 1·36 | 3·70 | 6·88 | 7·45 | Novem. | ||
| 1 | 1·63 | 10 | 1·10 | 1·43 | 3·75 | 7·09 | 7·50 | 1 | 3·90 |
| 5 | 1·62 | 11 | 1·09 | 1·45 | 3·75 | 7·45 | 7·63 | 5 | 3·75 |
| 10 | 1·54 | 12 | 1·07 | 1·48 | 3·78 | 7·53 | 7·67 | 10 | 3·53 |
| 15 | 1·47 | 13 | 1·06 | 1·47 | 4·00 | 7·58 | 7·57 | 15 | 3·38 |
| 20 | 1·38 | 14 | 1·05 | 1·47 | 4·14 | 7·70 | 7·55 | 20 | 3·12 |
| 25 | 1·34 | 15 | 1·04 | 1·53 | 4·20 | 7·76 | 7·50 | 25 | 2·97 |
| 28 | 1·24 | 16 | 1·05 | 1·70 | 4·35 | 7·65 | 7·41 | 30 | 2·83 |
| Mean. | 1·47 | 17 | 1·04 | 1·87 | 4·30 | 7·68 | 7·35 | Mean. | 3·33 |
| March. | 18 | 1·03 | 2·00 | 4·27 | 7·74 | 7·25 | Decem. | ||
| 1 | 1·24 | 19 | 1·03 | 2·15 | 4·35 | 7·65 | 7·20 | 1 | 2·86 |
| 5 | 1·24 | 20 | 1·00 | 2·18 | 4·55 | 7·54 | 7·05 | 5 | 2·75 |
| 10 | 1·08 | 21 | 1·00 | 2·16 | 4·59 | 7·46 | 6·90 | 10 | 2·70 |
| 15 | 0·98 | 22 | 0·94 | 2·14 | 4·59 | 7·46 | 6·80 | 15 | 2·52 |
| 20 | 0·94 | 23 | 0·86 | 2·14 | 4·62 | 7·43 | 6·70 | 20 | 2·51 |
| 25 | 0·84 | 24 | 0·87 | 2·17 | 4·62 | 7·41 | 6·62 | 25 | 2·30 |
| 30 | 0·86 | 25 | 0·88 | 2·27 | 4·65 | 7·38 | 6·51 | 30 | 2·13 |
| Mean. | 1·01 | 26 | 0·91 | 2·50 | 4·95 | 7·50 | 6·41 | Mean. | 2·52 |
| April. | 27 | 0·87 | 2·70 | 5·05 | 7·44 | 6·27 | |||
| 1 | 0·83 | 28 | 0·85 | 2·82 | 5·16 | 7·44 | 6·18 | ||
| 5 | 0·86 | 29 | 0·87 | 2·86 | 5·58 | 7·74 | 6·13 | ||
| 10 | 0·82 | 30 | 0·93 | 2·88 | 5·74 | 7·81 | 6·08 | ||
| 15 | 0·63 | 31 | 0·95 | .. | 6·15 | 7·87 | .. | ||
| 20 | 0·72 | Mean. | 0·99 | 1·78 | 4·22 | 7·27 | 7·18 | ||
| 25 | 0·73 | ||||||||
| 30 | 0·93 | ||||||||
| Mean. | 0·74 | ||||||||
| 1902 | |||||||||
| Date. | Month. | Date. | May. | June. | July. | Au- gust. |
Sep- tem- ber. |
Date. | Month. |
| January. | October. | ||||||||
| 1 | 2·04 | 1 | 0·67 | 0·86 | 2·07 | 4·32 | 6·77 | 1 | 6·23 |
| 5 | 1·90 | 2 | 0·67 | 0·86 | 2·27 | 4·55 | 6·75 | 5 | 6·14 |
| 10 | 1·74 | 3 | 0·71 | 0·86 | 2·46 | 4·78 | 6·70 | 10 | 5·73 |
| 15 | 1·51 | 4 | 0·71 | 0·85 | 2·52 | 4·90 | 6·72 | 15 | 5·14 |
| 20 | 1·47 | 5 | 0·72 | 0·85 | 2·58 | 5·06 | 6·70 | 20 | 4·62 |
| 25 | 1·40 | 6 | 0·82 | 0·91 | 2·64 | 5·17 | 6·72 | 25 | 4·28 |
| 30 | 1·30 | 7 | 0·78 | 1·04 | 2·62 | 5·17 | 6·77 | 30 | 4·06 |
| Mean. | 1·59 | 8 | 0·75 | 1·18 | 2·64 | 5·27 | 6·95 | Mean. | 5·11 |
| February. | 9 | 0·70 | 1·33 | 2·65 | 5·37 | 6·91 | Novemb. | ||
| 1 | 1·28 | 10 | 0·67 | 1·41 | 2·72 | 5·45 | 6·96 | 1 | 3·96 |
| 5 | 1·21 | 11 | 0·63 | 1·44 | 2·84 | 5·49 | 7·05 | 5 | 3·65 |
| 10 | 1·12 | 12 | 0·63 | 1·44 | 2·95 | 5·55 | 6·97 | 10 | 3·55 |
| 15 | 1·07 | 13 | 0·65 | 1·48 | 3·04 | 5·67 | 6·93 | 15 | 3·30 |
| 20 | 1·06 | 14 | 0·65 | 1·52 | 3·10 | 5·85 | 6·91 | 20 | 3·11 |
| 25 | 0·96 | 15 | 0·65 | 1·57 | 3·15 | 5·85 | 6·94 | 25 | 3·07 |
| 28 | 0·94 | 16 | 0·66 | 1·65 | 3·15 | 5·85 | 6·89 | 30 | 2·95 |
| Mean. | 1·09 | 17 | 0·67 | 1·64 | 3·22 | 5·85 | 6·84 | Mean. | 3·34 |
| March. | 18 | 0·68 | 1·58 | 3·21 | 5·87 | 6·77 | Decemb. | ||
| 1 | 0·88 | 19 | 0·69 | 1·50 | 3·36 | 5·82 | 6·75 | 1 | 2·94 |
| 5 | 0·82 | 20 | 0·73 | 1·49 | 3·41 | 5·89 | 6·69 | 5 | 2·88 |
| 10 | 0·84 | 21 | 0·76 | 1·47 | 3·48 | 6·21 | 6·67 | 10 | 2·75 |
| 15 | 0·83 | 22 | 0·77 | 1·47 | 3·54 | 6·37 | 6·63 | 15 | 2·68 |
| 20 | 0·76 | 23 | 0·82 | 1·53 | 3·54 | 6·42 | 6·55 | 20 | 2·55 |
| 25 | 0·76 | 24 | 0·85 | 1·70 | 3·59 | 6·55 | 6·47 | 25 | 2·53 |
| 30 | 0·86 | 25 | 0·86 | 1·90 | 3·72 | 6·48 | 6·37 | 30 | 2·37 |
| Mean. | 0·81 | 26 | 0·86 | 2·02 | 3·82 | 6·50 | 6·35 | Mean. | 2·66 |
| April. | 27 | 0·87 | 2·06 | 3·94 | 6·48 | 6·38 | |||
| 1 | 0·83 | 28 | 0·87 | 2·06 | .. | 6·45 | 6·33 | ||
| 5 | 0·78 | 29 | 0·85 | 2·10 | 3·88 | 6·63 | 6·29 | ||
| 10 | 0·64 | 30 | 0·86 | 2·00 | 4·00 | 6·80 | 6·25 | ||
| 15 | 0·68 | 31 | 0·86 | .. | 4·21 | 6·80 | .. | ||
| 20 | 0·64 | Mean. | 0·74 | 1·46 | 3·14 | 5·80 | 6·70 | ||
| 25 | 0·67 | ||||||||
| 30 | 0·61 | ||||||||
| Mean. | 0·68 | ||||||||
| 1903 | |||||||||
| Date. | Month. | Date. | May. | June. | July. | Au- gust. |
Sep- tem- ber. |
Date. | Month. |
| January. | October | ||||||||
| 1 | 2·36 | 1 | 0·83 | 1·27 | 2·80 | 4·83 | 7·73 | 1 | 7·00 |
| 5 | 2·43 | 2 | 0·84 | 1·43 | 2·82 | 4·89 | 7·73 | 5 | 6·84 |
| 10 | 2·24 | 3 | 0·83 | 1·63 | 2·82 | 4·95 | 7·72 | 10 | 6·58 |
| 15 | 2·15 | 4 | 0·82 | 1·74 | 2·89 | 5·65 | 7·70 | 15 | 6·15 |
| 20 | 2·09 | 5 | 0·79 | 1·80 | 2·93 | 5·85 | 7·72 | 20 | 5·73 |
| 25 | 1·95 | 6 | 0·76 | 1·84 | 2·98 | 5·98 | 7·77 | 25 | 5·86 |
| 30 | 1·80 | 7 | 0·75 | 1·85 | 3·10 | 6·18 | 7·82 | 30 | 5·33 |
| Mean. | 2·13 | 8 | 0·73 | 1·86 | 3·25 | 6·27 | 7·74 | Mean. | 6·16 |
| February. | 9 | 0·72 | 1·96 | 3·40 | 6·37 | 7·72 | Novemb. | ||
| 1 | 1·70 | 10 | 0·76 | 2·10 | 3·47 | 6·43 | 7·72 | 1 | 5·17 |
| 5 | 1·59 | 11 | 0·79 | 2·16 | 3·43 | 6·47 | 7·72 | 5 | 4·96 |
| 10 | 1·51 | 12 | 0·80 | 2·18 | 3·46 | 6·50 | 7·53 | 10 | 4·53 |
| 15 | 1·42 | 13 | 0·80 | 2·16 | 3·56 | 6·87 | 7·64 | 15 | 4·12 |
| 20 | 1·38 | 14 | 0·79 | 2·13 | 3·74 | 7·13 | 7·52 | 20 | 3·88 |
| 25 | 1·23 | 15 | 0·77 | 2·15 | 3·82 | 7·20 | 7·45 | 25 | 3·75 |
| 28 | 1·20 | 16 | 0·76 | 2·21 | 3·95 | 7·40 | 7·40 | 30 | .. |
| Mean. | 1·44 | 17 | 0·76 | 2·27 | 4·00 | 7·53 | 7·40 | Mean. | 4·28 |
| March. | 18 | 0·76 | 2·37 | 4·02 | 7·53 | 7·37 | Decemb. | ||
| 1 | 1·20 | 19 | 0·77 | 2·50 | 4·00 | 7·67 | 7·35 | 1 | 3·52 |
| 5 | 1·26 | 20 | 0·78 | 2·60 | 4·10 | 7·75 | 7·45 | 5 | 3·38 |
| 10 | 1·16 | 21 | 0·80 | 2·72 | 4·10 | 8·05 | 7·45 | 10 | 3·28 |
| 15 | 1·10 | 22 | 0·80 | 2·76 | 4·13 | 8·10 | 7·45 | 15 | 3·19 |
| 20 | 1·07 | 23 | 0·81 | 2·76 | 4·23 | 7·80 | 7·47 | 20 | 3·10 |
| 25 | 1·01 | 24 | 0·82 | 2·70 | 4·37 | 7·57 | 7·47 | 25 | 3·05 |
| 30 | 0·92 | 25 | 0·83 | 2·65 | 4·50 | 7·60 | 7·43 | 30 | 2·92 |
| Mean. | 1·10 | 26 | 0·86 | 2·68 | 4·67 | 7·52 | 7·43 | Mean. | 3·22 |
| April. | 27 | 0·91 | 2·70 | 4·73 | 7·62 | 7·40 | |||
| 1 | 0·92 | 28 | 0·96 | 2·70 | 4·83 | 7·67 | 7·30 | ||
| 5 | 0·95 | 29 | 1·03 | 2·70 | 4·85 | 7·56 | 7·14 | ||
| 10 | 0·90 | 30 | 1·09 | 2·74 | 4·80 | 7·72 | 7·04 | ||
| 15 | 0·85 | 31 | 1·17 | .. | 4·79 | 7·74 | .. | ||
| 20 | 0·82 | Mean. | 0·82 | 2·24 | 3·82 | 6·91 | 7·52 | ||
| 25 | 0·80 | ||||||||
| 30 | 0·81 | ||||||||
| Mean. | 0·86 | ||||||||
| 1904 | |||||||||
| Date. | Month. | Date. | May. | June. | July. | Au- gust. |
Sep- tem- ber. |
Date. | Month. |
| January. | |||||||||
| 1 | 2·90 | 1 | 1·11 | 1·33 | 1·95 | 6·22 | 6·75 | ||
| 5 | 2·86 | 2 | 1·09 | 1·42 | 1·98 | 6·28 | 6·67 | ||
| 10 | 2·75 | 3 | 1·07 | 1·47 | 2·14 | 6·34 | 6·67 | ||
| 15 | 2·68 | 4 | 1·07 | 1·47 | 2·32 | 6·59 | 6·68 | ||
| 20 | 2·59 | 5 | 1·07 | 1·45 | 2·43 | 6·90 | 6·69 | ||
| 25 | 2·52 | 6 | 1·06 | 1·45 | 2·59 | 6·93 | 6·93 | ||
| 30 | 2·46 | 7 | 1·07 | 1·45 | 2·80 | 6·97 | 6·98 | ||
| Mean. | 2·66 | 8 | 1·07 | 1·46 | 3·07 | 6·87 | 6·85 | ||
| February. | 9 | 1·09 | 1·52 | 3·40 | 6·87 | 6·89 | |||
| 1 | 2·50 | 10 | 1·11 | 1·75 | 3·70 | 6·77 | 6·83 | ||
| 5 | 2·35 | 11 | 1·15 | 1·88 | 3·81 | 6·70 | 6·73 | ||
| 10 | 2·34 | 12 | 1·10 | 1·97 | 4·00 | 6·68 | 6·68 | ||
| 15 | 2·14 | 13 | 1·00 | 2·00 | 3·96 | 6·65 | 6·68 | ||
| 20 | 2·00 | 14 | 1·00 | 2·00 | 3·94 | 6·64 | 6·68 | ||
| 25 | 1·94 | 15 | 0·94 | 1·97 | 3·94 | 6·66 | 6·67 | ||
| 29 | 1·74 | 16 | 0·96 | 1·97 | 4·15 | 6·60 | |||
| Mean. | 2·14 | 17 | 0·96 | 1·98 | 4·35 | 6·54 | |||
| March. | 18 | 0·98 | 2·00 | 4·60 | 6·52 | ||||
| 1 | 1·67 | 19 | 0·98 | 2·00 | 4·78 | 6·60 | |||
| 5 | 1·65 | 20 | 1·02 | 2·00 | 4·84 | 6·47 | |||
| 10 | 1·52 | 21 | 1·09 | 2·00 | 5·03 | 6·46 | |||
| 15 | 1·37 | 22 | 1·15 | 1·90 | 5·12 | 6·50 | |||
| 20 | 1·29 | 23 | 1·17 | 1·85 | 5·00 | 6·45 | |||
| 25 | 1·22 | 24 | 1·15 | 1·88 | 5·00 | 6·50 | |||
| 30 | 1·17 | 25 | 1·09 | 1·89 | 5·08 | 6·57 | |||
| Mean. | 1·39 | 26 | 1·08 | 1·90 | 5·41 | 6·48 | |||
| April. | 27 | 1·08 | 1·91 | 5·65 | 6·48 | ||||
| 1 | 1·25 | 28 | 1·10 | 1·92 | 5·60 | 6·45 | |||
| 5 | 1·15 | 29 | 1·13 | 1·93 | 5·57 | 6·69 | |||
| 10 | 1·17 | 30 | 1·19 | 1·93 | 5·78 | 6·83 | |||
| 15 | 1·11 | 31 | 1·28 | .. | 6·00 | 6·79 | |||
| 20 | 1·05 | Mean. | 1·08 | 1·79 | 4·13 | 6·61 | |||
| 25 | 1·12 | ||||||||
| 30 | 1·10 | ||||||||
| Mean. | 1·14 | ||||||||
[194]
| 1873-1902 | ||||||||||||
| Date. | Jan. | Feb. | Mar. | Apr. | May. | Jun. | Jul. | Aug. | Sep. | Oct. | Nov. | Dec. |
|---|---|---|---|---|---|---|---|---|---|---|---|---|
| 1 | 2·64 | 1·95 | 1·31 | 0·68 | 0·24 | 0·10 | 1·04 | 4·87 | 7·80 | 7·19 | 5·00 | 3·42 |
| 2 | 2·61 | 1·93 | 1·29 | 0·65 | 0·24 | 0·11 | 1·08 | 5·01 | 7·82 | 7·10 | 4·90 | 3·39 |
| 3 | 2·59 | 1·91 | 1·27 | 0·64 | 0·22 | 0·12 | 1·16 | 5·15 | 7·81 | 7·05 | 4·84 | 3·37 |
| 4 | 2·57 | 1·89 | 1·25 | 0·63 | 0·21 | 0·12 | 1·21 | 5·25 | 7·82 | 6·96 | 4·79 | 3·32 |
| 5 | 2·55 | 1·87 | 1·23 | 0·61 | 0·20 | 0·10 | 1·27 | 5·51 | 7·84 | 6·91 | 4·72 | 3·30 |
| 6 | 2·53 | 1·84 | 1·21 | 0·58 | 0·18 | 0·12 | 1·34 | 5·71 | 7·82 | 6·85 | 4·66 | 3·26 |
| 7 | 2·51 | 1·82 | 1·18 | 0·56 | 0·17 | 0·13 | 1·41 | 5·94 | 7·82 | 6·77 | 4·54 | 3·24 |
| 8 | 2·47 | 1·81 | 1·17 | 0·56 | 0·16 | 0·15 | 1·49 | 6·15 | 7·81 | 6·71 | 4·47 | 3·20 |
| 9 | 2·46 | 1·78 | 1·15 | 0·54 | 0·14 | 0·17 | 1·57 | 6·38 | 7·81 | 6·66 | 4·37 | 3·19 |
| 10 | 2·44 | 1·76 | 1·13 | 0·52 | 0·13 | 0·19 | 1·65 | 6·52 | 7·80 | 6·59 | 4·35 | 3·16 |
| 11 | 2·41 | 1·73 | 1·11 | 0·51 | 0·13 | 0·19 | 1·74 | 6·62 | 7·80 | 6·53 | 4·28 | 3·13 |
| 12 | 2·39 | 1·71 | 1·08 | 0·49 | 0·13 | 0·22 | 1·81 | 6·70 | 7·83 | 6·47 | 4·22 | 3·10 |
| 13 | 2·37 | 1·69 | 1·07 | 0·47 | 0·13 | 0·24 | 1·90 | 6·78 | 7·77 | 6·40 | 4·17 | 3·07 |
| 14 | 2·34 | 1·66 | 1·05 | 0·46 | 0·13 | 0·27 | 1·97 | 6·92 | 7·76 | 6·33 | 4·10 | 3·03 |
| 15 | 2·32 | 1·63 | 1·02 | 0·45 | 0·13 | 0·29 | 2·10 | 6·96 | 7·76 | 6·25 | 4·05 | 3·01 |
| 16 | 2·30 | 1·61 | 1·00 | 0·44 | 0·12 | 0·32 | 2·23 | 7·04 | 7·74 | 6·17 | 4·00 | 2·99 |
| 17 | 2·28 | 1·59 | 0·98 | 0·42 | 0·12 | 0·34 | 2·36 | 7·11 | 7·71 | 6·07 | 3·96 | 2·95 |
| 18 | 2·25 | 1·56 | 0·96 | 0·41 | 0·12 | 0·37 | 2·52 | 7·17 | 7·68 | 6·02 | 3·91 | 2·94 |
| 19 | 2·22 | 1·54 | 0·93 | 0·40 | 0·11 | 0·39 | 2·65 | 7·27 | 7·69 | 5·98 | 3·86 | 2·91 |
| 20 | 2·21 | 1·52 | 0·92 | 0·39 | 0·11 | 0·41 | 2·79 | 7·31 | 7·67 | 5·90 | 3·82 | 2·88 |
| 21 | 2·18 | 1·50 | 0·90 | 0·38 | 0·10 | 0·43 | 2·95 | 7·32 | 7·67 | 5·84 | 3·81 | 2·85 |
| 22 | 2·16 | 1·47 | 0·88 | 0·36 | 0·10 | 0·47 | 3·11 | 7·35 | 7·63 | 5·78 | 3·75 | 2·82 |
| 23 | 2·13 | 1·45 | 0·86 | 0·35 | 0·08 | 0·50 | 3·29 | 7·48 | 7·60 | 5·68 | 3·70 | 2·79 |
| 24 | 2·13 | 1·45 | 0·83 | 0·34 | 0·08 | 0·56 | 3·46 | 7·55 | 7·56 | 5·61 | 3·63 | 2·77 |
| 25 | 2·10 | 1·42 | 0·82 | 0·33 | 0·08 | 0·67 | 3·58 | 7·58 | 7·52 | 5·53 | 3·64 | 2·76 |
| 26 | 2·08 | 1·39 | 0·79 | 0·31 | 0·08 | 0·71 | 3·73 | 7·60 | 7·53 | 5·45 | 3·61 | 2·73 |
| 27 | 2·05 | 1·38 | 0·77 | 0·29 | 0·08 | 0·79 | 3·94 | 7·66 | 7·43 | 5·37 | 3·57 | 2·68 |
| 28 | 2·04 | 1·35 | 0·75 | 0·27 | 0·08 | 0·83 | 4·16 | 7·66 | 7·37 | 5·30 | 3·54 | 2·65 |
| 29 | 2·02 | 0·73 | 0·26 | 0·08 | 0·98 | 4·36 | 7·69 | 7·31 | 5·22 | 3·49 | 2·62 | |
| 30 | 1·99 | 0·71 | 0·24 | 0·08 | 0·97 | 4·58 | 7·74 | 7·25 | 5·15 | 3·42 | 2·60 | |
| 31 | 1·96 | 0·69 | 0·09 | 4·73 | 7·78 | 5·07 | 2·58 | |||||
| Zero is R. L. 85·00 metres. | ||||||||||||
[195-
201]
| 1874 | |||||||||
| Date. | Month. | Date. | May. | June. | July. | Au- gust. |
Sept. | Date. | Month. |
|---|---|---|---|---|---|---|---|---|---|
| January. | October. | ||||||||
| 1 | 2·06 | 1 | -0·41 | -0·32 | 1·50 | 6·49 | 8·70 | 1 | 8·11 |
| 5 | 1·95 | 2 | -0·37 | -0·10 | 1·57 | 6·65 | 8·72 | 5 | 7·89 |
| 10 | 1·75 | 3 | -0·37 | 0·10 | 1·61 | 6·74 | 8·83 | 10 | 7·64 |
| 15 | 1·57 | 4 | -0·37 | 0·26 | 1·68 | 6·81 | 8·90 | 15 | 7·21 |
| 20 | 1·41 | 5 | -0·39 | 0·31 | 1·72 | 6·88 | 8·95 | 20 | 6·61 |
| 25 | 1·23 | 6 | -0·44 | 0·46 | 1·81 | 6·97 | 8·97 | 25 | 6·16 |
| 30 | 1·00 | 7 | -0·48 | 0·58 | 1·93 | 6·97 | 8·95 | 30 | 5·68 |
| Mean. | 1·53 | 8 | -0·50 | 0·71 | 1·99 | 6·97 | 8·92 | Mean. | 7·04 |
| February. | 9 | -0·50 | 0·82 | 2·08 | 7·06 | 8·88 | Nov. | ||
| 1 | 0·94 | 10 | -0·53 | 0·87 | 2·15 | 7·35 | 8·83 | 1 | 5·48 |
| 5 | 0·80 | 11 | -0·53 | 0·87 | 2·24 | 7·75 | 8·81 | 5 | 5·19 |
| 10 | 0·67 | 12 | -0·53 | 0·84 | 2·38 | 8·16 | 8·77 | 10 | 4·87 |
| 15 | 0·58 | 13 | -0·53 | 0·82 | 2·49 | 8·36 | 8·74 | 15 | 4·58 |
| 20 | 0·44 | 14 | -0·55 | 0·78 | 2·52 | 8·45 | 8·74 | 20 | 4·31 |
| 25 | 0·35 | 15 | -0·55 | 0·71 | 2·71 | 8·47 | 8·74 | 25 | 4·17 |
| 28 | 0·31 | 16 | -0·57 | 0·67 | 2·83 | 8·43 | 8·70 | 30 | 4·00 |
| Mean. | 0·58 | 17 | -0·57 | 0·67 | 2·98 | 8·36 | 8·63 | Mean. | 4·65 |
| March. | 18 | -0·57 | 0·64 | 3·16 | 8·43 | 8·56 | Dec. | ||
| 1 | 0·28 | 19 | -0·59 | 0·64 | 3·25 | 8·50 | 8·47 | 1 | 3·95 |
| 5 | 0·26 | 20 | -0·59 | 0·64 | 3·37 | 8·36 | 8·43 | 5 | 3·73 |
| 10 | 0·19 | 21 | -0·61 | 0·67 | 3·43 | 8·61 | 8·41 | 10 | 3·57 |
| 15 | 0·13 | 22 | -0·64 | 0·73 | 3·66 | 8·68 | 8·45 | 15 | 3·41 |
| 20 | 0·04 | 23 | -0·64 | 0·82 | 4·02 | 8·63 | 8·45 | 20 | 3·28 |
| 25 | -0·01 | 24 | -0·64 | 0·94 | 4·47 | 8·65 | 8·43 | 25 | 3·16 |
| 30 | -0·08 | 25 | -0·64 | 1·12 | 4·87 | 8·68 | 8·38 | 30 | 3·03 |
| Mean. | 0·11 | 26 | -0·66 | 1·30 | 5·21 | 8·74 | 8·34 | Mean. | 3·45 |
| April. | 27 | -0·66 | 1·41 | 5·46 | 8·77 | 8·32 | |||
| 1 | -0·12 | 28 | -0·66 | 1·45 | 5·77 | 8·74 | 8·27 | ||
| 5 | -0·26 | 29 | -0·66 | 1·47 | 6·07 | 8·74 | 8·20 | ||
| 10 | -0·30 | 30 | -0·61 | 1·47 | 6·20 | 8·70 | 8·16 | ||
| 15 | -0·32 | 31 | -0·50 | .. | 6·31 | 8·68 | .. | ||
| 20 | -0·39 | Mean. | -0·54 | 0·74 | 3·27 | 8·00 | 8·62 | ||
| 25 | -0·46 | ||||||||
| 30 | -0·46 | ||||||||
| Mean. | -0·34 | ||||||||
| Zero is R. L. 85·00 metres. | |||||||||
| 1877 | |||||||||
| Date. | Month. | Date. | May. | June. | July. | Au- gust. |
Sept. | Date. | Month. |
| January. | October. | ||||||||
| 1 | 2·62 | 1 | 0·35 | 0·19 | 1·30 | 4·72 | 6·18 | 1 | 6·04 |
| 5 | 2·54 | 2 | 0·37 | 0·22 | 1·48 | 4·74 | 6·20 | 5 | 5·64 |
| 10 | 2·42 | 3 | 0·37 | 0·24 | 1·63 | 4·74 | 6·25 | 10 | 5·21 |
| 15 | 2·26 | 4 | 0·35 | 0·26 | 1·75 | 4·74 | 6·27 | 15 | 4·92 |
| 20 | 2·13 | 5 | 0·35 | 0·28 | 1·81 | 4·88 | 6·27 | 20 | 4·63 |
| 25 | 1·99 | 6 | 0·33 | 0·31 | 1·86 | 4·85 | 6·27 | 25 | 4·53 |
| 30 | 1·81 | 7 | 0·33 | 0·31 | 1·90 | 5·03 | 6·22 | 30 | 4·09 |
| Mean. | 2·25 | 8 | 0·35 | 0·33 | 1·97 | 5·26 | 6·18 | Mean. | 5·01 |
| February. | 9 | 0·40 | 0·37 | 2·04 | 5·39 | 6·11 | Novemb. | ||
| 1 | 1·77 | 10 | 0·42 | 0·46 | 2·13 | 5·35 | 6·09 | 1 | 3·88 |
| 5 | 1·70 | 11 | 0·42 | 0·55 | 2·26 | 5·37 | 6·13 | 5 | 3·73 |
| 10 | 1·57 | 12 | 0·40 | 0·69 | 2·44 | 5·37 | 6·16 | 10 | 3·61 |
| 15 | 1·39 | 13 | 0·37 | 0·80 | 2·71 | 5·41 | 6·13 | 15 | 3·41 |
| 20 | 1·25 | 14 | 0·33 | 0·87 | 3·01 | 5·55 | 6·07 | 20 | 3·23 |
| 25 | 1·17 | 15 | 0·28 | 0·91 | 3·23 | 5·75 | 6·02 | 25 | 2·94 |
| 28 | 1·17 | 16 | 0·26 | 0·96 | 3·32 | 6·07 | 6·00 | 30 | 2·67 |
| Mean. | 1·43 | 17 | 0·24 | 1·03 | 3·32 | 6·18 | 6·02 | Mean. | 3·35 |
| March. | 18 | 0·22 | 1·07 | 3·28 | 6·22 | 6·04 | Decemb. | ||
| 1 | 1·14 | 19 | 0·17 | 1·09 | 3·21 | 6·34 | 6·00 | 1 | 2·60 |
| 5 | 1·09 | 20 | 0·17 | 1·09 | 3·23 | 6·40 | 5·95 | 5 | 2·51 |
| 10 | 0·96 | 21 | 0·15 | 1·09 | 3·32 | 6·29 | 6·02 | 10 | 2·40 |
| 15 | 0·78 | 22 | 0·15 | 1·07 | 3·46 | 6·18 | 6·11 | 15 | 2·22 |
| 20 | 0·69 | 23 | 0·15 | 1·07 | 3·57 | 6·13 | 6·25 | 20 | 2·13 |
| 25 | 0·58 | 24 | 0·15 | 1·07 | 3·64 | 6·13 | 6·27 | 25 | 1·95 |
| 30 | 0·49 | 25 | 0·13 | 1·07 | 3·70 | 6·13 | 6·27 | 30 | 1·97 |
| Mean. | 0·82 | 26 | 0·10 | 1·05 | 3·72 | 6·11 | 6·20 | Mean. | 2·25 |
| April. | 27 | 0·10 | 1·05 | 3·99 | 6·13 | 6·11 | |||
| 1 | 0·46 | 28 | 0·13 | 1·07 | 4·21 | 6·18 | 6·11 | ||
| 5 | 0·40 | 29 | 0·15 | 1·09 | 4·54 | 6·18 | 6·13 | ||
| 10 | 0·33 | 30 | 0·17 | 1·16 | 4·65 | 6·18 | 6·09 | ||
| 15 | 0·31 | 31 | 0·19 | .. | 4·67 | 6·16 | .. | ||
| 20 | 0·42 | Mean. | 0·26 | 0·74 | 2·94 | 5·68 | 6·13 | ||
| 25 | 0·51 | ||||||||
| 30 | 0·35 | ||||||||
| Mean. | 0·40 | ||||||||
| Zero is R. L. 85·00 metres. | |||||||||
| 1878 | |||||||||
| Date. | Month. | Date. | May. | June. | July. | Au- gust. |
Sept. | Date. | Month. |
| January. | October. | ||||||||
| 1 | 1·97 | 1 | -0·41 | -0·66 | 0·67 | 5·39 | 7·60 | 1 | 9·15 |
| 5 | 1·88 | 2 | -0·44 | -0·66 | 0·71 | 5·46 | 7·73 | 5 | 8·92 |
| 10 | 1·75 | 3 | -0·46 | -0·66 | 0·78 | 5·48 | 7·89 | 10 | 8·47 |
| 15 | 1·61 | 4 | -0·48 | -0·66 | 0·87 | 5·55 | 8·02 | 15 | 7·91 |
| 20 | 1·48 | 5 | -0·48 | -0·68 | 0·91 | 5·62 | 8·14 | 20 | 7·60 |
| 25 | 1·39 | 6 | -0·46 | -0·68 | 0·96 | 5·62 | 8·23 | 25 | 7·42 |
| 30 | 1·23 | 7 | -0·46 | -0·71 | 1·00 | 5·53 | 8·32 | 30 | 6·83 |
| Mean. | 1·62 | 8 | -0·48 | -0·71 | 1·03 | 5·41 | 8·38 | Mean. | 8·05 |
| February. | 9 | -0·50 | -0·71 | 1·03 | 5·68 | 8·47 | Novem. | ||
| 1 | 1·21 | 10 | -0·50 | -0·68 | 1·05 | 6·25 | 8·52 | 1 | 6·72 |
| 5 | 1·07 | 11 | -0·50 | -0·66 | 1·07 | 6·31 | 8·56 | 5 | 6·34 |
| 10 | 0·91 | 12 | -0·50 | -0·66 | 1·12 | 6·72 | 8·70 | 10 | 5·86 |
| 15 | 0·80 | 13 | -0·48 | -0·66 | 1·18 | 6·88 | 8·81 | 15 | 5·50 |
| 20 | 0·67 | 14 | -0·48 | -0·66 | 1·27 | 7·06 | 8·86 | 20 | 5·17 |
| 25 | 0·51 | 15 | -0·50 | -0·66 | 1·44 | 7·17 | 8·90 | 25 | 4·92 |
| 28 | 0·46 | 16 | -0·50 | -0·64 | 1·70 | 7·17 | 8·86 | 30 | 4·69 |
| Mean. | 0·80 | 17 | -0·50 | -0·61 | 1·97 | 7·10 | 8·83 | Mean. | 5·60 |
| March | 18 | -0·53 | -0·59 | 2·17 | 7·12 | 8·83 | Decem. | ||
| 1 | 0·44 | 19 | -0·55 | -0·59 | 2·33 | 7·26 | 8·81 | 1 | 4·67 |
| 5 | 0·33 | 20 | -0·57 | -0·59 | 2·47 | 7·48 | 8·86 | 5 | 4·57 |
| 10 | 0·24 | 21 | -0·57 | -0·61 | 2·76 | 7·73 | 8·86 | 10 | 4·38 |
| 15 | 0·17 | 22 | -0·57 | -0·61 | 2·98 | 7·89 | 8·81 | 15 | 4·20 |
| 20 | 0·08 | 23 | -0·59 | -0·59 | 3·33 | 7·96 | 8·86 | 20 | 4·09 |
| 25 | -0·03 | 24 | -0·61 | -0·50 | 3·48 | 8·02 | 8·92 | 25 | 3·93 |
| 30 | -0·05 | 25 | -0·64 | -0·32 | 3·82 | 8·07 | 8·99 | 30 | 3·77 |
| Mean. | 0·17 | 26 | -0·64 | -0·05 | 4·22 | 8·09 | 8·97 | Mean. | 4·23 |
| April. | 27 | -0·64 | 0·19 | 4·45 | 7·91 | 8·92 | |||
| 1 | -0·10 | 28 | -0·66 | 0·40 | 4·63 | 7·69 | 9·01 | ||
| 5 | -0·12 | 29 | -0·68 | 0·58 | 4·78 | 7·57 | 9·08 | ||
| 10 | -0·19 | 30 | -0·68 | 0·64 | 4·96 | 7·53 | 9·13 | ||
| 15 | -0·26 | 31 | -0·68 | .. | 5·21 | 7·55 | .. | ||
| 20 | -0·26 | Mean. | -0·56 | -0·47 | 2·27 | 6·85 | 8·63 | ||
| 25 | -0·37 | ||||||||
| 30 | -0·41 | ||||||||
| Mean. | -0·25 | ||||||||
| Zero is R. L. 85·00 metres. | |||||||||
| 1901 | |||||||||
| Date. | Month. | Date. | May. | June. | July. | Au- gust. |
Sept. | Date. | Month. |
| January. | October. | ||||||||
| 1 | 1·97 | 1 | -0·37 | -0·08 | 0·37 | 3·89 | 7·42 | 1 | 6·56 |
| 5 | 1·93 | 2 | -0·39 | -0·08 | 0·49 | 3·95 | 7·38 | 5 | 6·09 |
| 10 | 1·79 | 3 | -0·41 | -0·10 | 0·67 | 4·02 | 7·44 | 10 | 5·59 |
| 15 | 1·66 | 4 | -0·44 | -0·10 | 0·82 | 4·13 | 7·62 | 15 | 5·06 |
| 20 | 1·57 | 5 | -0·44 | -0·10 | 0·96 | 4·32 | 7·76 | 20 | 4·67 |
| 25 | 1·48 | 6 | -0·46 | -0·12 | 1·05 | 4·67 | 7·82 | 25 | 4·31 |
| 30 | 1·25 | 7 | -0·46 | -0·12 | 1·09 | 5·28 | 7·82 | 30 | 4·15 |
| Mean. | 1·66 | 8 | -0·46 | -0·14 | 1·15 | 5·82 | 7·76 | Mean. | 5·20 |
| February. | 9 | -0·46 | -0·19 | 1·23 | 6·09 | 7·73 | Nov. | ||
| 1 | 1·21 | 10 | -0·46 | -0·21 | 1·39 | 6·23 | 7·71 | 1 | 3·95 |
| 5 | 1·07 | 11 | -0·44 | -0·21 | 1·57 | 6·36 | 7·69 | 5 | 3·75 |
| 10 | 0·96 | 12 | -0·44 | -0·23 | 1·70 | 6·52 | 7·69 | 10 | 3·55 |
| 15 | 0·87 | 13 | -0·41 | -0·26 | 1·81 | 6·61 | 7·67 | 15 | 3·32 |
| 20 | 0·71 | 14 | -0·39 | -0·26 | 1·90 | 6·68 | 7·64 | 20 | 3·07 |
| 25 | 0·67 | 15 | -0·35 | -0·26 | 1·95 | 6·77 | 7·55 | 25 | 2·89 |
| 28 | 0·58 | 16 | -0·30 | -0·26 | 2·05 | 6·97 | 7·48 | 30 | 2·67 |
| Mean. | 0·87 | 17 | -0·26 | -0·23 | 2·24 | 7·31 | 7·55 | Mean. | 3·31 |
| March. | 18 | -0·23 | -0·21 | 2·56 | 7·58 | 7·60 | Dec. | ||
| 1 | 0·55 | 19 | -0·21 | -0·19 | 2·67 | 7·69 | 7·62 | 1 | 2·65 |
| 5 | 0·49 | 20 | -0·19 | -0·17 | 2·78 | 7·80 | 7·55 | 5 | 2·51 |
| 10 | 0·40 | 21 | -0·14 | -0·14 | 2·83 | 7·80 | 7·51 | 10 | 2·35 |
| 15 | 0·27 | 22 | -0·12 | -0·10 | 2·89 | 7·78 | 7·46 | 15 | 2·26 |
| 20 | 0·17 | 23 | -0·12 | -0·05 | 3·01 | 7·75 | 7·37 | 20 | 2·17 |
| 25 | 0·08 | 24 | -0·10 | -0·03 | 3·07 | 7·73 | 7·25 | 25 | 2·08 |
| 30 | -0·03 | 25 | -0·08 | -0·01 | 3·26 | 7·62 | 7·22 | 30 | 1·90 |
| Mean. | 0·27 | 26 | -0·08 | 0·06 | 3·48 | 7·53 | 7·10 | Mean. | 2·27 |
| April. | 27 | -0·05 | 0·10 | 3·61 | 7·49 | 6·99 | |||
| 1 | -0·07 | 28 | -0·03 | 0·22 | 3·66 | 7·44 | 6·63 | ||
| 5 | -0·10 | 29 | -0·01 | 0·31 | 3·68 | 7·39 | 6·70 | ||
| 10 | -0·17 | 30 | -0·03 | 0·35 | 3·73 | 7·35 | 6·61 | ||
| 15 | -0·24 | 31 | -0·08 | .. | 3·80 | 7·42 | .. | ||
| 20 | -0·26 | Mean. | -0·27 | -0·09 | 2·18 | 6·51 | 7·44 | ||
| 25 | -0·28 | ||||||||
| 30 | -0·32 | ||||||||
| Mean. | -0·20 | ||||||||
| Zero is R. L. 85·00 metres. | |||||||||
| 1902 | |||||||||
| Date. | Month. | Date. | May. | June. | July. | Au- gust. |
Sept. | Date. | Month. |
| January. | October. | ||||||||
| 1 | 1·86 | 1 | -0·39 | -0·46 | 0·42 | 2·56 | 6·16 | 1 | 6·20 |
| 5 | 1·79 | 2 | -0·39 | -0·48 | 0·49 | 2·65 | 6·13 | 5 | 6·00 |
| 10 | 1·61 | 3 | -0·39 | -0·50 | 0·49 | 2·69 | 6·09 | 10 | 5·89 |
| 15 | 1·41 | 4 | -0·37 | -0·53 | 0·49 | 2·76 | 6·09 | 15 | 5·64 |
| 20 | 1·21 | 5 | -0·39 | -0·55 | 0·49 | 2·83 | 6·20 | 20 | 5·30 |
| 25 | 0·98 | 6 | -0·41 | -0·57 | 0·46 | 2·92 | 6·38 | 25 | 4·67 |
| 30 | 0·85 | 7 | -0·41 | -0·52 | 0·46 | 3·03 | 6·45 | 30 | 4·09 |
| Mean. | 1·38 | 8 | -0·43 | -0·52 | 0·49 | 3·10 | 6·45 | Mean. | 5·40 |
| February. | 9 | -0·46 | -0·50 | 0·56 | 3·16 | 6·40 | Nov. | ||
| 1 | 0·78 | 10 | -0·46 | -0·46 | 0·65 | 3·25 | 6·36 | 1 | 3·97 |
| 5 | 0·67 | 11 | -0·46 | -0·37 | 0·83 | 3·41 | 6·31 | 5 | 3·77 |
| 10 | 0·62 | 12 | -0·48 | -0·35 | 0·87 | 3·66 | 6·36 | 10 | 3·37 |
| 15 | 0·49 | 13 | -0·48 | -0·30 | 0·94 | 4·00 | 6·37 | 15 | 3·10 |
| 20 | 0·42 | 14 | -0·48 | -0·30 | 0·96 | 4·29 | 6·47 | 20 | 2·85 |
| 25 | 0·33 | 15 | -0·46 | -0·26 | 1·01 | 4·42 | 6·58 | 25 | 2·60 |
| 28 | 0·26 | 16 | -0·43 | -0·30 | 1·07 | 4·56 | 6·65 | 30 | 2·30 |
| Mean. | 0·51 | 17 | -0·41 | -0·23 | 1·23 | 4·67 | 6·72 | Mean. | 3·15 |
| March. | 18 | -0·39 | -0·21 | 1·39 | 4·78 | 6·72 | Dec. | ||
| 1 | 0·22 | 19 | -0·39 | -0·28 | 1·54 | 4·87 | 6·65 | 1 | 2·33 |
| 5 | 0·15 | 20 | -0·39 | -0·30 | 1·61 | 4·94 | 6·58 | 5 | 2·31 |
| 10 | 0·10 | 21 | -0·41 | -0·32 | 1·66 | 5·08 | 6·58 | 10 | 2·15 |
| 15 | 0·01 | 22 | -0·39 | -0·32 | 1·70 | 5·28 | 6·61 | 15 | 2·04 |
| 20 | -0·08 | 23 | -0·37 | -0·30 | 1·77 | 5·39 | 6·58 | 20 | 1·81 |
| 25 | -0·17 | 24 | -0·39 | -0·23 | 1·87 | 5·42 | 6·52 | 25 | 1·79 |
| 30 | -0·21 | 25 | -0·39 | -O·16 | 1·97 | 5·37 | 6·47 | 30 | 1·55 |
| Mean. | 0·00 | 26 | -0·39 | -0·05 | 2·08 | 5·32 | 6·43 | Mean. | 2·00 |
| April. | 27 | -0·41 | 0·11 | 2·20 | 5·32 | 6·36 | |||
| 1 | -0·21 | 28 | -0·43 | 0·20 | 2·29 | 5·44 | 6·31 | ||
| 5 | -0·23 | 29 | -0·43 | 0·24 | 2·38 | 5·71 | 6·27 | ||
| 10 | -0·30 | 30 | -O·46 | 0·33 | 2·45 | 5·96 | 6·23 | ||
| 15 | -0·26 | 31 | -0·46 | .. | 2·54 | 6·11 | .. | ||
| 20 | -0·23 | Mean. | -0·42 | -0·28 | 1·27 | 4·29 | 6·41 | ||
| 25 | -0·30 | ||||||||
| 30 | -0·39 | ||||||||
| Mean. | -0·27 | ||||||||
| Zero is R. L. 85·00 metres. | |||||||||
| 1903 | |||||||||
| Date. | Month. | Date. | May. | June. | July. | Au- gust. |
Sept. | Date. | Month. |
| January. | October. | ||||||||
| 1 | 1·52 | 1 | -0·62 | -0·19 | 1·07 | 3·14 | 7·37 | 1 | 7·30 |
| 5 | 1·66 | 2 | -0·64 | -0·19 | 1·16 | 3·21 | 7·39 | 5 | 7·06 |
| 10 | 1·34 | 3 | -0·62 | -0·19 | 1·27 | 3·32 | 7·35 | 10 | 6·58 |
| 15 | 1·36 | 4 | -0·59 | +0-01 | 1·39 | 3·52 | 7·39 | 15 | 6·40 |
| 20 | 1·32 | 5 | -0·52 | -0·05 | 1·48 | 3·77 | 7·53 | 20 | 6·07 |
| 25 | 1·07 | 6 | -0·52 | -0·03 | 1·52 | 3·95 | 7·58 | 25 | 5·55 |
| 30 | 1·07 | 7 | -0·50 | +0·01 | 1·52 | 4·11 | 7·56 | 30 | 5·30 |
| Mean. | 1·33 | 8 | -0·57 | 0·01 | 1·52 | 4·13 | 7·62 | Mean. | 6·32 |
| February. | 9 | -0·57 | -0·03 | 1·52 | 4·11 | 7·02 | Novemb. | ||
| 1 | 0·85 | 10 | -0·57 | -0·01 | 1·55 | 4·09 | 7·62 | 1 | 5·46 |
| 5 | 0·82 | 11 | -0·59 | 0·01 | 1·57 | 4·13 | 7·68 | 5 | 5·15 |
| 10 | 0·73 | 12 | -0·59 | 0·01 | 1·59 | 4·34 | 7·75 | 10 | 4·67 |
| 15 | 0·51 | 13 | -0·59 | 0·06 | 1·59 | 4·90 | 7·75 | 15 | 4·25 |
| 20 | 0·40 | 14 | -0·64 | 0·08 | 1·66 | 5·44 | 7·73 | 20 | 4·06 |
| 25 | 0·28 | 15 | -0·55 | 0·13 | 1·68 | 5·73 | 7·66 | 25 | 3·52 |
| 28 | 0·06 | 16 | -0·55 | 0·20 | 1·72 | 5·91 | 7·64 | 30 | 3·21 |
| Mean. | 0·52 | 17 | -0·55 | 0·20 | 1·75 | 6·04 | 7·62 | Mean. | 4·33 |
| March. | 18 | -0·57 | 0·74 | 1·82 | 6·13 | 7·58 | Decemb. | ||
| 1 | 0·06 | 19 | -0·57 | 0·94 | 1·91 | 6·34 | 7·55 | 1 | 3·16 |
| 5 | 0·10 | 20 | -0·55 | 1·10 | 2·02 | 6·65 | 7·48 | 5 | 3·03 |
| 10 | 0·10 | 21 | -0·48 | 1·12 | 2·18 | 7·01 | 7·42 | 10 | 2·71 |
| 15 | -0·03 | 22 | -0·28 | 1·23 | 2·33 | 7·21 | 7·35 | 15 | 2·51 |
| 20 | -0·05 | 23 | -0·28 | 1·34 | 2·44 | 7·39 | 7·35 | 20 | 2·33 |
| 25 | -0·26 | 24 | -0·21 | 1·14 | 2·47 | 7·49 | 7·28 | 25 | 2·31 |
| 30 | -0·28 | 25 | -0·35 | 1·12 | 2·56 | 7·66 | 7·33 | 30 | 2·15 |
| Mean. | -0·05 | 26 | -0·35 | 1·27 | 2·69 | 7·82 | 7·35 | Mean. | 2·60 |
| April. | 27 | -0·37 | 1·30 | 2·85 | 7·93 | 7·35 | |||
| 1 | -0·28 | 28 | -0·37 | 0·92 | 2·96 | 7·84 | 7·33 | ||
| 5 | -0·23 | 29 | -0·34 | 0·92 | 3·03 | 7·66 | 7·35 | ||
| 10 | -0·39 | 30 | -0·28 | 0·98 | 3·07 | 7·53 | 7·33 | ||
| 15 | -0·48 | 31 | -0·14 | .. | 3·12 | 7·46 | .. | ||
| 20 | -0·39 | Mean. | -0·48 | 0·47 | 1·97 | 5·68 | 7·50 | ||
| 25 | -0·59 | ||||||||
| 30 | -0·62 | ||||||||
| Mean. | -0·43 | ||||||||
| Zero is R. L. 85·00 metres. | |||||||||
| 1904 | |||||||||
| Date. | Month. | Date. | May. | June. | July. | Au- gust. |
Sept. | Date. | Month. |
| January. | October. | ||||||||
| 1 | 2·11 | 1 | -0·08 | 0·26 | 0·94 | 4·45 | 6·34 | 1 | .. |
| 5 | 2·13 | 2 | -0·12 | 0·28 | 0·89 | 4·49 | 6·34 | 5 | .. |
| 10 | 1·95 | 3 | -0·14 | 0·28 | 0·87 | 4·60 | 6·27 | 10 | .. |
| 15 | 1·86 | 4 | -0·21 | 0·28 | 0·87 | 4·87 | 6·27 | 15 | .. |
| 20 | 1·79 | 5 | -0·21 | 0·28 | 0·85 | 5·10 | 6·47 | 20 | .. |
| 25 | 1·68 | 6 | -0·19 | 0·33 | 0·83 | 5·28 | 6·61 | 25 | .. |
| 30 | 1·57 | 7 | -0·19 | 0·60 | 0·83 | 5·50 | 6·63 | 30 | .. |
| Mean. | 1·87 | 8 | -0·17 | 0·65 | 0·83 | 5·84 | 6·58 | Mean. | .. |
| February. | 9 | -0·14 | 0·67 | 0·80 | 6·11 | 6·52 | Novem. | ||
| 1 | 1·57 | 10 | -0·14 | 0·69 | 0·78 | 6·38 | 6·47 | 1 | .. |
| 5 | 1·52 | 11 | -0·05 | 0·71 | 0·78 | 6·63 | 6·52 | 5 | .. |
| 10 | 1·43 | 12 | +0·14 | 0·85 | 0·78 | 6·85 | 6·58 | 10 | .. |
| 15 | 1·36 | 13 | 0·04 | 0·89 | 0·78 | 6·97 | 6·74 | 15 | .. |
| 20 | 1·29 | 14 | 0·01 | 0·94 | 0·80 | 6·92 | 6·88 | 20 | .. |
| 25 | 1·27 | 15 | -0·05 | 0·92 | 0·83 | 6·85 | 6·83 | 25 | .. |
| 28 | 1·17 | 16 | -0·05 | 0·96 | 0·87 | 6·74 | .. | 30 | .. |
| Mean. | 1·37 | 17 | -0·05 | 1·05 | 0·94 | 6·65 | .. | Mean. | .. |
| March. | 18 | -0·05 | 1·14 | 1·03 | 6·61 | .. | Decem. | ||
| 1 | 1·03 | 19 | -0·05 | 1·18 | 1·28 | 6·56 | .. | 1 | .. |
| 5 | 0·74 | 20 | -0·05 | 1·23 | 1·61 | 6·54 | .. | 5 | .. |
| 10 | 0·71 | 21 | 0·15 | 1·21 | 2·15 | 6·54 | .. | 10 | .. |
| 15 | 0·69 | 22 | 0·10 | 1·21 | 2·62 | 6·49 | .. | 15 | .. |
| 20 | 0·46 | 23 | 0·13 | 1·18 | 2·92 | 6·47 | .. | 20 | .. |
| 25 | 0·42 | 24 | 0·13 | 1·21 | 3·08 | 6·43 | .. | 25 | .. |
| 30 | 0·20 | 25 | 0·15 | 1·16 | 3·16 | 6·40 | .. | 30 | .. |
| Mean. | 0·60 | 26 | 0·13 | 1·14 | 3·23 | 6·43 | .. | Mean. | .. |
| April. | 27 | 0·10 | 1·16 | 3·43 | 6·36 | .. | |||
| 1 | 0·13 | 28 | 0·10 | 1·21 | 3·70 | 6·34 | .. | ||
| 5 | -0·10 | 29 | 0·06 | 1·12 | 4·02 | 6·27 | .. | ||
| 10 | -0·12 | 30 | 0·06 | 1·07 | 4·27 | 6·25 | .. | ||
| 15 | 0·04 | 31 | 0·04 | .. | 4·42 | 6·29 | .. | ||
| 20 | 0·06 | Mean. | -0·02 | 0·86 | 1·78 | 6·14 | .. | ||
| 25 | 0·04 | ||||||||
| 30 | -0·03 | ||||||||
| Mean. | 0·00 | ||||||||
| Zero is R. L. 85·00 metres. | |||||||||
[202]
| R. L. of Zero 85·00 metres. | |||||||||||||
| Year. | Date. | Jan. | Feb. | Mar. | Apr. | May | Jun. | Jul. | Aug. | Sep. | Oct. | Nov. | Dec. |
|---|---|---|---|---|---|---|---|---|---|---|---|---|---|
| 1902 | 1 | .. | .. | .. | .. | .. | .. | .. | .. | .. | .. | 12·80 | 17·77 |
| 5 | .. | .. | .. | .. | .. | .. | .. | .. | .. | .. | 13·72 | 18·16 | |
| 10 | .. | .. | .. | .. | .. | .. | .. | .. | .. | .. | 14·91 | 18·59 | |
| 15 | .. | .. | .. | .. | .. | .. | .. | .. | .. | .. | 15·73 | 19·02 | |
| 20 | .. | .. | .. | .. | .. | .. | .. | .. | .. | 9·90 | 16·58 | 19·39 | |
| 25 | .. | .. | .. | .. | .. | .. | .. | .. | .. | 10·98 | 17·18 | 19·77 | |
| 30 | .. | .. | .. | .. | .. | .. | .. | .. | .. | 12·50 | 17·67 | 20·25 | |
| Mean | .. | .. | .. | .. | .. | .. | .. | .. | .. | .. | 15·51 | 19·00 | |
| 1903 | 1 | 20·30 | 21·00 | 21·05 | 20·67 | 19·76 | 17·63 | .. | .. | .. | .. | .. | 10·56 |
| 5 | 20·38 | 21·13 | 21·09 | 20·55 | 19·63 | 16·85 | .. | .. | .. | .. | .. | 10·53 | |
| 10 | 20·41 | 21·06 | 21·00 | 20·34 | 19·39 | 15·69 | .. | .. | .. | .. | 10·63 | 12·10 | |
| 15 | 20·61 | 21·03 | 20·92 | 20·19 | 19·18 | 14·41 | .. | .. | .. | .. | 10·53 | 13·33 | |
| 20 | 20·67 | 21·06 | 20·79 | 19·99 | 18·98 | 12·42 | .. | .. | .. | .. | 6·90 | 14·49 | |
| 25 | 20·86 | 21·00 | 20·75 | 19·89 | 18·48 | 9·43 | .. | .. | .. | .. | 10·59 | 15·18 | |
| 30 | 20·96 | 21·03 | 20·68 | 19·72 | 17·97 | 7·07 | .. | .. | .. | .. | 10·57 | 16·14 | |
| Mean | 20·60 | 21·04 | 20·90 | 20·19 | 19·05 | 13·47 | .. | .. | .. | .. | .. | 13·19 | |
| 1904 | 1 | 16·29 | 19·18 | 20·44 | 20·91 | 20·94 | 19·66 | .. | .. | .. | .. | .. | .. |
| 5 | 16·80 | 19·42 | 20·72 | 21·00 | 20·99 | 19·06 | .. | .. | .. | .. | .. | .. | |
| 10 | 17·37 | 19·70 | 21·01 | 21·15 | 21·09 | 17·97 | .. | .. | .. | .. | .. | .. | |
| 15 | 17·81 | 20·00 | 20·96 | 21·25 | 20·91 | 16·22 | .. | .. | .. | .. | .. | .. | |
| 20 | 18·26 | 20·28 | 21·01 | 21·16 | 20·73 | 13·84 | .. | .. | .. | .. | .. | .. | |
| 25 | 18·66 | 20·37 | 20·94 | 21·06 | 20·33 | 10·26 | .. | .. | .. | .. | .. | .. | |
| 30 | 19·13 | 20·41 | 20·90 | 20·96 | 19·83 | 6·56 | .. | .. | .. | .. | .. | .. | |
| Mean | 17·76 | 19·91 | 20·85 | 21·07 | 20·69 | 14·80 | .. | .. | .. | .. | .. | .. | |
| Zero is R. L. 85·00 metres. | |||||||||||||
[203]
Mean of 20 years 1873-1892.
| Year. | Date. | Jan. | Feb. | Mar. | Apr. | May. | Jun. | Jul. | Aug. | Sep. | Oct. | Nov. | Dec. |
|---|---|---|---|---|---|---|---|---|---|---|---|---|---|
| 5 | 2·8 | 2·2 | 1·8 | 1·5 | 1·1 | 0·9 | 1·1 | 4·1 | 6·5 | 6·9 | 5·6 | 3·6 | |
| 10 | 2·7 | 2·2 | 1·8 | 1·4 | 1·1 | 0·9 | 1·3 | 4·9 | 6·7 | 6·9 | 5·1 | 3·4 | |
| 15 | 2·6 | 2·1 | 1·7 | 1·3 | 1·1 | 0·9 | 1·5 | 5·7 | 6·8 | 6·8 | 4·7 | 3·3 | |
| 20 | 2·5 | 2·0 | 1·6 | 1·3 | 1·1 | 0·9 | 1·8 | 5·9 | 6·9 | 6·8 | 4·3 | 3·2 | |
| 25 | 2·4 | 1·9 | 1·6 | 1·2 | 1·0 | 1·0 | 2·2 | 6·2 | 7·0 | 6·7 | 4·0 | 3·0 | |
| End. | 2·3 | 1·9 | 1·5 | 1·2 | 1·0 | 1·1 | 2·9 | 6·4 | 7·1 | 6·2 | 3·8 | 2·9 | |
| 1877 | 5 | 2·7 | 2·2 | 1·5 | 1·3 | 1·1 | 0·7 | 1·2 | 3·6 | 5·2 | 5·2 | 3·9 | 2·9 |
| 10 | 2·7 | 2·1 | 1·4 | 1·3 | 1·0 | 0·7 | 1·2 | 4·0 | 5·3 | 5·0 | 3·6 | 2·7 | |
| 15 | 2·6 | 1·9 | 1·4 | 1·2 | 1·0 | 0·7 | 1·4 | 4·7 | 5·2 | 4·9 | 3·7 | 2·6 | |
| 20 | 2·6 | 1·8 | 1·3 | 1·1 | 1·0 | 0·8 | 1·6 | 4·6 | 5·2 | 4·6 | 3·7 | 2·5 | |
| 25 | 2·5 | 1·7 | 1·4 | 1·1 | 1·0 | 1·0 | 2·4 | 5·3 | 5·1 | 4·4 | 3·5 | 2·4 | |
| End. | 2·3 | 1·7 | 1·4 | 1·0 | 1·9 | 1·3 | 2·8 | 5·3 | 5·3 | 4·2 | 3·1 | 2·3 | |
| Mean. | 2·6 | 1·9 | 1·4 | 1·2 | 1·0 | 0·9 | 1·8 | 4·6 | 5·2 | 4·7 | 3·6 | 2·6 | |
| 1878 | 5 | 2·2 | 1·6 | 1·0 | 0·6 | 0·3 | 0·0 | -0·2 | 4·1 | 6·5 | 8·4 | 7·5 | 4·9 |
| 10 | 2·1 | 1·5 | 0·9 | 0·6 | 0·2 | 0·0 | 0·4 | 4·9 | 6·8 | 8·7 | 7·4 | 4·7 | |
| 15 | 2·1 | 1·3 | 0·9 | 0·5 | 0·2 | 0·0 | 0·8 | 5·4 | 7·2 | 8·4 | 6·9 | 4·5 | |
| 20 | 1·9 | 1·2 | 1·0 | 0·5 | 0·2 | -0·2 | 1·0 | 6·0 | 7·6 | 8·1 | 6·2 | 4·4 | |
| 25 | 1·8 | 1·1 | 0·8 | 0·4 | 0·1 | -0·2 | 1·4 | 6·3 | 7·9 | 7·9 | 5·5 | 4·2 | |
| End. | 1·7 | 1·1 | 0·8 | 0·3 | 0·0 | -0·2 | 2·6 | 6·6 | 8·2 | 7·7 | 5·5 | 4·0 | |
| Mean. | 1·9 | 1·3 | 0·9 | 0·5 | 0·2 | -0·1 | 1·0 | 5·5 | 7·4 | 8·2 | 6·5 | 4·4 | |
| 1879 | 5 | 3·7 | 3·2 | 2·7 | 2·5 | 2·2 | 2·0 | 2·1 | 5·1 | 7·1 | 7·9 | 5·9 | 4·4 |
| 10 | 3·6 | 3·0 | 2·7 | 2·5 | 2·2 | 2·1 | 2·1 | 5·9 | 7·0 | 7·5 | 5·4 | 4·0 | |
| 15 | 3·5 | 2·9 | 2·6 | 2·5 | 2·2 | 2·3 | 2·6 | 6·5 | 7·2 | 7·6 | 5·0 | 3·8 | |
| 20 | 3·4 | 2·9 | 2·6 | 2·4 | 2·1 | 2·2 | 3·5 | 6·9 | 7·7 | 7·4 | 4·7 | 3·7 | |
| 25 | 3·3 | 2·8 | 2·5 | 2·3 | 2·1 | 2·2 | 3·9 | 7·0 | 8·0 | 7·3 | 4·5 | 3·5 | |
| End. | 3·2 | 2·8 | 2·5 | 2·3 | 2·0 | 2·1 | 4·9 | 7·1 | 8·1 | 6·6 | 4·3 | 3·5 | |
| Mean. | 3·5 | 2·9 | 2·6 | 2·4 | 2·1 | 2·1 | 3·2 | 6·4 | 7·5 | 7·4 | 5·0 | 3·8 | |
| Referred to zero as R. L. 12·25. | |||||||||||||
[204-
206]
| 1902 | |||||||||
| Date. | Month. | Date. | May. | June. | July. | August. | Sept. | Date. | Month. |
|---|---|---|---|---|---|---|---|---|---|
| January. | October. | ||||||||
| 1 | 2·78 | 1 | 2·08 | 1·73 | 1·79 | 3·66 | 4·87 | 1 | 5·68 |
| 5 | 2·74 | 2 | 2·07 | 1·75 | 1·78 | 3·61 | 4·92 | 5 | 5·60 |
| 10 | 2·68 | 3 | 2·02 | 1·75 | 1·76 | 3·64 | 5·01 | 10 | 5·51 |
| 15 | 2·49 | 4 | 2·00 | 1·78 | 1·75 | 3·64 | 5·14 | 15 | 5·57 |
| 20 | 2·25 | 5 | 2·00 | 1·80 | 1·75 | 3·66 | 5·23 | 20 | 5·66 |
| 25 | 2·16 | 6 | 2·00 | 1·80 | 1·76 | 3·66 | 5·28 | 25 | 5·50 |
| 30 | 2·27 | 7 | 2·00 | 1·80 | 1·79 | 3·68 | 5·30 | 30 | 5·22 |
| Mean. | 2·45 | 8 | 1·98 | 1·82 | 1·88 | 3·72 | 5·30 | Mean. | 5·53 |
| February. | 9 | 1·99 | 1·83 | 1·98 | 3·77 | 5·35 | Nov. | ||
| 1 | 2·27 | 10 | 1·99 | 1·82 | 2·07 | 3·80 | 5·41 | 1 | 5·11 |
| 5 | 2·25 | 11 | 1·98 | 1·80 | 2·16 | 3·81 | 5·49 | 5 | 4·96 |
| 10 | 2·20 | 12 | 1·98 | 1·80 | 2·25 | 3·84 | 5·54 | 10 | 4·65 |
| 15 | 2·20 | 13 | 1·96 | 1·81 | 2·32 | 3·86 | 5·55 | 15 | 4·44 |
| 20 | 2·27 | 14 | 1·96 | 1·80 | 2·38 | 3·88 | 5·53 | 20 | 4·38 |
| 25 | 2·22 | 15 | 1·94 | 1·80 | 2·41 | 3·90 | 5·52 | 25 | 3·95 |
| 28 | 2·37 | 16 | 1·94 | 1·79 | 2·47 | 3·93 | 5·53 | 30 | 3·91 |
| Mean. | 2·25 | 17 | 1·91 | 1·78 | 2·50 | 3·95 | 5·55 | Mean. | 4·49 |
| March. | 18 | 1·86 | 1·76 | 2·52 | 3·97 | 5·56 | Dec. | ||
| 1 | 2·37 | 19 | 1·86 | 1·71 | 2·56 | 4·02 | 5·58 | 1 | 3·93 |
| 5 | 2·32 | 20 | 1·86 | 1·68 | 2·58 | 4·13 | 5·64 | 5 | 3·70 |
| 10 | 2·30 | 21 | 1·86 | 1·66 | 2·64 | 4·26 | 5·67 | 10 | 3·29 |
| 15 | 2·34 | 22 | 1·84 | 1·64 | 2·70 | 4·33 | 5·74 | 15 | 3·05 |
| 20 | 2·30 | 23 | 1·82 | 1·66 | 2·82 | 4·40 | 5·77 | 20 | 3·05 |
| 25 | 2·29 | 24 | 1·82 | 1·69 | 2·94 | 4·47 | 5·77 | 25 | 2·95 |
| 30 | 2·29 | 25 | 1·80 | 1·71 | 3·05 | 4·51 | 5·77 | 30 | 2·78 |
| Mean. | 2·32 | 26 | 1·80 | 1·76 | 3·13 | 4·58 | 5·71 | Mean. | 3·25 |
| April. | 27 | 1·78 | 1·78 | 3·23 | 4·65 | 5·70 | |||
| 1 | 2·29 | 28 | 1·78 | 1·80 | 3·35 | 4·72 | 5·69 | ||
| 5 | 2·27 | 29 | 1·77 | 1·80 | 3·50 | 4·79 | 5·69 | ||
| 10 | 2·09 | 30 | 1·75 | 1·80 | 3·54 | 4·83 | 5·68 | ||
| 15 | 2·12 | 31 | 1·74 | .. | 3·57 | 4·85 | .. | ||
| 20 | 2·12 | Mean. | 1·92 | 1·76 | 2·45 | 4·07 | 5·44 | ||
| 25 | 2·07 | ||||||||
| 30 | 2·08 | ||||||||
| Mean. | 2·15 | ||||||||
| Zero is R. L. 12·25 metres. | |||||||||
| 1903 | |||||||||
| Date. | Month. | Date. | May. | June. | July. | August. | Sept. | Date. | Month. |
| January. | October. | ||||||||
| 1 | 2·78 | 1 | 2·03 | 1·87 | 3·25 | 3·73 | 6·18 | 1 | 6·19 |
| 5 | 2·69 | 2 | 2·02 | 1·93 | 3·48 | 3·76 | 6·11 | 5 | 6·34 |
| 10 | 2·64 | 3 | 2·00 | 1·96 | 3·55 | 3·76 | 6·11 | 10 | 6·63 |
| 15 | 2·67 | 4 | 2·00 | 1·98 | 3·54 | 3·78 | 6·09 | 15 | 6·61 |
| 20 | 2·51 | 5 | 1·96 | 1·98 | 3·59 | 3·80 | 6·06 | 20 | 6·72 |
| 25 | 2·43 | 6 | 1·93 | 1·98 | 3·57 | 3·84 | 6·04 | 25 | 6·90 |
| 30 | 2·36 | 7 | 1·89 | 1·98 | 3·54 | 3·89 | 6·02 | 30 | 5·91 |
| Mean. | 2·56 | 8 | 1·84 | 1·99 | 3·57 | 3·89 | 6·05 | Mean. | 6·47 |
| February. | 9 | 1·81 | 2·00 | 3·54 | 3·91 | 6·07 | Nov. | ||
| 1 | 10 | 1·79 | 2·03 | 3·55 | 3·92 | 6·14 | 1 | 6·18 | |
| 5 | 2·47 | 11 | 1·77 | 2·06 | 3·57 | 3·94 | 6·18 | 5 | 6·15 |
| 10 | 2·43 | 12 | 1·79 | 2·06 | 3·57 | 4·02 | 6·21 | 10 | 5·90 |
| 15 | 2·38 | 13 | 1·79 | 2·07 | 3·57 | 4·06 | 6·25 | 15 | 5·23 |
| 20 | 2·38 | 14 | 1·77 | 2·08 | 3·59 | 4·19 | 5·27 | 20 | 4·67 |
| 25 | 2·33 | 15 | 1·75 | 2·10 | 3·60 | 4·24 | 6·29 | 25 | 4·50 |
| 28 | 2·30 | 16 | 1·79 | 2·16 | 3·62 | 4·33 | 6·33 | 30 | 4·26 |
| Mean. | 2·38 | 17 | 1·79 | 2·20 | 3·64 | 4·40 | 6·36 | Mean. | 5·27 |
| March. | 18 | .. | 2·20 | 3·66 | 4·49 | 6·39 | Dec. | ||
| 1 | 2·29 | 19 | .. | 2·25 | 3·64 | 4·69 | 6·41 | 1 | 4·22 |
| 5 | 2·24 | 20 | 1·75 | 2·32 | 3·68 | 4·89 | 6·41 | 5 | 4·08 |
| 10 | 2·36 | 21 | 1·75 | 2·36 | 3·64 | 5·03 | 6·39 | 10 | 3·99 |
| 15 | 2·32 | 22 | 1·76 | 2·39 | 3·66 | 5·15 | 6·36 | 15 | 3·50 |
| 20 | 2·33 | 23 | 1·77 | 3·66 | 6·33 | 20 | 3·33 | ||
| 25 | 2·41 | 24 | 1·75 | 2·45 | 3·66 | 5·40 | 6·28 | 25 | 3·01 |
| 30 | 2·42 | 25 | 1·78 | 2·48 | 3·69 | 5·55 | 6·25 | 30 | 2·86 |
| Mean. | 2·34 | 26 | .. | 2·50 | 3·68 | 5·72 | 6·20 | Mean. | 3·57 |
| April. | 27 | 1·80 | 2·54 | 3·69 | 5·84 | 6·15 | |||
| 1 | 2·40 | 28 | 1·83 | 2·61 | 3·69 | 5·93 | 6·11 | ||
| 5 | 2·38 | 29 | 1·85 | 2·82 | 3·66 | 6·05 | 6·10 | ||
| 10 | 2·25 | 30 | 1·83 | 3·01 | 3·70 | 6·15 | 6·15 | ||
| 15 | 2·22 | 31 | 1·83 | .. | 3·72 | 6·18 | .. | ||
| 20 | 2·40 | Mean. | 1·84 | 2·25 | 3·58 | 4·61 | 6·22 | ||
| 25 | 2·20 | ||||||||
| 30 | 2·04 | ||||||||
| Mean. | 2·27 | ||||||||
| Zero is R. L. 12·25 metres. | |||||||||
| 1904 | |||||||||
| Date. | Month. | Date. | May. | June. | July. | August. | Sept. | Date. | Month. |
| January. | October. | ||||||||
| 1 | 2·82 | 1 | 2·58 | 2·60 | 3·59 | 3·88 | 5·68 | 1 | .. |
| 5 | 2·69 | 2 | 2·58 | 2·65 | 3·59 | 3·93 | 5·66 | 5 | .. |
| 10 | 2·12 | 3 | 2·56 | 3·05 | 3·57 | 4·04 | 5·64 | 10 | .. |
| 15 | 2·54 | 4 | 2·56 | 2·90 | 3·56 | 4·15 | 5·62 | 15 | .. |
| 20 | 2·47 | 5 | 2·57 | 2·75 | 3·59 | 4·26 | 5·65 | 20 | .. |
| 25 | 2·41 | 6 | 2·57 | 2·80 | 3·59 | 4·38 | 5·65 | 25 | .. |
| 30 | 2·44 | 7 | 2·54 | 2·84 | 3·59 | 4·47 | 5·66 | 30 | .. |
| Mean. | 2·50 | 8 | 2·56 | 2·86 | 3·57 | 4·56 | 5·67 | Mean. | .. |
| February. | 9 | 2·54 | 2·88 | 3·57 | 4·65 | 5·69 | Novem. | ||
| 1 | 2·50 | 10 | 2·54 | 2·92 | 3·54 | 4·76 | 5·75 | 1 | .. |
| 5 | 2·62 | 11 | 2·52 | 2·97 | 3·54 | 4·84 | 5·79 | 5 | .. |
| 10 | 2·74 | 12 | 2·52 | 3·01 | 3·54 | 5·14 | 5·83 | 10 | .. |
| 15 | 2·70 | 13 | 2·54 | — | 3·55 | 5·40 | 5·84 | 15 | .. |
| 20 | 2·66 | 14 | 2·56 | 3·08 | 3·54 | 5·62 | 5·82 | 20 | .. |
| 25 | 2·83 | 15 | 2·54 | 3·09 | 3·57 | 5·80 | 5·80 | 25 | .. |
| 28 | 2·83 | 16 | 2·52 | 3·07 | 3·54 | 5·94 | 5·83 | 30 | .. |
| Mean. | 2·70 | 17 | 2·50 | 3·10 | 3·54 | 5·95 | 5·85 | Mean. | .. |
| March. | 18 | 2·54 | 3·15 | 3·54 | 5·97 | 5·89 | Decem. | ||
| 1 | 2·73 | 19 | 2·54 | 3·23 | 3·54 | 5·97 | 5·93 | 1 | .. |
| 5 | 2·79 | 20 | 2·52 | 3·35 | 3·52 | 5·93 | 5·92 | 5 | .. |
| 10 | 2·75 | 21 | 2·52 | 3·50 | 3·52 | 5·91 | 5·92 | 10 | .. |
| 15 | 2·70 | 22 | 2·52 | 3·57 | 3·54 | 5·86 | 5·89 | 15 | .. |
| 20 | 2·70 | 23 | 2·52 | 3·59 | 3·54 | 5·82 | 5·86 | 20 | .. |
| 25 | 2·66 | 24 | 2·51 | 3·60 | 3·54 | 5·77 | 5·80 | 25 | .. |
| 30 | 2·60 | 25 | 2·52 | 3·55 | 3·57 | 5·75 | .. | 30 | .. |
| Mean. | 2·70 | 26 | 2·56 | 3·55 | 3·57 | 5·74 | .. | Mean. | .. |
| April. | 27 | 2·57 | 3·57 | 3·57 | 5·73 | .. | |||
| 1 | 2·61 | 28 | 2·58 | 3·57 | 3·57 | 5·70 | .. | ||
| 5 | 2·61 | 29 | 2·56 | 3·58 | 3·59 | 5·69 | .. | ||
| 10 | 2·56 | 30 | 2·54 | 3·58 | 3·73 | 5·68 | .. | ||
| 15 | 2·60 | 31 | 2·56 | .. | 3·88 | 5·68 | .. | ||
| 20 | 2·38 | Mean. | 2·55 | 3·12 | 3·14 | 5·15 | .. | ||
| 25 | 2·11 | ||||||||
| 30 | 2·52 | ||||||||
| Mean. | 2·48 | ||||||||
| Zero is R. L. 12·25 metres. | |||||||||
[207]
| Year. | Date. | Jan. | Feb. | Mar. | Apr. | May. | Jun. | Jul. | Aug. | Sep. | Oct. | Nov. | Dec. |
|---|---|---|---|---|---|---|---|---|---|---|---|---|---|
| 1902 | 1 | 3·57 | 2·12 | 1·00 | 0·00 | -0·50 | -0·50 | 0·00 | 1·10 | 4·30 | 5·36 | 4·54 | 4·10 |
| 5 | 3·53 | 1·95 | 0·87 | -0·48 | -0·50 | -0·50 | 0·00 | 1·94 | 4·83 | 5·24 | 4·27 | 3·63 | |
| 10 | 3·40 | 1·77 | 0·67 | -0·45 | -0·50 | -0·12 | 0·05 | 2·00 | 5·04 | 5·08 | 3·85 | 3·90 | |
| 15 | 3·12 | 1·54 | 0·31 | -0·48 | -0·50 | 0·00 | 0·03 | 2·26 | 5·16 | 5·12 | 3·50 | 3·95 | |
| 20 | 2·75 | 1·37 | 0·60 | -0·47 | -0·50 | -0·02 | 0·08 | 2·87 | 5·28 | 5·32 | 3·38 | 3·99 | |
| 25 | 2·58 | 1·15 | 0·33 | -0·50 | -0·50 | 0·00 | 0·16 | 3·77 | 5·40 | 5·08 | 3·10 | 3·84 | |
| 30 | 2·24 | 0·93 | -0·29 | -0·50 | -0·50 | 0·00 | 0·94 | 4·22 | 5·36 | 4·71 | 3·98 | 3·58 | |
| Mean | 3·03 | 1·55 | 0·36 | -0·41 | -0·50 | -0·16 | 0·18 | 2·60 | 5·05 | 5·11 | 3·80 | 3·89 | |
| 1903 | 1 | 3·52 | 2·56 | 1·44 | -0·35 | -0·40 | -0·46 | -0·43 | 1·92 | 6·12 | 6·00 | 6·07 | 3·20 |
| 5 | 3·48 | 2·22 | 1·25 | -0·38 | -0·42 | -0·46 | -0·30 | 2·75 | 5·98 | 6·11 | 6·00 | 2·90 | |
| 10 | 3·39 | 1·94 | 0·67 | -0·38 | -0·44 | -0·46 | -0·20 | 3·45 | 6·00 | 6·33 | 5·86 | 3·18 | |
| 15 | 3·44 | 1·88 | 0·50 | -0·40 | -0·45 | -0·46 | -0·12 | 4·05 | 6·12 | 6·33 | 5·24 | 3·11 | |
| 20 | 3·24 | 1·79 | 0·38 | -0·40 | -0·46 | -0·46 | -0·76 | 4·26 | 6·22 | 6·43 | 4·48 | 3·00 | |
| 25 | 3·03 | 1·62 | 0·01 | -0·40 | -0·46 | -0·46 | -0·70 | 5·24 | 6·07 | 6·59 | 3·95 | 3·09 | |
| 30 | 2·80 | 1·50 | -0·32 | -0·40 | -0·46 | -0·46 | -1·50 | 6·03 | 5·95 | 6·26 | 3·42 | 3·00 | |
| Mean | 3·27 | 1·93 | 0·56 | -0·39 | -0·44 | -0·46 | -0·27 | 3·96 | 6·07 | 6·29 | 5·00 | 3·07 | |
| 1904 | 1 | 2·98 | 2·56 | 2·28 | 0·00 | -0·33 | -0·35 | -0·24 | 1·50 | 5·19 | .. | .. | .. |
| 5 | 2·80 | 3·06 | 1·25 | -0·20 | -0·32 | -0·35 | -0·24 | 2·80 | 5·11 | .. | .. | .. | |
| 10 | 2·71 | 2·90 | 0·50 | -0·40 | -0·32 | -0·31 | -0·24 | 3·96 | 5·23 | .. | .. | .. | |
| 15 | 2·66 | 2·75 | 0·00 | -0·25 | -0·32 | -0·32 | -0·24 | 5·45 | 5·31 | .. | .. | .. | |
| 20 | 2·57 | 2·57 | 0·00 | -0·40 | -0·32 | -0·32 | -0·24 | 5·63 | 5·45 | .. | .. | .. | |
| 25 | 2·54 | 2·38 | 0·00 | -0·32 | -0·32 | -0·10 | -0·24 | 5·30 | .. | .. | .. | .. | |
| 30 | 2·44 | 2·28 | 0·00 | -0·34 | -0·35 | -0·24 | 0·20 | 5·19 | .. | .. | .. | .. | |
| Mean | 2·67 | 2·50 | 0·58 | -0·27 | -0·33 | -0·28 | 0·23 | 4·26 | .. | .. | .. | .. | |
| Zero is R. L. 10·00 metres. | |||||||||||||
[208]
| Year. | Date. | Jan. | Feb. | Mar. | Apr. | May. | Jun. | Jul. | Aug. | Sep. | Oct. | Nov. | Dec. |
|---|---|---|---|---|---|---|---|---|---|---|---|---|---|
| 1902 | 1 | 0·44 | 0·50 | 0·75 | 0·14 | -0·01 | 0·27 | -0·04 | 1·18 | 4·34 | 5·26 | 4·54 | 2·62 |
| 5 | 0·44 | 0·55 | 0·75 | 0·06 | -0·01 | 0·27 | -0·04 | 1·20 | 4·80 | 5·14 | 4·29 | 2·02 | |
| 10 | 0·41 | 0·65 | 0·75 | 0·00 | -0·01 | -0·01 | -0·04 | 2·23 | 5·00 | 5·02 | 4·01 | 1·25 | |
| 15 | 0·36 | 0·75 | 0·75 | 0·00 | -0·01 | -0·03 | 0·21 | 2·73 | 5·12 | 5·06 | 3·80 | 0·85 | |
| 20 | 0·34 | 0·50 | 0·27 | -0·01 | 0·07 | -0·04 | 0·35 | 3·40 | 5·20 | 5·26 | 3·75 | 0·60 | |
| 25 | 0·32 | 0·75 | 0·17 | -0·01 | 0·10 | -0·04 | 0·38 | 3·98 | 5·30 | 5·02 | 3·52 | 0·45 | |
| 30 | 0·50 | 0·75 | 0·14 | -0·01 | 0·21 | -0·04 | 1·20 | 4·26 | 5·26 | 4·66 | 2·77 | 0·42 | |
| Mean. | 0·40 | 0·64 | 0·51 | 0·02 | 0·05 | 0·05 | 0·29 | 2·71 | 5·00 | 5·06 | 3·81 | 1·17 | |
| 1903 | 1 | 0·42 | 0·30 | 0·29 | 0·52 | -0·12 | -0·15 | -0·13 | 1·00 | 6·06 | 6·09 | 6·15 | 4·77 |
| 5 | 0·35 | 0·30 | 0·77 | 0·14 | -0·12 | -0·15 | 0·67 | 0·80 | 6·08 | 6·22 | 6·09 | 4·76 | |
| 10 | 0·33 | 0·30 | 0·95 | 0·00 | -0·14 | -0·15 | 0·33 | 0·50 | 6·10 | 6·48 | 5·95 | 4·00 | |
| 15 | 0·33 | 0·30 | 0·68 | -0·02 | -0·14 | -0·15 | 1·20 | 2·30 | 6·19 | 6·46 | 5·46 | 3·54 | |
| 20 | 0·33 | 0·30 | 0·63 | -0·08 | -0·15 | -0·15 | 1·00 | 4·32 | 6·30 | 6·57 | 4·95 | 3·44 | |
| 25 | 0·33 | 0·30 | 0·60 | -0·10 | -0·15 | -0·15 | 1·20 | 5·29 | 6·14 | 6·75 | 4·87 | 3·68 | |
| 30 | 0·30 | 0·30 | 0·67 | -0·12 | -0·15 | -0·15 | 1·10 | 5·98 | 6·06 | 6·35 | 4·85 | 3·62 | |
| Mean. | 0·34 | 0·30 | 0·66 | 0·05 | -0·14 | -0·15 | 0·77 | 2·88 | 6·13 | 6·41 | 5·46 | 3·97 | |
| 1904 | 1 | 3·60 | 2·94 | 0·72 | 1·55 | 0·11 | -0·05 | 2·02 | 3·08 | 5·20 | .. | .. | .. |
| 5 | 3·51 | 1·88 | 2·53 | 1·37 | 0·41 | -0·08 | 1·75 | 3·64 | 5·11 | .. | .. | .. | |
| 10 | 3·46 | 0·77 | 3·06 | 1·00 | 0·46 | -0·09 | 1·16 | 4·22 | 5·23 | .. | .. | .. | |
| 15 | 3·41 | 0·75 | 2·65 | 0·45 | 0·24 | -0·09 | 0·50 | 5·54 | 5·31 | .. | .. | .. | |
| 20 | 3·35 | 0·68 | 2·38 | 1·52 | 0·02 | -0·09 | -0·03 | 5·69 | 5·47 | .. | .. | .. | |
| 25 | 3·32 | 0·66 | 1·96 | 1·16 | 0·35 | 1·06 | -0·05 | 5·32 | .. | .. | .. | .. | |
| 30 | 3·24 | 0·72 | 1·82 | 0·15 | -0·02 | 1·97 | 2·00 | 5·20 | .. | .. | .. | .. | |
| Mean. | 3·41 | 1·20 | 2·16 | 1·03 | 0·22 | 0·38 | 1·05 | 4·67 | .. | .. | .. | .. | |
| Zero is R. L. 10·00 metres. | |||||||||||||
[209]
| Kirats. | pics and kirats converted into metres, referred to zero at R. L. 85·00 metres, or 1 pic 14 | Kirats. | ||||||||||||||||||
|---|---|---|---|---|---|---|---|---|---|---|---|---|---|---|---|---|---|---|---|---|
| Pic 0. |
Pic 1. |
Pic 2. |
Pic 3. |
Pic 4. |
Pic 5. |
Pic 6. |
Pic 7. |
Pic 8. |
Pic 9. |
Pic 10. |
Pic 11. |
Pic 12. |
Pic 13. |
Pic 14. |
Pic 15. |
Pic 16. |
Pic 17. |
Pic 18. |
||
| metres. | metres. | metres. | metres. | metres. | metres. | metres. | metres. | metres. | metres. | metres. | metres. | metres. | metres. | metres. | metres. | metres. | metres. | metres. | ||
| 0 | -·84 | -·30 | ·24 | ·78 | 1·32 | 1·86 | 2·40 | 2·94 | 3·48 | 4·00 | 4·56 | 5·10 | 5·64 | 6·18 | 6·72 | 7·26 | 7·80 | 8·34 | 8·88 | 0 |
| 1 | -·82 | -·28 | ·26 | ·80 | 1·34 | 1·88 | 2·42 | 2·97 | 3·50 | 4·03 | 4·58 | 5·12 | 5·66 | 6·20 | 6·74 | 7·28 | 7·82 | 8·36 | 8·90 | 1 |
| 2 | -·80 | -·25 | ·28 | ·82 | 1·37 | 1·91 | 2·45 | 3·00 | 3·52 | 4·06 | 4·60 | 5·14 | 5·68 | 6·22 | 6·76 | 7·30 | 7·84 | 8·38 | 8·92 | 2 |
| 3 | -·78 | -·23 | ·31 | ·85 | 1·39 | 1·93 | 2·47 | 3·02 | 3·55 | 4·08 | 4·63 | 5·17 | 5·71 | 6·25 | 6·79 | 7·33 | 7·87 | 8·41 | 8·94 | 3 |
| 4 | -·75 | -·21 | ·33 | ·87 | 1·41 | 1·95 | 2·50 | 3·04 | 3·57 | 4·11 | 4·65 | 5·19 | 5·73 | 6·27 | 6·81 | 7·35 | 7·8 | 8·43 | 8·96 | 4 |
| 5 | -·73 | -·19 | ·35 | ·89 | 1·43 | 1·97 | 2·52 | 3·06 | 3·59 | 4·13 | 4·67 | 5·21 | 5·75 | 6·29 | 6·83 | 7·37 | 7·91 | 8·45 | 8·98 | 5 |
| 6 | -·71 | -·17 | ·37 | ·92 | 1·45 | 2·00 | 2·54 | 3·08 | 3·61 | 4·16 | 4·70 | 5·24 | 5·77 | 6·31 | 6·85 | 7·39 | 7·93 | 8·48 | 9·00 | 6 |
| 7 | -·68 | -·14 | ·40 | ·94 | 1·47 | 2·02 | 2·56 | 3·10 | 3·64 | 4·18 | 4·72 | 5·26 | 5·80 | 6·34 | 6·88 | 7·42 | 7·96 | 8·50 | 9·03 | 7 |
| 8 | -·66 | -·12 | ·42 | ·96 | 1·50 | 2·04 | 2·58 | 3·12 | 3·66 | 4·20 | 4·74 | 5·28 | 5·82 | 6·36 | 6·90 | 7·44 | 7·98 | 8·52 | 9·06 | 8 |
| 9 | -·64 | -·10 | ·44 | ·98 | 1·52 | 2·06 | 2·60 | 3·14 | 3·68 | 4·22 | 4·76 | 5·30 | 5·84 | 6·38 | 6·92 | 7·46 | 8·00 | 8·54 | 9·08 | 9 |
| 10 | -·61 | -·08 | ·46 | 1·00 | 1·55 | 2·08 | 2·63 | 3·16 | 3·70 | 4·24 | 4·78 | 5·32 | 5·86 | 6·41 | 6·95 | 7·48 | 8·02 | 8·57 | 9·10 | 10 |
| 11 | -·59 | -·06 | ·48 | 1·02 | 1·57 | 2·11 | 2·65 | 3·19 | 3·73 | 4·27 | 4·81 | 5·35 | 5·89 | 6·43 | 6·97 | 7·50 | 8·05 | 8·59 | 9·13 | 11 |
| 12 | -·57 | -·04 | 0·50 | 1·05 | 1·59 | 2·13 | 2·67 | 3·21 | 3·75 | 4·29 | 4·83 | 5·37 | 5·91 | 6·45 | 7·00 | 7·53 | 8·07 | 8·61 | 9·15 | 12 |
| 13 | -·55 | -·02 | ·53 | 1·07 | 1·61 | 2·15 | 2·69 | 3·23 | 3·77 | 4·31 | 4·85 | 5·39 | 5·93 | 6·47 | 7·02 | 7·55 | 8·09 | 8·63 | 9·17 | 13 |
| 14 | -·52 | 0·00 | ·55 | 1·09 | 1·63 | 2·17 | 2·71 | 3·25 | 3·79 | 4·33 | 4·88 | 5·42 | 5·96 | 6·50 | 7·04 | 7·58 | 4·11 | 8·65 | 9·19 | 14 |
| 15 | -·50 | ·03 | ·58 | 1·12 | 1·66 | 2·20 | 2·74 | 3·28 | 3·82 | 4·36 | 4·90 | 5·44 | 5·98 | 6·52 | 7·06 | 7·60 | 8·14 | 8·68 | 9·22 | 15 |
| 16 | -·48 | ·06 | ·60 | 1·14 | 1·68 | 2·22 | 2·76 | 3·30 | 3·84 | 4·38 | 4·92 | 5·46 | 6·00 | 6·54 | 7·08 | 7·62 | 8·16 | 8·70 | 9·24 | 16 |
| 17 | -·46 | ·08 | ·62 | 1·16 | 1·70 | 2·24 | 2·78 | 3·32 | 3·86 | 4·40 | 4·94 | 5·48 | 6·02 | 6·56 | 7·10 | 7·64 | 8·18 | 8·72 | 9·26 | 17 |
| 18 | -·44 | ·10 | ·65 | 1·18 | 1·73 | 2·26 | 2·81 | 3·35 | 3·88 | 4·42 | 4·96 | 5·50 | 6·04 | 6·58 | 7·13 | 7·66 | 8·20 | 8·74 | 9·29 | 18 |
| 19 | -·41 | ·12 | ·67 | 1·21 | 1·75 | 2·29 | 2·83 | 3·37 | 3·90 | 4·44 | 4·98 | 5·53 | 6·07 | 6·60 | 7·15 | 7·69 | 8·23 | 8·77 | 9·31 | 19 |
| 20 | -·39 | ·15 | ·69 | 1·23 | 1·77 | 2·31 | 2·85 | 3·39 | 3·92 | 4·46 | 5·00 | 5·55 | 6·09 | 6·63 | 7·17 | 7·71 | 8·25 | 8·79 | 9·33 | 20 |
| 21 | -·37 | ·17 | ·71 | 1·25 | 1·79 | 2·33 | 2·87 | 3·41 | 3·94 | 4·48 | 5·03 | 5·57 | 6·11 | 6·65 | 7·19 | 7·73 | 8·27 | 8·81 | 9·35 | 21 |
| 22 | -·35 | ·20 | ·74 | 1·27 | 1·82 | 2·35 | 2·90 | 3·43 | 3·96 | 4·50 | 5·05 | 5·60 | 6·14 | 6·68 | 7·21 | 7·75 | 8·29 | 8·83 | 9·37 | 22 |
| 23 | -·32 | ·22 | ·76 | 1·30 | 1·34 | 2·38 | 2·92 | 3·46 | 3·98 | 4·53 | 5·08 | 5·62 | 6·16 | 6·70 | 7·24 | 7·78 | 8·32 | 8·86 | 9·40 | 23 |
| Kirats. | pics and kirats converted into metres, referred to zero at R. L. 85·00 metres, or 1 pic 14 | Kirats. | |||||||||
|---|---|---|---|---|---|---|---|---|---|---|---|
| Pic 0. |
Pic 1. |
Pic 2. |
Pic 3. |
Pic 4. |
Pic 5. |
Pic 6. |
Pic 7. |
Pic 8. |
Pic 9. |
||
| metres. | metres. | metres. | metres. | metres. | metres. | metres. | metres. | metres. | metres. | ||
| 0 | -·84 | -·30 | ·24 | ·78 | 1·32 | 1·86 | 2·40 | 2·94 | 3·48 | 4·00 | 0 |
| 1 | -·82 | -·28 | ·26 | ·80 | 1·34 | 1·88 | 2·42 | 2·97 | 3·50 | 4·03 | 1 |
| 2 | -·80 | -·25 | ·28 | ·82 | 1·37 | 1·91 | 2·45 | 3·00 | 3·52 | 4·06 | 2 |
| 3 | -·78 | -·23 | ·31 | ·85 | 1·39 | 1·93 | 2·47 | 3·02 | 3·55 | 4·08 | 3 |
| 4 | -·75 | -·21 | ·33 | ·87 | 1·41 | 1·95 | 2·50 | 3·04 | 3·57 | 4·11 | 4 |
| 5 | -·73 | -·19 | ·35 | ·89 | 1·43 | 1·97 | 2·52 | 3·06 | 3·59 | 4·13 | 5 |
| 6 | -·71 | -·17 | ·37 | ·92 | 1·45 | 2·00 | 2·54 | 3·08 | 3·61 | 4·16 | 6 |
| 7 | -·68 | -·14 | ·40 | ·94 | 1·47 | 2·02 | 2·56 | 3·10 | 3·64 | 4·18 | 7 |
| 8 | -·66 | -·12 | ·42 | ·96 | 1·50 | 2·04 | 2·58 | 3·12 | 3·66 | 4·20 | 8 |
| 9 | -·64 | -·10 | ·44 | ·98 | 1·52 | 2·06 | 2·60 | 3·14 | 3·68 | 4·22 | 9 |
| 10 | -·61 | -·08 | ·46 | 1·00 | 1·55 | 2·08 | 2·63 | 3·16 | 3·70 | 4·24 | 10 |
| 11 | -·59 | -·06 | ·48 | 1·02 | 1·57 | 2·11 | 2·65 | 3·19 | 3·73 | 4·27 | 11 |
| 12 | -·57 | -·04 | 0·50 | 1·05 | 1·59 | 2·13 | 2·67 | 3·21 | 3·75 | 4·29 | 12 |
| 13 | -·55 | -·02 | ·53 | 1·07 | 1·61 | 2·15 | 2·69 | 3·23 | 3·77 | 4·31 | 13 |
| 14 | -·52 | 0·00 | ·55 | 1·09 | 1·63 | 2·17 | 2·71 | 3·25 | 3·79 | 4·33 | 14 |
| 15 | -·50 | ·03 | ·58 | 1·12 | 1·66 | 2·20 | 2·74 | 3·28 | 3·82 | 4·36 | 15 |
| 16 | -·48 | ·06 | ·60 | 1·14 | 1·68 | 2·22 | 2·76 | 3·30 | 3·84 | 4·38 | 16 |
| 17 | -·46 | ·08 | ·62 | 1·16 | 1·70 | 2·24 | 2·78 | 3·32 | 3·86 | 4·40 | 17 |
| 18 | -·44 | ·10 | ·65 | 1·18 | 1·73 | 2·26 | 2·81 | 3·35 | 3·88 | 4·42 | 18 |
| 19 | -·41 | ·12 | ·67 | 1·21 | 1·75 | 2·29 | 2·83 | 3·37 | 3·90 | 4·44 | 19 |
| 20 | -·39 | ·15 | ·69 | 1·23 | 1·77 | 2·31 | 2·85 | 3·39 | 3·92 | 4·46 | 20 |
| 21 | -·37 | ·17 | ·71 | 1·25 | 1·79 | 2·33 | 2·87 | 3·41 | 3·94 | 4·48 | 21 |
| 22 | -·35 | ·20 | ·74 | 1·27 | 1·82 | 2·35 | 2·90 | 3·43 | 3·96 | 4·50 | 22 |
| 23 | -·32 | ·22 | ·76 | 1·30 | 1·34 | 2·38 | 2·92 | 3·46 | 3·98 | 4·53 | 23 |
| Kirats. | pics and kirats converted into metres, referred to zero at R. L. 85·00 metres, or 1 pic 14 | Kirats. | ||||||||
|---|---|---|---|---|---|---|---|---|---|---|
| Pic 10. |
Pic 11. |
Pic 12. |
Pic 13. |
Pic 14. |
Pic 15. |
Pic 16. |
Pic 17. |
Pic 18. |
||
| metres. | metres. | metres. | metres. | metres. | metres. | metres. | metres. | metres. | ||
| 0 | 4·56 | 5·10 | 5·64 | 6·18 | 6·72 | 7·26 | 7·80 | 8·34 | 8·88 | 0 |
| 1 | 4·58 | 5·12 | 5·66 | 6·20 | 6·74 | 7·28 | 7·82 | 8·36 | 8·90 | 1 |
| 2 | 4·60 | 5·14 | 5·68 | 6·22 | 6·76 | 7·30 | 7·84 | 8·38 | 8·92 | 2 |
| 3 | 4·63 | 5·17 | 5·71 | 6·25 | 6·79 | 7·33 | 7·87 | 8·41 | 8·94 | 3 |
| 4 | 4·65 | 5·19 | 5·73 | 6·27 | 6·81 | 7·35 | 7·8 | 8·43 | 8·96 | 4 |
| 5 | 4·67 | 5·21 | 5·75 | 6·29 | 6·83 | 7·37 | 7·91 | 8·45 | 8·98 | 5 |
| 6 | 4·70 | 5·24 | 5·77 | 6·31 | 6·85 | 7·39 | 7·93 | 8·48 | 9·00 | 6 |
| 7 | 4·72 | 5·26 | 5·80 | 6·34 | 6·88 | 7·42 | 7·96 | 8·50 | 9·03 | 7 |
| 8 | 4·74 | 5·28 | 5·82 | 6·36 | 6·90 | 7·44 | 7·98 | 8·52 | 9·06 | 8 |
| 9 | 4·76 | 5·30 | 5·84 | 6·38 | 6·92 | 7·46 | 8·00 | 8·54 | 9·08 | 9 |
| 10 | 4·78 | 5·32 | 5·86 | 6·41 | 6·95 | 7·48 | 8·02 | 8·57 | 9·10 | 10 |
| 11 | 4·81 | 5·35 | 5·89 | 6·43 | 6·97 | 7·50 | 8·05 | 8·59 | 9·13 | 11 |
| 12 | 4·83 | 5·37 | 5·91 | 6·45 | 7·00 | 7·53 | 8·07 | 8·61 | 9·15 | 12 |
| 13 | 4·85 | 5·39 | 5·93 | 6·47 | 7·02 | 7·55 | 8·09 | 8·63 | 9·17 | 13 |
| 14 | 4·88 | 5·42 | 5·96 | 6·50 | 7·04 | 7·58 | 4·11 | 8·65 | 9·19 | 14 |
| 15 | 4·90 | 5·44 | 5·98 | 6·52 | 7·06 | 7·60 | 8·14 | 8·68 | 9·22 | 15 |
| 16 | 4·92 | 5·46 | 6·00 | 6·54 | 7·08 | 7·62 | 8·16 | 8·70 | 9·24 | 16 |
| 17 | 4·94 | 5·48 | 6·02 | 6·56 | 7·10 | 7·64 | 8·18 | 8·72 | 9·26 | 17 |
| 18 | 4·96 | 5·50 | 6·04 | 6·58 | 7·13 | 7·66 | 8·20 | 8·74 | 9·29 | 18 |
| 19 | 4·98 | 5·53 | 6·07 | 6·60 | 7·15 | 7·69 | 8·23 | 8·77 | 9·31 | 19 |
| 20 | 5·00 | 5·55 | 6·09 | 6·63 | 7·17 | 7·71 | 8·25 | 8·79 | 9·33 | 20 |
| 21 | 5·03 | 5·57 | 6·11 | 6·65 | 7·19 | 7·73 | 8·27 | 8·81 | 9·35 | 21 |
| 22 | 5·05 | 5·60 | 6·14 | 6·68 | 7·21 | 7·75 | 8·29 | 8·83 | 9·37 | 22 |
| 23 | 5·08 | 5·62 | 6·16 | 6·70 | 7·24 | 7·78 | 8·32 | 8·86 | 9·40 | 23 |
[210]
| Kirats. | pics and kirats converted into metres, referred to zero at R. L. 85·00 metres, or 1 pic 14 | Kirats. | ||||||||||||||||||
|---|---|---|---|---|---|---|---|---|---|---|---|---|---|---|---|---|---|---|---|---|
| Pic 8. |
Pic 9. |
Pic 10. |
Pic 11. |
Pic 12. |
Pic 13. |
Pic 14. |
Pic 15. |
Pic 16. |
Pic 17. |
Pic 18. |
Pic 19. |
Pic 20. |
Pic 21. |
Pic 22. |
Pic 23. |
Pic 24. |
Pic 25. |
Pic 26. |
||
| metres. | metres. | metres. | metres. | metres. | metres. | metres. | metres. | metres. | metres. | metres. | metres. | metres. | metres. | metres. | metres. | metres. | metres. | metres. | ||
| 0 | ·89 | 1·48 | 2·03 | 2·62 | 3·16 | 3·69 | 4·18 | 4·66 | 5·15 | 5·39 | 5·64 | 5·91 | 6·18 | 6·46 | 6·74 | 7·26 | 7·83 | 8·35 | 8·88 | 0 |
| 1 | ·91 | 1·50 | 2·05 | 2·65 | 3·18 | 3·71 | 4·20 | 4·68 | 5·16 | 5·40 | 5·65 | 5·92 | 6·19 | 6·47 | 6·76 | 7·28 | 7·85 | 8·37 | 8·91 | 1 |
| 2 | ·93 | 1·52 | 2·08 | 2·67 | 3·20 | 3·73 | 4·22 | 4·70 | 5·17 | 5·41 | 5·66 | 5·93 | 6·20 | 6·48 | 6·78 | 7·31 | 7·87 | 8·39 | 8·93 | 2 |
| 3 | ·95 | 1·54 | 2·10 | 2·70 | 3·22 | 3·75 | 4·24 | 4·72 | 5·18 | 5·42 | 5·67 | 5·94 | 6·21 | 6·49 | 6·80 | 7·35 | 7·89 | 8·41 | 8·95 | 3 |
| 4 | ·97 | 1·56 | 2·13 | 2·72 | 3·24 | 3·77 | 4·26 | 4·74 | 5·19 | 5·43 | 5·68 | 5·96 | 6·23 | 6·50 | 6·83 | 7·37 | 7·91 | 8·43 | 8·97 | 4 |
| 5 | 1·00 | 1·59 | 2·15 | 2·74 | 3·27 | 3·79 | 4·28 | 4·76 | 5·20 | 5·44 | 5·69 | 5·97 | 6·24 | 6·51 | 6·85 | 7·39 | 7·93 | 8·46 | 9·00 | 5 |
| 6 | 1·02 | 1·61 | 2·18 | 2·76 | 3·29 | 3·82 | 4·30 | 4·78 | 5·21 | 5·45 | 5·70 | 5·98 | 6·25 | 6·52 | 6·87 | 7·41 | 7·96 | 8·48 | 9·02 | 6 |
| 7 | 1·05 | 1·63 | 2·21 | 2·78 | 3·31 | 3·84 | 4·32 | 4·80 | 5·22 | 5·46 | 5·71 | 5·99 | 6·26 | 6·53 | 6·89 | 7·43 | 7·98 | 8·50 | 9·04 | 7 |
| 8 | 1·07 | 1·65 | 2·24 | 2·80 | 3·34 | 3·86 | 4·34 | 4·82 | 5·23 | 5·47 | 5·72 | 6·00 | 6·27 | 6·54 | 6·91 | 7·46 | 8·00 | 8·52 | 9·06 | 8 |
| 9 | 1·09 | 1·67 | 2·26 | 2·82 | 3·37 | 3·88 | 4·36 | 4·84 | 5·24 | 5·48 | 5·74 | 6·01 | 6·28 | 6·56 | 6·93 | 7·48 | 8·02 | 8·54 | 9·09 | 9 |
| 10 | 1·11 | 1·69 | 2·29 | 2·84 | 3·39 | 3·90 | 4·38 | 4·86 | 5·25 | 5·49 | 5·75 | 6·02 | 6·29 | 6·57 | 6·96 | 7·50 | 8·04 | 8·56 | 9·11 | 10 |
| 11 | 1·13 | 1·72 | 2·31 | 2·86 | 3·41 | 3·92 | 4·40 | 4·88 | 5·26 | 5·50 | 5·76 | 6·03 | 6·31 | 6·58 | 6·98 | 7·52 | 8·06 | 8·59 | 9·13 | 11 |
| 12 | 1·15 | 1·74 | 2·33 | 2·88 | 3·43 | 3·94 | 4·42 | 4·90 | 5·27 | 5·51 | 5·77 | 6·04 | 6·32 | 6·59 | 7·00 | 7·54 | 8·09 | 8·61 | 9·15 | 12 |
| 13 | 1·17 | 1·76 | 2·35 | 2·90 | 3·46 | 3·96 | 4·44 | 4·92 | 5·28 | 5·52 | 5·78 | 6·05 | 6·33 | 6·61 | 7·02 | 7·56 | 8·11 | 8·63 | 9·18 | 13 |
| 14 | 1·20 | 1·78 | 2·37 | 2·93 | 3·48 | 3·98 | 4·46 | 4·94 | 5·29 | 5·53 | 5·79 | 6·07 | 6·34 | 6·62 | 7·04 | 7·59 | 8·13 | 8·65 | 9·20 | 14 |
| 15 | 1·22 | 1·81 | 2·39 | 2·95 | 3·50 | 4·00 | 4·48 | 4·96 | 5·30 | 5·54 | 5·80 | 6·08 | 6·35 | 6·63 | 7·06 | 7·61 | 8·15 | 8·68 | 9·22 | 15 |
| 16 | 1·25 | 1·83 | 2·42 | 2·97 | 3·52 | 4·02 | 4·50 | 4·98 | 5·31 | 5·55 | 5·81 | 6·09 | 6·36 | 6·64 | 7·09 | 7·63 | 8·17 | 8·70 | 9·24 | 16 |
| 17 | 1·28 | 1·86 | 2·45 | 3·00 | 3·54 | 4·04 | 4·52 | 5·00 | 5·32 | 5·57 | 5·83 | 6·10 | 6·37 | 6·65 | 7·11 | 7·66 | 8·20 | 8·72 | 9·26 | 17 |
| 18 | 1·31 | 1·88 | 2·48 | 3·02 | 3·56 | 4·06 | 4·54 | 5·02 | 5·33 | 5·58 | 5·84 | 6·12 | 6·39 | 6·66 | 7·13 | 7·68 | 8·22 | 8·74 | 9·29 | 18 |
| 19 | 1·34 | 1·91 | 2·50 | 3·04 | 3·58 | 4·08 | 4·56 | 5·04 | 5·34 | 5·59 | 5·85 | 6·13 | 6·40 | 6·68 | 7·16 | 7·71 | 8·24 | 8·76 | 9·31 | 19 |
| 20 | 1·37 | 1·94 | 2·52 | 3·06 | 3·60 | 4·10 | 4·58 | 5·06 | 5·35 | 5·60 | 5·87 | 6·14 | 6·41 | 6·69 | 7·18 | 7·73 | 8·26 | 8·79 | 9·33 | 20 |
| 21 | 1·40 | 1·96 | 2·55 | 3·09 | 3·62 | 4·12 | 4·60 | 5·09 | 5·36 | 5·61 | 5·88 | 6·15 | 6·42 | 6·70 | 7·20 | 7·75 | 8·29 | 8·81 | 9·35 | 21 |
| 22 | 1·42 | 1·98 | 2·57 | 3·11 | 3·64 | 4·14 | 4·62 | 5·11 | 5·37 | 5·62 | 5·89 | 6·16 | 6·43 | 6·71 | 7·22 | 7·78 | 8·31 | 8·83 | 9·37 | 22 |
| 23 | 1·45 | 2·00 | 2·60 | 3·13 | 3·66 | 4·16 | 4·64 | 5·13 | 5·38 | 5·63 | 5·90 | 6·17 | 6·44 | 6·73 | 7·24 | 7·80 | 8·33 | 8·85 | 9·40 | 23 |
| Kirats. | pics and kirats converted into metres, referred to zero at R. L. 85·00 metres, or 1 pic 14 | Kirats. | |||||||||
|---|---|---|---|---|---|---|---|---|---|---|---|
| Pic 8. |
Pic 9. |
Pic 10. |
Pic 11. |
Pic 12. |
Pic 13. |
Pic 14. |
Pic 15. |
Pic 16. |
Pic 17. |
||
| metres. | metres. | metres. | metres. | metres. | metres. | metres. | metres. | metres. | metres. | ||
| 0 | ·89 | 1·48 | 2·03 | 2·62 | 3·16 | 3·69 | 4·18 | 4·66 | 5·15 | 5·39 | 0 |
| 1 | ·91 | 1·50 | 2·05 | 2·65 | 3·18 | 3·71 | 4·20 | 4·68 | 5·16 | 5·40 | 1 |
| 2 | ·93 | 1·52 | 2·08 | 2·67 | 3·20 | 3·73 | 4·22 | 4·70 | 5·17 | 5·41 | 2 |
| 3 | ·95 | 1·54 | 2·10 | 2·70 | 3·22 | 3·75 | 4·24 | 4·72 | 5·18 | 5·42 | 3 |
| 4 | ·97 | 1·56 | 2·13 | 2·72 | 3·24 | 3·77 | 4·26 | 4·74 | 5·19 | 5·43 | 4 |
| 5 | 1·00 | 1·59 | 2·15 | 2·74 | 3·27 | 3·79 | 4·28 | 4·76 | 5·20 | 5·44 | 5 |
| 6 | 1·02 | 1·61 | 2·18 | 2·76 | 3·29 | 3·82 | 4·30 | 4·78 | 5·21 | 5·45 | 6 |
| 7 | 1·05 | 1·63 | 2·21 | 2·78 | 3·31 | 3·84 | 4·32 | 4·80 | 5·22 | 5·46 | 7 |
| 8 | 1·07 | 1·65 | 2·24 | 2·80 | 3·34 | 3·86 | 4·34 | 4·82 | 5·23 | 5·47 | 8 |
| 9 | 1·09 | 1·67 | 2·26 | 2·82 | 3·37 | 3·88 | 4·36 | 4·84 | 5·24 | 5·48 | 9 |
| 10 | 1·11 | 1·69 | 2·29 | 2·84 | 3·39 | 3·90 | 4·38 | 4·86 | 5·25 | 5·49 | 10 |
| 11 | 1·13 | 1·72 | 2·31 | 2·86 | 3·41 | 3·92 | 4·40 | 4·88 | 5·26 | 5·50 | 11 |
| 12 | 1·15 | 1·74 | 2·33 | 2·88 | 3·43 | 3·94 | 4·42 | 4·90 | 5·27 | 5·51 | 12 |
| 13 | 1·17 | 1·76 | 2·35 | 2·90 | 3·46 | 3·96 | 4·44 | 4·92 | 5·28 | 5·52 | 13 |
| 14 | 1·20 | 1·78 | 2·37 | 2·93 | 3·48 | 3·98 | 4·46 | 4·94 | 5·29 | 5·53 | 14 |
| 15 | 1·22 | 1·81 | 2·39 | 2·95 | 3·50 | 4·00 | 4·48 | 4·96 | 5·30 | 5·54 | 15 |
| 16 | 1·25 | 1·83 | 2·42 | 2·97 | 3·52 | 4·02 | 4·50 | 4·98 | 5·31 | 5·55 | 16 |
| 17 | 1·28 | 1·86 | 2·45 | 3·00 | 3·54 | 4·04 | 4·52 | 5·00 | 5·32 | 5·57 | 17 |
| 18 | 1·31 | 1·88 | 2·48 | 3·02 | 3·56 | 4·06 | 4·54 | 5·02 | 5·33 | 5·58 | 18 |
| 19 | 1·34 | 1·91 | 2·50 | 3·04 | 3·58 | 4·08 | 4·56 | 5·04 | 5·34 | 5·59 | 19 |
| 20 | 1·37 | 1·94 | 2·52 | 3·06 | 3·60 | 4·10 | 4·58 | 5·06 | 5·35 | 5·60 | 20 |
| 21 | 1·40 | 1·96 | 2·55 | 3·09 | 3·62 | 4·12 | 4·60 | 5·09 | 5·36 | 5·61 | 21 |
| 22 | 1·42 | 1·98 | 2·57 | 3·11 | 3·64 | 4·14 | 4·62 | 5·11 | 5·37 | 5·62 | 22 |
| 23 | 1·45 | 2·00 | 2·60 | 3·13 | 3·66 | 4·16 | 4·64 | 5·13 | 5·38 | 5·63 | 23 |
| Kirats. | pics and kirats converted into metres, referred to zero at R. L. 85·00 metres, or 1 pic 14 | Kirats. | ||||||||
|---|---|---|---|---|---|---|---|---|---|---|
| Pic 18. |
Pic 19. |
Pic 20. |
Pic 21. |
Pic 22. |
Pic 23. |
Pic 24. |
Pic 25. |
Pic 26. |
||
| metres. | metres. | metres. | metres. | metres. | metres. | metres. | metres. | metres. | ||
| 0 | 5·64 | 5·91 | 6·18 | 6·46 | 6·74 | 7·26 | 7·83 | 8·35 | 8·88 | 0 |
| 1 | 5·65 | 5·92 | 6·19 | 6·47 | 6·76 | 7·28 | 7·85 | 8·37 | 8·91 | 1 |
| 2 | 5·66 | 5·93 | 6·20 | 6·48 | 6·78 | 7·31 | 7·87 | 8·39 | 8·93 | 2 |
| 3 | 5·67 | 5·94 | 6·21 | 6·49 | 6·80 | 7·35 | 7·89 | 8·41 | 8·95 | 3 |
| 4 | 5·68 | 5·96 | 6·23 | 6·50 | 6·83 | 7·37 | 7·91 | 8·43 | 8·97 | 4 |
| 5 | 5·69 | 5·97 | 6·24 | 6·51 | 6·85 | 7·39 | 7·93 | 8·46 | 9·00 | 5 |
| 6 | 5·70 | 5·98 | 6·25 | 6·52 | 6·87 | 7·41 | 7·96 | 8·48 | 9·02 | 6 |
| 7 | 5·71 | 5·99 | 6·26 | 6·53 | 6·89 | 7·43 | 7·98 | 8·50 | 9·04 | 7 |
| 8 | 5·72 | 6·00 | 6·27 | 6·54 | 6·91 | 7·46 | 8·00 | 8·52 | 9·06 | 8 |
| 9 | 5·74 | 6·01 | 6·28 | 6·56 | 6·93 | 7·48 | 8·02 | 8·54 | 9·09 | 9 |
| 10 | 5·75 | 6·02 | 6·29 | 6·57 | 6·96 | 7·50 | 8·04 | 8·56 | 9·11 | 10 |
| 11 | 5·76 | 6·03 | 6·31 | 6·58 | 6·98 | 7·52 | 8·06 | 8·59 | 9·13 | 11 |
| 12 | 5·77 | 6·04 | 6·32 | 6·59 | 7·00 | 7·54 | 8·09 | 8·61 | 9·15 | 12 |
| 13 | 5·78 | 6·05 | 6·33 | 6·61 | 7·02 | 7·56 | 8·11 | 8·63 | 9·18 | 13 |
| 14 | 5·79 | 6·07 | 6·34 | 6·62 | 7·04 | 7·59 | 8·13 | 8·65 | 9·20 | 14 |
| 15 | 5·80 | 6·08 | 6·35 | 6·63 | 7·06 | 7·61 | 8·15 | 8·68 | 9·22 | 15 |
| 16 | 5·81 | 6·09 | 6·36 | 6·64 | 7·09 | 7·63 | 8·17 | 8·70 | 9·24 | 16 |
| 17 | 5·83 | 6·10 | 6·37 | 6·65 | 7·11 | 7·66 | 8·20 | 8·72 | 9·26 | 17 |
| 18 | 5·84 | 6·12 | 6·39 | 6·66 | 7·13 | 7·68 | 8·22 | 8·74 | 9·29 | 18 |
| 19 | 5·85 | 6·13 | 6·40 | 6·68 | 7·16 | 7·71 | 8·24 | 8·76 | 9·31 | 19 |
| 20 | 5·87 | 6·14 | 6·41 | 6·69 | 7·18 | 7·73 | 8·26 | 8·79 | 9·33 | 20 |
| 21 | 5·88 | 6·15 | 6·42 | 6·70 | 7·20 | 7·75 | 8·29 | 8·81 | 9·35 | 21 |
| 22 | 5·89 | 6·16 | 6·43 | 6·71 | 7·22 | 7·78 | 8·31 | 8·83 | 9·37 | 22 |
| 23 | 5·90 | 6·17 | 6·44 | 6·73 | 7·24 | 7·80 | 8·33 | 8·85 | 9·40 | 23 |
[211]
| Cubic metres per day. |
Cubic metres per second. |
|---|---|
| 10,000 | 0·1157 |
| 20,000 | 0·2315 |
| 30,000 | 0·3472 |
| 40,000 | 0·4630 |
| 50,000 | 0·5787 |
| 60,000 | 0·6944 |
| 70,000 | 0·8102 |
| 80,000 | 0·9259 |
| 90,000 | 1·0417 |
| 100,000 | 1·1574 |
| 150,000 | 1·7361 |
| 200,000 | 2·3148 |
| 250,000 | 2·8935 |
| 300,000 | 3·4722 |
| 350,000 | 4·0509 |
| 400,000 | 4·6296 |
| 450,000 | 5·2083 |
| 500,000 | 5·7870 |
| 550,000 | 6·3657 |
| 600,000 | 6·9444 |
| 650,000 | 7·5231 |
| 700,000 | 8·1018 |
| 750,000 | 8·6805 |
| 800,000 | 9·2593 |
| 850,000 | 9·8380 |
| 900,000 | 10·4167 |
| 950,000 | 10·9954 |
| 1,000,000 | 11·5741 |
| 1,250,000 | 14·4676 |
| 1,500,000 | 17·3611 |
| 1,750,000 | 20·2546 |
| 2,000,000 | 23·1481 |
| 2,250,000 | 26·0417 |
| 2,500,000 | 28·9352 |
| 2,750,000 | 31·8287 |
| 3,000,000 | 34·7222 |
| 3,250,000 | 37·6157 |
| 3,500,000 | 40·5092 |
| 3,750,000 | 43·4028 |
| 4,000,000 | 46·2963 |
| 4,250,000 | 49·1898 |
| 4,500,000 | 52·0833 |
| 4,750,000 | 54·9768 |
| 5,000,000 | 57·8704 |
| 5,250,000 | 60·7639 |
| 5,500,000 | 63·6574 |
| 5,750,100 | 66·5509 |
| 6,000,000 | 69·4444 |
| 6,250,000 | 72·3380 |
| 6,500,000 | 75·2315 |
| 6,750,000 | 78·1250 |
| 7,000,000 | 81·0185 |
| 7,250,000 | 83·9120 |
| 7,500,000 | 86·8055 |
| 7,750,000 | 89·6991 |
| 8,000,000 | 92·5926 |
| 8,250,000 | 95·4861 |
| 8,500,000 | 98·3796 |
| 8,750,000 | 101·2731 |
| 9,000,000 | 104·1667 |
| 9,250,000 | 107·0602 |
| 9,500,000 | 109·9537 |
| 9,750,000 | 112·8472 |
| 10,000,000 | 115·7407 |
| Rough Working Approximations. |
|
| Cubic metres per day. |
Cubic metres per second. |
| 125,000 | 1·5 |
| 250,000 | 3 |
| 500,000 | 6 |
| 750,000 | 9 |
| 1,000,000 | 12 |
| 2,000,000 | 24 |
| 3,000,000 | 36 |
| 4,000,000 | 48 |
| 5,000,000 | 60 |
| 6,000,000 | 72 |
| 7,000,000 | 84 |
| 8,000,000 | 96 |
| 9,000,000 | 108 |
| 10,000,000 | 120 |
[212]
| Cubic metres per second. |
Cubic metres per day. |
|---|---|
| 1 | 86,400 |
| 2 | 172,800 |
| 3 | 259,200 |
| 4 | 345,600 |
| 5 | 432,000 |
| 6 | 518,400 |
| 7 | 604,800 |
| 8 | 691,200 |
| 9 | 777,600 |
| 10 | 864,000 |
| 11 | 950,400 |
| 12 | 1,036,800 |
| 13 | 1,123,200 |
| 14 | 1,209,600 |
| 15 | 1,296,000 |
| 16 | 1,382,400 |
| 17 | 1,468,800 |
| 18 | 1,555,200 |
| 19 | 1,641,600 |
| 20 | 1,728,000 |
| 21 | 1,814,400 |
| 22 | 1,900,800 |
| 23 | 1,987,200 |
| 24 | 2,073,500 |
| 25 | 2,160,000 |
| 26 | 2,246,400 |
| 27 | 2,332,800 |
| 28 | 2,419,200 |
| 29 | 2,505,600 |
| 30 | 2,592,000 |
| 31 | 2,678,400 |
| 32 | 2,764,800 |
| 33 | 2,851,200 |
| 34 | 2,937,600 |
| 35 | 3,024,000 |
| 36 | 3,110,400 |
| 37 | 3,196,800 |
| 38 | 3,283,200 |
| 39 | 3,369,600 |
| 40 | 3,456,000 |
| 41 | 3,542,400 |
| 42 | 3,628,800 |
| 43 | 3,715,200 |
| 44 | 3,801,600 |
| 45 | 3,888,000 |
| 46 | 3,974,400 |
| 47 | 4,060,800 |
| 48 | 4,147,200 |
| 49 | 4,233,600 |
| 50 | 4,320,000 |
| 51 | 4,406,400 |
| 52 | 4,492,800 |
| 53 | 4,579,200 |
| 54 | 4,665,600 |
| 55 | 4,752,000 |
| 56 | 4,838,400 |
| 57 | 4,924,800 |
| 58 | 5,011,200 |
| 59 | 5,097,600 |
| 60 | 5,184,000 |
| 61 | 5,270,400 |
| 62 | 5,356,800 |
| 63 | 5,443,200 |
| 64 | 5,529,600 |
| 65 | 5,616,000 |
| 66 | 5,702,400 |
| 67 | 5,788,800 |
| 68 | 5,875,200 |
| 69 | 5,961,600 |
| 70 | 6,048,000 |
| 71 | 6,134,400 |
| 72 | 6,220,800 |
| 73 | 6,307,200 |
| 74 | 6,393,600 |
| 75 | 6,480,000 |
| 76 | 6,566,400 |
| 77 | 6,652,800 |
| 78 | 6,739,200 |
| 79 | 6,825,600 |
| 80 | 6,912,000 |
| 81 | 6,998,400 |
| 82 | 7,084,800 |
| 83 | 7,171,200 |
| 84 | 7,257,600 |
| 85 | 7,344,000 |
| 86 | 7,430,400 |
| 87 | 7,516,800 |
| 88 | 7,603,200 |
| 89 | 7,689,600 |
| 90 | 7,776,000 |
| 91 | 7,862,400 |
| 92 | 7,948,800 |
| 93 | 8,035,200 |
| 94 | 8,121,600 |
| 95 | 8,208,000 |
| 96 | 8,294,400 |
| 97 | 8,380,800 |
| 98 | 8,467,200 |
| 99 | 8,553,600 |
| 100 | 8,640,000 |
[213]
| Year. | Bombay Rainfall in millimetres |
Assuân Gauge in metres |
||||||||
|---|---|---|---|---|---|---|---|---|---|---|
| June. | July. | Au- gust. |
Sept. | Total 4 Months. |
Variation from normal. |
Au- gust. |
Sept. | Variation from normal. |
||
| Aug. | Sept. | |||||||||
| 1874 | 474 | 1046 | 282 | 279 | 2081 | +267 | 7·96 | 8·59 | +1·20 | +0·91 |
| 1875 | 618 | 389 | 310 | 806 | 2123 | +309 | 7·32 | 8·06 | +0·56 | +0·38 |
| 1876 | 328 | 602 | 220 | 119 | 1269 | -545 | 7·19 | 8·38 | +0·43 | +0·70 |
| 1877 | 904 | 281 | 216 | 226 | 1627 | -187 | 5·67 | 6·11 | -1·09 | -1·57 |
| 1878 | 505 | 1227 | 518 | 417 | 2667 | +853 | 6·84 | 8·62 | +0·08 | +0·94 |
| 1879 | 420 | 285 | 567 | 142 | 1414 | -400 | 7·39 | 8·13 | +0·63 | +0·45 |
| 1880 | 544 | 465 | 104 | 579 | 1692 | -122 | 6·96 | 7·43 | +0·20 | -0·25 |
| 1881 | 387 | 747 | 483 | 116 | 1733 | -81 | 5·96 | 8·07 | -0·80 | +0·39 |
| 1882 | 699 | 683 | 85 | 255 | 1722 | -92 | 6·00 | 7·33 | -0·76 | -0·35 |
| 1883 | 346 | 1011 | 318 | 312 | 1987 | +173 | 7·20 | 7·91 | +0·44 | +0·23 |
| 1884 | 335 | 655 | 386 | 432 | 1808 | -6 | 6·06 | 7·04 | -0·70 | -0·64 |
| 1885 | 130 | 554 | 645 | 305 | 1634 | -180 | 7·39 | 7·61 | +0·63 | -0·07 |
| 1886 | 1103 | 907 | 272 | 166 | 2448 | +634 | 6·38 | 7·65 | -0·38 | -0·03 |
| 1887 | 610 | 785 | 445 | 463 | 2303 | +489 | 7·95 | 8·62 | +1·19 | +0·94 |
| 1888 | 401 | 573 | 289 | 124 | 1387 | -427 | 5·99 | 6·61 | -0·77 | -1·07 |
| 1889 | 505 | 775 | 260 | 63 | 1603 | -211 | 6·88 | 7·91 | +0·12 | +0·23 |
| 1890 | 607 | 554 | 275 | 168 | 1604 | -210 | 7·47 | 8·14 | +0·71 | +0·46 |
| 1891 | 348 | 830 | 170 | 575 | 1923 | +109 | 6·79 | 7·83 | +0·03 | +0·15 |
| 1892 | 338 | 600 | 838 | 569 | 2345 | +531 | 7·14 | 8·67 | +0·38 | +0·99 |
| 1893 | 544 | 399 | 343 | 197 | 1483 | -331 | 6·97 | 7·43 | +0·21 | -0·25 |
| 1894 | 426 | 662 | 218 | 305 | 1611 | -203 | 7·27 | 8·37 | +0·51 | +0·69 |
| 1895 | 452 | 455 | 402 | 307 | 1616 | -198 | 8·07 | 8·10 | +1·31 | +0·42 |
| 1896 | 703 | 923 | 536 | 41 | 2203 | +389 | 6·73 | 8·21 | -0·03 | +0·53 |
| 1897 | 351 | 780 | 351 | 520 | 2002 | +188 | 6·23 | 7·53 | -0·53 | -0·15 |
| 1898 | 648 | 564 | 134 | 513 | 1859 | +45 | 7·07 | 8·11 | +0·31 | +0·43 |
| 1899 | 527 | 121 | 133 | 88 | 869 | -945 | 4·28 | 6·16 | -2·48 | -1·52 |
| 1900 | 442 | 508 | 603 | 203 | 1756 | -58 | 6·90 | 7·13 | +0·14 | -0·55 |
| 1901 | 627 | 844 | 364 | 47 | 1882 | +68 | 6·48 | 7·45 | -0·28 | -0·23 |
| 1902 | 248 | 369 | 468 | 701 | 1786 | -28 | 4·25 | 6·40 | -2·51 | -1·28 |
| 1903 | 472 | 615 | 476 | 229 | 1792 | -22 | 5·68 | 7·30 | -1·08 | -0·38 |
| 1904 | .. | .. | .. | .. | .. | .. | .. | .. | .. | .. |
[214]
| 1902 | ||||||||||
| Month. | Barometer | Thermometer | Hu- mi- di- ty. |
Wind | RAINFALL IN MILLIMETRES |
|||||
|---|---|---|---|---|---|---|---|---|---|---|
| Mean. | Vari- ation from normal. |
Mean max. |
Mean min. |
Mean. | Direc- tion. |
Velo- city. |
Fall. | Vari- ation from normal. |
||
| January | .. | .. | 24·3 | 6·6 | 15·4 | .. | S | .. | 0 | .. |
| February | .. | .. | 22·0 | 9·3 | 15·6 | .. | S 22 E | .. | 65 | .. |
| March | .. | .. | 24·4 | 10·2 | 17·3 | .. | S 24 E | .. | 37 | .. |
| April | .. | .. | 22·3 | 11·1 | 16·7 | .. | S 45 E | .. | 111 | .. |
| May | .. | .. | 22·7 | 10·3 | 16·5 | .. | S 45 E | .. | 61 | .. |
| June | .. | .. | 25·2 | 9·9 | 17·5 | .. | S 45 E | .. | 142 | .. |
| July | .. | .. | 25·0 | 10·2 | 17·6 | .. | S 45 E | .. | 205 | .. |
| August | .. | .. | 24·8 | 10·0 | 17·4 | .. | S 45 E | .. | 167 | .. |
| September | .. | .. | 24·8 | 9·8 | 17·3 | .. | S 45 E | .. | 129 | .. |
| October | .. | .. | 25·9 | 6·9 | 16·4 | .. | S 88 E | .. | 16 | .. |
| November | .. | .. | 26·4 | 5·5 | 15·9 | .. | S 86 E | .. | 9 | .. |
| December | .. | .. | 25·6 | 4·5 | 15·0 | .. | E | .. | 39 | .. |
| Mean | .. | .. | 24·4 | 8·7 | 16·5 | .. | S 47 E | .. | 981 | .. |
| 1903 | ||||||||||
| January | .. | .. | 26·0 | 8·7 | 17·4 | .. | S 51 E | .. | 32 | .. |
| February | .. | .. | 28·2 | 8·3 | 18·2 | .. | S 42 E | .. | 25 | .. |
| March | .. | .. | 26·7 | 10·5 | 18·6 | .. | S 45 E | .. | 94 | .. |
| April | .. | .. | 27·8 | 10·0 | 18·9 | .. | S 45 E | .. | 88 | .. |
| May | .. | .. | 25·7 | 12·2 | 18·9 | .. | S 45 E | .. | 117 | .. |
| June | .. | .. | 24·4 | 10·0 | 17·2 | .. | S 45 E | .. | 191 | .. |
| July | .. | .. | 22·4 | 10·0 | 16·2 | .. | S 45 E | .. | 276 | .. |
| August | .. | .. | 21·6 | 10·5 | 16·0 | .. | S 29 E | .. | 248 | .. |
| September | .. | .. | 22·5 | 9·7 | 16·1 | .. | S | .. | 222 | .. |
| October | .. | .. | 24·5 | 7·3 | 15·9 | .. | S 80 E | .. | 28 | .. |
| November | .. | .. | 24·4 | 5·0 | 14·7 | .. | E | .. | 0 | .. |
| December | .. | .. | 23·6 | 6·5 | 15·0 | .. | N 88 E | .. | 18 | .. |
| Mean | .. | .. | 24·8 | 9·1 | 17·4 | .. | S 53 E | .. | 1339 | .. |
| 1904 | ||||||||||
| January | .. | .. | 25·4 | 4·6 | .. | .. | .. | 0 | .. | |
| February | .. | .. | 25·9 | 8·4 | .. | .. | E | .. | 20 | .. |
| March | .. | .. | 26·2 | 9·2 | .. | .. | S 59 E | .. | 126 | .. |
| April | .. | .. | 26·6 | 9·9 | .. | .. | S 50 E | .. | 31 | .. |
| May | .. | .. | 27·4 | 10·1 | .. | .. | N 80 E | .. | 41 | .. |
| June | .. | .. | .. | .. | .. | .. | N 84 E | .. | .. | .. |
| July | .. | .. | .. | .. | .. | .. | .. | .. | .. | .. |
| August | .. | .. | .. | .. | .. | .. | .. | .. | .. | .. |
| September | .. | .. | .. | .. | .. | .. | .. | .. | .. | .. |
| October | .. | .. | .. | .. | .. | .. | .. | .. | .. | .. |
| November | .. | .. | .. | .. | .. | .. | .. | .. | .. | .. |
| December | .. | .. | .. | .. | .. | .. | .. | .. | .. | .. |
| Mean | .. | .. | .. | .. | .. | .. | .. | .. | .. | .. |
[215]
| 1902 | ||||||||||
| Month. | Barometer | Thermometer | Hu- mi- di- ty. |
Wind | RAINFALL IN MILLIMETRES |
|||||
|---|---|---|---|---|---|---|---|---|---|---|
| Mean. | Vari- ation from normal. |
Mean max. |
Mean min. |
Mean. | Direc- tion. |
Velo- city. |
Fall. | Vari- ation from normal. |
||
| January | .. | .. | .. | .. | .. | .. | .. | .. | .. | .. |
| February | .. | .. | .. | .. | .. | .. | .. | .. | .. | .. |
| March | 756·2 | .. | 40·2 | 20·9 | 30·6 | 18 | N 10 W | .. | 0 | .. |
| April | 756·6 | .. | 41·9 | 28·5 | 35·2 | 13 | N | .. | 0 | .. |
| May | 757·2 | .. | 44·1 | 26·2 | 35·2 | 30 | S 72 W | .. | 6 | .. |
| June | 757·5 | .. | 43·1 | 24·4 | 33·8 | 41 | S 36 W | .. | 53 | .. |
| July | 758·9 | .. | 38·7 | 23·8 | 31·2 | 59 | S 34 W | .. | 135 | .. |
| August | 758·1 | .. | 39·7 | 21·2 | 30·4 | 64 | S 5 W | .. | 78 | .. |
| September | 758·4 | .. | 40·4 | 23·4 | 31·9 | 60 | S 9 E | .. | 76 | .. |
| October | 758·2 | .. | 43·2 | 26·0 | 34·6 | 38 | N 53 E | .. | 2 | .. |
| November | 758·3 | .. | 40·8 | 22·9 | 31·8 | 27 | N 5 W | .. | 0 | .. |
| December | 759·9 | .. | 36·7 | 19·1 | 27·9 | 33 | N 34 W | .. | 0 | .. |
| Mean | .. | .. | .. | .. | .. | .. | .. | .. | 350 | .. |
| 1903 | ||||||||||
| January | 760·3 | .. | 33·4 | 16·8 | 25·1 | 30 | N 33 W | .. | 0 | .. |
| February | 760·8 | .. | 33·6 | 13·5 | 23·6 | 28 | N 6 W | .. | 0 | .. |
| March | 758·4 | .. | 39·1 | 16·8 | 28·0 | 13 | N 8 W | .. | 0 | .. |
| April | 755·2 | .. | 45·3 | 23·4 | 34·4 | 17 | N 24 E | .. | 0 | .. |
| May | 756·6 | .. | 44·9 | 25·4 | 35·2 | 40 | S 6 W | .. | 1 | .. |
| June | 757·3 | .. | 43·2 | 24·6 | 33·9 | 46 | S 4 W | .. | 44 | .. |
| July | 757·8 | .. | 40·5 | 23·6 | 32·0 | 52 | S 9 W | .. | 124 | .. |
| August | 757·6 | .. | 38·8 | 26·4 | 30·6 | 67 | S 13 W | .. | 92 | .. |
| September | 758·2 | .. | 39·3 | 25·9 | 32·6 | 66 | S 21 W | .. | 52 | .. |
| October | 757·4 | .. | 41·4 | 21·8 | 31·6 | 50 | S 63 E | .. | 0 | .. |
| November | 758·0 | .. | 40·4 | 20·8 | 30·6 | 39 | N 10 E | .. | 0 | .. |
| December | 758·2 | .. | 38·5 | 16·5 | 27·5 | 48 | N 21 E | .. | 0 | .. |
| Mean | 758·0 | .. | 39·4 | 21·3 | 30·4 | 41 | N 4 E | .. | 313 | .. |
| 1904 | ||||||||||
| January | 758·2 | .. | 37·4 | 17·9 | 27·6 | 73 | N 18 E | .. | 0 | 0 |
| February | 758·2 | .. | 36·3 | 15·8 | 26·1 | 40 | N 1 W | .. | 0 | 0 |
| March | 756·3 | -1·0 | 40·4 | 17·7 | 24·6 | 22 | N 10 E | .. | 0 | 0 |
| April | 756·8 | +0·9 | 41·9 | 20·6 | 28·4 | 12 | N 3 W | .. | 0 | 0 |
| May | 756·6 | -0·3 | 42·5 | 24·3 | 31·7 | 27 | S | .. | 40 | +36 |
| June | 757·9 | +0·5 | 42·1 | 12·3 | 27·2 | 41 | S | .. | 0 | -49 |
| July | 757·7 | -0·4 | 39·5 | 14·3 | 26·9 | 43 | S | .. | 70 | -40 |
| August | 758·2 | +0·2 | 40·9 | 22·4 | 31·6 | 61 | S | .. | 67 | -12 |
| September | .. | .. | .. | .. | .. | .. | .. | .. | .. | .. |
| October | .. | .. | .. | .. | .. | .. | .. | .. | .. | .. |
| November | .. | .. | .. | .. | .. | .. | .. | .. | .. | .. |
| December | .. | .. | .. | .. | .. | .. | .. | .. | .. | .. |
| Mean | .. | .. | .. | .. | .. | .. | .. | .. | .. | .. |
[216]
| 1902 | ||||||||||
| Month. | Barometer | Thermometer | Hu- mi- di- ty. |
Wind | RAINFALL IN MILLIMETRES |
|||||
|---|---|---|---|---|---|---|---|---|---|---|
| Mean. | Vari- ation from normal. |
Mean max. |
Mean min. |
Mean. | Direc- tion. |
Velo- city. |
Fall. | Vari- ation from normal. |
||
| January | 759·4 | 0 | 28·7 | 14·2 | 20·0 | 26 | N 4 E | 28 | 0 | .. |
| February | 758·3 | -0·2 | 34·7 | 19·1 | 26·1 | 18 | N 17 E | 21 | 0 | .. |
| March | 756·1 | -1·4 | 38·0 | 21·3 | 28·0 | 14 | N 12 E | ? | 0 | .. |
| April | 756·0 | +1·2 | 39·9 | 23·6 | 31·0 | 13 | N 18 E | ? | 0 | .. |
| May | 754·8 | +0·3 | 43·0 | 27·2 | 34·1 | 19 | N 63 W | 21 | 0 | .. |
| June | 756·0 | +0·9 | 41·5 | 26·5 | 33·1 | 27 | S 12 W | 24 | 0 | .. |
| July | 757·1 | +0·8 | 39·0 | 23·4 | 30·1 | 47 | S 4 W | 27 | 116 | .. |
| August | 756·2 | -0·1 | 39·1 | 24·7 | 31·2 | 46 | S 12 W | 20 | 5 | .. |
| September | 756·8 | +1·2 | 39·5 | 24·8 | 30·0 | 41 | S 23 W | 23 | 2 | .. |
| October | 757·4 | +0·5 | 38·1 | 22·7 | 29·7 | 30 | N 13 E | 22 | 0 | .. |
| November | 758·1 | +0·2 | 29·1 | 18·7 | 25·8 | 26 | N 30 E | 21 | 0 | .. |
| December | 759·6 | +0·9 | 29·3 | 13·7 | 21·0 | 28 | N 24 E | 22 | 0 | .. |
| Mean | 757·1 | +0·4 | 36·7 | 21·7 | 28·3 | 28 | N 33 E | 23 | 123 | .. |
| 1903 | ||||||||||
| January | 760·0 | +1·2 | 26·9 | 11·6 | 18·6 | 31 | N 8 E | 23 | 0 | .. |
| February | 761·5 | +3·0 | 28·2 | 12·6 | 19·5 | 32 | N 8 W | 23 | 0 | .. |
| March | 760·5 | +3·0 | 32·6 | 15·1 | 23·5 | 18 | N 15 W | 20 | 0 | .. |
| April | 757·0 | +2·2 | 39·9 | 20·8 | 30·2 | 18 | N 37 E | 19 | 0 | .. |
| May | 757·7 | +3·2 | 40·9 | 24·7 | 32·3 | 28 | S 43 E | 10 | 24 | .. |
| June | 757·4 | +2·3 | 41·4 | 25·8 | 33·0 | 28 | S 7 W | 21 | 0 | .. |
| July | 758·1 | +1·8 | 38·7 | 25·1 | 31·6 | 36 | S 1 W | 15 | 18 | .. |
| August | 758·1 | +1·8 | 37·5 | 24·3 | 31·0 | 44 | S 30 W | 18 | 12 | .. |
| September | 758·9 | +3·3 | 38·0 | 20·9 | 30·1 | 40 | S 12 W | 15 | 14 | .. |
| October | 758·6 | +1·7 | 38·7 | 22·8 | 30·3 | 32 | N 2 W | 15 | 0 | .. |
| November | 759·9 | +2·0 | 36·9 | 20·9 | 28·0 | 32 | N 15 E | 13 | 0 | .. |
| December | 760·0 | +1·3 | 34·9 | 18·0 | 25·2 | 34 | N 22 E | 13 | 0 | .. |
| Mean | 759·0 | +2·4 | 36·2 | 20·2 | 27·8 | 31 | N 18 E | 18 | 68 | .. |
| 1904 | ||||||||||
| January | 760·2 | +0·8 | 31·7 | 16·3 | 22·8 | 33 | N 15 E | 13 | 0 | .. |
| February | 760·4 | +1·9 | 31·9 | 16·6 | 23·4 | 26 | N 6 E | 14 | 0 | 0 |
| March | 758·0 | +0·5 | 36·0 | 18·4 | 26·6 | 18 | N 15 E | 17 | 0 | 0 |
| April | 758·0 | +3·2 | 38·8 | 20·2 | 29·4 | 16 | N 1 E | 19 | 0 | 0 |
| May | 757·8 | +3·3 | 41·6 | 23·2 | 32·6 | 20 | N 9 W | 17 | 0 | — |
| June | 758·5 | +3·4 | 42·6 | 25·6 | 33·3 | 25 | S 2 W | 15 | 0 | -5 |
| July | 757·6 | +1·3 | 39·3 | 24·9 | 32·1 | 52 | S 44 W | .. | 35 | -20 |
| August | 758·3 | +1·6 | 39·9 | 25·8 | 32·8 | 50 | S 28 W | .. | 76 | +45 |
| September | .. | .. | .. | .. | .. | .. | .. | .. | .. | .. |
| October | .. | .. | .. | .. | .. | .. | .. | .. | .. | .. |
| November | .. | .. | .. | .. | .. | .. | .. | .. | .. | .. |
| December | .. | .. | .. | .. | .. | .. | .. | .. | .. | .. |
| Mean | .. | .. | .. | .. | .. | .. | .. | .. | .. | .. |
[217]
| 1902 | ||||||||||
| Month. | Barometer | Thermometer | Hu- mi- di- ty. |
Wind | RAINFALL IN MILLIMETRES |
|||||
|---|---|---|---|---|---|---|---|---|---|---|
| Mean. | Vari- ation from normal. |
Mean max. |
Mean min. |
Mean. | Direc- tion. |
Velo- city. |
Fall. | Vari- ation from normal. |
||
| January | .. | .. | .. | .. | .. | .. | .. | .. | .. | .. |
| February | .. | .. | .. | .. | .. | .. | .. | .. | .. | .. |
| March | 756·3 | .. | 39·0 | 20·0 | 29·5 | 26 | N 5 E | .. | 0 | .. |
| April | 755·9 | .. | 39·4 | 20·5 | 30·0 | 14 | N 5 E | .. | 0 | .. |
| May | 755·6 | .. | 45·5 | 25·9 | 35·7 | 13 | N 14 E | .. | 0 | .. |
| June | 755·6 | .. | 44·8 | 26·7 | 35·8 | 16 | N 20 E | .. | 0 | .. |
| July | 757·1 | .. | 42·2 | 25·3 | 33·8 | 32 | S 82 W | .. | 0 | .. |
| August | .. | .. | 43·2 | 29·2 | 36·2 | 28 | N 43 W | .. | 0 | .. |
| September | .. | .. | 48·3 | 26·9 | 37·6 | 31 | S 23 W | .. | 0 | .. |
| October | .. | .. | 39·3 | 23·4 | 31·4 | 40 | N 39 E | .. | 0 | .. |
| November | .. | .. | 35·3 | 19·0 | 27·2 | 34 | N 5 W | .. | 0 | .. |
| December | .. | .. | 33·0 | 14·7 | 23·8 | 40 | N 15 W | .. | .. | .. |
| Mean | .. | .. | .. | .. | .. | .. | .. | .. | 0 | .. |
| 1903 | ||||||||||
| January | — | .. | 28·4 | 12·3 | 20·4 | 40 | N 20 W | .. | 0 | .. |
| February | 761·6 | .. | 29·4 | 13·0 | 21·2 | 34 | N 23 W | .. | 0 | .. |
| March | 759·2 | .. | 34·3 | 11·0 | 22·6 | 22 | N 16 W | .. | 0 | .. |
| April | 756·2 | .. | 44·7 | 15·7 | 28·7 | 27 | N 5 W | .. | 0 | .. |
| May | 756·4 | .. | 43·1 | 20·4 | 31·8 | 35 | N 63 E | .. | 0 | .. |
| June | 755·6 | .. | 45·2 | 21·0 | 33·1 | 58 | N 20 W | .. | 0 | .. |
| July | 756·0 | .. | 42·9 | 21·0 | 32·0 | 57 | N 56 W | .. | 0 | .. |
| August | 755·6 | .. | 43·7 | 19·0 | 31·4 | 58 | N 76 W | .. | 0 | .. |
| September | 757·1 | .. | 42·3 | 19·0 | 30·6 | 58 | N 10 W | .. | 0 | .. |
| October | 757·6 | .. | 40·7 | 17·0 | 28·8 | 49 | N 15 E | .. | 0 | .. |
| November | 758·9 | .. | 36·5 | 14·1 | 25·2 | 64 | N 7 E | .. | 0 | .. |
| December | 758·9 | .. | 33·7 | 10·6 | 22·2 | 54 | N 2 E | .. | 0 | .. |
| Mean | 755·6 | .. | 38·5 | 16·2 | 27·3 | 46 | N 10 W | .. | 0 | .. |
| 1904 | ||||||||||
| January | 759·1 | .. | .. | .. | 20·9 | 55 | N | .. | — | — |
| February | 758·1 | — | 34·7 | 13·3 | 24·2 | 48 | N | .. | — | — |
| March | 755·7 | -2·1 | 35·0 | 16·4 | 25·7 | 35 | N 2 W | .. | — | — |
| April | 756·4 | +0·4 | 38·3 | 19·7 | 29·0 | 19 | N 3 E | .. | — | — |
| May | 756·3 | +0·3 | 41·8 | 24·9 | 33·4 | 25 | N 9 E | .. | — | — |
| June | 756·2 | +0·6 | 43·2 | 26·0 | 34·6 | 18 | N 20 W | .. | — | — |
| July | 755·8 | -0·6 | 42·1 | 27·0 | 34·6 | 33 | S 16 W | .. | — | — |
| August | 756·4 | -0·3 | 42·1 | 26·1 | 34·1 | 26 | S 77 W | .. | — | — |
| September | .. | .. | .. | .. | .. | .. | .. | .. | .. | .. |
| October | .. | .. | .. | .. | .. | .. | .. | .. | .. | .. |
| November | .. | .. | .. | .. | .. | .. | .. | .. | .. | .. |
| December | .. | .. | .. | .. | .. | .. | .. | .. | .. | .. |
| Mean | .. | .. | .. | .. | .. | .. | .. | .. | .. | .. |
[218]
| 1902 | ||||||||||
| Month. | Barometer | Thermometer | Hu- mi- di- ty. |
Wind | RAINFALL IN MILLIMETRES |
|||||
|---|---|---|---|---|---|---|---|---|---|---|
| Mean. | Vari- ation from normal. |
Mean max. |
Mean min. |
Mean. | Direc- tion. |
Velo- city. |
Fall. | Vari- ation from normal. |
||
| January | 765·6 | .. | 22·6 | 8·5 | 14·8 | 50 | N | 17 | 0 | .. |
| February | 764·4 | .. | 30·6 | 11·4 | 20·1 | 23 | N | 17 | 0 | .. |
| March | 761·3 | .. | 31·7 | 13·4 | 22·0 | 25 | N 8 W | 18 | 0 | .. |
| April | 760·2 | .. | 35·5 | 18·2 | 26·6 | 23 | N 15 W | 17 | 0 | .. |
| May | 759·7 | .. | 41·6 | 23·9 | 32·6 | 16 | N 5 W | 21 | 0 | .. |
| June | 757·7 | .. | 41·7 | 23·3 | 32·4 | 20 | N 6 W | 19 | 0 | .. |
| July | 757·6 | .. | 41·3 | 24·0 | 32·5 | 20 | N 50 W | 17 | 0 | .. |
| August | 757·2 | .. | 41·4 | 23·9 | 32·5 | 20 | N 15 W | 18 | 0 | .. |
| September | 758·9 | .. | 41·2 | 23·9 | 31·6 | 32 | N 18 W | 18 | 0 | .. |
| October | 761·9 | .. | 37·9 | 21·1 | 28·5 | 41 | N 1 W | 18 | 0 | .. |
| November | 764·0 | .. | 29·0 | 14·2 | 20·8 | 43 | N | 20 | 0 | .. |
| December | 766·6 | .. | 23·8 | 9·2 | 14·3 | 52 | N 2 W | 19 | 0 | .. |
| Mean | 761·3 | .. | 34·8 | 17·9 | 25·7 | 30 | N 10 W | 18 | 0 | .. |
| 1903 | ||||||||||
| January | 767·7 | .. | 22·0 | 8·5 | 13·6 | 56 | N | 17 | 0 | .. |
| February | 768·3 | .. | 23·7 | 9·1 | 15·1 | 44 | N | 19 | 0 | .. |
| March | 764·6 | .. | 28·1 | 12·7 | 19·0 | 38 | N | 21 | 0 | .. |
| April | 760·1 | .. | 37·3 | 18·8 | 26·3 | 32 | N | 22 | 0 | .. |
| May | 768·9 | .. | 40·9 | 22·9 | 28·6 | 35 | N 4 E | 17 | 0 | .. |
| June | 757·5 | .. | 41·3 | 24·2 | 31·6 | 23 | N 1 E | 22 | 0 | .. |
| July | 756·8 | .. | 41·5 | 24·3 | 31·9 | 22 | N 1 W | 19 | 0 | .. |
| August | 756·2 | .. | 43·5 | 25·4 | 31·7 | 25 | N | 21 | 0 | .. |
| September | 757·5 | .. | 41·4 | 22·3 | 28·8 | 30 | N | 19 | 0 | .. |
| October | 758·6 | .. | 39·5 | 19·5 | 26·4 | 34 | N | 19 | 0 | .. |
| November | 761·1 | .. | 34·6 | 14·9 | 21·2 | 38 | N | 17 | 0 | .. |
| December | 761·5 | .. | 30·0 | 11·6 | 17·8 | 46 | N | 17 | 0 | .. |
| Mean | 761·6 | .. | 35·3 | 17·8 | 24·3 | 35 | N | 19 | 0 | .. |
| 1904 | ||||||||||
| January | 762·3 | .. | 24·7 | 8·1 | 14·7 | 48 | N | 18 | 0 | .. |
| February | 762·5 | .. | 27·1 | 10·1 | 16·8 | 43 | N | 17 | 0 | .. |
| March | 759·9 | .. | 31·1 | 13·1 | 20·4 | 31 | N | 22 | 0 | .. |
| April | 758·8 | .. | 34·1 | 17·1 | 24·3 | 28 | N 5 W | 19 | 0 | .. |
| May | 758·6 | .. | 36·5 | 19·9 | 27·3 | 26 | N 5 E | 23 | 0 | .. |
| June | 757·8 | .. | 40·2 | 23·0 | 31·2 | 23 | N 22 W | 19 | 0 | .. |
| July | 755·9 | .. | 40·4 | 24·4 | 32·4 | 27 | N | .. | 0 | .. |
| August | 755·8 | .. | 36·1 | 23·7 | 29·9 | 34 | N | .. | 0 | .. |
| September | .. | .. | .. | .. | .. | .. | .. | .. | .. | .. |
| October | .. | .. | .. | .. | .. | .. | .. | .. | .. | .. |
| November | .. | .. | .. | .. | .. | .. | .. | .. | .. | .. |
| December | .. | .. | .. | .. | .. | .. | .. | .. | .. | .. |
| Mean | .. | .. | .. | .. | .. | .. | .. | .. | .. | .. |
[219]
| 1902 | ||||||||||
| Month. | Barometer | Thermometer | Hu- mi- di- ty. |
Wind | RAINFALL IN MILLIMETRES |
|||||
|---|---|---|---|---|---|---|---|---|---|---|
| Mean. | Vari- ation from normal. |
Mean max. |
Mean min. |
Mean. | Direc- tion. |
Velo- city. |
Fall. | Vari- ation from normal. |
||
| January | 765·5 | +0·8 | 17·2 | 7·2 | 11·3 | 77 | N 06 W | 6·5 | 5 | -2 |
| February | 764·9 | +1·0 | 22·8 | 8·8 | 14·7 | 69 | N 28 W | 6·1 | 6 | +3 |
| March | 761·8 | -0·5 | 24·2 | 10·1 | 16·0 | 62 | N 48 W | 8·6 | 1 | -4 |
| April | 760·4 | -0·4 | 28·8 | 13·4 | 20·0 | 56 | N 10 W | 10·9 | 0 | -2 |
| May | 761·6 | +1·2 | 33·4 | 16·3 | 23·9 | 47 | N 8 W | 14·9 | 0 | -2 |
| June | 759·6 | -0·2 | 35·1 | 18·6 | 25·8 | 50 | N 20 W | 11·4 | 0 | 0 |
| July | 758·0 | +0·6 | 36·1 | 20·1 | 27·0 | 55 | N 18 W | 4·3 | 0 | 0 |
| August | 758·2 | +0·3 | 35·6 | 20·4 | 26·8 | 62 | N 12 E | 5·0 | 0 | 0 |
| September | 760·3 | -0·4 | 33·0 | 19·2 | 24·9 | 70 | N 27 E | 3·7 | 0 | 0 |
| October | 762·9 | +0·5 | 31·0 | 17·0 | 22·8 | 71 | N 15 E | 5·6 | 0 | -1 |
| November | 763·0 | -1·3 | 24·0 | 13·6 | 17·9 | 67 | S 59 W | 3·1 | 0 | -6 |
| December | 765·5 | +0·8 | 18·6 | 8·5 | 12·6 | 69 | S 35 W | 3·7 | 1 | -5 |
| Mean | 761·8 | +0·2 | 28·3 | 14·4 | 20·3 | 63 | N 24 W | 7·0 | 13 | -19 |
| 1903 | ||||||||||
| January | 767·2 | +2·5 | 17·7 | 6·0 | 10·7 | 80 | N 36 W | 5·1 | 2 | -5 |
| February | 767·6 | +3·7 | 18·7 | 6·2 | 11·3 | 72 | S 68 W | 5·6 | 2 | -1 |
| March | 764·2 | +1·9 | 22·3 | 9·3 | 14·7 | 69 | N 20 W | 7·7 | 8 | +3 |
| April | 760·4 | -0·4 | 29·6 | 13·6 | 20·3 | 57 | N 3 E | 9·3 | 1 | -1 |
| May | 761·7 | +1·3 | 34·0 | 15·4 | 22·6 | 47 | N 22 E | 12·0 | 0 | -2 |
| June | 759·4 | -0·4 | 34·8 | 18·5 | 26·1 | 49 | N 21 E | 12·0 | 0 | 0 |
| July | 758·4 | +1·0 | 34·6 | 19·7 | 26·1 | 60 | N 7 W | 10·0 | 0 | 0 |
| August | 757·8 | -0·1 | 34·7 | 20·7 | 26·6 | 62 | N 14 W | 6·0 | 0 | 0 |
| September | 761·4 | +0·7 | 30·7 | 18·1 | 23·4 | 72 | N 4 W | 6·0 | 0 | 0 |
| October | 763·7 | +1·3 | 28·0 | 15·1 | 20·5 | 74 | N 10 E | 6·4 | 0 | -1 |
| November | 764·9 | +0·6 | 23·1 | 10·7 | 16·0 | 68 | N 12 E | 6·1 | 0 | -6 |
| December | 764·3 | -0·4 | 20·1 | 7·8 | 12·8 | 76 | N 72 E | 4·4 | 10 | +4 |
| Mean | 762·6 | +1·0 | 27·4 | 13·4 | 19·3 | 65 | N 2 W | 7·5 | 23 | -9 |
| 1904 | ||||||||||
| January | 763·8 | -0·9 | 19·3 | 6·9 | 11·3 | 73 | N 39 E | 18·5 | 9 | +2 |
| February | 763·7 | -0·2 | 23·2 | 7·6 | 13·7 | 74 | S 26 W | 16·6 | 19 | +16 |
| March | 760·7 | -1·6 | 23·8 | 9·6 | 15·2 | 73 | N 51 W | 16·6 | 0 | -5 |
| April | 760·4 | -0·4 | 27·6 | 12·0 | 18·5 | 72 | N 34 E | 17·1 | 16 | +14 |
| May | 760·4 | 0 | 31·7 | 15·4 | 22·2 | 65 | N 29 W | 14·8 | 1 | 0 |
| June | 759·2 | -0·6 | 34·2 | 17·9 | 25·0 | 59 | N 30 W | 12·4 | 0 | 0 |
| July | 756·6 | -0·6 | 34·9 | 19·5 | 27·2 | 68 | N 8 W | .. | 0 | .. |
| August | 758·2 | -0·6 | 34·6 | 19·5 | 27·0 | 77 | N 14 W | .. | 0 | .. |
| September | .. | .. | .. | .. | .. | .. | .. | .. | .. | .. |
| October | .. | .. | .. | .. | .. | .. | .. | .. | .. | .. |
| November | .. | .. | .. | .. | .. | .. | .. | .. | .. | .. |
| December | .. | .. | .. | .. | .. | .. | .. | .. | .. | .. |
| Mean | .. | .. | .. | .. | .. | .. | .. | .. | .. | .. |
[220]
| 1902 | ||||||||||
| Month. | Barometer | Thermometer | Hu- mi- di- ty. |
Wind | RAINFALL IN MILLIMETRES |
|||||
|---|---|---|---|---|---|---|---|---|---|---|
| Mean. | Vari- ation from normal. |
Mean max. |
Mean min. |
Mean. | Direc- tion. |
Velo- city. |
Fall. | Vari- ation from normal. |
||
| January | 764·5 | +0·8 | 18·3 | 10·3 | 13·3 | 70 | N 52 W | 22 | 104 | +50 |
| February | 764·4 | +1·4 | 22·3 | 12·6 | 15·9 | 69 | N 45 E | 18 | 8 | -14 |
| March | 761·3 | -0·5 | 20·6 | 13·0 | 15·8 | 68 | N 15 W | 19 | 4 | -13 |
| April | 760·4 | -1·1 | 22·8 | 14·9 | 17·8 | 71 | N 8 E | 18 | 5 | +3 |
| May | 762·0 | +1·5 | 26·8 | 18·2 | 20·9 | 64 | N 20 E | 16 | 0 | -13 |
| June | 759·9 | -0·6 | 27·1 | 18·6 | 22·1 | 72 | N 5 W | 17 | 0 | 0 |
| July | 758·1 | +0·1 | 30·4 | 21·7 | 24·2 | 73 | N 28 W | 18 | 0 | 0 |
| August | 758·5 | -0·1 | 31·8 | 23·3 | 25·1 | 73 | N 7 W | 18 | 0 | 0 |
| September | 760·4 | -0·5 | 32·4 | 22·5 | 24·6 | 70 | N 6 E | 18 | 0 | -1 |
| October | 763·0 | +0·4 | 27·9 | 20·7 | 23·0 | 74 | N 40 E | 16 | 5 | -4 |
| November | 762·2 | -1·8 | 23·4 | 15·2 | 18·0 | 72 | N 60 W | 17 | 36 | -3 |
| December | 764·3 | +0·4 | 18·1 | 10·8 | 13·5 | 74 | S 71 W | 23 | 92 | +12 |
| Mean | 761·6 | 0 | 25·2 | 16·9 | 19·5 | 71 | N 11 W | 19 | 254 | +27 |
| 1903 | ||||||||||
| January | 766·6 | +2·9 | 16·7 | 9·8 | 12·7 | 78 | N 6 E | 18 | 90 | +36 |
| February | 767·0 | +4·0 | 17·8 | 10·3 | 13·2 | 72 | N 52 W | 18 | 34 | +12 |
| March | 763·8 | +2·0 | 19·5 | 11·8 | 14·8 | 72 | N 4 E | 21 | 14 | -3 |
| April | 760·5 | -1·0 | 24·2 | 13·7 | 17·1 | 72 | N 30 E | 21 | 1 | -2 |
| May | 762·2 | +1·7 | 25·9 | 16·8 | 20·6 | 70 | N 25 E | 18 | 0 | -13 |
| June | 759·8 | -0·7 | 27·8 | 18·5 | 22·0 | 74 | N | 22 | 0 | 0 |
| July | 758·5 | +0·5 | 29·1 | 20·1 | 23·7 | 74 | N 22 W | 26 | 0 | 0 |
| August | 757·7 | -0·9 | 30·8 | 20·6 | 24·4 | 78 | N 17 W | 21 | 0 | 0 |
| September | 761·4 | +0·5 | 30·0 | 18·9 | 23·3 | 68 | N 2 W | 22 | 0 | -1 |
| October | 763·6 | +1·0 | 27·2 | 17·1 | 21·0 | 70 | N 17 E | 21 | 0 | -9 |
| November | 764·5 | +0·5 | 23·6 | 13·1 | 17·1 | 72 | N 2 E | 25 | 10 | -28 |
| December | 763·7 | -0·2 | 21·3 | 11·4 | 15·2 | 76 | N 62 W | 18 | 24 | -57 |
| Mean | 762·4 | +0·8 | 24·5 | 16·0 | 18·6 | 73 | N 5 W | 21 | 173 | -65 |
| 1904 | ||||||||||
| January | 763·9 | +0·2 | 18·5 | 9·1 | 12·4 | 76 | N 3 E | 23 | 63 | +9 |
| February | 763·9 | +0·9 | 21·0 | 10·2 | 13·8 | 79 | N 13 W | 21 | 13 | -10 |
| March | 760·8 | -1·0 | 21·2 | 11·4 | 14·5 | 77 | N 8 E | 29 | 1 | -16 |
| April | 761·6 | -0·1 | 23·1 | 13·4 | 16·2 | 82 | N 12 W | 28 | 2 | 0 |
| May | 761·5 | +1·0 | 26·2 | 16·3 | 18·8 | 85 | N 3 W | 24 | — | -13 |
| June | 760·4 | -0·1 | 28·5 | 19·2 | 21·9 | 83 | N 12 W | 28 | 0 | -0 |
| July | 756·5 | +0·4 | 30·2 | 21·0 | 25·6 | 73 | N 40 W | 25 | 0 | -0 |
| August | 758·2 | +0·5 | 30·7 | 21·4 | 26·0 | 72 | N 12 W | 25 | 1 | +1 |
| September | .. | .. | .. | .. | .. | .. | .. | .. | .. | .. |
| October | .. | .. | .. | .. | .. | .. | .. | .. | .. | .. |
| November | .. | .. | .. | .. | .. | .. | .. | .. | .. | .. |
| December | .. | .. | .. | .. | .. | .. | .. | .. | .. | .. |
| Mean | .. | .. | .. | .. | .. | .. | .. | .. | .. | .. |
[221]
Inconsistent, archaic and unusual transcriptions, spelling, hyphenation, punctuation, use of accents, etc. (including in names) and repeated information have been retained (even when occurring on the same page or in the same sentence), except as mentioned below. The use of periods, mid-level decimal points and commas in numbers has not been standardised.
Plate II: the data as mentioned in the errata have not been corrected in the Plate.
Page 51-52, table, last column: 199 and 1877 are not in the range of years under consideration.
Page 97, table header: the years are out of order, possibly erroneously.
Page 203: the table header does not appear to agree with the contents; presumably, the first group of rows refers to 1876.
Page 209, column Pic 16, row 14: 4·11 does not fit with the other data and may be an error for 8·11.
In the source document, the Plates are not always printed in numerical order (see also the List of Plates), this has not been changed.
Larger scale illustrations are available in the web browser version, available at www.gutenberg.org.
Grey text around illustrations is text copied from within the illustrations; these texts are intended to explain the contents of the illustrations, not as a full transcription of the text.
Unless mentioned below under “Changes Made”, all (tabulated or text) data and calculations are presented as printed in the source document, even when there are obvious errors or inconsistencies in these data or calculations.
Changes made
Some footnotes, tables and illustrations moved; some tables re-arranged.
Some minor obvious typos corrected silently
R.L. and R. L. have been standardised as R. L, spaces between numbers and percent signs have been removed where present.
Appendices: the numbering of some of the tables has been corrected, some minor lay-out inconsistencies have been resolved.
page 12: Afrika’s Ströme and Flüsse changed to Afrikas Ströme und Flüsse
page 32: Fort Barkeley changed to Fort Berkeley as elsewhere
page 36: 15. The Sobat River changed to 16. The Sobat River
page 70, Section 30: italics changed to bold as with other headings
page 72, calculations: Total materials taken out of category Materials not paid for
page 74: Mehemet Aly changed to Mehemet Ali as elsewhere
page 119: Absynian Hills changed to Abyssinian Hills
page 128, table header: column 2, Gondokoro changed to Khartoum; column 3, Khartoum changed to Rosaires
page 129-130: these pages were reversed in the printed book
page 145: Dulab Hilla changed to Dulaib Hilla as elsewhere
page 160: Sobagia changed to Sohagia; Shekha changed to Shekhia
pages 168, 175-178, 188-189, 194, 202-203, 207-208 table headings: names of months have been abbreviated
Index (to conform to text): Kashm changed to Khasm as in text (several times); Emim Pasha changed to Emin Pasha.
End of the Project Gutenberg EBook of The Nile in 1904, by William Willcocks

*** END OF THIS PROJECT GUTENBERG EBOOK THE NILE IN 1904 ***

***** This file should be named 57379-h.htm or 57379-h.zip *****
This and all associated files of various formats will be found in:
        http://www.gutenberg.org/5/7/3/7/57379/

Produced by Chris Curnow, Harry Lamé and the Online
Distributed Proofreading Team at http://www.pgdp.net (This
file was produced from images generously made available
by The Internet Archive)


Updated editions will replace the previous one--the old editions will
be renamed.

Creating the works from print editions not protected by U.S. copyright
law means that no one owns a United States copyright in these works,
so the Foundation (and you!) can copy and distribute it in the United
States without permission and without paying copyright
royalties. Special rules, set forth in the General Terms of Use part
of this license, apply to copying and distributing Project
Gutenberg-tm electronic works to protect the PROJECT GUTENBERG-tm
concept and trademark. Project Gutenberg is a registered trademark,
and may not be used if you charge for the eBooks, unless you receive
specific permission. If you do not charge anything for copies of this
eBook, complying with the rules is very easy. You may use this eBook
for nearly any purpose such as creation of derivative works, reports,
performances and research. They may be modified and printed and given
away--you may do practically ANYTHING in the United States with eBooks
not protected by U.S. copyright law. Redistribution is subject to the
trademark license, especially commercial redistribution.

START: FULL LICENSE

THE FULL PROJECT GUTENBERG LICENSE
PLEASE READ THIS BEFORE YOU DISTRIBUTE OR USE THIS WORK

To protect the Project Gutenberg-tm mission of promoting the free
distribution of electronic works, by using or distributing this work
(or any other work associated in any way with the phrase "Project
Gutenberg"), you agree to comply with all the terms of the Full
Project Gutenberg-tm License available with this file or online at
www.gutenberg.org/license.

Section 1. General Terms of Use and Redistributing Project
Gutenberg-tm electronic works

1.A. By reading or using any part of this Project Gutenberg-tm
electronic work, you indicate that you have read, understand, agree to
and accept all the terms of this license and intellectual property
(trademark/copyright) agreement. If you do not agree to abide by all
the terms of this agreement, you must cease using and return or
destroy all copies of Project Gutenberg-tm electronic works in your
possession. If you paid a fee for obtaining a copy of or access to a
Project Gutenberg-tm electronic work and you do not agree to be bound
by the terms of this agreement, you may obtain a refund from the
person or entity to whom you paid the fee as set forth in paragraph
1.E.8.

1.B. "Project Gutenberg" is a registered trademark. It may only be
used on or associated in any way with an electronic work by people who
agree to be bound by the terms of this agreement. There are a few
things that you can do with most Project Gutenberg-tm electronic works
even without complying with the full terms of this agreement. See
paragraph 1.C below. There are a lot of things you can do with Project
Gutenberg-tm electronic works if you follow the terms of this
agreement and help preserve free future access to Project Gutenberg-tm
electronic works. See paragraph 1.E below.

1.C. The Project Gutenberg Literary Archive Foundation ("the
Foundation" or PGLAF), owns a compilation copyright in the collection
of Project Gutenberg-tm electronic works. Nearly all the individual
works in the collection are in the public domain in the United
States. If an individual work is unprotected by copyright law in the
United States and you are located in the United States, we do not
claim a right to prevent you from copying, distributing, performing,
displaying or creating derivative works based on the work as long as
all references to Project Gutenberg are removed. Of course, we hope
that you will support the Project Gutenberg-tm mission of promoting
free access to electronic works by freely sharing Project Gutenberg-tm
works in compliance with the terms of this agreement for keeping the
Project Gutenberg-tm name associated with the work. You can easily
comply with the terms of this agreement by keeping this work in the
same format with its attached full Project Gutenberg-tm License when
you share it without charge with others.

1.D. The copyright laws of the place where you are located also govern
what you can do with this work. Copyright laws in most countries are
in a constant state of change. If you are outside the United States,
check the laws of your country in addition to the terms of this
agreement before downloading, copying, displaying, performing,
distributing or creating derivative works based on this work or any
other Project Gutenberg-tm work. The Foundation makes no
representations concerning the copyright status of any work in any
country outside the United States.

1.E. Unless you have removed all references to Project Gutenberg:

1.E.1. The following sentence, with active links to, or other
immediate access to, the full Project Gutenberg-tm License must appear
prominently whenever any copy of a Project Gutenberg-tm work (any work
on which the phrase "Project Gutenberg" appears, or with which the
phrase "Project Gutenberg" is associated) is accessed, displayed,
performed, viewed, copied or distributed:

  This eBook is for the use of anyone anywhere in the United States and
  most other parts of the world at no cost and with almost no
  restrictions whatsoever. You may copy it, give it away or re-use it
  under the terms of the Project Gutenberg License included with this
  eBook or online at www.gutenberg.org. If you are not located in the
  United States, you'll have to check the laws of the country where you
  are located before using this ebook.

1.E.2. If an individual Project Gutenberg-tm electronic work is
derived from texts not protected by U.S. copyright law (does not
contain a notice indicating that it is posted with permission of the
copyright holder), the work can be copied and distributed to anyone in
the United States without paying any fees or charges. If you are
redistributing or providing access to a work with the phrase "Project
Gutenberg" associated with or appearing on the work, you must comply
either with the requirements of paragraphs 1.E.1 through 1.E.7 or
obtain permission for the use of the work and the Project Gutenberg-tm
trademark as set forth in paragraphs 1.E.8 or 1.E.9.

1.E.3. If an individual Project Gutenberg-tm electronic work is posted
with the permission of the copyright holder, your use and distribution
must comply with both paragraphs 1.E.1 through 1.E.7 and any
additional terms imposed by the copyright holder. Additional terms
will be linked to the Project Gutenberg-tm License for all works
posted with the permission of the copyright holder found at the
beginning of this work.

1.E.4. Do not unlink or detach or remove the full Project Gutenberg-tm
License terms from this work, or any files containing a part of this
work or any other work associated with Project Gutenberg-tm.

1.E.5. Do not copy, display, perform, distribute or redistribute this
electronic work, or any part of this electronic work, without
prominently displaying the sentence set forth in paragraph 1.E.1 with
active links or immediate access to the full terms of the Project
Gutenberg-tm License.

1.E.6. You may convert to and distribute this work in any binary,
compressed, marked up, nonproprietary or proprietary form, including
any word processing or hypertext form. However, if you provide access
to or distribute copies of a Project Gutenberg-tm work in a format
other than "Plain Vanilla ASCII" or other format used in the official
version posted on the official Project Gutenberg-tm web site
(www.gutenberg.org), you must, at no additional cost, fee or expense
to the user, provide a copy, a means of exporting a copy, or a means
of obtaining a copy upon request, of the work in its original "Plain
Vanilla ASCII" or other form. Any alternate format must include the
full Project Gutenberg-tm License as specified in paragraph 1.E.1.

1.E.7. Do not charge a fee for access to, viewing, displaying,
performing, copying or distributing any Project Gutenberg-tm works
unless you comply with paragraph 1.E.8 or 1.E.9.

1.E.8. You may charge a reasonable fee for copies of or providing
access to or distributing Project Gutenberg-tm electronic works
provided that

* You pay a royalty fee of 20% of the gross profits you derive from
  the use of Project Gutenberg-tm works calculated using the method
  you already use to calculate your applicable taxes. The fee is owed
  to the owner of the Project Gutenberg-tm trademark, but he has
  agreed to donate royalties under this paragraph to the Project
  Gutenberg Literary Archive Foundation. Royalty payments must be paid
  within 60 days following each date on which you prepare (or are
  legally required to prepare) your periodic tax returns. Royalty
  payments should be clearly marked as such and sent to the Project
  Gutenberg Literary Archive Foundation at the address specified in
  Section 4, "Information about donations to the Project Gutenberg
  Literary Archive Foundation."

* You provide a full refund of any money paid by a user who notifies
  you in writing (or by e-mail) within 30 days of receipt that s/he
  does not agree to the terms of the full Project Gutenberg-tm
  License. You must require such a user to return or destroy all
  copies of the works possessed in a physical medium and discontinue
  all use of and all access to other copies of Project Gutenberg-tm
  works.

* You provide, in accordance with paragraph 1.F.3, a full refund of
  any money paid for a work or a replacement copy, if a defect in the
  electronic work is discovered and reported to you within 90 days of
  receipt of the work.

* You comply with all other terms of this agreement for free
  distribution of Project Gutenberg-tm works.

1.E.9. If you wish to charge a fee or distribute a Project
Gutenberg-tm electronic work or group of works on different terms than
are set forth in this agreement, you must obtain permission in writing
from both the Project Gutenberg Literary Archive Foundation and The
Project Gutenberg Trademark LLC, the owner of the Project Gutenberg-tm
trademark. Contact the Foundation as set forth in Section 3 below.

1.F.

1.F.1. Project Gutenberg volunteers and employees expend considerable
effort to identify, do copyright research on, transcribe and proofread
works not protected by U.S. copyright law in creating the Project
Gutenberg-tm collection. Despite these efforts, Project Gutenberg-tm
electronic works, and the medium on which they may be stored, may
contain "Defects," such as, but not limited to, incomplete, inaccurate
or corrupt data, transcription errors, a copyright or other
intellectual property infringement, a defective or damaged disk or
other medium, a computer virus, or computer codes that damage or
cannot be read by your equipment.

1.F.2. LIMITED WARRANTY, DISCLAIMER OF DAMAGES - Except for the "Right
of Replacement or Refund" described in paragraph 1.F.3, the Project
Gutenberg Literary Archive Foundation, the owner of the Project
Gutenberg-tm trademark, and any other party distributing a Project
Gutenberg-tm electronic work under this agreement, disclaim all
liability to you for damages, costs and expenses, including legal
fees. YOU AGREE THAT YOU HAVE NO REMEDIES FOR NEGLIGENCE, STRICT
LIABILITY, BREACH OF WARRANTY OR BREACH OF CONTRACT EXCEPT THOSE
PROVIDED IN PARAGRAPH 1.F.3. YOU AGREE THAT THE FOUNDATION, THE
TRADEMARK OWNER, AND ANY DISTRIBUTOR UNDER THIS AGREEMENT WILL NOT BE
LIABLE TO YOU FOR ACTUAL, DIRECT, INDIRECT, CONSEQUENTIAL, PUNITIVE OR
INCIDENTAL DAMAGES EVEN IF YOU GIVE NOTICE OF THE POSSIBILITY OF SUCH
DAMAGE.

1.F.3. LIMITED RIGHT OF REPLACEMENT OR REFUND - If you discover a
defect in this electronic work within 90 days of receiving it, you can
receive a refund of the money (if any) you paid for it by sending a
written explanation to the person you received the work from. If you
received the work on a physical medium, you must return the medium
with your written explanation. The person or entity that provided you
with the defective work may elect to provide a replacement copy in
lieu of a refund. If you received the work electronically, the person
or entity providing it to you may choose to give you a second
opportunity to receive the work electronically in lieu of a refund. If
the second copy is also defective, you may demand a refund in writing
without further opportunities to fix the problem.

1.F.4. Except for the limited right of replacement or refund set forth
in paragraph 1.F.3, this work is provided to you 'AS-IS', WITH NO
OTHER WARRANTIES OF ANY KIND, EXPRESS OR IMPLIED, INCLUDING BUT NOT
LIMITED TO WARRANTIES OF MERCHANTABILITY OR FITNESS FOR ANY PURPOSE.

1.F.5. Some states do not allow disclaimers of certain implied
warranties or the exclusion or limitation of certain types of
damages. If any disclaimer or limitation set forth in this agreement
violates the law of the state applicable to this agreement, the
agreement shall be interpreted to make the maximum disclaimer or
limitation permitted by the applicable state law. The invalidity or
unenforceability of any provision of this agreement shall not void the
remaining provisions.

1.F.6. INDEMNITY - You agree to indemnify and hold the Foundation, the
trademark owner, any agent or employee of the Foundation, anyone
providing copies of Project Gutenberg-tm electronic works in
accordance with this agreement, and any volunteers associated with the
production, promotion and distribution of Project Gutenberg-tm
electronic works, harmless from all liability, costs and expenses,
including legal fees, that arise directly or indirectly from any of
the following which you do or cause to occur: (a) distribution of this
or any Project Gutenberg-tm work, (b) alteration, modification, or
additions or deletions to any Project Gutenberg-tm work, and (c) any
Defect you cause.

Section 2. Information about the Mission of Project Gutenberg-tm

Project Gutenberg-tm is synonymous with the free distribution of
electronic works in formats readable by the widest variety of
computers including obsolete, old, middle-aged and new computers. It
exists because of the efforts of hundreds of volunteers and donations
from people in all walks of life.

Volunteers and financial support to provide volunteers with the
assistance they need are critical to reaching Project Gutenberg-tm's
goals and ensuring that the Project Gutenberg-tm collection will
remain freely available for generations to come. In 2001, the Project
Gutenberg Literary Archive Foundation was created to provide a secure
and permanent future for Project Gutenberg-tm and future
generations. To learn more about the Project Gutenberg Literary
Archive Foundation and how your efforts and donations can help, see
Sections 3 and 4 and the Foundation information page at
www.gutenberg.org Section 3. Information about the Project Gutenberg
Literary Archive Foundation

The Project Gutenberg Literary Archive Foundation is a non profit
501(c)(3) educational corporation organized under the laws of the
state of Mississippi and granted tax exempt status by the Internal
Revenue Service. The Foundation's EIN or federal tax identification
number is 64-6221541. Contributions to the Project Gutenberg Literary
Archive Foundation are tax deductible to the full extent permitted by
U.S. federal laws and your state's laws.

The Foundation's principal office is in Fairbanks, Alaska, with the
mailing address: PO Box 750175, Fairbanks, AK 99775, but its
volunteers and employees are scattered throughout numerous
locations. Its business office is located at 809 North 1500 West, Salt
Lake City, UT 84116, (801) 596-1887. Email contact links and up to
date contact information can be found at the Foundation's web site and
official page at www.gutenberg.org/contact

For additional contact information:

    Dr. Gregory B. Newby
    Chief Executive and Director
    gbnewby@pglaf.org

Section 4. Information about Donations to the Project Gutenberg
Literary Archive Foundation

Project Gutenberg-tm depends upon and cannot survive without wide
spread public support and donations to carry out its mission of
increasing the number of public domain and licensed works that can be
freely distributed in machine readable form accessible by the widest
array of equipment including outdated equipment. Many small donations
($1 to $5,000) are particularly important to maintaining tax exempt
status with the IRS.

The Foundation is committed to complying with the laws regulating
charities and charitable donations in all 50 states of the United
States. Compliance requirements are not uniform and it takes a
considerable effort, much paperwork and many fees to meet and keep up
with these requirements. We do not solicit donations in locations
where we have not received written confirmation of compliance. To SEND
DONATIONS or determine the status of compliance for any particular
state visit www.gutenberg.org/donate

While we cannot and do not solicit contributions from states where we
have not met the solicitation requirements, we know of no prohibition
against accepting unsolicited donations from donors in such states who
approach us with offers to donate.

International donations are gratefully accepted, but we cannot make
any statements concerning tax treatment of donations received from
outside the United States. U.S. laws alone swamp our small staff.

Please check the Project Gutenberg Web pages for current donation
methods and addresses. Donations are accepted in a number of other
ways including checks, online payments and credit card donations. To
donate, please visit: www.gutenberg.org/donate

Section 5. General Information About Project Gutenberg-tm electronic works.

Professor Michael S. Hart was the originator of the Project
Gutenberg-tm concept of a library of electronic works that could be
freely shared with anyone. For forty years, he produced and
distributed Project Gutenberg-tm eBooks with only a loose network of
volunteer support.

Project Gutenberg-tm eBooks are often created from several printed
editions, all of which are confirmed as not protected by copyright in
the U.S. unless a copyright notice is included. Thus, we do not
necessarily keep eBooks in compliance with any particular paper
edition.

Most people start at our Web site which has the main PG search
facility: www.gutenberg.org

This Web site includes information about Project Gutenberg-tm,
including how to make donations to the Project Gutenberg Literary
Archive Foundation, how to help produce our new eBooks, and how to
subscribe to our email newsletter to hear about new eBooks.
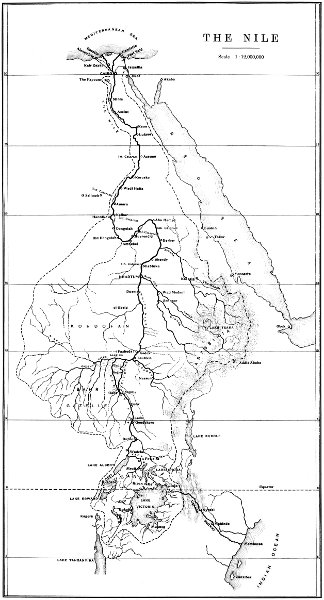
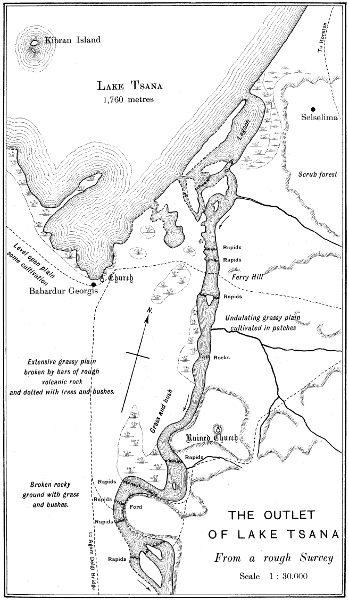

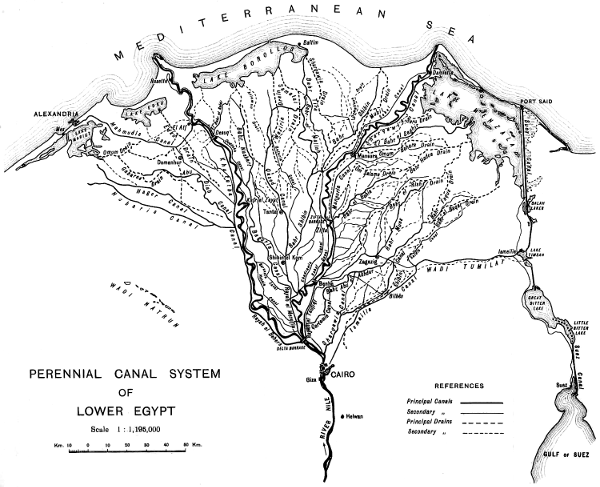
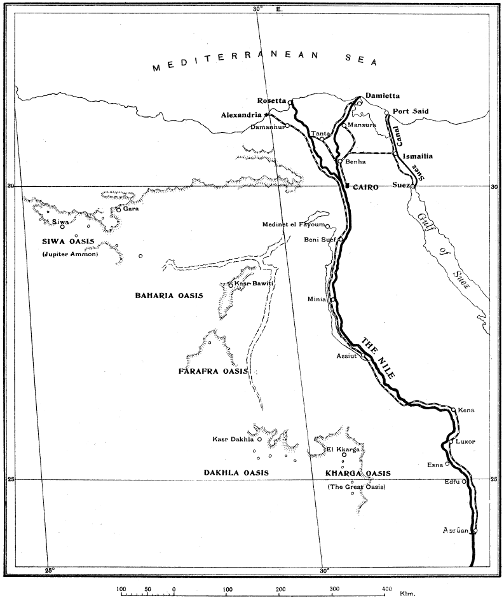
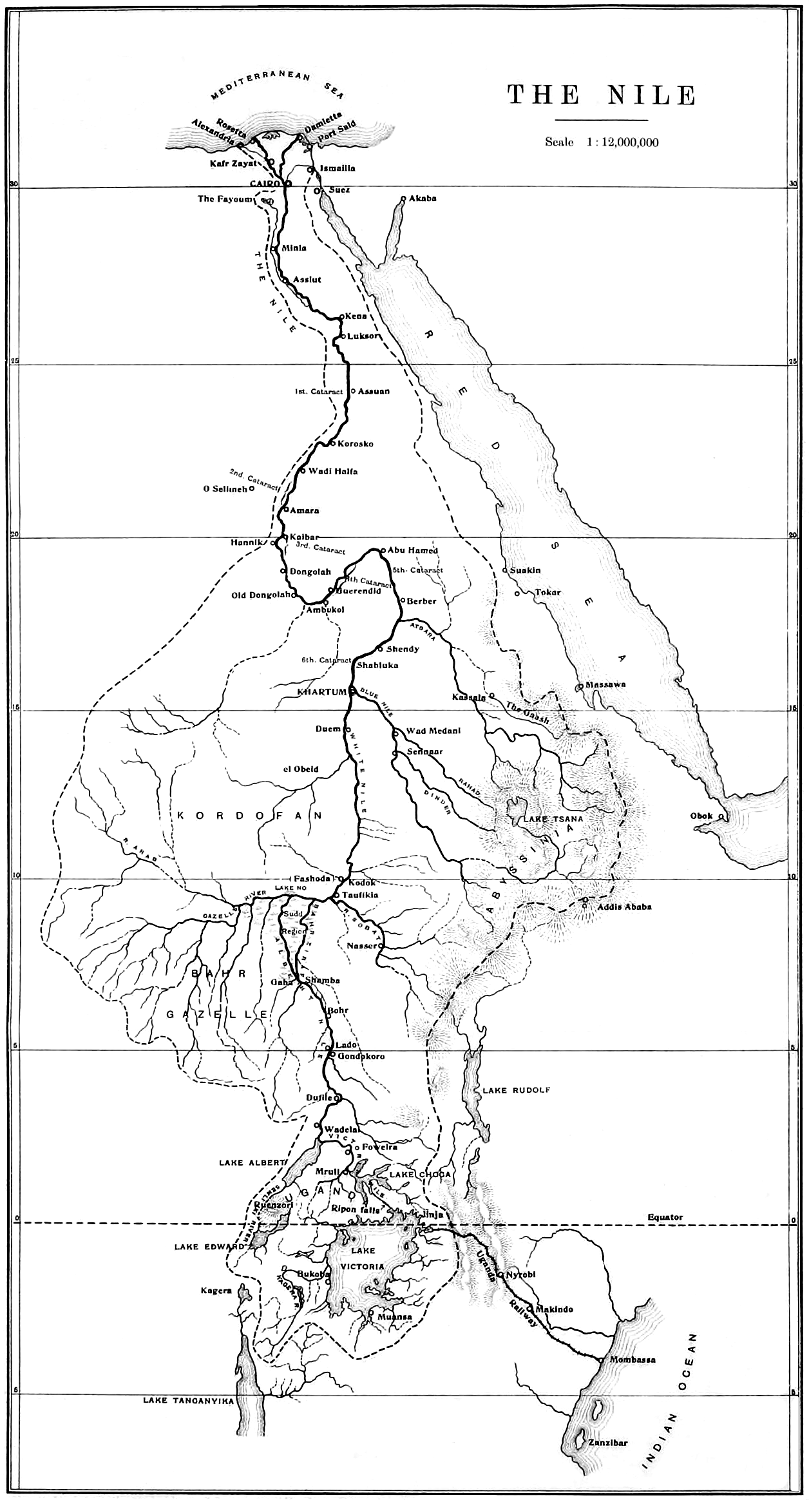
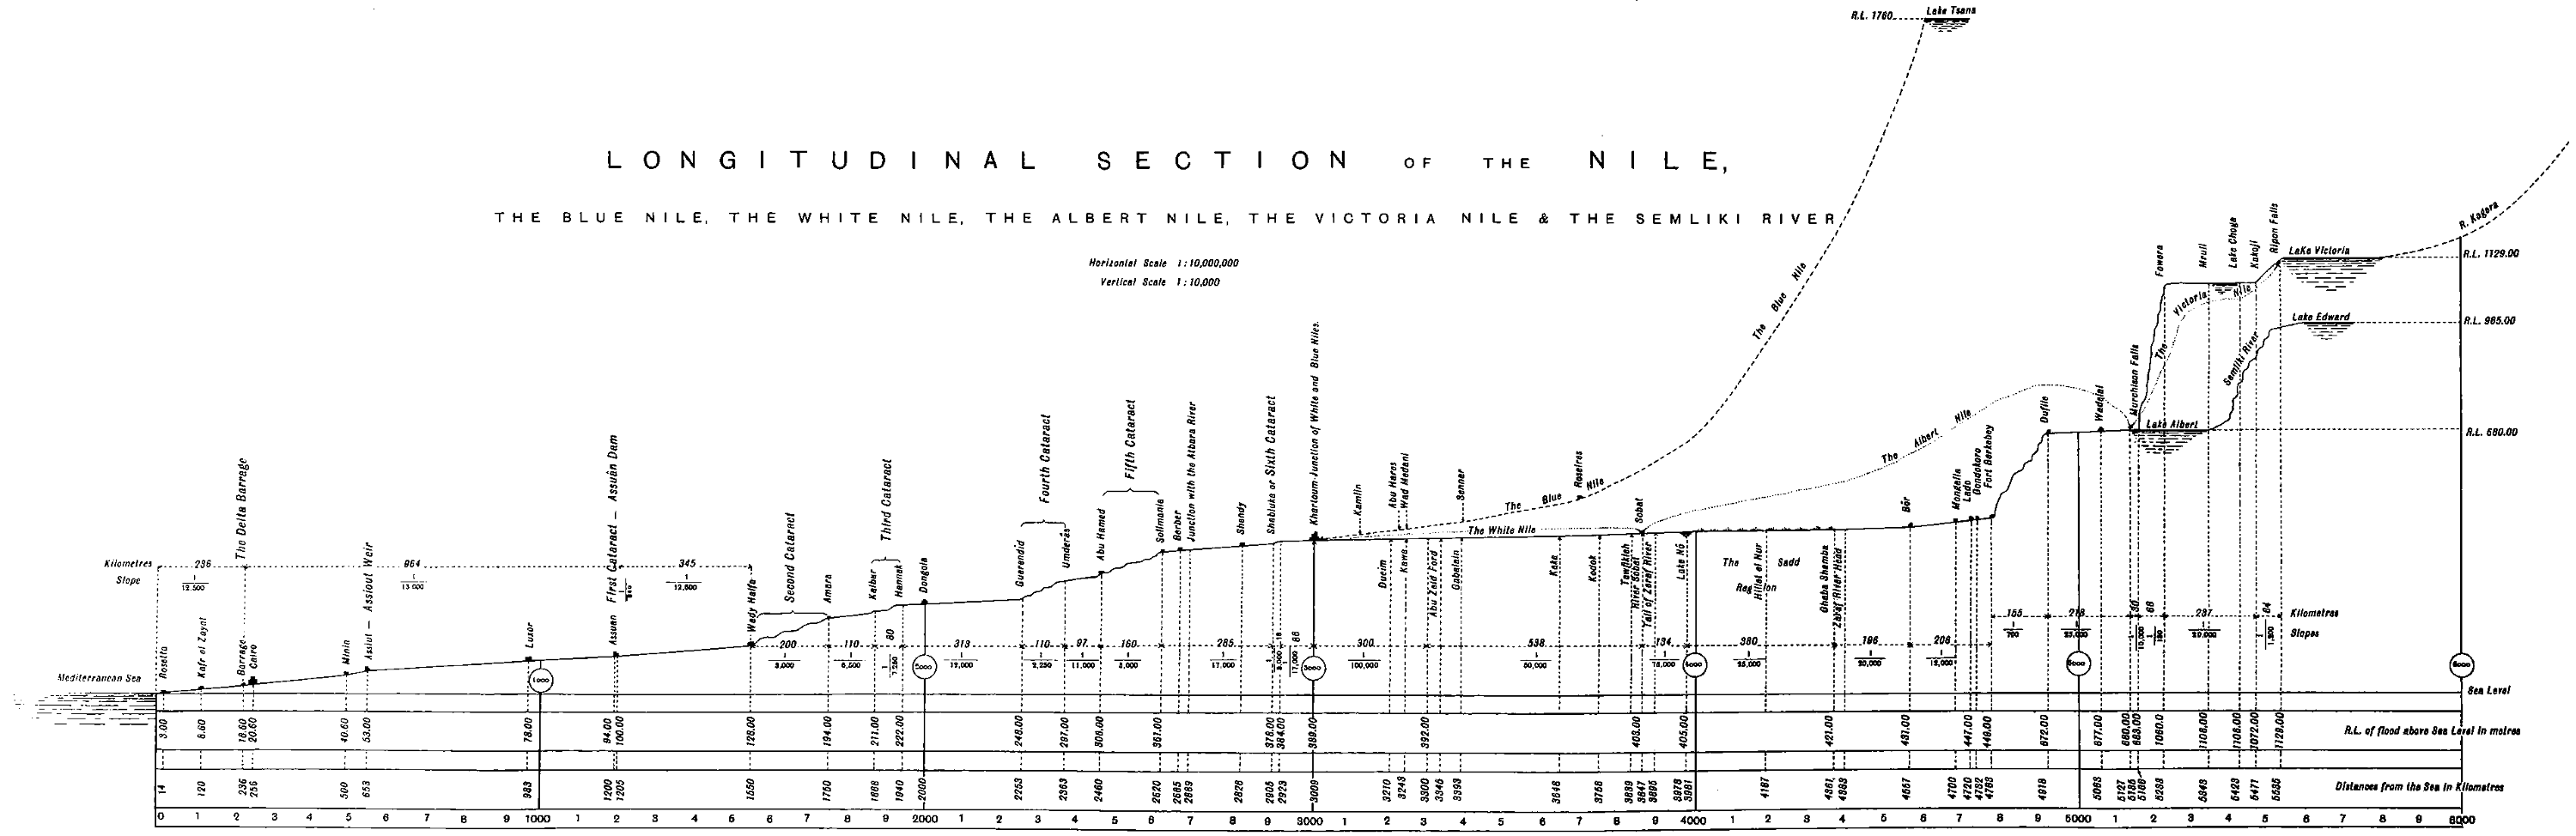
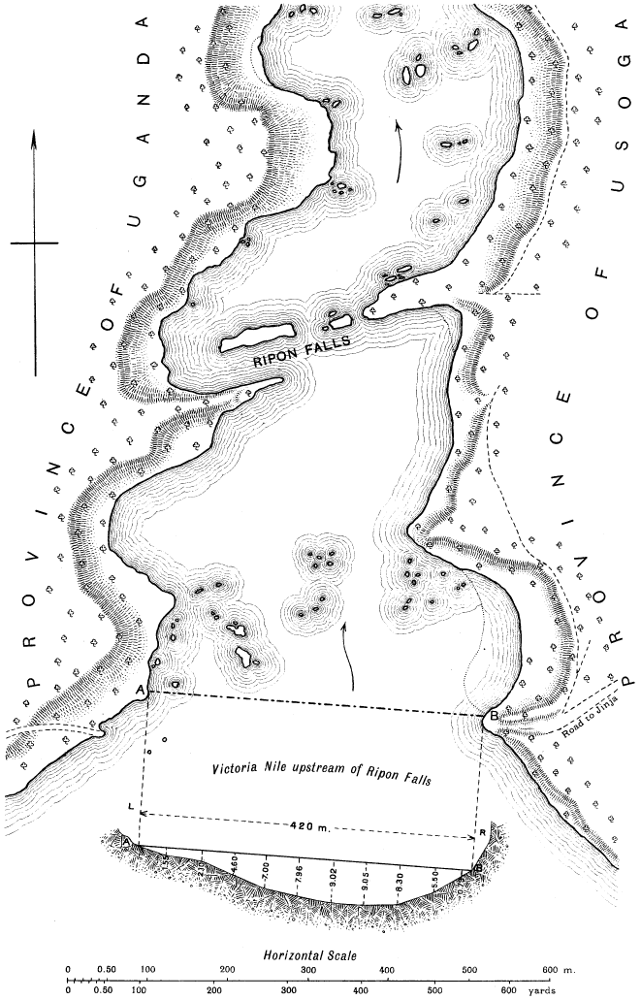
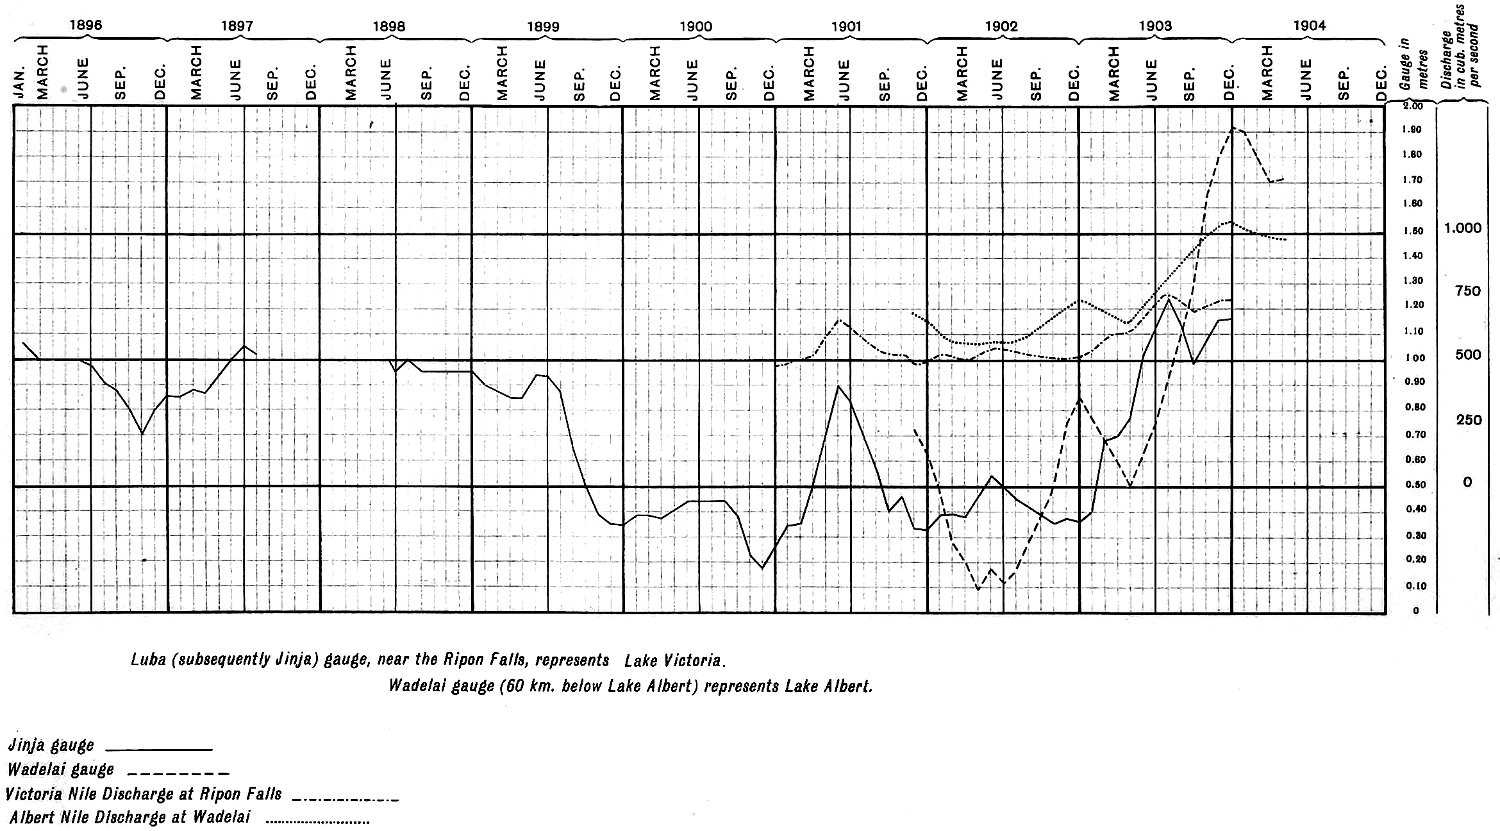
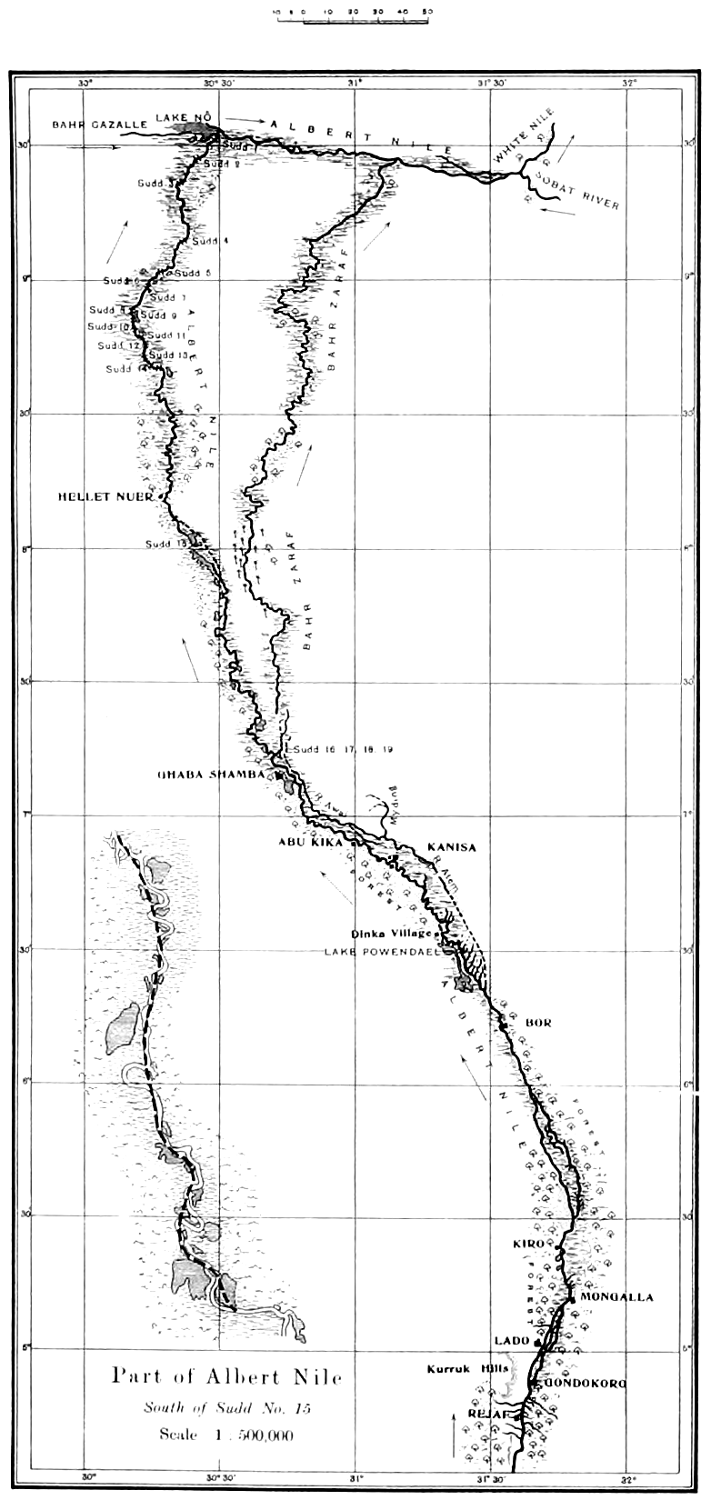
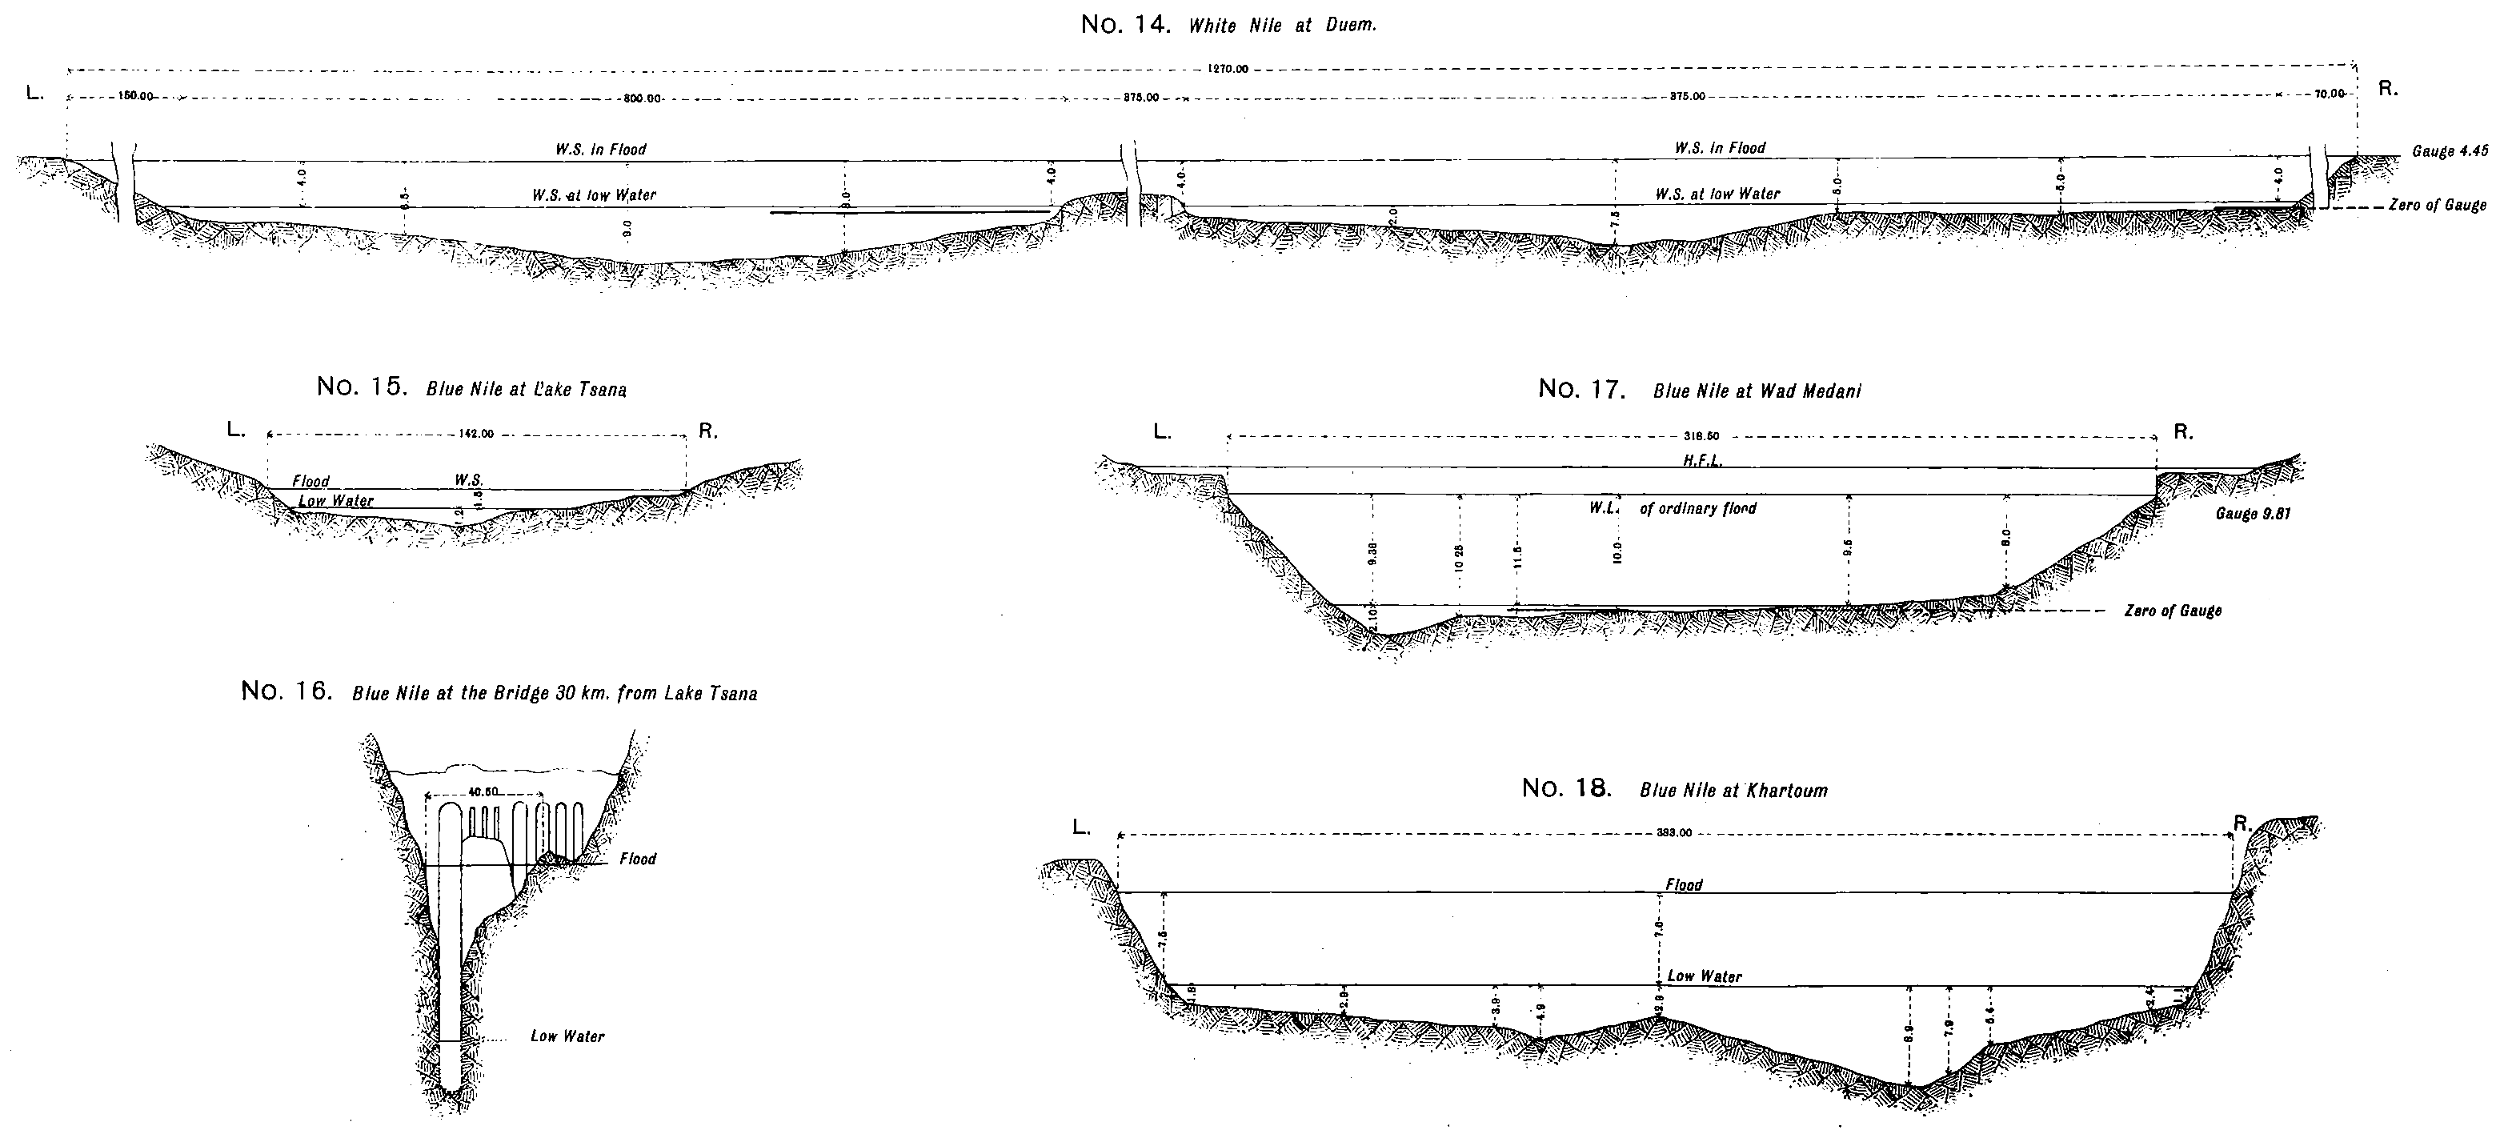
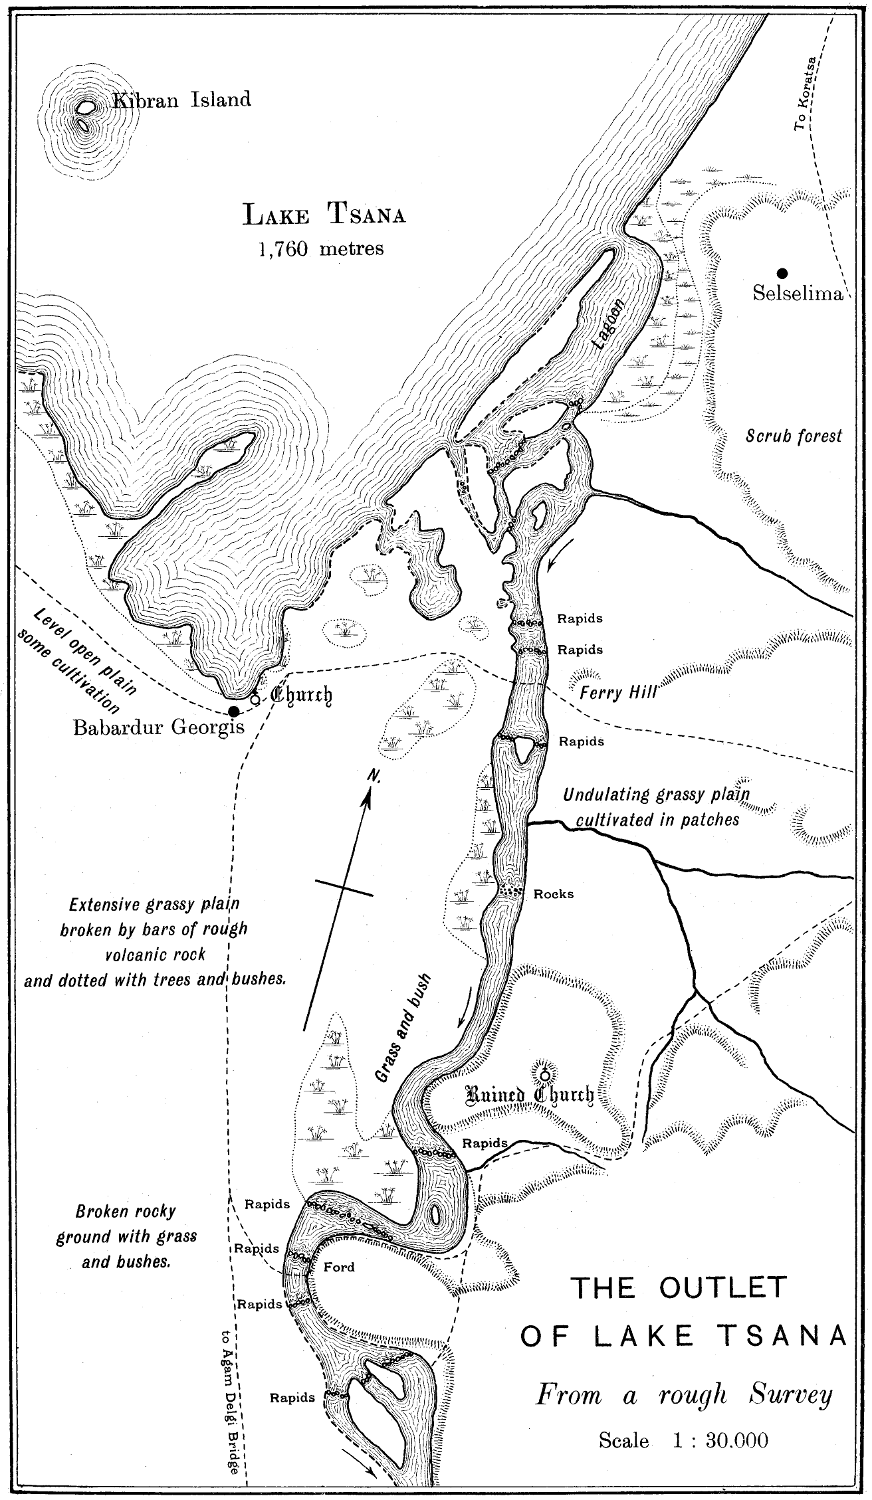
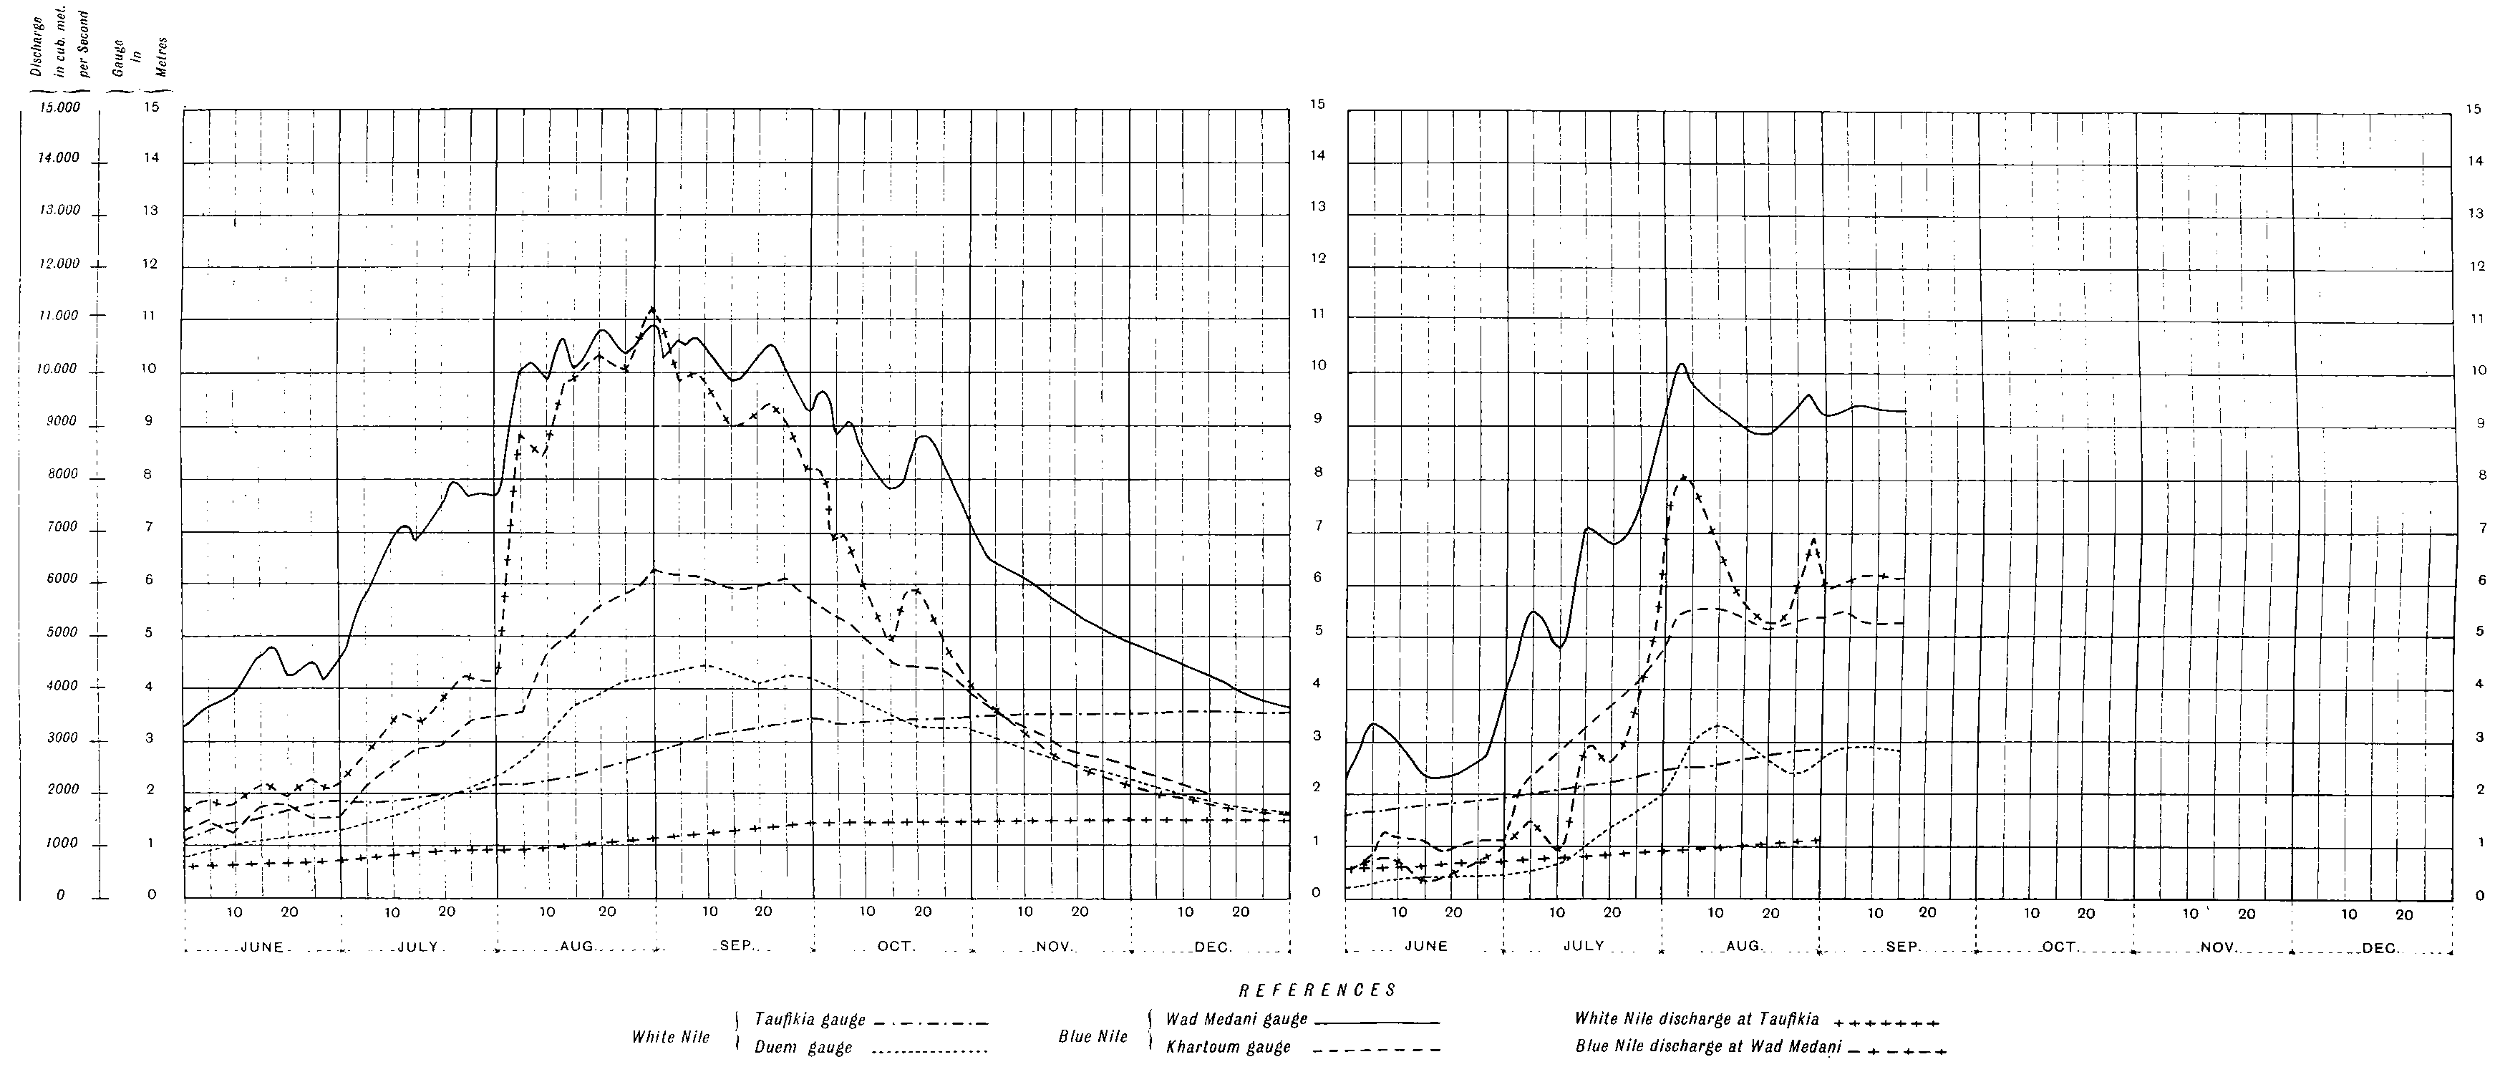
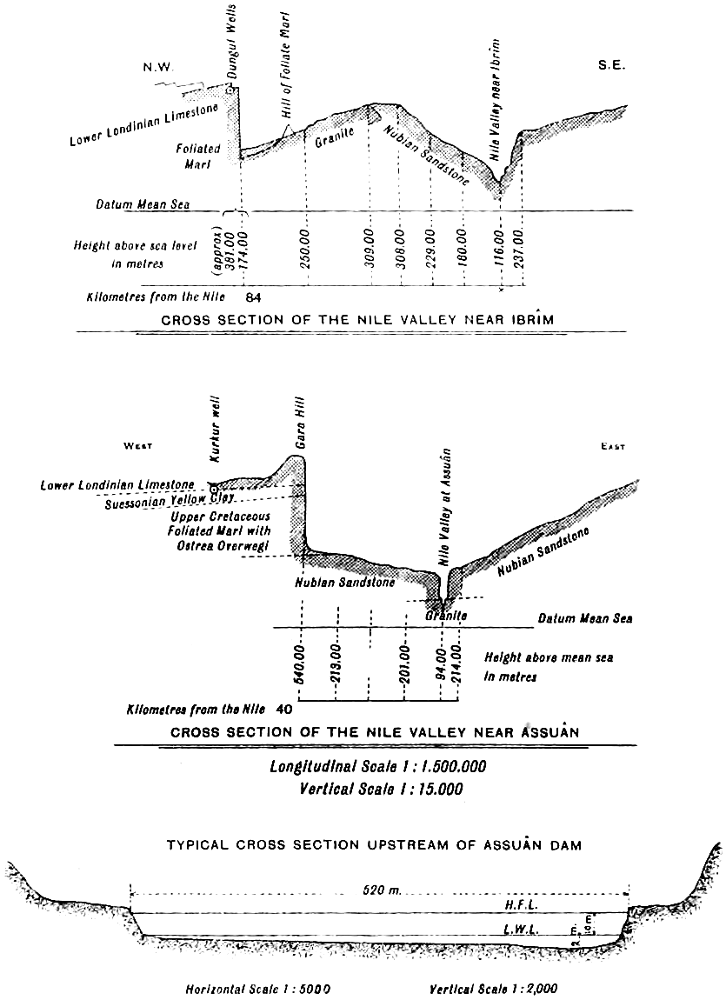
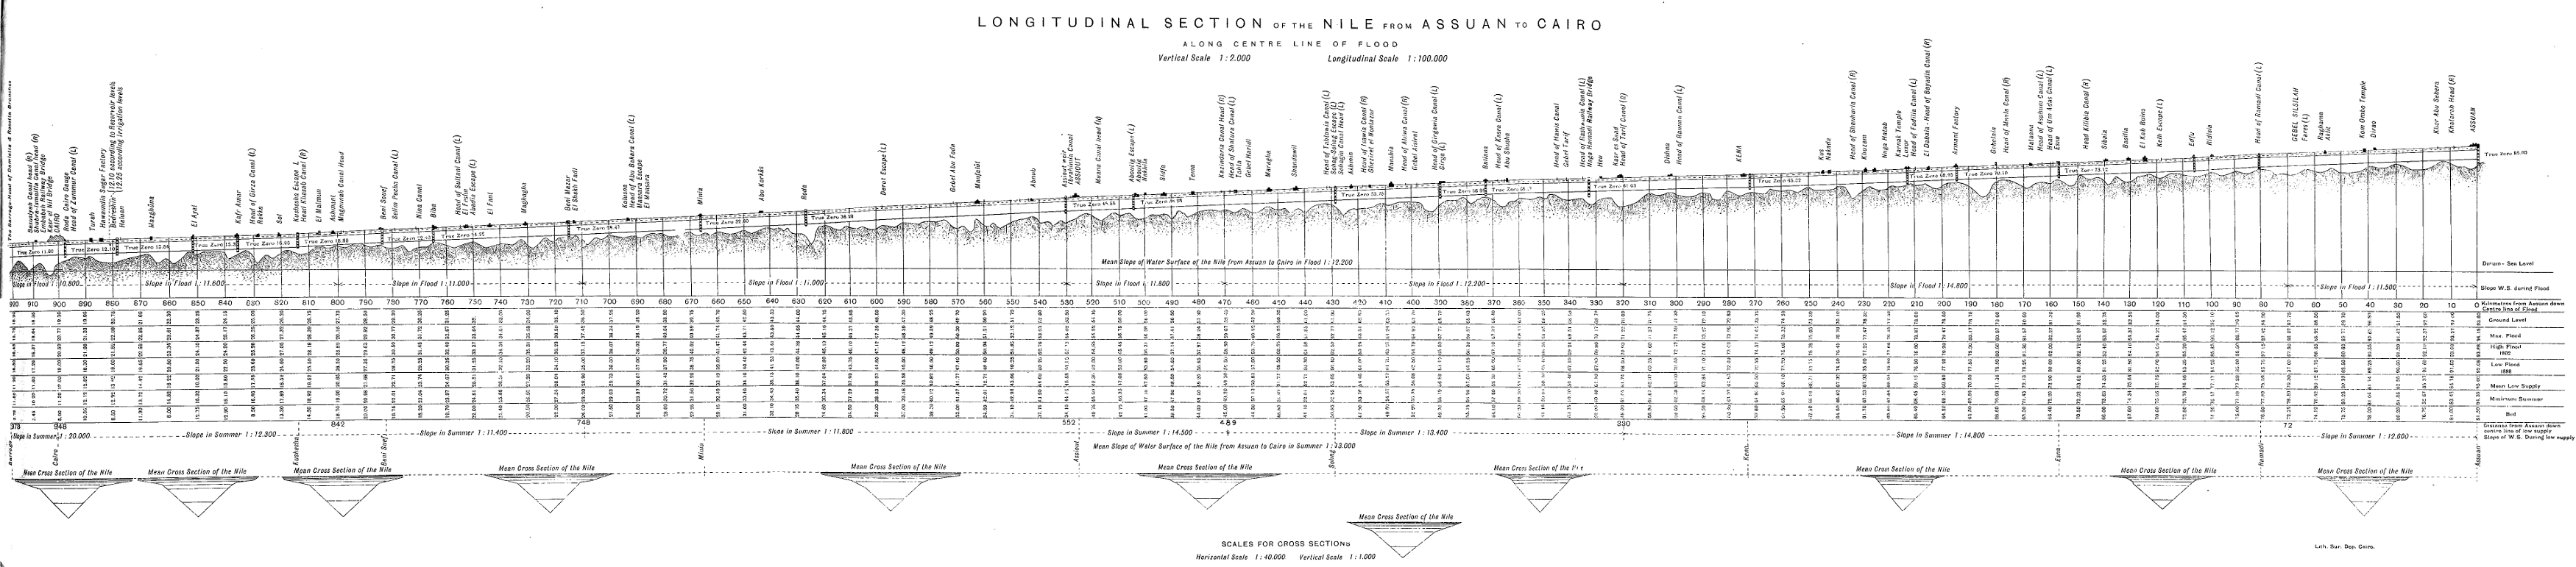
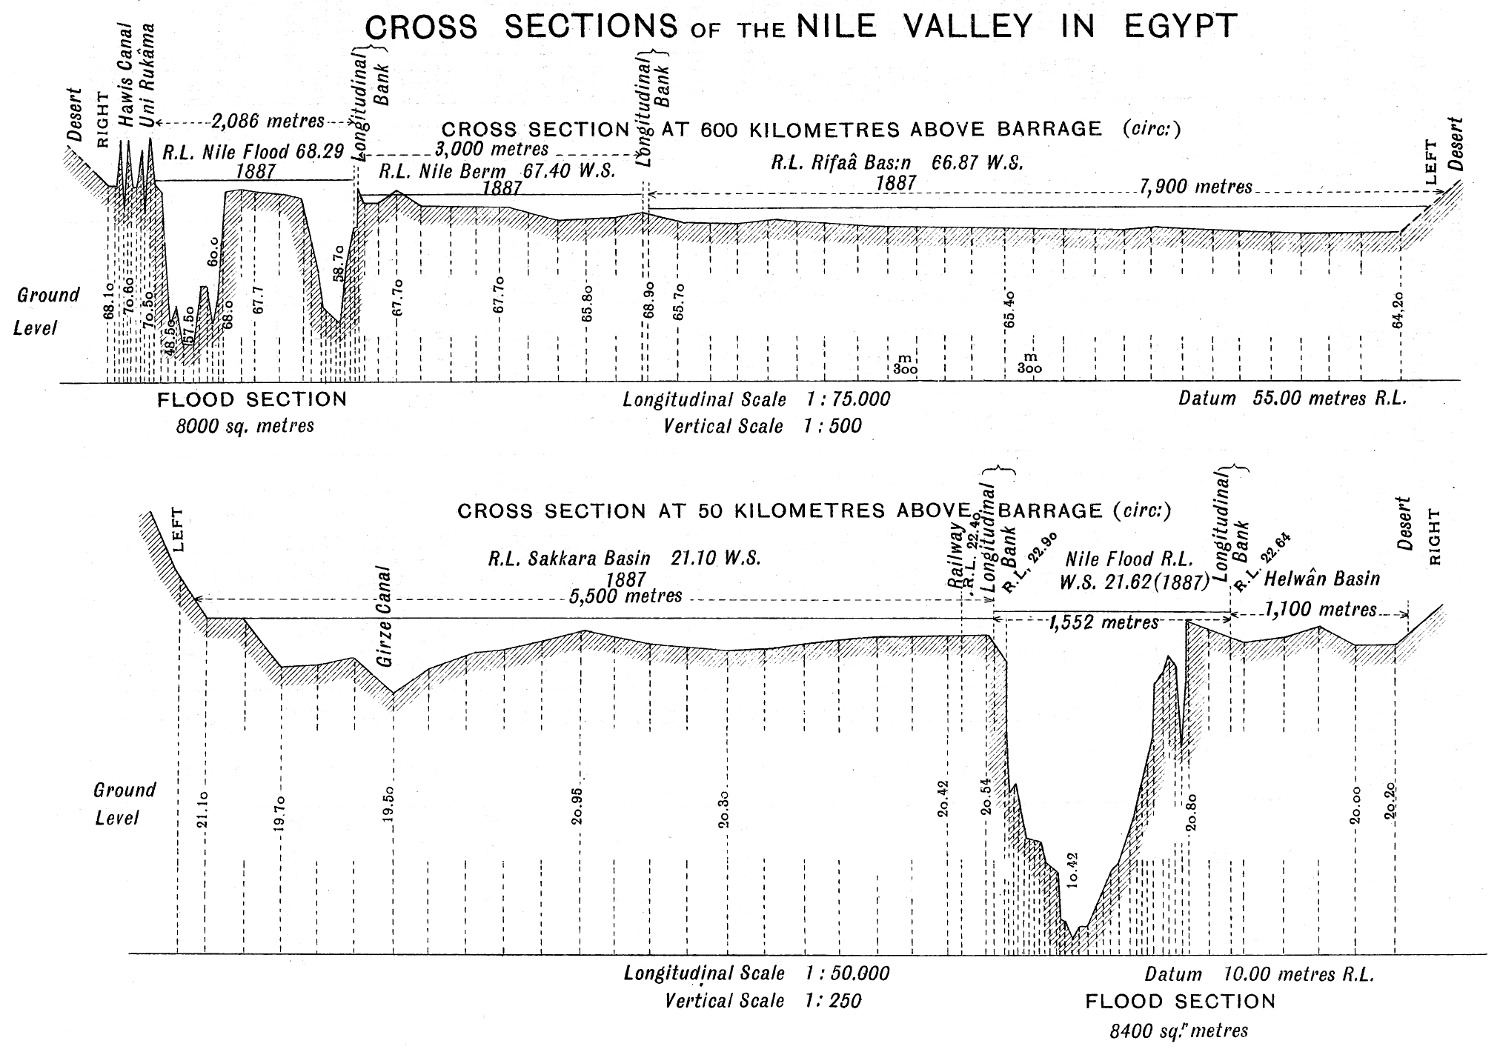
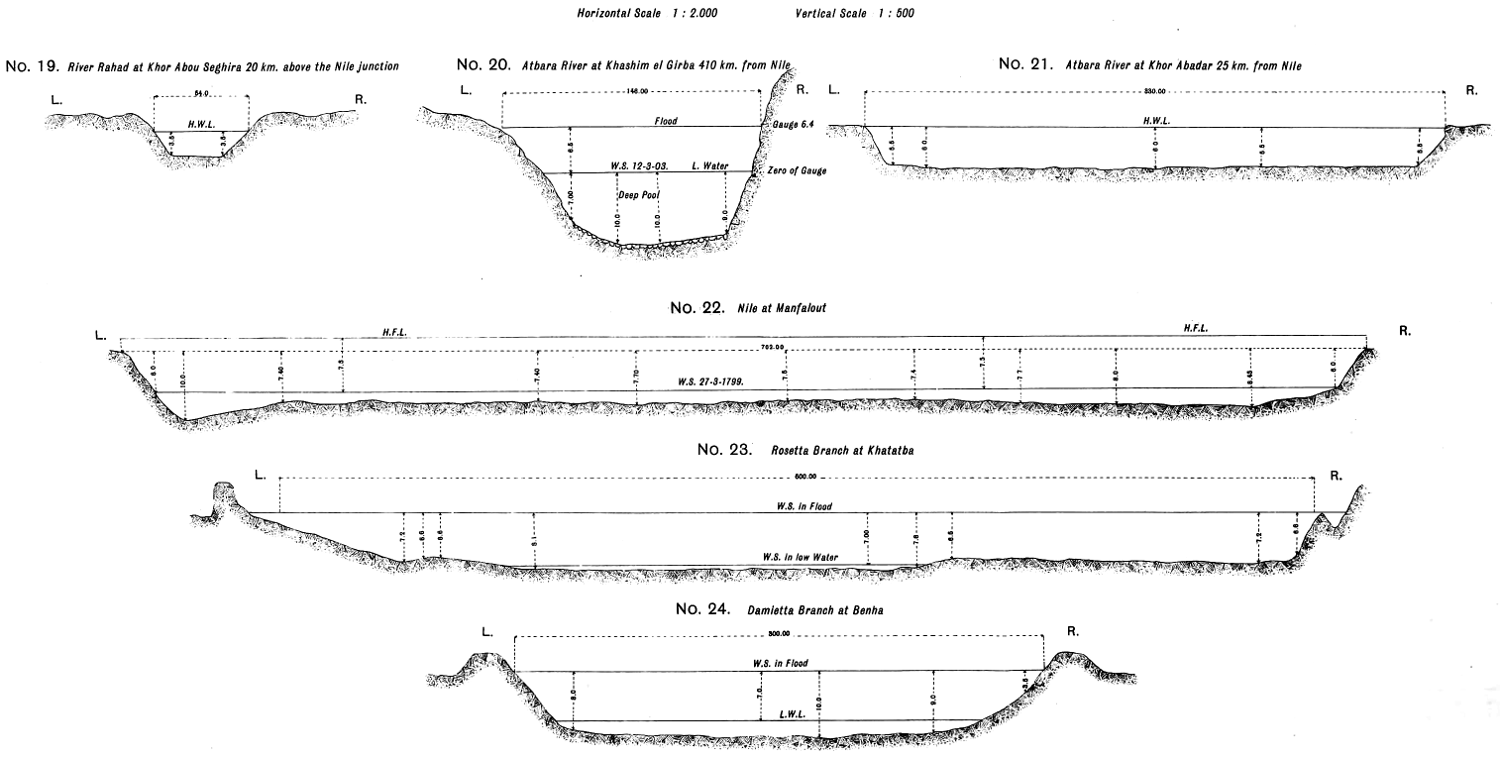
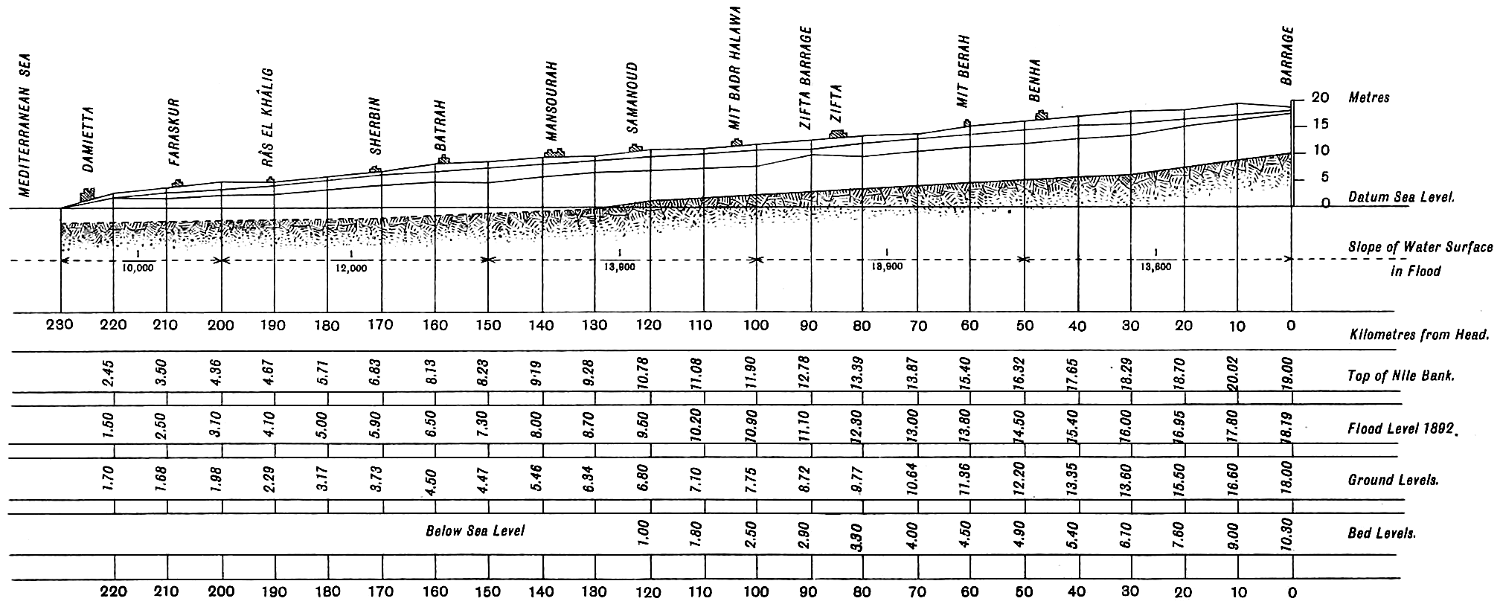
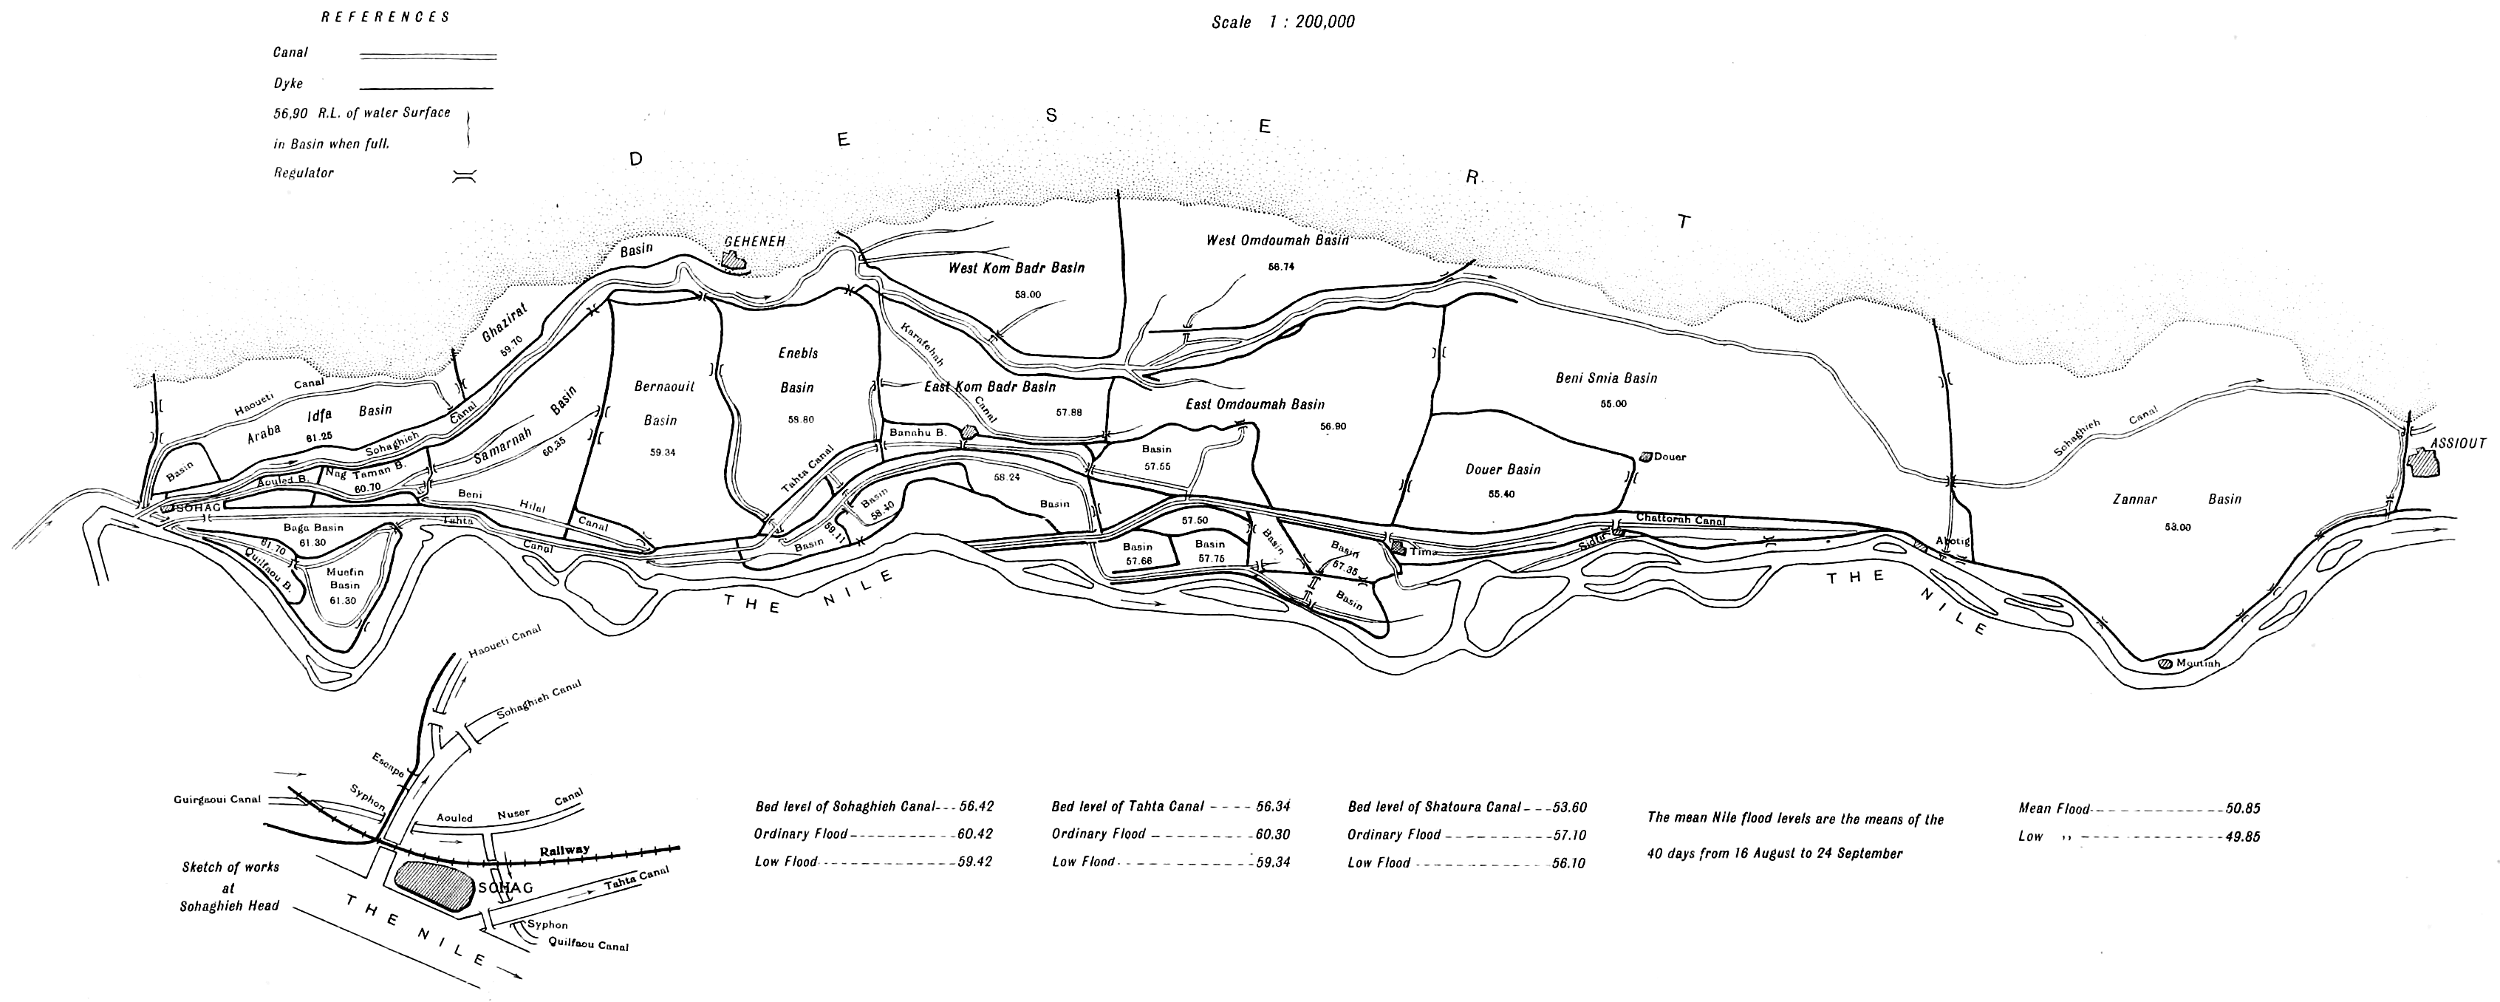
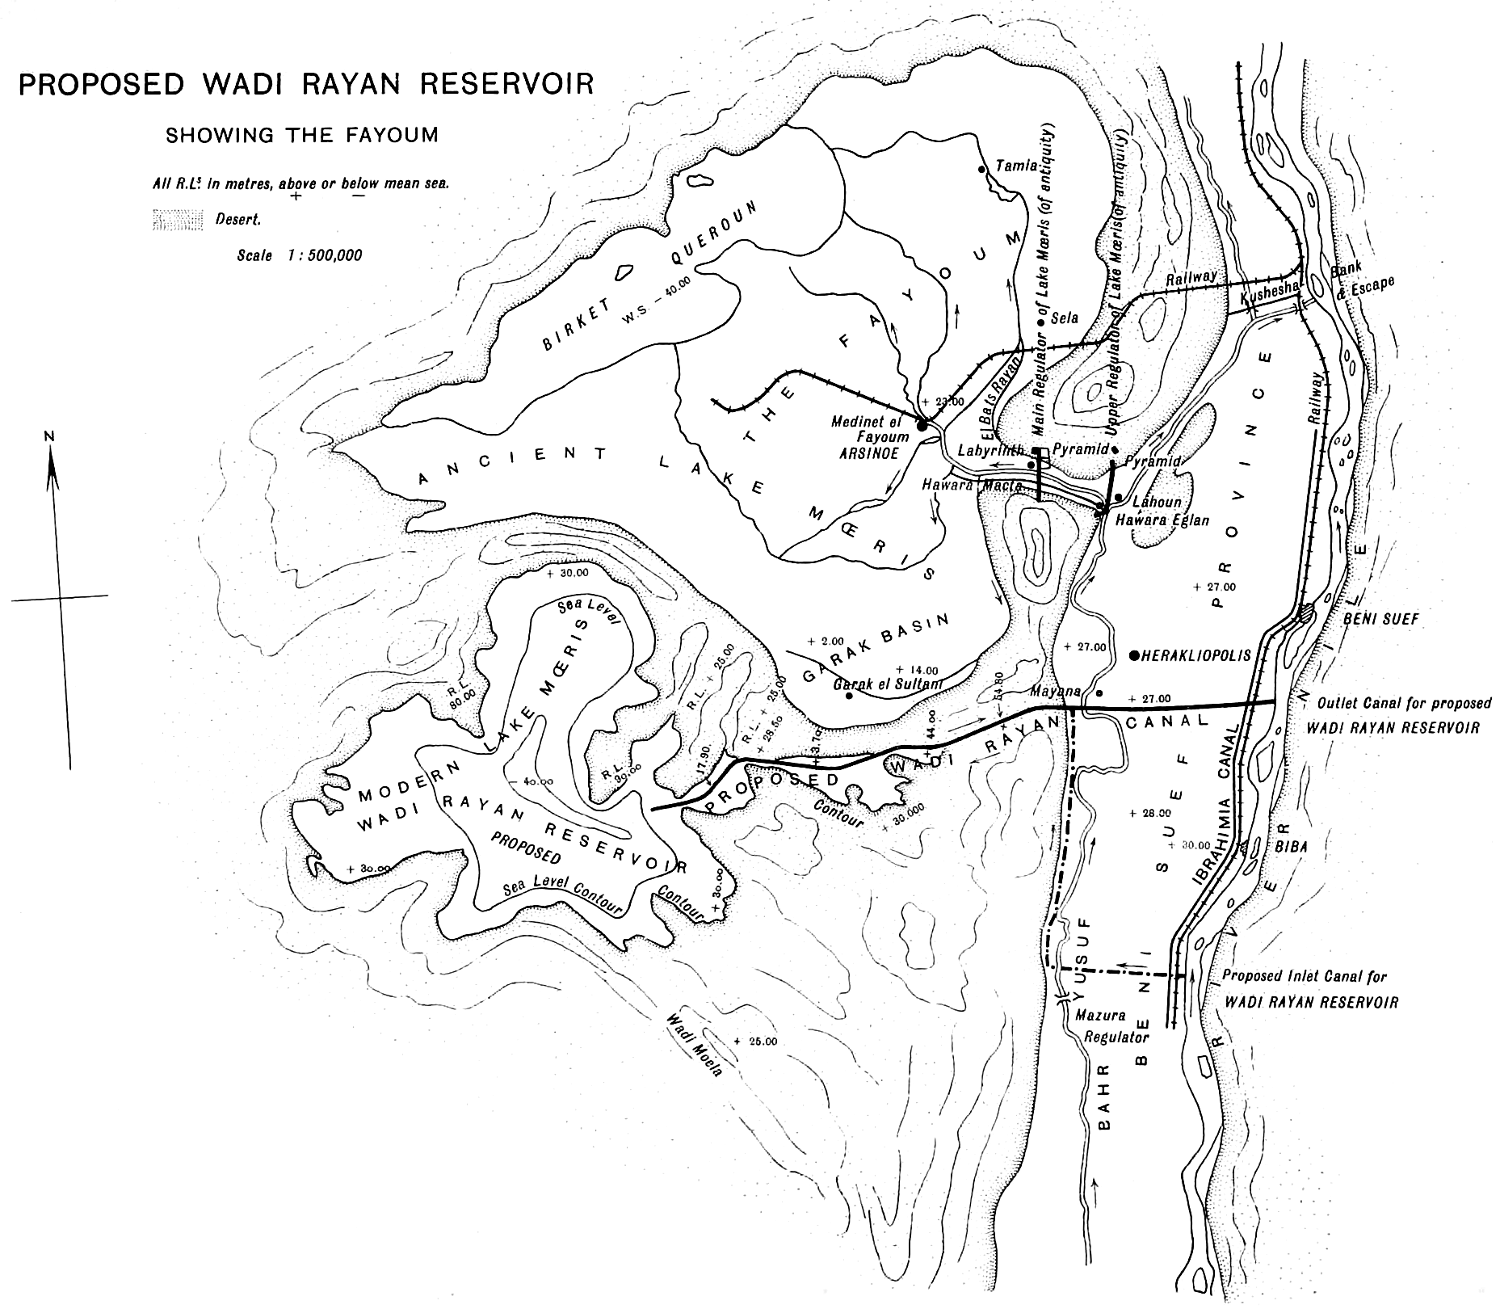
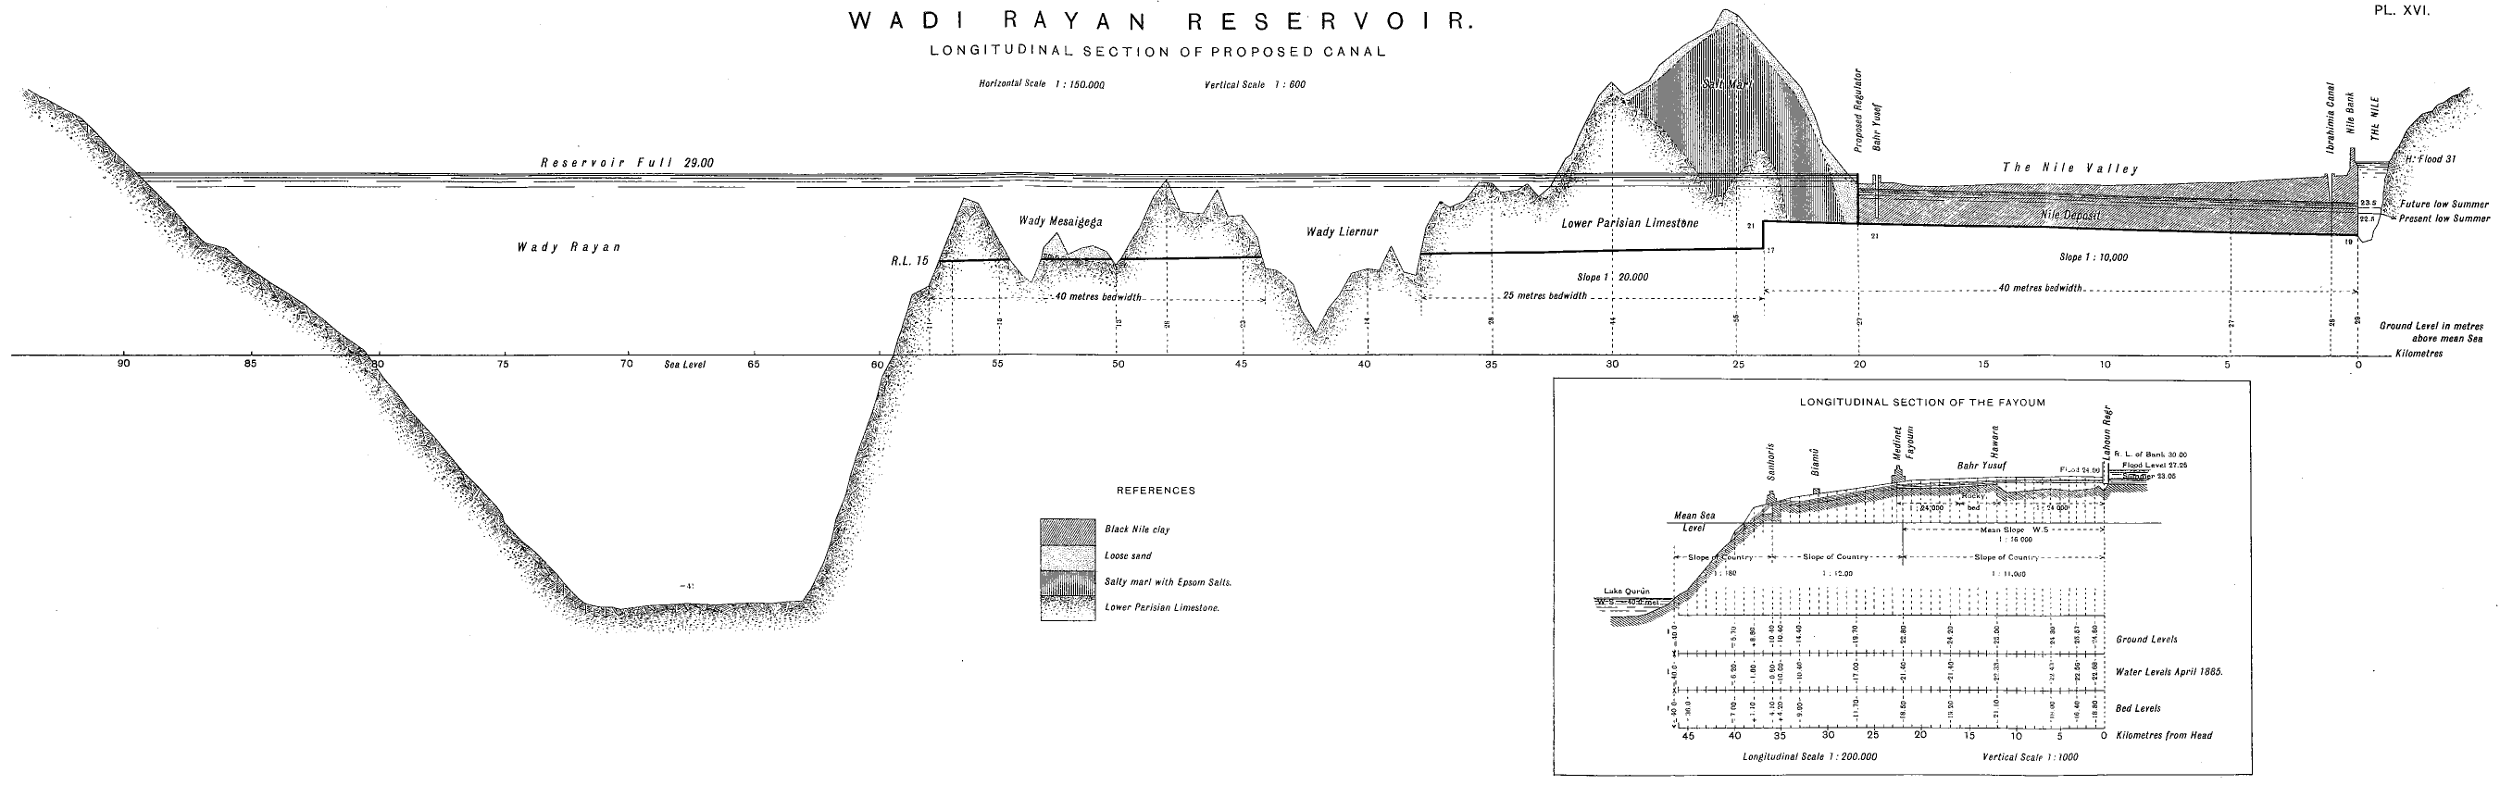
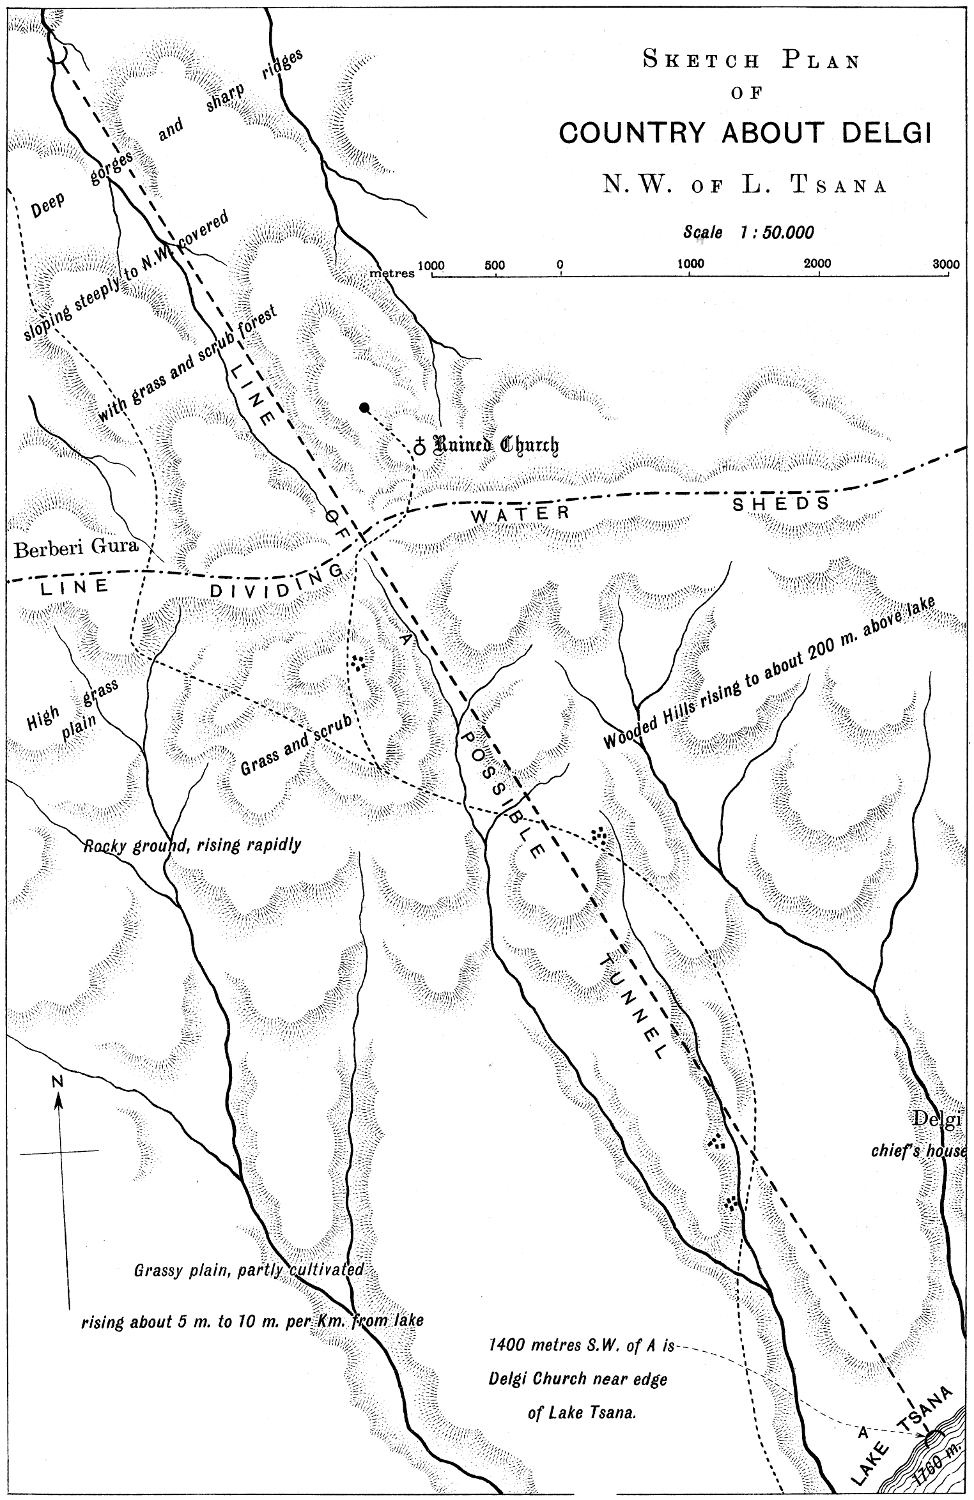
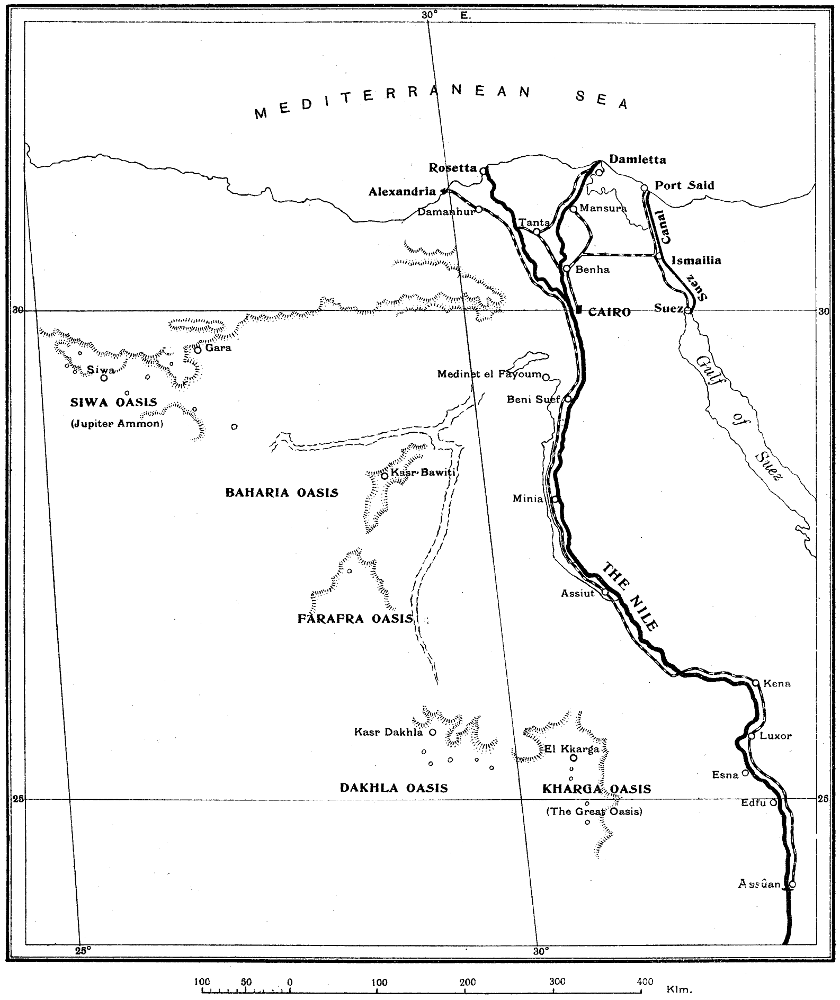