*** START OF THE PROJECT GUTENBERG EBOOK 47059 ***
Transcriber's note
Cover created by Transcriber, using
an illustration from the original book, and placed in the Public Domain.
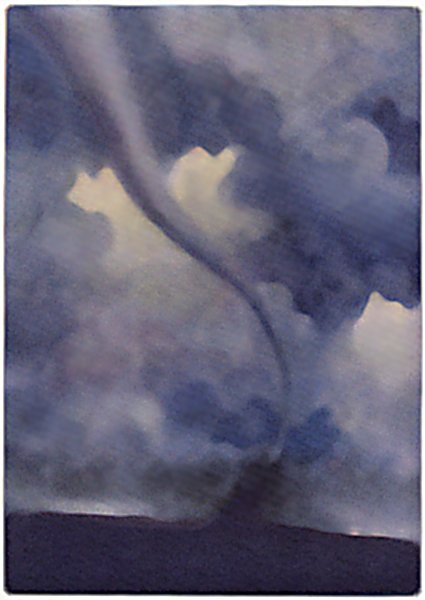
A tornado near Elmwood, Nebraska. A painting made from
what is probably one of the most remarkable photographs
ever taken of a tornado. The original photograph was made
in two parts, as the photographer was too close to get the
whole funnel cloud into the field of his camera.
(Photograph by G. B. Pickwell)
Popular Science Library
EDITOR-IN-CHIEF
GARRETT P. SERVISS
AUTHORS
WILLIAM J. MILLER HIPPOLYTE GRUENER A. RUSSELL BOND
D. W. HERING LOOMIS HAVEMEYER ERNEST G. MARTIN
ARTHUR SELWYN-BROWN ROBERT CHENAULT GIVLER
ERNEST INGERSOLL WILFRED MASON BARTON
WILLIAM B. SCOTT ERNEST J. STREUBEL
NORMAN TAYLOR DAVID TODD
CHARLES FITZHUGH TALMAN
ROBIN BEACH
ARRANGED IN SIXTEEN VOLUMES
WITH A HISTORY OF SCIENCE, GLOSSARIES
AND A GENERAL INDEX
ILLUSTRATED
VOLUME ONE
P. F. COLLIER & SON COMPANY
NEW YORK
Copyright 1922
By P. F. Collier & Son Company
MANUFACTURED IN U. S. A.
METEOROLOGY
The Science of the Atmosphere
BY
CHARLES FITZHUGH TALMAN
Chairman, Committee of Public Information,
American Meteorological Society
P. F. COLLIER & SON COMPANY
NEW YORK
3
PREFACE
Meteorology is the science of the atmosphere
and its phenomena, including weather.
Nowadays, when we speak of a “meteor,” we generally
mean a shooting star; but formerly this term
was applied (and it still often is in technical literature)
to a great variety of phenomena and appearances
in the atmosphere, including clouds, rain,
snow, rainbows, and so forth. That is how the
science of the atmosphere came to have its present
name.
Meteorology is not a branch of astronomy. These
two sciences are as different from each other as
zoölogy is from botany. They are both founded on
physics, and they “overlap” each other to some extent,
just as every science does certain others; but
if you want information about the atmosphere,
weather and climate, an astronomical observatory
is not the place to seek it; while if you wish to
make inquiries about comets, sun spots, eclipses,
standard time, or the date on which Easter fell
in the year 1666, do not apply to the Weather
Bureau.
In the city of Washington the Government maintains
an astronomical and timekeeping institution
known as the Naval Observatory, and it maintains
in the same city the central office of the United
States Weather Bureau. The two establishments
are a mile apart in space and nearly a whole library4
apart in the subjects with which they are concerned.
The fact that their functions are persistently
confounded by the public indicates the
necessity of writing this preface to a popular
book on meteorology.
5
CONTENTS
7
LIST OF ILLUSTRATIONS
| Funnel-Shaped Cloud of a Tornado |
Frontispiece |
| Painted from an unusual Photograph |
| |
FACING PAGE |
| Exploring the Upper Air—Beginning of a Pilot Balloon Flight |
32 |
| Exploring the Upper Air—Sending Up a Sounding Balloon |
32 |
| Meteorograph for Use with a Sounding Balloon |
33 |
| Kite Meteorograph to be Sent Aloft Attached to a Kite |
33 |
| Alto-cumulus—Fleecy Masses Showing Blue Sky Between |
96 |
| Cumulus, or Wool-pack Cloud |
96 |
| Mammato-cumulus, or “Rain Balls” |
97 |
| Cumulo-nimbus—the Thundercloud |
97 |
| Cloud Banner Over Mount Assiniboine, Canadian Rockies |
100 |
| Cirrus, with Lower Clouds in the Foreground |
100 |
| Lenticular Cloud Over Mount Rainier |
101 |
| Ice Storm at Philadelphia—Trees Covered with Glaze |
116 |
| Nieve Penitente in the Argentine Andes |
117 |
| Clouds or Fog Cascading Through Last Fork Cañon Into Santa Anita Cañon |
136 |
| Cloudburst in Southern Utah |
137 |
| Photographic Analysis of Lightning—Single and Double Discharges |
160 |
| Photograph of Lightning, Showing “Black” Flashes |
161 |
| Atmospheric Electricity Instruments |
161 |
| Glass Weather Map in the United States Weather Bureau |
2248 |
| The Sun Drawing Water |
225 |
| Orchard Heaters in Operation as Protection Against Expected Frost |
256 |
| Snow Surveyor at Work, Using a Cylindrical Snow Sampler |
257 |
| Snow Rollers, or Wind-blown Snowballs |
257 |
| Bed of the Potomac River Photographed from the Air |
288 |
| Drilling with Compressed Air in a Copper Mine |
289 |
| Launching a Weather Bureau Kite to Explore the Air Over the Ocean |
289 |
| Weather Bureau Kiosk, Union Square, San Francisco |
320 |
| United States Weather Bureau Station at Peoria, Illinois |
320 |
| Central Office of the United States Weather Bureau at Washington |
321 |
9
CHAPTER I
THE ANATOMY OF THE ATMOSPHERE
Two quite different conceptions of the substance
called “air” are current in the world. One has
prevailed from time immemorial. The other is
wholly modern. One is the popular view, the other
the scientific.
Ancient philosophers regarded air as one of the
four “elements” of which all things were supposed
to be made. Average humanity, though it did not
concern itself with philosophy, must have begun,
almost as soon as it realized the existence of air at
all, to think of it as something that, however it
changed its state from hot to cold, dry to moist,
pure to impure, was fundamentally uniform—a single
entity. Certainly this idea is in full vigor today.
The air that we breathe, supply to our fires,
stir with fans, pump into bicycle tires, fly in—the
air that asserts its independence of our will in the
wind and the weather—gives us the impression of
individuality. We instinctively rank it with water
among the simple, definite things in the repertory
of nature.
Even the man of science often finds it convenient
to discuss and deal with air as if it were a single
substance, but he is well aware that it is nothing
of the kind. He knows that it is, in fact, a jumble
of gases having very different properties. Some
are heavy, others light. Some are chemically very10
active, others extremely inactive. Some are abundant,
others very rare. These gases constitute the
earth’s atmosphere. Other planets have atmospheres
that are quite different in composition from ours.
The sun itself has a very complex atmosphere.
The earth’s atmosphere is, then, a collection of
gases, which are mixed but not chemically combined.
Some of them are themselves chemical compounds.
Each of these gases behaves very much
the same as if the others were not present, and each
of them has its separate business to perform in the
economy of nature. For example, a tree draws
upon the store of carbon dioxide gas in the atmosphere
to build up its tissues. Presently the tree
is cut down and its wood is burned for fuel. In this
process a different atmospheric gas is brought into
play. We often say that the “air” supports combustion—that
we supply “air” with a bellows to
make a fire burn more brightly—but it is not the
air as a whole that enables things to burn. Four-fifths
of the atmospheric substance takes no part in
the process. We burn with oxygen alone. So it is
with breathing. Oxygen and not air constitutes the
breath of life.
Near the surface of the earth the proportions of
the more abundant gases mixed together in the air
are remarkably constant. Ignoring a variable admixture
of water vapor, oxygen is always about 21
per cent, by volume, and nitrogen about 78 per cent.
The remaining 1 per cent is mainly argon. At great
altitudes, however, these percentages no longer obtain.
The atmospheric gases differ greatly among
themselves in weight, and in the high atmosphere,
where they are not mixed by the winds, as they are
below, the heavier tend to settle to the bottom and11
the lighter to float on top, as oil floats on water. It
is calculated that at a height of thirty miles above
sea level the percentage of nitrogen is about 86½
and of oxygen only 10, while at the same altitude
the gas hydrogen, which at low levels constitutes
less than one-hundredth of 1 per cent of the atmosphere
amounts to more than 2½ per cent. Going
higher, the percentage of hydrogen is supposed to
increase rapidly, until, at an altitude of forty-eight
miles, the atmosphere is more than half hydrogen,
and at eighty miles above the earth this gas forms
99 per cent of the whole. These figures are not
necessarily final; for some authorities believe that
the atmosphere contains an unknown gas lighter
than hydrogen, while others think that the hydrogen
found in the lower air enters into chemical combinations
before it can reach the higher levels; but
it is beyond doubt that the composition of the upper
atmosphere is quite different from that of the lower.
Of course almost any gas may be found locally
and occasionally in the atmosphere, but there are
several that are always found wherever a refined
analysis of the air is made, and others that are generally
present. The following is a fairly complete
list: Nitrogen, oxygen, water vapor, argon, carbon
dioxide, hydrogen, helium, neon, krypton, xenon,
niton (radium emanation), ozone, hydrogen dioxide,
ammonia and other compounds of nitrogen.
A number of these substances have only become
known to science within the last quarter of a century.
Argon, though it constitutes nearly 1 per
cent of the atmosphere, escaped detection until the
year 1894. The investigation of argon led to the
discovery of some of the others. In 1895 it was
found that the air, as well as certain minerals, contains12
helium. This substance was not new to science,
but it had never before been found on earth.
It was discovered in the atmosphere of the sun, by
means of the spectroscope, as early as 1868. Terrestrial
helium, neon, krypton, and xenon were all
discovered by Sir William Ramsay, who also shared
with Lord Rayleigh the distinction of discovering
argon.
Ramsay has published the following figures for
the proportions in which some of the rare gases
exist in the atmosphere:
| Helium |
1 |
part in |
245,320 |
by volume |
| Neon |
1 |
“ |
80,800 |
““ |
| Krypton |
1 |
“ |
2,000,000 |
““ |
| Xenon |
1 |
“ |
17,000,000 |
““ |
Niton, or radium emanation, is one of the products
of the disintegration of radium. Niton itself
disintegrates very rapidly, one-half of any given
quantity disappearing in about four days, and one
of its products is helium. The amount of niton in
the atmosphere is never more than an infinitesimal
trace. Thus we are told that the total quantity of
this substance present in the atmosphere of the
whole earth up to an altitude of one kilometer (0.6
mile) weighs less than nine ounces, and that each
cubic centimeter of air contains among its thirty
million million million molecules only between one
and two molecules of niton, on an average.
Turning, now, to the more abundant constituents
of the atmosphere, we find that oxygen and nitrogen
differ strikingly from each other in the fact that,
while the former has a strong chemical affinity for
nearly all other elements, the latter is chemically
inert, having little tendency to unite directly with13
other elements, though by indirect processes, and
chiefly through the agency of plants and animals, a
large number of nitrogen compounds are produced.
Oxides of nitrogen are formed directly from the
atmospheric gases by lightning discharges, and
these unite with the moisture of the air to form
nitric and nitrous acids. A certain amount of ammonia
(a compound of nitrogen and hydrogen)
may also be formed by lightning from nitrogen and
atmospheric water, but most of the ammonia in the
air is derived from the decomposition of plant and
animal matters. The compounds of nitrogen that
occur in the air are washed down by rain in considerable
quantities. Analyses of rain water made in
different parts of the world show from one to nine
pounds of such substances per acre per annum.
Carbon dioxide (more familiarly known as carbonic
acid gas) occurs in the atmosphere in the
almost constant proportion of three parts in 10,000
by volume. It is a little more abundant in the air of
towns than in the open country or over the ocean,
and it undergoes slight periodic variations, but the
fact that it is not much more variable is rather
surprising, considering that it is continually being
added to and abstracted from the air by numerous
agencies that have no dependence upon one another.
It is supplied to the air by volcanoes, mineral
springs, the combustion of fuel, the respiration of
animals and plants, and the decay of organic matter.
The amount supplied annually by the burning
of coal alone is estimated to be equivalent to more
than one-thousandth of the total volume of the gas
present in the atmosphere at any one time. On the
other hand, all green plants, in the presence of sunlight,
withdraw carbon dioxide from the air, abstract14
the carbon from it for the use of the plant,
and return the oxygen to the atmosphere. Thus it
is estimated that an acre of beech forest takes a ton
of carbon out of the air annually. A vast amount
of atmospheric carbon dioxide enters into chemical
combination with certain rocks at the earth’s surface.
Lastly, a large quota of this atmospheric gas is
absorbed by sea water, and certain authorities have
seen in this process a regulator of the total amount
in the atmosphere, the hypothesis being that the
ocean gives back some of the carbon dioxide whenever
this substance becomes deficient in the air.
Water vapor—i. e., water in an invisible gaseous
form—is always present in the atmosphere, but its
amount is subject to wide fluctuations. An important
fact in this connection is that, at any given
temperature, the air can hold only a definite amount
of this vapor. This maximum amount increases
rapidly with temperature. When the air is fully
charged with water vapor it is said to be “saturated.”
Properly speaking, the temperature limits
the amount of the vapor that can occur in a given
space, regardless of the presence of the other constituents
of air, and in scientific language it is the
vapor itself that is said to be saturated, and not the
air; but in a popular book about the atmosphere,
where much has to be said about atmospheric water
vapor, adherence to scientific usage in this matter
invariably leads to awkward complications. Speaking,
then, in familiar terms—when the air is saturated
with water vapor, a fall in temperature causes
some of the vapor to condense in visible form, as
cloud, fog, rain, dew, snow, hail, etc. As the sole
source of these various forms of moisture,
and on account of the important part it plays in15
many atmospheric processes, water vapor is, from
a meteorological point of view, the most interesting
constituent of the atmosphere.
One more atmospheric gas requires notice here,
both on account of the great popular interest attaching
to it, and because of recent scientific discoveries
concerning it—viz., ozone. This substance
may be described, in nontechnical language, as a
concentrated form of oxygen. It is one of the most
powerful oxidizing agencies known, and has found
useful applications in medicine and various industries.
Its popular renown, however, is due to the
fact that for many years it was regarded as a great
natural purifier of the atmosphere. “Life-giving
ozone” was reputed to be abundant in the air of forests,
mountains, and the seashore. Systematic observations
were made of the prevalence of ozone at
different places throughout the world, generally by
noting the change of color of test-papers exposed to
the air. These “ozonometric” observations are now
a closed chapter in the history of meteorology, for
it has been found that the reactions of so-called
ozone papers are due chiefly or entirely to atmospheric
substances other than ozone. Moreover, direct
examination of the air by more accurate methods—including
samples collected with the aid of
kites and balloons up to a height of several thousand
feet above the earth—shows that the amount of
ozone in the whole of the lower atmosphere is exceedingly
small—much too small to be of hygienic
significance. Whatever ozone is produced from
oxygen at such levels by lightning discharges or
other possible agencies probably enters promptly
into chemical union with oxidizable substances and
therefore has only a brief existence.
16
On the other hand, the spectroscope has brought
us evidence that far aloft in the atmosphere, many
miles above the earth, ozone is quite abundant.
Here it is supposed to be generated by two agencies—the
electrical discharges of the aurora and ultra-violet
radiations from the sun. The ultra-violet
rays that help to produce it are prevented from
reaching the earth, and astronomers are thus deprived
of much interesting information they might
otherwise obtain concerning the spectra of the sun
and stars. However, as the present Lord Rayleigh
has pointed out, we can console ourselves for this
fact by reflecting that if the ozone did not shut off
much of the ultra-violet light from the sun, this
light would probably ruin our eyesight; or, rather,
we should be put to the inconvenience of constantly
wearing some sort of protective spectacles in the
daytime.
The high-level ozone is further interesting because
of exercising a certain control over the temperature
of the lower air. It is more transparent for incoming
solar radiation than for outgoing earth radiation.
Hence, when it is unusually abundant, it
should raise the general temperature of the earth.
This presumably happens when the condition of the
sun is such that an unusual amount of ultra-violet
radiation reaches the upper atmosphere, a fact that
must be taken into consideration in any attempt
to establish a relation between climatic fluctuations
and the sun-spot period.
The lowest part of our atmosphere is the densest
because it is compressed by the weight of the air
above it. Thus it happens that, although the atmosphere
is at least several hundred miles in height,
one-half of its mass—i. e., one-half of the quantity17
of matter in it, as expressed in terms of weight—lies
below an altitude of about 3½ miles above
sea level, while about seven-eighths lies below the
ten-mile level. Above about five miles the atmosphere
is too rare to support life. The highest
clouds seldom occur higher than ten miles. Storms
hardly ever reach that height. In short, the phenomena
of life and the phenomena of weather are
confined to a layer of air so shallow, in proportion
to the dimensions of our globe, that on the surface
of an orange it would be represented by a sheet of
thin paper.
The actual height of the atmosphere is not even
approximately known. There are theoretical reasons
for believing that even at a height of thousands
of miles above the earth there are molecules of atmospheric
gases still under the control of the earth’s
gravity, while at such levels yet other atmospheric
molecules are constantly escaping into outer space.
At an altitude of fifty miles the atmosphere is less
than 1/75,000 as dense as at sea level—i. e., more
than seventy-five times as attenuated as the best
“vacuum” obtainable with an ordinary mechanical
air pump. At 300 miles it is computed to be about
one two-millionth as dense as at sea level.
The loftiest atmospheric phenomenon that we can
observe directly is the aurora, which has been photographed
up to heights of more than 300 miles.
The altitude of the aurora is determined by simultaneous
observations made at two or more points,
and the same is true of shooting stars and their
trails, which seem to be especially numerous between
the levels of sixty and ninety miles. The so-called
“noctilucent clouds,” which shone by reflected
sunlight throughout the night for some years after18
the great eruption of Krakatoa and were supposed
to consist of fine dust from that volcano, were probably
about fifty miles above the earth. From the
duration of twilight we infer that above about
forty-five miles the air is so tenuous that it cannot
reflect sunlight to the earth. Clouds furnish information
concerning the movements of the air at various
levels up to ten miles or more. Observations on
mountains contribute further to our knowledge of
the atmosphere above the ordinary levels of habitation.
Of all methods of exploring the atmosphere in a
vertical direction, the most fruitful is the use of
kites and balloons. In recent years investigations
of this character have become so extensive and so
highly specialized that they are regarded as forming
a separate department of meteorology, known
as Aerology. It is by virtue of developments in this
field that meteorology has become “a science of
three dimensions.” Formerly meteorologists could
do but little more than study the bottom of the
weather, so to speak; but now they observe it and
chart it at all levels. The weather forecaster has
daily reports of conditions aloft to aid his predictions
both for dwellers on terra firma and for the
aeronaut; while the accumulated data of upper-air
observations are throwing new light on many difficult
atmospheric problems.
Scientific balloon ascents are no novelty. Some
were made in the eighteenth century, and many famous
ones in the nineteenth, including those of Biot,
Gay-Lussac, Glaisher, Tissandier, and other daring
savants. The “record” height for such personal
ascents was attained in 1901, when Berson and
Süring rose to 35,400 feet above Berlin. Kites were19
sent up for meteorological purposes even before
Benjamin Franklin’s immortal experiment in 1752.
Modern aerological methods have, however, little in
common with these pioneer undertakings. Existing
types of box kites, pilot balloons, sounding balloons,
and self-registering meteorological apparatus for
upper-air research were developed in the latter part
of the nineteenth century, but their use did not
begin to bulk large in meteorology until about the
beginning of the present century. The epoch-making
event in these undertakings was the discovery
of the isothermal layer.
It is a matter of common knowledge that the air
is found to be colder the higher one ascends in the
atmosphere. Thus, even in equatorial regions, the
tops of high mountains are mantled in perpetual
snow. The rate of this temperature decrease averages
about 1 degree Fahrenheit per 300 feet. Previous
to the year 1902 meteorologists supposed that
the atmosphere continued to grow steadily colder
in an upward direction indefinitely; but in that year
a Frenchman, M. Teisserenc de Bort, who had sent
aloft hundreds of small unmanned balloons carrying
self-recording thermometers, announced that
above a height of about six and one-half miles the
temperature ceased to fall. In fact, he found that
at about that level there was often a slight increase
of temperature with increasing altitude for a certain
distance upward, and then a nearly uniform
temperature as high as the balloons ascended. This
announcement was at first received with considerable
skepticism, but very soon similar observations
were reported from other parts of the world. A
new “shell” of the atmosphere had been revealed—which,
as subsequent investigations proved, differs20
from the lower air in other respects besides temperature—and
it was at first named by its discoverer
the isothermal layer. He afterward substituted
the name stratosphere, now generally employed. In
distinction from the stratosphere, the part of the
atmosphere lying below it is called the troposphere.
The stratosphere has been explored in widely
scattered parts of the earth, and information concerning
it is daily accumulating. Although it extends
over the whole world, the altitude at which it
begins is by no means uniform. The altitude is
greater in summer than in winter; it varies with
the barometric pressure at the earth’s surface; and
it is decidedly greater over the equator than over
the poles. The last fact leads to an interesting paradox.
Since over the equatorial regions the temperature
keeps on falling with ascent to a greater
height than in other latitudes, it is here that the
lowest temperatures in the atmosphere are found.
A sounding balloon sent up from Batavia, Java, in
November, 1913, recorded 113° below zero Fahr.,
the lowest air temperature ever observed. In middle
latitudes the temperature of the stratosphere averages
something like 68° below zero Fahr.
The temperature of this interesting upper atmosphere
varies a good deal, both vertically and horizontally,
but never shows the steady vertical variation
that characterizes the lower air. The stratosphere
contains no clouds (except occasional dust
clouds), and has a circulation quite distinct from
that of the troposphere, the exact nature of which,
however, has not yet been determined.
The sounding balloon, already mentioned, is one
of the four principal types of aerial vehicle used in
the study of the atmosphere, the others being the21
pilot balloon, the captive balloon, and the kite. The
sounding balloon, or ballon-sonde, is a small free
balloon that carries no human aeronaut, but instead
a set of superhuman meteorological instruments,
which register the temperature, the barometric
pressure, and sometimes the humidity continuously
and automatically through the whole course of their
journey. The record is traced on a revolving drum
or disk, usually coated with lampblack. In its commonest
form the balloon is made of india-rubber,
and when launched is inflated to less than its full
capacity with hydrogen. As it rises to regions of
diminished air pressure it gradually expands, and
it finally bursts at an elevation determined approximately
in advance. A sort of parachute, or sometimes
an auxiliary balloon, insures a gentle fall to
the ground. Attached to the apparatus there is generally
a ticket offering the finder a reward for its
return, and giving instructions as to packing and
shipping. Sooner or later it generally comes back.
In fact, the large percentage of records recovered,
even in sparsely settled countries, is not the least
remarkable feature of this novel method of research.
Thus, of seventy-two balloons sent up by
a Franco-Swedish expedition in Lapland, forty-one
were eventually recovered with their instruments.
One of these fell into a lake and was found after
three years.
No instruments are carried by the pilot balloon,
which merely serves to show, by its observed drift,
the speed and direction of the air currents at different
levels. The pilot balloon is sighted, while in
flight, through a special form of theodolite, or, preferably,
two theodolites some distance apart. Several
ingenious methods have been devised for computing22
and plotting its actual course through the
air. Such balloons, apart from their use in scientific
research, have become one of the principal adjuncts
of aeronautical undertakings all over the
world, and are also used by artillerists to enable
them to make proper allowance for the deflective
effect of the wind on the flight of projectiles. Hundreds
of thousands of pilot balloons were sent aloft
for military purposes during the world war.
Meteorological instruments are sent up attached
to kites or captive balloons whenever—as in connection
with weather forecasting—the observations
must be obtained more promptly than would be
possible with the aid of sounding balloons, but such
devices can attain only moderate altitudes. Kites
have been raised to about four and one-half miles
above sea level, as compared with nearly twenty-two
miles reached by a sounding balloon and twenty-four
miles by a pilot balloon. The average height
of sounding-balloon ascents is about ten miles.
As already stated, balloonists have risen to 6.7
miles. This is a little higher than the best aeroplane
record.
The use of the aeroplane for making meteorological
observations is still quite limited, but will
inevitably increase. One other device gives promise
of yielding valuable aerological information, on account
of its ability to rise to extraordinary altitudes.
This is a special form of rocket, recently
invented by Prof. R. H. Goddard, which is propelled
by several successive discharges of an explosive in
the course of its upward flight, and with which the
inventor thinks it will be possible to explore the
whole vertical extent of the atmosphere. Meteorological
apparatus for use with the Goddard rocket23
has been planned by Mr. S. P. Fergusson of the
Weather Bureau.
The atmosphere presses down upon the earth
with a weight that, at sea level, amounts to about
14.7 pounds to the square inch, on an average. This
pressure is, at any point, exerted equally in all directions;
it acts, for example, on the whole surface
of the human body, and this means that a man of
average size lives under a burden of some seventeen
tons of air. He is not incommoded because the pressure
from without is balanced by that of the air
that permeates his body.
The pressure of the atmosphere decreases upward
at nearly the same rate as its density. Thus on
mountains and plateaus it is considerably less than
in lowlands. At no place is the pressure invariable,
nor is there a constant relation between pressure
and altitude, but, knowing approximately the average
atmospheric pressure over the earth’s surface,
and knowing also the area of the latter, we can compute
in round numbers the total weight of the atmosphere—about
5,000,000,000,000,000 tons. This
is about 1/1,200,000 of the entire weight of the earth.
24
CHAPTER II
THE RESOURCES OF THE
ATMOSPHERE
In the economic stress of our times much is heard
about “natural resources.” This phrase suggests
to most people’s minds the store of minerals, fuels,
and oil locked up in the ground; the waters available
for drinking, washing, irrigation, power production,
and navigation; the forests and other natural
growths of useful vegetation; and the soil in
which we raise our crops. A moment’s reflection,
however, will show that this is a one-sided enumeration.
The resources of the atmosphere are as essential
to humanity as those of the land and the
waters, if not more so.
The coal that is dug out of the earth consists
mainly of carbon, which, in bygone ages, was extracted
by plants from the air. Moreover, it would
be of no use to us if we did not have the oxygen of
the air in which to burn it. Neither could we smelt
metallic ores without oxygen. All our forests and
all our crops draw far more of their solid substance
from the air than from the soil. Fuel and water
are valuable sources of power, but so is the moving
air that drives sailing ships and windmills, and the
atmospheric pressure that helps to operate suction
pumps. It is the moisture of the air that feeds our
streams and, directly or indirectly, waters all plants
that grow upon the land. Lastly, it is the atmospheric25
oxygen that we breathe that keeps us from
very speedily becoming incapable of using any of
the other resources of Nature.
Air and water together contain, in their oxygen,
nitrogen, hydrogen, and carbon, all the major constituents
of our foods in unlimited abundance. It
is tantalizing to think of the slow and roundabout
way in which these things are wrought into edible
shape—and the prices we have to pay for them.
No less tantalizing, when coal is scarce and costly,
is the thought that every vagrant breeze is laden
with the carbon dioxide from which the chemistry
of living plants so readily extracts the chief element
of fuels. The total carbon dioxide of the atmosphere
amounts to something like 2,200,000,000,000
tons, equivalent to 600,000,000,000 tons of carbon.
We have spoken of the utility of the air as a
source of power. It is, perhaps, even more useful
as providing an easy means of storing and transmitting
power. The engineer stores up energy in
a mass of air by compressing it. When the air subsequently
expands it gives up its energy, and, in so
doing, may be made to perform a variety of useful
tasks. By a somewhat analogous process energy is
applied to creating a vacuum, in order that the ordinary
pressure of the atmosphere may be made
available for doing a particular piece of work. The
suction pump, the siphon, and the vacuum cleaner
furnish examples of this process; and so do such
familiar operations as sucking beverages through a
straw and filling a medicine dropper.
From crude types of bellows, with which, from
remote antiquity, air was compressed for the purpose
of blowing fires, have been developed a host of
wonder-working appliances of the present day, such26
as the air brake, the pneumatic tube, the compressed-air
locomotive, diving apparatus, the caisson,
certain kinds of refrigerating machinery, and
a long list of pneumatic tools. To cap the climax of
ingenuity in this field, methods involving both the
compression and the expansion of air have been discovered
whereby this invisible, elusive substance
may be changed to a visible liquid and a visible
solid; a process having extremely valuable applications,
as we shall presently see.
Compressed air, as a means of transmitting
power, rivals such mechanical devices as gearing,
belting, and rope drives, when it is applied near the
compressor; or it may be conducted for many miles
in pipes, thus competing with the electric current;
or, finally, it may be transported in tanks to the
place where it is to be used, a process analogous to
the use of the electric storage battery. Compressed
air has, moreover, certain advantages over other
methods of transmitting power for a number of special
purposes. Thus for use in coal mines it is safer
than electricity because it is free from the danger
of sparks. There are a great many cases in which
the air itself is used in the process to which the
power is applied, as in different kinds of air blast,
from the simple bellows to the blowers of blast furnaces;
also in aerating apparatus, oil and fuel burners,
spraying, cleansing, etc.
A familiar form of air compressor is the hand
pump used for inflating bicycle tires. This simple
device illustrates two important facts; first, that a
considerable amount of energy must be used to overcome
the expansive force of the air, and, second,
that part of the energy applied to the pump produces
heat. That the heat thus produced and dissipated27
in the surrounding air represents a loss of
energy is apparent; but energy is wasted in another
way that is, perhaps, not so evident. When a gas
is heated its expansive force is increased. Hence,
on account of the heating of the air in the tire, the
pump has to do more work to accomplish a given
amount of compression than it would need to do if
the air remained cool.
In order to avoid this loss, the air compressors
used for industrial purposes are provided with some
sort of device for keeping the air cool during compression.
This is accomplished by a spray of water
inside the compressor cylinder, or, more commonly,
by inclosing the cylinder in a water jacket. In producing
high pressures, the air is compressed by degrees
in two or more cylinders, and cooled between
the successive stages. Lastly, before compressed
air is applied to driving tools or machinery, it is
often reheated to increase its pressure. For most
industrial purposes the pressure of compressed air
does not exceed 75 pounds to the square inch (5
“atmospheres”). For charging the tanks of compressed-air
locomotives, for liquefying gases, and a
few other purposes, much higher pressures are used.
In laboratory experiments air has been compressed
to the enormous pressure of 60,000 pounds to the
square inch, or 4,000 atmospheres. At a pressure of
14,000 pounds to the square inch compressed air has
been successfully used for blasting in mines in place
of ordinary explosives.
The use of pneumatic tools began in the sixties
of the last century, when pneumatic drills were employed
with conspicuous success in the construction
of the Mont Cenis and Hoosac tunnels. Such tools
are now indispensable adjuncts not only of tunneling28
and mining, but also of nearly every department of
metal-working and wood-working, and have contributed
incalculably to the welfare of mankind.
Imagine a workman with an ordinary hammer
driving such a tool as a chisel, punch, or calking
iron, and estimate the amount of work accomplished
in the course of a day spent in this wearisome labor.
Then consider how such operations are performed
with the help of that versatile substance, air. The
pneumatic hammer consists of a piston working in
a cylinder, to which compressed air is conveyed from
a compressor by means of a flexible hose. The hammer
is so designed that the air causes the piston to
work back and forth with great rapidity. A chisel,
rammer, or other percussion tool is loosely fitted in
the nose of the hammer, so that the piston will strike
it a blow at each forward motion. The workman has
nothing to do but hold the tools in place. With a
common hammer or mallet a workman will strike
from twenty to a hundred blows a minute, according
to the nature of the work. The speed of the
pneumatic hammer ranges from 1,000 to 20,000
blows per minute, so that its sound is a continuous
buzz. Such hammers are used for calking,
chipping, riveting, and a great number of other
purposes.
In another large class of pneumatic tools work is
done by rotation instead of percussion. The piston
is replaced by a motor, which turns an auger, drill,
or other tool for such operations as boring, screwing,
reaming, etc.
The use of pneumatic tubes for transporting letters,
parcels, and the like, although suggested as
early as 1667, has been in practical operation only
since 1854, when a tube 220 yards long was built in29
London to convey telegraphic dispatches. The articles
to be transported are placed in a carrier fitting
closely inside the tube and propelled either by introducing
air under pressure behind it or by exhausting
the air in front of it. Scores of miles of such
tubes laid underground are now in operation in London,
Paris, Berlin, New York, and other large cities
for carrying mail matter. In the United States the
pneumatic cash carrier, used in stores, is the commonest
application of “pneumatic dispatch,” as this
system of transportation is called.
The use of compressed air instead of a brush for
applying paint, varnish, and whitewash is a further
illustration of the versatile possibilities of air as a
means of transmitting power.
When an inclosed body of air or other gas is subjected
to pressure, its volume is diminished and its
density is increased. It is natural to inquire what
will happen if the external pressure be increased
indefinitely. Will the inclosed substance eventually
cease to be gaseous and become a solid or a liquid?
The answer to this question, furnished about half a
century ago through the researches of Thomas
Andrews, is that no amount of pressure will liquefy
a gas unless its temperature is below a certain point.
This point, known as the critical temperature, is
widely different for different substances. For most
of the atmospheric gases it is exceedingly low. Thus
oxygen must be cooled to 118° below zero Centigrade
(180° below zero Fahrenheit) before it will liquefy
under any pressure, and the critical temperature of
nitrogen is still lower. Efforts to liquefy the gases
of the atmosphere were unsuccessful for a long time
on account of the difficulty of attaining such low
temperatures.
30
Nowadays the problem is so completely solved that
the manufacture of liquid air is a commonplace commercial
enterprise, and millions of gallons are produced
every year. Liquid air is the principal commercial
source of pure oxygen, nitrogen, and other
gases found in the atmosphere. It is also used as a
refrigerating substance in various industrial and
scientific processes, and new uses are being found
for it from year to year.
Like many other latter-day miracles, compared
with which the alleged feats of necromancy seem
tame and puerile, the liquefaction of air is founded
on quite simple principles. The earliest commercial
process was invented, in its main features, by Linde
in 1895, and the newer processes are merely modifications
of this one.
Experiments of the English physicists Joule and
Thomson showed that when a gas under pressure is
forced through a small orifice, beyond which it expands,
it undergoes a certain amount of cooling.
This fall in temperature, known as the “Joule-Thomson
effect,” is generally quite small, but Linde
devised a means of multiplying it in his “regenerative
cooling process.” The air to be liquefied is
first compressed to, say, 100 atmospheres, cooled as
much as possible by water, and passed through a
long spiral tube. At the end of the spiral it escapes
through a small nozzle, and is thus somewhat further
cooled by the effect above mentioned. This cooled
air then passes back around the spiral tube, and
causes still more cooling of the air in the latter.
The escaping air is again compressed and goes
through the same process as before. Thus its temperature
grows constantly lower, until finally the
stream issuing from the nozzle is a liquid instead of31
a gas. The liquid collects in a reservoir, from which
it can be drawn off when desired.
The liquid air thus obtained has a temperature
of about 315° below zero Fahrenheit. It is generally
drawn into a vessel called, from the name
of the inventor, the Dewar flask, which is open at
the top, but otherwise insulated from the temperature
of the surrounding air by having a double wall,
with a vacuum between the walls. The familiar
thermos bottle is constructed on the same principle.
In such a vessel liquid air can be kept for hours and
even days, and it is thus available for use in many
interesting laboratory experiments.
Liquid air looks much like water, except for its
slight bluish color. It boils—i. e., changes back to
ordinary air—at a temperature only slightly above
that at which it is produced, and this boiling, of
course, goes on rapidly at the surface of the liquid,
owing to absorption of heat from the air above.
Liquid air is lighter than water, upon which it consequently
will float. A cubic foot of liquid air is
the equivalent of about 800 cubic feet of ordinary
air at 60° Fahrenheit and atmospheric pressure.
The curious effects of liquid air, only a few of
which can be mentioned here, are not irrelevant to
the subject of atmospheric resources, since they aid
in various ways in carrying out important scientific
researches. Almost all liquids are solidified and
almost all solids are hardened and stiffened by immersion
in liquid air. Alcohol is promptly frozen
in it, and at the same time gives out so much heat
that the liquid air boils violently and the congealing
alcohol overflows the vessel in a little avalanche of
snow. India rubber becomes as brittle as glass.
Meats become so hard that when struck by a hammer32
they ring like steel. Chemical action is enormously
reduced by exposure to the low temperature
of liquid air, and so is the electric resistance of
metals. One might suppose that such a temperature
would be fatal to all forms of life, but this is not
the case. A goldfish, frozen solid in liquid air, revives
and swims vigorously a few seconds after being
replaced in water. Bacteria survive hours of
exposure to the temperature of liquid air, while the
seeds of higher plants, even after several days of
similar treatment, sprout the same as other seeds.
Most of the atmospheric gases have not only been
liquefied, but also frozen solid. An important exception
is helium, which has been liquefied only at
a temperature of 452° below zero Fahrenheit. The
remarkable feat of liquefying helium was accomplished
in 1908 by the Dutch physicist Kamerlingh
Onnes, who subsequently, in his attempts to solidify
this substance, attained the unprecedented temperature
of less than 2 (Centigrade) degrees above “absolute
zero,” or 456° below zero Fahrenheit, by the
rapid evaporation of the liquid under greatly reduced
pressure.
Exploring the Upper Air. Left: Beginning of a pilot-balloon flight. Right: Sending up a sounding-balloon. Note the
parachute, which wafts the basket of instruments gently to the ground after the balloon bursts. (Photographs from U. S.
Weather Bureau.)
Although, when air is liquefied, the oxygen and
nitrogen are condensed simultaneously, the latter
has a lower boiling point than the former and therefore
passes off more rapidly when the liquid is allowed
to evaporate. This fact makes it possible to
separate the two substances, by the process known
as “fractional distillation,” and hence liquid air
plants have been established for the special purpose
of manufacturing oxygen and nitrogen, for both of
which there is a large and growing commercial demand.
Scores of millions of cubic feet of oxygen
are used every year in the wonderfully efficient33
process of welding metals with the oxyacetylene
blowpipe, the flame of which has a temperature of
about 6,000° Fahrenheit. Most of the supply now
comes from liquid air. An equally large amount is
used in a recently introduced method of cutting
metal. The object to be cut is first heated to incandescence,
after which a jet of oxygen is played upon
it. The metal actually burns away in the stream,
and a clean cut is made like that of a saw. It is
interesting to reflect, when we fill our lungs with
oxygen in order to keep our bodily machinery in
operation, that the same atmospheric gas is applied
to the building of motor cars, bicycles, safes, boilers,
and battleships. Cartridges made of lampblack,
dipped for a few moments in liquid oxygen and then
primed with a fulminate cap, constitute an explosive
as powerful as dynamite and much cheaper to
produce. A small percentage of oxygen added to
the air supplied to blast furnaces has been found to
effect a great saving of fuel used in the furnace.
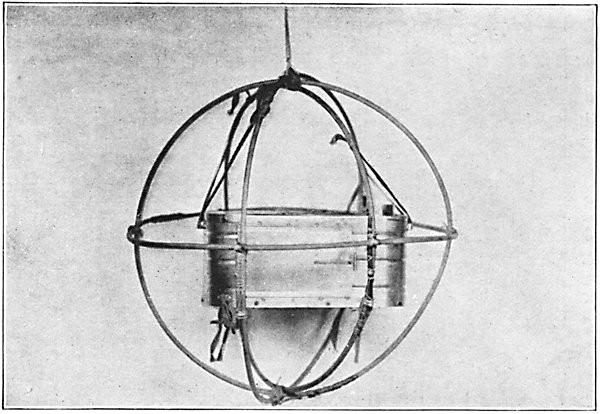
Meteorograph for use with Sounding Balloon. (Fergusson
pattern. U. S. Weather Bureau, 1919.) The aluminum case, surrounded
by hoops of rattan to protect the apparatus when it falls to
the ground at the end of the flight, contains a set of very light self-registering
meteorological instruments. (Photograph from U. S.
Weather Bureau.)
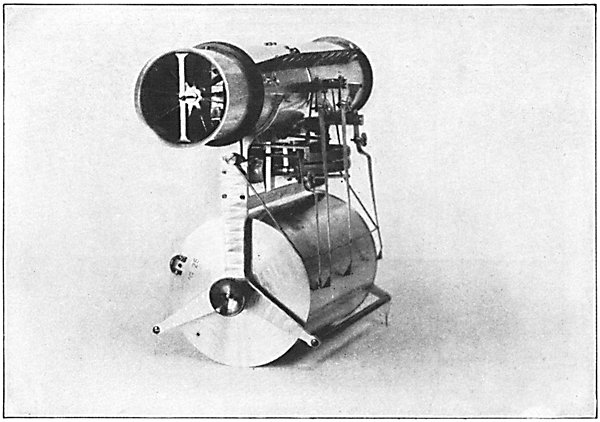
Kite Meteorograph. (U. S. Weather Bureau Pattern.) The four pens
record the barometric pressure, temperature, humidity, and wind-force
on a sheet of paper wound around the large cylinder, which
is turned by clockwork. Note the fan wheel inside the tube, for
measuring the force of the wind. The apparatus is made chiefly of
aluminum and is inclosed in an outer case of aluminum when sent
aloft attached to the kite. (Photograph from U. S. Weather Bureau.)
The most important industrial demand for nitrogen
is for use in “fixation” processes—i. e., for
making nitrogen compounds to be used as fertilizers,
explosives, etc. Before describing these processes,
it may be of interest to mention that some of the
“rare” gases of the atmosphere are now obtained on
a commercial scale as by-products of the manufacture
of oxygen and nitrogen from liquid air. Thus
neon, on account of its exceedingly small resistance
to the passage of electric discharges, is a promising
substance for filling glow lamps; especially as means
have been found of correcting the glaring red color
of the light which characterized the original neon
lamps. Argon is likewise used for filling electric
lamps.
34
The idea of using the unlimited store of atmospheric
nitrogen for the benefit of agriculture and
the manufacturing industries has been very prominently
before the public in recent years, and gained
special notoriety during the late war, when great
efforts were being made to increase the supply of
nitrogenous materials suitable for use in explosives.
Nitrogenous matters in the soil are indispensable
to the growth of plants, and as long ago as 1898
Sir William Crookes, in an address before the British
Association for the Advancement of Science,
alarmed the world by pointing out the possibility
of a general famine owing to the prospective exhaustion
of Chilean nitrates and other sources of
nitrogenous fertilizers. Nitrogen also enters on an
immense scale into the composition of many industrial
products besides explosives. No wonder popular
writers have dwelt upon the fact that the atmosphere
contains far more nitrogen than mankind
needs for every possible purpose—actually something
like 20,000,000 tons over every square mile
of the earth’s surface.
A widespread misunderstanding, however, prevails
as to the problem involved in utilizing this supply
of nitrogen. Free (i. e., uncombined) nitrogen
is of no use as a fertilizer, and it cannot be readily
used in the arts. The process of extracting it
from the atmosphere is an easy one, thanks to the
liquid air industry. The real difficulty is to make
this inert gas enter into chemical combination
with other substances, forming useful compounds
such as ammonia and nitrates; in other words,
to “fix” it.
As we have stated on another page, lightning discharges
cause nitrogen and oxygen to combine in35
the atmosphere, and perhaps also combine nitrogen
and hydrogen to form ammonia. There is one other
natural process by which atmospheric nitrogen is
fixed. Certain species of bacteria are able to extract
this gas from the atmosphere and combine it
with other materials. Some of these bacteria are
independent organisms, while others form colonies
of parasites growing on the roots of higher plants,
chiefly members of the pea family. In the latter
case the bacteria use the nitrogen of the air and carbohydrates
drawn from the roots on which they
grow to form nitrogenous compounds, which are, in
part, transmitted to the host plant.
Unfortunately these natural processes do not suffice
to maintain agricultural soils in a high state
of fertility. Mineral deposits of combined nitrogen
are practically limited to the nitrate fields of Chile,
from which more than two million tons of nitrate
of soda are exported annually; but this supply cannot
last more than a few decades. Combined nitrogen
in the form of ammonia is supplied on a large
and rapidly growing scale from by-product coke
ovens, and another perennial source of nitrogenous
matter is found in animal and vegetable refuse of
all kinds, including fish scrap and slaughter-house
refuse, garbage, sewage, manure, etc. Since, however,
the demands of agriculture and the manufacturing
industries greatly exceed the total amount
of combined nitrogen obtainable from all these
sources, the ingenuity of inventors has been spurred
to the task of fixing atmospheric nitrogen by artificial
methods, and several such methods have now
been put in operation commercially. Their combined
product at present constitutes nearly one-third
of the total nitrogen supply of the world.
36
It is not proposed here to describe these methods
in detail, but it may be mentioned that one of them,
known as the “arc process,” imitates the action of
lightning in combining the nitrogen and oxygen
that occur naturally in the air, while the others
utilize nitrogen that has been previously separated
from the air by the liquid air process. The arc
process requires, for commercial success, a large
supply of cheap electrical power, and it is at present
almost confined to Norway and Sweden, where electricity
is obtained from waterfalls. In this process
air is blown through a huge electric flame,
spread out by a powerful electromagnet. The air
yields nitric oxide, which is combined with water
to form nitric and nitrous acids, and these substances
are combined with others to form marketable
products. The most widely used fixation process,
and the one which the United States Government
proposed to employ in the large plants that
were in course of construction in this country at
the close of the war, is known as the “cyanamide
process.” This process requires, as a part of its
raw materials, large supplies of limestone and coke,
from which calcium carbide is made in an electrical
furnace. The calcium carbide, at red heat, absorbs
nitrogen, forming an intermediate product from
which, by further processes, are made ammonia
and nitric acid. A third method of fixing atmospheric
nitrogen, which has been applied on a vast
scale in Germany and is now coming into use in
other countries, is commonly called the “Haber
process.” In this process nitrogen is combined with
hydrogen, obtained from water, to form ammonia,
the combination being facilitated by the presence of
what chemists call a “catalyzer,” i. e., a substance37
that enables other substances to combine without
itself undergoing any change. Several different
catalyzers have been used in the Haber process.
Two or three other methods of nitrogen fixation
are beginning to assume commercial importance.
While the power of the wind holds an important
place among the resources of the atmosphere, it
cannot be said that the utilization of this resource
has undergone developments in modern times at all
comparable with the striking inventions and discoveries
we have just been recording, if we except the
use of the wind in aeronautics. Atmospheric resources
used by aeronauts will be discussed in subsequent
chapters.
The chief use made of the wind to-day, as in ages
past, is to propel sailing ships, and its use for this
purpose is, of course, of less importance, in a relative
sense, than it was before the introduction of
steam. The importance of windmills has also
greatly declined. This fact was strikingly brought
out some years ago when the United States Bureau
of Statistics collected, through American consuls
abroad, detailed information concerning the use of
the windmills in foreign countries. In most parts
of Europe windmills are rapidly disappearing. In
Holland, for example, the traditional home of the
windmill, the perpetual task of draining the polders
is now performed by steam pumps, and the total
number of windmills is estimated to be only about
one-tenth what it was centuries ago. Our own
country is probably the only one in which the use
of windmills is increasing. The modern American
windmill, with its disklike assemblage of numerous
light sails, and ingenious contrivances for veering,
reefing, etc., is a much more efficient contrivance38
than the old-fashioned windmill; but its utility, like
that of other windmills, is limited by the irregular
force of the winds.
For years the hope has been entertained that the
windmill would eventually become a common means
of generating electricity, but this hope has not yet
been realized, though isolated installations of this
character are in successful use.
39
CHAPTER III
THE ATMOSPHERE AS A HIGHWAY
Within the last few years the atmosphere has
assumed a new and tremendous importance in
human affairs as a medium that affords facilities for
travel and transportation far superior, in many respects,
to those offered by the land or the water. The
aerial highways are now open for business and
pleasure. This is a fact that the majority of people
find it difficult to realize. The navigation of the air
on a general scale has so long been looked upon as a
dream of the future that we cannot readily adjust
our minds to the reality.
The story of the slow steps by which this momentous
fact has been brought to pass is far too long
to be told here. What we purpose to do in the
present chapter is to sketch the multifarious uses
to which man is now applying the aeronautical
knowledge and skill that he has acquired. At
the same time we shall anticipate, to some extent,
the developments of the near future; for the lines
of progress are so clearly marked out that it is
possible to do this without giving too much rein
to the imagination.
In a subsequent chapter, dealing with Aeronautical
Meteorology, we shall touch briefly upon the mechanical
principles that underlie aerial navigation, by way
of preface to a more detailed description of the conditions
of wind and weather encountered by aircraft,40
and of the services that the meteorologist is rendering
to the aeronaut.
The history of aeronautics may be divided into two
periods, with the year 1914 as the dividing line between
them. Before the great war the many brilliant
minds that were trying to solve the problems of
aerial navigation received comparatively little help
or encouragement from humanity at large. The airship
and the aeroplane were both accomplished facts,
but most people looked upon them as ticklish contrivances
of very little practical value. From the
year 1909 onward aviation occupied an immense
share of public attention; liberal prizes for aerial
feats were offered; new records for speed, altitude,
and endurance were made from day to day; but to
the public, and perhaps to most of the aviators themselves,
all this meant merely that a new and thrilling
sport had been created, rather than a new art of
boundless utility. Very few business men felt inclined
to invest money in the development of aircraft,
and the governments of the leading nations, with a
single exception, were incredibly blind to the importance
of building air fleets for use in war. The
exception was Germany, which not only gave strong
support to Count Zeppelin in the building of his
dirigibles, but developed military aviation to such
an extent that she entered the war with about 800
aeroplanes and a thousand trained pilots.
With the outbreak of the war the budding art
burst into vigorous bloom. Unlimited funds were
now available for experimenting and building.
Thousands of flyers invaded the air, and the battle
zone was a testing ground on a vast scale, where
one improvement was hardly introduced before it
was replaced by another. Some of the best engineering41
talent of the world was diverted from many and
various fields to the one task of supplying the demands
of the military aeronauts for more speed,
more power, more reliable motors, better materials
and appliances. Thus the war not only perfected
aeronautics—especially aviation—as an art, but
practically created it as an industry. At the close
of hostilities the world found itself in possession of
a vast fleet of aircraft, a multitude of aircraft factories,
and a great army of trained aeronauts. For
a time people asked—and perhaps some still ask—“What
shall we do with them?”
There are many answers to this question, and new
ones are coming to light every day. In the aggregate
they mean that a new era has dawned in human
affairs—the era in which the sky has been annexed
to the world in which man lives. Henceforth we
shall have more elbow room. We shall no longer be
imprisoned in Flatland, but set free in Spaceland.
It is impossible to foresee all the implications of
this fact, but those that are already apparent suffice
to fill us with enthusiasm.
Some of the most vexed problems of the present
day will soon be solved by aerial navigation. Take
that of our overcrowded cities. Everybody knows
how first the trolley car and then the automobile
helped to relieve the congestion of towns by making
it feasible for people to live many miles from the
scenes of their daily work, but at the same time
seriously swelled the traffic of the streets in business
quarters. Aircraft will bring far greater improvements
in this respect, without corresponding
disadvantages. In a few years it will probably be
no inconvenience to live fifty or a hundred miles
from one’s place of business. Aeroplanes, built for42
carrying several passengers in perfect comfort,
already fly at speeds of from 120 to 150 miles an
hour, and are almost independent of weather. Much
greater speeds will doubtless be common in the
future. Automobiles, all running on the same level,
have almost reached the limit of space available in
our busiest streets, and, under such conditions, they
have nearly lost the advantage of speed they once
possessed over the obsolete horse-drawn vehicle.
There can never be such crowding in the air. When
a great volume of aerial traffic is concentrated
toward the centers of towns, people will fly their
vehicles at various prescribed levels, and probably
“park” them on many-storied landing stages. New
methods of landing will undoubtedly be invented.
The device known as the “helicopter,” which has
made progress toward the practical stage during the
past year, points out the possibilities in this direction.
In the helicopter the propeller blades revolve
around a vertical shaft, thus permitting the vehicle
to rise or descend vertically. A prize of $100,000
has recently been offered by M. Michelin, the well-known
French patron of aviation, for the perfection
of this device, which may soon revolutionize the design
of flying machines.
Mr. Holt Thomas, the Englishman whose foresight
and enthusiasm have done so much to hasten
the arrival of practical commercial aeronautics, believes
that in the near future the main airways of
the world will be served by airships rather than by
aeroplanes. For long journeys the airship has the
advantage that it can carry an ample supply of fuel
without encroaching too much upon the space available
for passengers and cargo. It is, therefore, especially
suitable for transoceanic journeys. Hitherto43
airships, when not in flight, have been housed in
enormous hangars, involving heavy cost of installation
and their landing has required the services of
hundreds of men—an operation that will probably
seem laughable in its crudity to the next generation.
The airship of the future will probably never go
into a hangar at all except for occasional overhauling,
as an ordinary ship goes into drydock. Hence
only a few of these costly structures will be needed.
While in service the airship will, on reaching an air
port, moor herself at the bow to a great steel tower,
and swing with the wind as a marine vessel swings
at her anchor. At the top of the tower there will be
a landing stage for passengers and freight, connected
by lifts with the ground below. From the
main air ports, thus equipped, will radiate minor
air routes, served by aeroplanes, and, in some cases,
by flying boats.
Such landing places for airships were predicted
by Kipling in his “With the Night Mail”—but the
author’s vista was of the year 2000! We are not
traveling so slowly as that. Consider what it means
that the world heard with bated breath of Blériot’s
flight over the English Channel in 1909; and just ten
years later men had flown over the Atlantic Ocean.
We have been writing of the future; but we need
not look ahead for illustrations of the practical value
of aerial navigation. Useful feats already accomplished
are so astonishing in their variety that they
make one cautious about assigning a limit to the
possible applications of the new art. It has happened,
for example, that a man who had booked
passage on a trans-Pacific steamer missed his boat
at Seattle; whereupon he hired an aeroplane, at a
cost of $75, and overtook the steamer on her way44
down Puget Sound, thus saving some weeks of delay
in waiting for the next one. Another man, who produces
honey on a large scale, found that spray-poisoned
orchards were playing havoc with his bees.
He traveled in an aeroplane over the surrounding
country, selecting stands for his hives at safe distances
from such orchards, and he estimates that
this precaution saved him $10,000 in a single year.
In August, 1919, a flying boat deposited a bag of
mail on the White Star liner Adriatic two hours
after the ship had left New York.
Several aerial mail routes are now in operation
on both sides of the Atlantic. The first regular
service of this character in America was begun May
15, 1918, between New York and Washington, and
during the first year carried 7,720,840 letters, with
few accidents and no fatalities. The first year of
service cost the Government $137,900, and the sale
of aeroplane mail stamps during the same period
yielded a revenue of $159,700. Out of 1,261 possible
trips on this route, 1,206 were undertaken, and only
fifty-five were abandoned on account of unfavorable
weather. During 1919 the Post Office Department
not only established other aerial routes, but relegated
the aerial mail service to the ranks of the commonplace
by reducing the postage on letters carried by
aeroplane to the ordinary first-class rate of two cents
an ounce.
In Europe lines of fast aeroplanes carrying mails,
passengers, and freight daily over regular routes are
becoming part of the established order of things.
The operators of a line between London and Paris,
which was inaugurated in November, 1919, are now
planning to establish an hourly service. Some of
these lines have been equipped with wireless telephony,45
so that the pilots can keep in constant communication
with numerous stations of the company
along the route, and also with one another. They are
thus able to obtain, among other things, current
information about the prevalence of fog or other
atmospheric conditions at points ahead of them.
Presumably the passengers who patronize the aeroplane
express will also, eventually, enjoy the use of
the wireless telephone en route. In connection with
the new air routes suitable landing grounds, for
regular or emergency use, are being laid out at short
intervals; the ideal aimed at, for the present, being
the so-called “ten-mile chain”; i. e., a series of emergency
landing grounds about ten miles apart. From
ordinary flying levels a pilot on such a route can
always glide to one of these grounds in case his
motor fails. The landing grounds will be utilized,
under certain restrictions, for grazing cattle and for
agricultural purposes, to help cover the cost of
rental and maintenance. During 1919 the British
Government established a chain of landing grounds
in Africa, all the way from Cairo to the Cape.
One of the developments of the war was the use
of aeroplanes for photographic mapping. The aeroplane
flies over a long tract of ground, and the
camera, exposed vertically, takes pictures automatically
at fixed intervals. The pictures thus taken
are carefully joined together in a single strip. A
second tract, parallel with the first, is photographed
in the same manner, and so on, until the whole area
has been covered. Eventually all the pictures are
assembled to form a so-called “mosaic.” This process
is highly successful for mapping a flat country,
but presents difficulties when there are hills and
mountains. Some sort of stereoscopic process will46
probably be perfected for depicting accurately differences
in level and producing a “contoured” map.
Although aeronautical mapping does not yet replace
old-fashioned methods, it already has several obvious
uses. It is especially suitable for the revision of
existing maps. Thus the plan of a city can be quickly
brought up to date by this process. In the United
States the Geological Survey has been engaged for
many years in producing large-scale topographic
maps of all parts of the country. This work proceeds
slowly, and some of the maps are ten or fifteen
years old. The contours and other natural features
on such a map are still correct, but changes in the
region due to the work of man are often extensive.
Revision of these features can easily be made by the
method above described.
For the preliminary mapping of a new country,
by photography or by hand, the aeroplane offers the
means of saving an immense amount of time and
effort. The surveyor no longer needs to cut tracks
through the jungle or scale mountains. No region is
very difficult of access to the aviator. The summit
of Mount Everest, the highest mountain in the world,
is actually a mile lower than the greatest altitude
attained by an aeroplane. Aviation has become an
important feature of exploring expeditions. Captain
Amundsen, the polar explorer, qualified as an
air pilot before he embarked on his drift across the
North Polar basin, and took aeroplanes with him on
that journey. In India the Survey Department has
organized a regular aerial photographic and reconnoissance
service, and has lately photographed the
high waters of the River Sutlej in order to obtain
data for a big electrification project. Photographs
of the Nile country have also been made for hydrological47
purposes. British aviators in Mesopotamia
have mapped the flood boundaries of the Tigris and
provided data for estimating crop areas. In the
Philippines an engineer recently made a long aeroplane
flight to determine which of three general
routes was most suitable for a new railway. Many
months of time and thousands of dollars were thus
saved, as it was only necessary to send out one party
of locating engineers instead of three after the selection
had been made.
Recently the aerial surveyor has become the rival
of the hydrographer in mapping shoals, channels,
submerged rocks, and other features beneath the
water. If the water is clear and suitable atmospheric
conditions prevail, objects submerged to a
considerable depth may be distinctly seen from an
aeroplane flying far above the surface. It was on
account of this fact that Allied aviators were able
to spot submerged German submarines during the
World War. The camera, equipped with proper
plates and ray filters, can pierce the water even
better than the eye. Thus objects have been photographed
at a depth of more than 50 feet. British
aviators charted the harbor of Rahbeg, on the coast
of Arabia, by the process in 1917. In this country
the leading exponent of underwater photography
is Dr. Willis T. Lee, of the United States Geological
Survey, who has taken scores of photographs showing
submerged features of the waters adjacent to
Chesapeake Bay. It is likely that rivers like the
Mississippi, with ever shifting sand bars, will soon
be made safe by monthly or weekly mapping from
the air. In earthquake regions, such as southern
Italy and Japan, the changing coast lines, shallows
and harbors can easily be photographed after each48
new quake, thus keeping navigation open and protecting
the lives of mariners.
Another application of this process of sighting
submerged objects from the air is the aerial fish
patrol. The plan of using aircraft to locate schools
of fish appears to have been first suggested by Professor
Joubin, of the Oceanographic Institute of
Monaco, and it has been carried out with much success
in both Europe and America. Its promoters
hope that it will eventually revolutionize the fishing
industry and add greatly to the world’s food supply.
In the year 1919 seaplanes from the North Island
Air Station at San Diego, California, made regular
flights at an altitude of about 500 feet over the adjacent
waters as an adjunct to the important
fisheries in that vicinity. When a school of fish was
detected, the aviator dropped low enough to ascertain
the species, and if it proved to be of a commercial
kind, such as the sardine, the news was
flashed by wireless to the fishing fleet. The ocean
in the neighborhood of San Diego was divided into
numbered squares, shown on charts, and locations
were reported by number. In 1920 a daily patrol
was maintained by Navy seaplanes over the waters
of Chesapeake Bay in behalf of the menhaden
fishery. According to an official report, “the experiments
fully demonstrated the commercial value of
planes in this fishery.” It is believed that aircraft
might be used with equal success in connection with
the whaling industry.
The United States Forest Service has made considerable
use of Army aeroplanes and aviators in
patrolling the great forests of the West, where a
constant lookout for fires must be kept throughout
the summer. There are about 28,000 forest fires in49
this country every year, and the average area
burned over amounts to more than 8,000,000 acres,
entailing an average annual loss of $10,000,000
worth of timber. Observations are maintained on
mountain peaks and towers, but the aerial watchman
commands a much greater range of vision and
can readily detect fires in places such as deep canyons
where they are, in many cases, hidden from the
existing lookout points. When a big fire is in
progress, the aviator can quickly ascertain its extent
and report the information by wireless to the
fire-fighting forces. In case the fire is difficult of access
on account of the absence of roads, the fire
fighters can be transported to the spot in aeroplanes.
It has even been proposed to fight forest
fires by dropping bombs filled with fire-extinguishing
chemicals. At one time it was thought that
aeroplanes might largely replace fixed lookout stations,
but experience shows that both systems of
observation are desirable. Many foresters favor the
use of small dirigible airships in place of aeroplanes,
owing to their ability to fly very low, when desired,
land in any small clearing, discharge passengers by
rope-ladder while hovering over a selected spot, and
transport relatively large loads of men and supplies.
Such are a few of the valuable peace-time uses that
have already been found for the aerial vehicles that
owed their production chiefly to the late war and
for the host of pilots trained during the same conflict.
Undoubtedly the immediate future holds far more
interesting developments in store.
One important practical aspect of aeronautics remains
to be mentioned, and that is the question of
safety. In their early days the steamboat and the
steam railway were both risky contrivances. It is50
recorded that at one time steamboats were barred
from the Thames on account of their dangers. Undoubtedly
the tradition of frequent boiler explosions
lingered in people’s minds long after it had ceased
to be a substantial fact. Aerial navigation—and
particularly aviation—has now passed beyond the
pioneer stage, but it still bears the dubious reputation
that it acquired when it was in its infancy.
Aerial travel, under standardized conditions, is no
longer unsafe. There are good reasons for regarding
it already as safer than automobiling. According
to a report of the British Department of Civil
Aviation, there were 21,000 commercial flights in
Great Britain during the six months from May 1 to
October 31, 1919, and 52,000 passengers were carried.
The total mileage covered was 303,000. Not a
single passenger was killed during this period, and
only ten were injured. There were two fatalities
among pilots and six pilots were injured.
Commander Read, who made the first transatlantic
flight, writes on this subject:
“There are some pilots with whom I would refuse
to risk my life. But, given a modern machine with
the proper attention paid it, and a skillful but conservative
flyer, it is as safe a means of rapid transit
as an automobile traveling at less than half the speed.
Nowadays there is scarcely ever an accident in an
aeroplane of standard type due to the fault of material;
they are all due to the inexperience or to the
dare-devil stunting proclivities of the pilot—the pilot
who ‘takes chances.’”
Aeronautics is now more than an art. It is a
rapidly expanding branch of applied science. Aeronautical
engineering has become one of the recognized
professions. Some of the leading government51
laboratories of the world, including the National
Physical Laboratory in Great Britain and the United
States Bureau of Standards, are devoting their attention
to aeronautical research. There are also many
unofficial “aerodynamical” laboratories for studying,
with the aid of wind tunnels and other apparatus,
the many problems pertaining to the physics of flight
and the principles of aeroplane designing.
Aeronautical questions have begun to figure conspicuously
in jurisprudence. Legislators, as somebody
has said, are busy making vertical laws to supplement
the old-fashioned horizontal ones. In international
law, especially, aerial navigation has given
rise to thorny problems and it is already the subject
of elaborate international agreements.
The physiological effects of flight and altitude have
added a new chapter to the science of medicine.
Seasickness has been the crux of the ship’s doctor;
will “air sickness” prove equally baffling? What are
the therapeutic possibilities of flying? Will physicians
advise their patients to seek a “change of air”
vertically instead of horizontally?
The atmosphere, once monopolized by the birds,
has become the abode of man. That is one excellent
reason why everybody should acquire a knowledge
of meteorology—the science of the air.
52
CHAPTER IV
DUST AND SMOKE IN THE
ATMOSPHERE
When the moralist reminds us that we are children
of the dust and predestined to a dusty end,
there is a grain of comfort in the discovery that
modern science regards dust as one of the most important
things in the whole economy of nature. No
longer does dust seem an appropriate symbol of insignificance
and humility when one surveys the bulk
of serious literature that has been written about it,
considers the caliber of the men who have devoted
the better part of their lives to the study of it, or
inspects the great array of ingenious apparatus that
has been devised for its investigation.
The dust of which we have to speak in the present
chapter embraces all small particles of solid matter
found anywhere, or at any time, in the earth’s atmosphere.
Particular kinds of dust have, of course, their
special names. Soot, the visible part of smoke, is a
form of dust that has played a very conspicuous part
in human affairs; hence the separate mention of
smoke in the heading of this chapter.
While there are many agencies that help to charge
the atmosphere with dust, the most important of
them all is the wind. Let us see what happens when
the wind blows over the surface of a dusty road, for
example. If the air flowed in a smooth horizontal
stream over such a surface, its friction would drag53
the dust along on the ground, but would not lift it.
Such surface drifting, due to the horizontal component
of the wind’s motion, does, of course, occur,
and its effects are strikingly visible in the shifting
dunes that often form over a broad surface of sand
or snow. All winds near the earth’s surface are,
however, full of waves and eddies, and in many cases,
as over a stretch of strongly heated soil, there are
strong updrafts, sometimes extending to a great
height in the atmosphere. All kinds of dust are
heavier than air, and, contrary to popular belief,
never truly “float” in the atmosphere. Dust may
enter the atmosphere at high levels, through the disintegration
of meteors, or it may be spouted up by
volcanoes, but dust blown up from the earth’s surface
rises only because the air is rising with it; and,
in still air, all dust sinks more or less rapidly toward
the ground. The rate of its fall depends upon its
specific gravity, and upon the size and shape of the
dust particles. Other things being equal, the finest
particles fall most slowly. Exceedingly fine dust,
even without upward air movements to support it,
requires months or even years to fall to the ground
from the higher levels of the atmosphere.
Upward movements in the air suffice to carry
millions of tons of dust aloft every year, and horizontal
air currents carry the same dust far and wide
over the earth. The transportation of soil by the
wind leads to some results of remarkable interest,
practical as well as scientific. In the first place, far-reaching
changes in topography are brought about
by this process. Thus in China vast areas are covered
to a depth of hundreds or even thousands of
feet with a fine yellowish earth, called “loess,” which
is believed to have been blown thither by the winds54
from the deserts of Central Asia. Less extensive deposits
of this wind-borne material are found in many
other parts of the world, including the Mississippi
Valley. Another effect of wind transportation is the
mixing of soils. There is a constant interchange of
soil material between different regions, so that the
composition of the soil on a particular farm, for instance,
is not the same now that it was a few years
ago or that it will be a few years hence. Lastly, the
presence of dust in the atmosphere, whether derived
from the soil or otherwise, has various interesting
and important effects upon the heat and light we receive
from the sun and modifies, in numerous ways,
the conditions of human life upon our planet.
Several cases in which enormous quantities of solid
matter have been carried to great distances by the
wind have formed the subject of elaborate investigations
on the part of meteorologists. Thus, during the
three days, March 8–10, 1901, heavy dust storms occurred
in the deserts of southern Algeria, and the
sequel of these storms was carefully studied by Hellmann
and Meinardus. A widespread cyclonic storm,
central over Tunis at the time, sucked up the dust,
which was carried northward by the winds at high
altitudes. Deposits from this dust cloud occurred
over an area extending as far as 2,500 miles from
the place of origin. Reports collected from hundreds
of observers indicated that 1,800,000 tons of dust fell
over the continent of Europe, and one-third of this
fell north of the Alps. As much more is believed to
have fallen over the Mediterranean, while on the
African coast itself the deposit is supposed to have
amounted to 150,000,000 tons. In March, 1918, a
shower of dust discolored falling snow at various
places in the United States over an area of at least55
100,000 square miles, extending in an east-west direction
from Dubuque, Iowa, to Chelsea, Vt. Reports
of this shower were collected by Messrs. E. R. Miller
and A. N. Winchell, who estimate that the amount
of dust could not have been less than a million tons,
and may have been several hundred million. The
dust is believed to have been blown up from the arid
regions of the far southwestern United States and
to have been transported a thousand miles or more.
Off the west coast of Africa, between the Canaries
and the Cape Verde Islands, haze due to dust blown
up from the Sahara Desert is frequently encountered
by vessels, especially during the first four months
of the year. This haze probably gave rise to the ancient
legend of a Sea of Darkness—the Mare Tenebrosum—one
of the mysterious terrors of the ocean
reported by the navigators who first sailed toward
the New World.
Extensive deposits of atmospheric dust have attracted
attention from the earliest times. Ehrenberg,
in 1849, collected records of 349 such cases,
and published a map showing their distribution,
which embraces the greater part of the world.
Atmospheric dust is always brought down in greater
or less quantities by rain. When it consists of fine
powdery sand, the rain sometimes acquires a brownish
or reddish tinge, staining objects on which it
falls and constituting the “showers of blood” that
have been regarded as prodigies from remote
antiquity. Homer describes such a shower, and
many similar occurrences are recorded by the
Roman historians. Italy, owing to its proximity to
the African coast, is often visited by these showers,
which still strike superstitious terror into the hearts
of the peasantry.
56
The millions of meteors that enter the earth’s atmosphere
every day contribute their quota of dust,
though the total amount is small compared with that
of the material lifted from the earth. Fine ferruginous
particles are often seen on the snowy summits
of high mountains and the polar ice fields, and both
their appearance and their composition indicate that
they are derived from meteors.
Forest fires, burning peat beds, and other conflagrations
on a large scale discharge quantities of
dust into the atmosphere. Cinders from the great
Chicago fire spread over a large part of the globe.
They are said to have reached the Azores some forty
days after the beginning of the catastrophe. In
Europe, the once common practice of burning the
moors to prepare them for cultivation gave rise to
huge volumes of smoke, which was carried by the
wind hundreds and even thousands of miles. The
stronghold of this old custom—which still survives
to some extent—was East Friesland, in northwestern
Germany, and the characteristic haze to which it
gave rise, known as “moor smoke” (German, Moorrauch),
was sometimes observed as far away as
Spain, Italy, and Greece.
The famous “dark days” that figure in both ancient
and modern history, though in a few cases probably
due to eclipses of the sun, have generally been
the result of an abnormal accumulation of smoke or
dust in the air; sometimes arising from volcanic
eruptions, but more often from burning forests,
moors, or prairies. Forest fires are the principal
cause of dark days in the United States. Probably
the most celebrated of such days was May 19, 1780,
when, in consequence of great forest fires along Lake
Champlain and down to the vicinity of Ticonderoga,57
darkness like that of night prevailed in New England.
All but the most necessary business was suspended,
the schools were dismissed, and the greater
part of the population flocked to church to prepare
for the end of the world, which was believed to be
at hand. The great Idaho fire of August, 1910, was
responsible for dark days over a larger area than
in any other case on record in this country. Artificial
light was required in the daytime over a broad belt,
extending from Idaho to northern Vermont, but
smoke was observed far beyond this area. The British
ship Dunfermline reported that on the Pacific
Ocean, 500 miles west of San Francisco, the smell of
smoke was noticed and haze prevailed for ten days.
When smoke in the air forms a rather thin layer,
through which the sunlight penetrates feebly, we
sometimes get an effect similar to the golden glow of
sunset, a yellow or coppery tinge being cast over the
landscape. Such was the cause of the “yellow day”
still remembered in New England—September 6,
1881—attributed to the burning of the immense peat
bogs of the Labrador barrens.
Another occasional cause of atmospheric dustiness
is the eruption of volcanoes, especially those of an
explosive character, which carry fine dust to heights
at which it cannot be washed out of the atmosphere
by rain. The remarkable dry fog of 1783—the most
famous in history—which covered the greater part
of Europe and North America for three or four
months—was undoubtedly due to the violent eruptions
of that year in Iceland and Japan. Its connection
with the Iceland eruption was suggested even by
contemporary writers. The outbreak of Krakatoa,
in the East Indies, in 1883, spread a veil of dust over
the greater part of the globe. For two or three years58
its presence in the air was the cause of striking
optical phenomena, including gorgeous sunset glows.
The story is told of an American fire brigade which,
deceived by one of these brilliant sunsets, set out to
extinguish what was mistaken for a great fire in a
neighboring village. A large species of corona
around the sun, known as “Bishop’s ring,” because
it was first observed by the Rev. Sereno Bishop of
Honolulu, appeared shortly after the eruption and
reached its maximum intensity the following year.
This was due to the diffraction of light by the exceedingly
fine dust from the volcano, and the same
phenomenon has been seen after other great explosive
eruptions; e. g., that of Mont Pelée, in 1902.
Some authorities believe that the finest particles of
dust from the Krakatoa eruption were carried to an
altitude of over fifty miles above the earth, and remained
suspended at very high levels for several
years, constituting the strange “noctilucent clouds,”
seen on summer nights from 1885 onward. These
clouds glowed with a silvery luster, attributed to reflected
sunlight.
A persistent veil of volcanic dust in the upper air
is thought to exercise marked effects upon terrestrial
temperatures, and prolonged periods of intense
vulcanism have been regarded as the cause, or
one of the causes, of the recurrent ice ages of which
geology furnishes the record. This explanation of
ice ages was advanced by P. and F. Sarasin, in 1901,
and was first put upon a scientific basis by Dr. W. J.
Humphreys in 1913; but the idea that volcanic dust
might be the cause of cold seasons was suggested by
Benjamin Franklin as early as 1784. Franklin’s
speculations on this subject were prompted by the
cold winter of 1783–1784, which followed the59
extraordinary fog of 1783, already mentioned.
Humphreys has published a list of all the great volcanic
outbreaks recorded since 1750, and has shown
that each of them registered itself in the temperatures
of the earth and also, since accurate measurements
began to be made of solar radiation, in these
instrumental records. Thus, the intensely cold
winters of 1783–1785 followed the tremendous eruptions
of Asama, Japan, and Skaptar Jökull, Iceland,
in 1783; the famous “year without a summer”
(1816) was the sequel of the gigantic outbreak of
Tomboro, in the Sunda Islands, in 1815, which is
said to have hurled thirty-six cubic miles of solid
matter into the atmosphere; and definite periods of
low temperatures and reduced sunshine were observed
after the eruptions of Mont Pelée, in 1902,
and Mount Katmai, Alaska, in 1912.
The effect of a volcanic dust veil in lowering temperatures
on earth is attributed chiefly to the fact
that, while the fine grains of dust are able to reflect
back into space the short waves of radiation coming
from the sun, they do not bar the passage of the
long heat waves radiated outward from the earth.
According to Humphreys’s calculations, such a veil
is about thirtyfold more effective in shutting solar
radiation out than in keeping terrestrial radiation in.
This process is just the reverse of the familiar effect
of the greenhouse; where the glass lets in the short
waves of solar radiation but does not readily let out
the long waves of earth radiation.
A small contingent of atmospheric dust consists of
common salt (sodium chloride) due to the evaporation
of spray from the ocean. This substance is frequently
found in rain, as well as in samples of air,
not only near the seashore, but even in the interior60
of continents and on high mountains. According to
Du Bois the amount of sodium chloride annually deposited
on the dunes of Holland is at least 6,000,000
kilograms (more than 6,600 tons).
One of the striking phenomena of arid regions is
the dust whirlwind; exemplified in the “devils” of
India and South Africa, the “twisters” of Texas, etc.
E. E. Free, in his treatise on “The Movement of Soil
Material by the Wind” (U. S. Bureau of Soils, Bulletin
68), says of these whirls:
“They may be seen nearly every hot day, sometimes
running rapidly over the surface; sometimes
remaining nearly, if not quite, stationary, but never
losing their rapid rotation. They usually last only a
few minutes, but occasionally persist much longer.
One observed by Pictet lasted for over five hours.
They are largest and last longest on the flat, bare
plains of the desert, and are usually seen in a calm
or when only a light breeze is blowing, although their
occurrence in windy weather is not unknown. These
whirls have been noticed by many travelers in desert
and steppe regions and have been carefully observed
by Baddeley in India, and by Pictet in Egypt. They
are frequent in China and on the pampas of South
America, and occasionally occur during the dry season
even in the humid regions. One of the most interesting
phenomena in connection with the dust
whirls is the occurrence of systems of several whirls,
each revolving rapidly about its own center and also
moving about a common center in a more or less perfect
circle a few rods in diameter.”
The little whirls often seen on dusty roads are a
miniature variety of the same phenomenon.
One very important class of dust particles in the
atmosphere consists of organic matter, living or dead,61
including the pollen of plants and the countless
myriads of microorganisms, as well as a variety of
other products of the animal and vegetable kingdoms.
An abundance of pollen in the air accounts for the
occasional fall of yellow rain, described as “sulphur
rain,” “golden showers,” etc. The promptness with
which a piece of stale bread becomes moldy in a damp
atmosphere is one of many proofs of the omnipresence
in the atmosphere of the microscopic spores of
fungi, ready to propagate their species with amazing
rapidity as soon as they light upon a suitable nutrient
medium. Last, but not least, bacteria, the most
minute of all known organisms—so small that
thousands or millions of them clustered together
would make a mass not larger than the head of
a pin—swarm in the air, as they do in water, the
soil, and the bodies of animals. Fortunately, while
certain species of bacteria carry disease and
death with them, the great majority are harmless
to mankind.

AITKEN’S DUST COUNTER
A great many different methods are in use for determining
the total amount of solid matter present
in a given volume of air, counting the number of
particles, or gathering samples for microscopic
examination. Thus a known volume of air may be
drawn through a filter of cotton wool or bubbled
through distilled water, and the dust detained by
the cotton or deposited in the water may be weighed.
In certain types of apparatus the air is drawn or
forced against a plate or tube coated with glycerin,
oil, varnish, gelatin, or other adhesive surface,
to which the dust remains attached. Several devices
depend for their operation upon the fact
that when a volume of confined air is cooled by
expansion a point is eventually reached at which62
the water vapor present condenses to form a fog,
each droplet of which is supposed to have a single
particle of dust as its
“nucleus.” This is the
principle involved in
the well-known Aitken
dust counter, which has
been so extensively used
in different parts of the
world, and has furnished
most of the impressive
statistics of air
dustiness found in textbooks
and reference
books. Thus, from indications
supplied by
this instrument, it is
stated that a cubic inch
of town air contains
50,000,000 particles of
dust; that a room, near
the ceiling, was found
to contain 88,000,000
particles per cubic inch;
and that a cigarette
smoker sends 4,000,000,000
particles into
the air at every puff.
Recent authorities are
inclined to look upon
these figures as misleading,
for the reason
that the nuclei counted with Aitken’s instrument
are probably so infinitesimal in size that they hardly
deserve to be called dust; indeed there is good reason63
to believe that an indefinitely large proportion of
them may actually be molecules of gases.
The effects of dust, both inorganic and organic,
upon the health of humanity will be considered in
another chapter. Certain kinds of dust are of economic
importance on account of their inflammable
and explosive character when mixed with the right
proportions of air. Thus the cereal dusts made in
the handling and working up of grain into food products
occasionally give rise to serious accidents. These
occur in cereal, flour, and feed mills, grain elevators,
starch and glucose factories, and on farms in connection
with the use of threshing machines. During
a period of ten years, 1906–1916, cereal dust explosions
resulted in the loss of eighty lives and the destruction
of property to a value of $2,000,000 in the
United States. A study of this subject has been
made by the United States Department of Agriculture,
and various recommendations have been published
with a view to preventing the occurrence of
sparks in the neighborhood of these dangerous dusts.
Coal dust in mines likewise causes numerous explosions.
Preventive measures include wetting the dust,
moistening the air, and powdering the walls, roof
and floor of the mine with a nonexplosive rock dust,
which has the effect of stifling an incipient fire or
explosion.
The last species of dust that we have to consider
in this chapter is one that constitutes a literal blot
on civilization, since the noblest cities and monuments
of mankind are defaced with it. Neither are
the evils of this kind of dust wholly æsthetic, for it is
extremely injurious to health and enormously expensive.
After enduring coal smoke as a necessary evil
for generations, civilised humanity has now embarked64
upon a vigorous campaign for its elimination,
and very encouraging results have already been
achieved in many parts of the world. The war
against smoke is carried on by numerous societies
in Europe and America; a multitude of laws and
ordinances (not all of them effective) have been enacted
on the subject; it has been the occasion of international
conferences and expositions; and its
literature has grown so copious that a partial bibliography
of the subject, published a few years ago
by the Mellon Institute, of Pittsburgh, fills 164
pages.
The smoking of chimneys is costly, in the first
place, because it is due to imperfect combustion and
the waste of part of the heating value of the fuel,
and, in the second place, on account of the damage
wrought by the deposit of the soot. Thus a smoky
atmosphere entails big laundry and dry-cleaning
bills, frequent repainting of houses, injury to metal
work, damage to goods in shops, and excessive
artificial lighting in the daytime. Throughout the
United States it is said that smoke causes an annual
waste and damage amounting to five hundred million
dollars. In Pittsburgh alone—before the reform
produced by vigorous legislative and scientific measures,
following an exhaustive investigation by the
Mellon Institute of Industrial Research—the cost of
the smoke nuisance was estimated at nearly ten
million dollars a year. Means of mitigating this evil
include the introduction of improved appliances for
burning soft coal, and the use of other kinds of fuel.
The electrification of the railway lines entering
cities is an important measure of relief. It is estimated
that more than one-third of the smoke found
in certain American cities comes from locomotives.
65
Systematic measurements of the amount of solid
matter contributed to the atmosphere by smoke have
been made at various places in this country and
abroad, and yield startling figures. Measures of the
“sootfall” in Pittsburgh, before the evil there was
mitigated, showed an annual average deposit amounting
to 1,031 tons per square mile. London’s average
is 248 tons per square mile for the whole city and
426 tons in the central districts. In the heart of Glasgow
the annual sootfall is 820 tons per square mile.
In Great Britain measurements and analyses of
soot and the study of its effects have been carried out
on a large scale for a number of years by the Advisory
Committee on Atmospheric Pollution, attached
to the Meteorological Office. The Committee has installed
“pollution gauges,” of uniform type, at about
twenty-five places in England and Scotland. The
soot that falls into these gauges is collected once a
month, weighed and analyzed. This organization also
makes direct measurements of the purity of the air,
and has acquired a unique body of observations that
can be used to test the success of efforts made to
abate the smoke nuisance, besides providing interesting
comparisons between the incidence of respiratory
diseases and the amount of solid matter in the air.
66
CHAPTER V
WEATHER AND WEATHER
INSTRUMENTS
The fact that a vast proportion of the conversations
in which human beings engage begin with
remarks about the weather has often been noted,
but perhaps never fully explained. Meteorologists
sometimes adduce this fact as evidence that weather
is a subject of overshadowing importance. This bit
of reasoning will not, however, bear critical analysis.
It carries with it the implication that people
talk about weather because weather is uppermost in
their thoughts. How often is such the case? Brown,
meeting Jones, remarks that it is a fine day. Are
we to infer that Brown was meditating upon
the agreeable state of the atmosphere before he
vouchsafed this not altogether novel observation?
Hardly. There is about one chance in a thousand
that weather was in his mind at all.
It is a plausible thesis that people talk so much
about weather because, at an earlier period in the
history of mankind, this subject was of supreme importance.
Perhaps it is a custom handed down from
our remote ancestors, whose occupations were
nearly all carried on out-of-doors and who enjoyed
but a precarious shelter from the elements in their
rude habitations. In India, as the period of the
monsoon rains approaches, anxiety about the timely
arrival and the abundance of these showers eclipses67
all other thoughts in the mind of the peasant, because
a severe drought at this season means a
famine. When our forefathers lived by hunting,
fishing, and crude systems of grazing and agriculture,
they were, no doubt, equally solicitous about
atmospheric conditions that directly affected their
food supply. In those days comments on the weather
were by no means empty formulas. Men rejoiced
together that the day was fine, because it was a
circumstance upon which their dinner depended;
and the prehistoric equivalent of “What beastly
weather!” was probably accompanied by a significant
tightening of the belt.
Certain it is that in very early times people gave
a great deal of attention to the weather and
acquired a fund of wisdom on the subject which,
along with a certain amount of superstitious unwisdom,
has come down to us in the shape of weather
proverbs. Many of these proverbs undoubtedly originated
before the dawn of history, for they are found
in substantially the same form among widely scattered
races of mankind. Various popular weather
prognostics familiar at the present day are mentioned
in such ancient documents as the Vedas, the
Bible, and the cuneiform tablets from the library
of Assurbanipal.
Speculations about the weather occupy much
space in the writings of the Greek philosophers, and
a formal treatise on meteorology, written by Aristotle
(fourth century B. C.), remained the standard
work on this subject for two thousand years. More
or less systematic weather records were kept by the
Greeks long before the Christian era, and they produced
a number of almanacs, in the shape of marble
tablets, showing the average winds and weather for68
particular dates throughout the year. A copious
collection of the weather indications found in both
Greek and Roman almanacs, dating back to the fifth
century B. C., has been made by Dr. Gustav
Hellmann.
Some of the meteorological instruments used today
have a very respectable antiquity. Ancient
statistics of the rainfall of India, recently brought
to light, show that some sort of rain gauge must
have been in use in that country in the fourth century
before our era. Measurements of rainfall were
made in Palestine in the first century A. D. The
only other meteorological instrument dating back
to classical antiquity, so far as known, is the
weather vane. The Tower of the Winds, at Athens,
built about a century before the Christian era, originally
bore at its summit a vane in the shape of a
bronze Triton, holding in his hand a wand, which
was designed to point at one or another of the eight
symbolical figures of the principal winds surrounding
the octagonal tower, thus showing which way
the wind was blowing at the time. The Roman
writer Varro has left us a description of a vane
that could be read indoors by means of a dial on
the ceiling.
Instrumental weather observations did not become
the rule, however, until the end of the seventeenth
century, when the use of thermometers,
hygrometers, barometers, and rain gauges began in
Italy and spread rapidly to other countries. The
origin of each of these instruments is commonly
ascribed to a particular inventor—the thermometer
to Galileo, the barometer to Torricelli, etc.—but the
truth is that the idea of the instrument was, in each
case, a slow growth, to which many minds contributed.69
Thus a form of thermoscope—a device for
showing but not for measuring the expansion and
contraction of air with changes of temperature—was
described by Philo of Byzantium in the third
century B. C. Galileo supplied such an instrument
with a scale, but without fixed points, thus converting
it into a crude thermometer, but it was not until
half a century later that the Grand Duke Ferdinand
II of Tuscany introduced the idea of filling the thermometer
with alcohol, in place of air, and sealing it
so that it was not affected by changes in barometric
pressure. The thermometric scale now used in English-speaking
countries, which bears the name of
Fahrenheit, appears to have been devised by the
Danish astronomer Ole Römer, from whom Fahrenheit
borrowed it. In short, any brief account of the
invention of the principal meteorological instruments
necessarily ignores the just claims of many
inventors; to say nothing of the fact that what is
written on the subject to-day is likely to be refuted
to-morrow by the discovery of some forgotten book
or manuscript.
We are on safer ground in saying that the plan of
measuring the weather, instead of merely observing
it, became general early in the eighteenth century;
and that about the middle of the nineteenth century
the further improvement was introduced of making
meteorological instruments trace their own records,
so that the human observer was, to a great
extent, dispensed with. Self-registering instruments
are now the rule at important meteorological
observatories and stations, though they do not, even
yet, record all the elements of weather, and at a host
of minor stations none of them have yet replaced
the eye of the observer.
70
Now let us see what things go to make up the
weather, and how these things are observed by the
modern meteorologist.
The pressure of the atmosphere, if not exactly a
part of the weather, is so intimately associated with
it that we cannot exclude it from our list
of weather phenomena. Atmospheric
pressure is measured with the barometer,
and the importance of this instrument
as a key to weather changes is fully recognized—and
indeed overrated—by the
layman, who sometimes calls it the
“weather glass.”
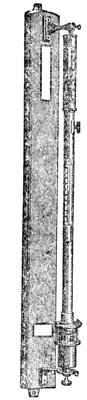
MERCURIAL BAROMETER
(Fortin type)
Until recently all British and American
barometers were read in inches and
all others in millimeters. Since atmospheric
pressure is a force, the practice
of measuring it in units of length is
rather like measuring time in bushels or
potatoes in hours. The inconsistency is
serious from a scientific point of view,
because it divorces barometric measurements
from other physical measurements,
in which pressures are measured
in units that have nothing to do with
length; viz., dynes per square centimeter.
Accordingly, some of the leading meteorological
services of the world have lately adopted
a new unit of barometric pressure, known as the bar,
which is equivalent to 1,000,000 dynes per square
centimeter. It is subdivided according to the ordinary
metric notation, and its most commonly used
subdivision is the millibar, equivalent to 0.03 inch
on the old-fashioned barometer scale, under standard
conditions.
71
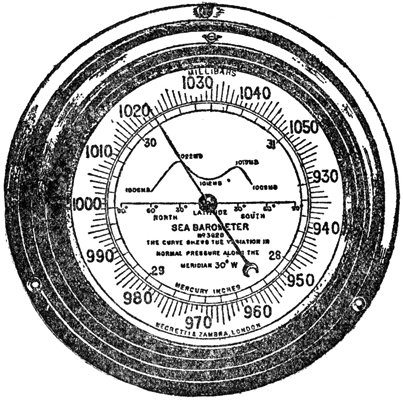
ANEROID BAROMETER, GRADUATED IN MILLIBARS
AND INCHES
For the benefit of sailors a curve is shown indicating the mean annual
pressure in different latitudes along the meridian of 30° W. (Courtesy
of the British Meteorological Office.)
The mercurial barometer is so delicate and cumbersome
that for many practical purposes it is replaced
by the more convenient though less accurate
aneroid barometer. A self-recording barometer
(usually an aneroid) is called a barograph. In its
ordinary form, this instrument carries a pen, which
traces a continuous record of the barometric pressure
on a strip of paper wound around a cylinder
turned by clockwork. Generally the instrument runs
for a week before the paper has to be changed. The
barograph is a very instructive instrument, because
it shows, not only the pressure, but also the changes
of pressure—i. e., just how fast the barometer is
rising or falling, or, as meteorologists say, the “barometric72
tendency.” The way in which barometric
changes are related to weather will appear in a later
part of this book.
The mercurial barometer consists of a glass tube,
sealed at its upper end and having at its lower end
a “cistern,” which is open to the air. The tube is
filled with mercury at its open end, and then inverted
over the cistern, and the mercury descends until
the weight of the portion standing above the level
of the mercury in the cistern just balances the
pressure of the air on an area equal to the cross
section of the tube. The height of the mercurial
column is read from a graduated scale attached to
the tube. Certain corrections are applied to the
reading, in order to eliminate variations due to
temperature, etc., and, if to be entered on a weather
map, the reading is reduced to sea-level value. In
the aneroid barometer, a thin-walled metal box, exhausted
of air, undergoes changes of shape in response
to changes in atmospheric pressure. The
movements of the box are communicated by levers
to a pointer moving around a dial (or to the recording
pen, in the barograph).
Since the pressure of the atmosphere diminishes
with increasing altitude at a fairly definite rate, the
barometer is used for measuring heights. Sometimes
it is graduated directly, for this purpose, in
feet or meters, and it is then called an altimeter.
Among the meteorological elements that unmistakably
pertain to weather the most important is the
temperature of the air. The thermometer, with
which temperature is measured, is, in its common
form and in its essential features, too familiar to
require description here; but we may remark that,
as in the case of the barometer, several methods of73
graduating this instrument have been used. Besides
numerous obsolete systems, there are three
different thermometric scales—the Fahrenheit, the
Centigrade, and the Absolute. The first is still the
prevailing one in English-speaking countries, and
the second prevails in all other countries. The Absolute
scale, long familiar to physicists, has recently
come into somewhat limited use in meteorology. It
starts at the “absolute zero”—the temperature of a
body totally devoid of heat. This temperature has
been nearly attained in laboratory experiments with
liquid helium. One advantage that the Absolute
scale possesses over the others is that it has no
below-zero readings. Such readings are a source of
occasional errors when temperature is recorded on
the Fahrenheit or the Centigrade scale.
The freezing point of water is 32° Fahrenheit =
0° Centigrade = 273° Absolute. The boiling point
of water, at sea level, is 212° Fahrenheit = 100°
Centigrade = 373° Absolute.
While the layman is well acquainted with the
thermometer, he sometimes fails to understand certain
differences between the scientific and unscientific
methods of using this instrument for weather-measuring
purposes. On a hot summer day he is,
perhaps, inclined to feel aggrieved because the
official record of temperature does not adequately
express the state of his feelings, to say nothing of
being at odds with the impressive instrument displayed
at the corner drug store. Hence the following
explanation is in order:
It is the function of the official thermometer to
indicate the true temperature of the air. A thermometer
exposed to direct sunshine records its own
temperature—i. e., the temperature of the glass and74
mercury—and nothing else. A thermometer “in the
shade”—under a tree, for example—comes nearer
to showing the true air temperature; but it is exposed
to radiation from surrounding objects and its
readings will vary with the nature and location of
these objects. The meteorological thermometer is
nearly always installed in a kind of latticed screen,
or shelter. It is thus largely protected from radiation,
while the air circulates freely around it. Only
when thermometers are exposed under such standard
conditions is it possible to obtain comparable
readings of the temperature at different places, so
that, for instance, maps may be drawn showing the
distribution of this element over a country. The
best location for the thermometer screen is a few
feet above sod. Many thermometers of the United
States Weather Bureau are installed on the roofs
of tall buildings; not because this is an ideal location,
but because no better is available in the heart
of a large city, where, for practical reasons, the
office has to be placed. In many small towns the site
of the station is such that the thermometer screen
(or “instrument shelter,” as it is called in the
Weather Bureau) can be placed close to the ground,
and at the same time get ample ventilation and be
free from the radiation of buildings. In certain
large cities the Bureau maintains a branch station in
a park or in the suburbs, where a satisfactory exposure
for all instruments can be secured.
The artificial temperature of a city street is too
local and indefinite a thing to be inscribed on
weather maps, utilized by the forecaster, or embodied
in climatic statistics. As a concession, however,
to the demand of the “man in the street” for a
record of conditions prevailing in his own sphere,75
the Weather Bureau has installed in several cities
little pavilions in which working meteorological instruments
are displayed for the benefit of the public.
The thermometers in these so-called “kiosks”—which
are modeled, with improvements, after the
weather pavilions found at European health resorts—always
read several degrees higher in hot weather
than the thermometer at the regular Weather
Bureau station in the same vicinity. Such records
are erratic, at best, and present indications are that
the kiosks will eventually be abolished.
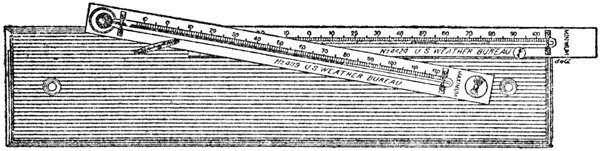
MAXIMUM AND MINIMUM THERMOMETERS
Besides the ordinary thermometer, there are instruments
that answer the questions “How hot was
it to-day?” and “How cold was it last night?” These
are known, respectively, as the maximum and the
minimum thermometer. They hang almost horizontally
in the screen. The former has a constriction
just above the bulb, which prevents the mercury
from retreating after it has reached the highest
reading for the day. It can be reset by whirling it
on a pivot. The minimum thermometer is filled with
spirit instead of mercury. A little index inside the
column is carried toward the bulb by the surface of
the alcohol as the temperature falls. When the temperature
rises the index remains behind, marking
the lowest point reached. The highest and lowest
temperature of the day, as well as the temperature76
at any moment of the day, can be read from the
thermograph, or self-registering thermometer. In
the commonest type of thermograph changes of temperature
alter the curvature of a flexible metal tube
filled with spirit, and the movements of the free end
of the tube are communicated by levers to a recording
pen.
On an average day, in our climates, the air is coldest
about sunrise. The appearance of the sun checks
the atmospheric cooling due to the loss of heat from
the earth that has been going on through the
night, and the air begins to warm up. As long
as the amount of incoming heat from the sun is
greater than the amount of outgoing heat from
the earth, the temperature will continue to rise.
After noon, when the sun is highest, the supply
of solar heat diminishes, but it is still greater,
for a time, than the heat loss from the earth, and
for this reason the temperature, as a rule, keeps
on rising until some time toward the middle of
the afternoon, when the maximum temperature of
the day occurs.
Humidity is an element of weather that is more
often talked about than understood. Atmospheric
humidity is the state of the atmosphere with respect
to the amount of moisture it contains in a gaseous
form, not in the form of a liquid. This gaseous
moisture is called water vapor, and it is not directly
perceptible to the senses, as liquid water is. As we
have explained elsewhere, the capacity of the air
for water vapor increases with the temperature.
The actual amount present at any time, per unit
volume, is called the absolute humidity, and the ratio
of this amount to the maximum amount the air can
hold at the same temperature is called the relative77
humidity. The latter is generally expressed in
percentage. When the air is charged to its full
capacity with aqueous vapor its relative humidity
is 100 per cent.
The relative humidity usually varies greatly
through the day, being generally lowest when the
temperature is highest, and vice versa. It is an element
of much practical interest, because it is one
of the main factors in determining the drying power
of the air, the other important one being wind.
The air feels dry when evaporation proceeds rapidly
from our skin, either on account of low relative
humidity, brisk air movement, or both. People are
hardly conscious of high relative humidity except
when, in hot weather, it retards the evaporation of
perspiration, and the latter collects in liquid form
on the skin.
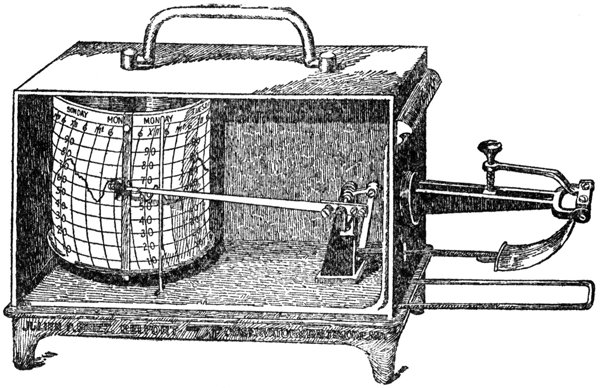
THERMOGRAPH
Relative humidity does not owe its importance in
human affairs solely to its physiological effects, for78
it plays a prominent part in numerous industries—textile,
metallurgical, chemical, leather, food, and
all those employing drying processes. In the spinning
of cotton and wool, for example, the humidity
of the workroom greatly affects the weight of the
material, the size of the yarn, and the length and
flexibility of the fibers. Humidity must likewise be
taken into account in such diverse industries as
manufacturing candy, bread, high explosives and
photographic films, drying macaroni and tobacco,
and operating blast furnaces. There are engineers
who specialize in the business of installing “humidifying”
and “dehumidifying” systems in workshops,
and also, for hygienic purposes, in schoolhouses and
other public buildings.
The absolute humidity, the relative humidity and
the dew point (the temperature to which the air
must be brought to start condensation of its moisture)
are all determined by means of instruments
called hygrometers. The hair hygrometer depends
for its action upon the fact that a hair, freed from
oil, not only absorbs moisture from the atmosphere,
but elongates when damp and contracts when dry.
The instrument, which includes a single human hair
or a bundle of such hairs, is so designed that these
changes move an index over a graduated scale. This
and other types of hygrometer can be arranged to
record their own readings continuously, constituting
a hygrograph.
The form of hygrometer most commonly met with
at meteorological stations is called a psychrometer.
This usually consists of a pair of mercurial
thermometers, one of which, known as the “wet-bulb
thermometer,” has its bulb wrapped in thin
muslin. The other, called the “dry-bulb,” is an79
ordinary thermometer. The muslin is moistened,
either just before making a reading, or continuously
with a wick. In the former case the
thermometer is generally whirled several times before
the reading is taken. Unless the air is saturated,
the wet bulb is cooled by evaporation, and
the difference between the readings of the two instruments
enables the observer, with the aid of
suitable tables, to obtain the absolute and relative
humidity and the dew point. The most accurate results
are obtained from the aspiration psychrometer,
of Assmann, in which air is drawn past the bulb of
the thermometer by a small fan, driven by clockwork.
Deposits of liquid and frozen water from the
atmosphere, in their various forms, are known collectively
as “precipitation,” and in the aggregate
they constitute a feature of the weather hardly less
important than temperature. Indeed an average
rainstorm or snowstorm is a more obtrusive event
than any other equally common manifestation of the
weather; while an excess of precipitation or a prolonged
lack of it, constituting a drought, may be as
serious in its consequences as a “hot wave” or a
“freeze.”
Precipitation—familiarly called “rainfall”—is
much more extensively measured than any other
meteorological element, for there are, throughout the
world, a vast number of places at which this is the
only feature of the weather that is regularly observed.
In Europe alone there are about 19,000
“rainfall stations.” Rainfall is measured in depth;
viz., in inches or millimeters. A moderate shower
of several hours’ duration will yield an inch or two
of rain, while in extreme cases several inches may
fall in an hour. Snow is sometimes measured as80
such—i. e., the actual depth that falls, or, more commonly,
the amount lying on the ground from day to
day—but in order that records of snowfall may be
combined with those of rainfall for the purpose of
determining the total precipitation, the snowfall
must be reduced to its “water equivalent,” either by
melting the snow before measurement or by estimating
this equivalent or by weighing the snow
caught in a receiver of known area and computing
the corresponding depth of water.
There are many kinds of rain gauge. As a rule
the gauge has a funnel-shaped receiver with a small
opening through which the water flows into the
lower part of the gauge; loss of the accumulated
water by evaporation is thus checked. There is
usually some device for magnifying the depth of
rainfall in order to facilitate measurement. In
American gauges the rain flows into an inner tube
having one-tenth the horizontal area of the receiver,
and its depth is thus magnified ten times. A measurement
is made by thrusting a graduated wooden
stick to the bottom of the tube and noting the height
to which the stick is wetted.
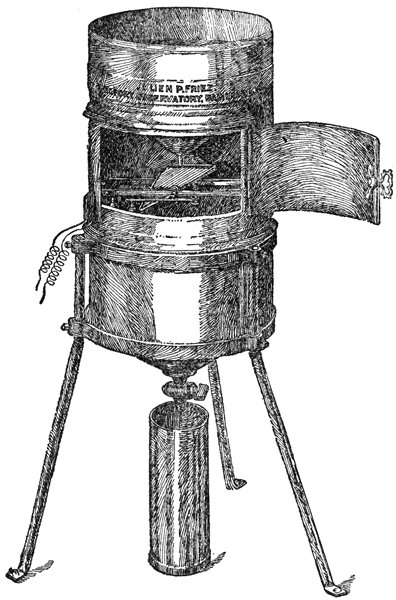
TIPPING-BUCKET RAIN GAUGE
Of devices for obtaining an automatic record of
rainfall, the tipping bucket (or, as the British call
it, the “tilting bucket”) is probably the most serviceable,
and it is the one most widely used in this country.
This instrument is as simple as it is ingenious.
The “bucket” is a little metal trough, pivoted in the
middle, so that it can tilt back and forth, seesaw-fashion.
It is divided into two compartments by a
central partition. Rain falling into the funnel-shaped
receiver at the top of the gauge flows into
whichever compartment of the bucket is uppermost,
until the weight of the water causes the bucket to81
tip, thus emptying one compartment and presenting
the other to the incoming stream. When the second
compartment is filled, the bucket tips in the opposite82
direction. The parts of the gauge are of such
dimensions that each tip of the bucket corresponds
to 0.01 inch of rainfall. The gauge is connected
electrically with registering apparatus indoors, so
that every tip of the bucket is recorded. The registration
sheet shows the time of occurrence as well as
the amount of rainfall.
The two most important things about the wind
that are observed and recorded by meteorologists
are its direction and its force. It is the universal
custom to regard as “the direction of the wind” the
direction from which, rather than toward which, it
blows. Moreover, it is only the horizontal direction
of the wind that is ordinarily observed, though many
winds have a considerable upward or downward
slant, and, locally, a wind may even blow straight up
or straight down. The direction of the wind may be
observed in several makeshift ways, such as by
watching the drift of smoke from chimneys, or, as
sailors do, holding up a wet finger to the breeze. Instrumentally
and scientifically it is observed with a
special type of vane, much more accurate in its indications
than the weather vanes and weather
cocks of ornamental and symbolical architecture.
The nonscientific vane, once set in motion, is likely
to be carried too far by its own momentum, and may
even spin completely around under a sudden impulse.
In the scientific vane this tendency is restrained by
means of a spread tail; the pressure of the wind on
the diverging blades serving to hold the vane in the
correct position. The vane, like most other meteorological
instruments, is self-recording at all important
meteorological stations. The type used by
the Weather Bureau registers the direction of the
wind every minute.
83
The force of the wind is obtained from an
anemometer. Most anemometers do not, however,
show this directly, but are designed to measure the
speed or so-called “velocity” of the wind, from which
its force may be computed. The speed is observed
in miles per hour or meters per second. In considering
some of the possible effects of wind it is well to
bear in mind that its force increases as the square
of the velocity. This means, for example, that a
wind of 20 miles an hour is four times as strong,
and one of 30 miles an hour nine times as strong as
a wind of 10 miles an hour.
One of the external features of a weather station
that invariably attracts the attention of the
passer-by is an instrument consisting of four hemispherical
cups revolving horizontally in the wind.
This scientific whirligig is the Robinson cup anemometer,
which, in spite of its shortcomings, is
the most widely used instrument of its class
throughout the world. As generally constructed,
the cups are supposed to turn 500 times for a
mile of wind movement. Actually the relation
between the speed of the cups and the speed of
the wind is somewhat variable, and at high
velocities the indications of the instrument are
seriously erroneous. The Robinson anemometer
has a dial from which direct readings can be
made, but at large stations it is connected electrically
with a registering device in the observer’s
office, which makes a mark for each mile of wind
and shows how the speed of the wind varies
through the day.
There are many other types of anemometer, and
some of them tell a much more detailed story of the
wind’s variations than does the Robinson instrument.84
On the other hand, thousands of weather observers
dispense with anemometers altogether and
merely estimate the strength of the wind from its
effects. This applies to nearly all observers at sea,
and, in Europe, to the vast majority of observers on
land. Such estimates are recorded on a scale ranging
from zero, for a calm, generally up to ten or
twelve for the strongest winds ever experienced.
Several different scales are in use. The best known
is the Beaufort Scale, devised by Admiral Sir F.
Beaufort, in 1805. The following table of the Beaufort
Scale, as adapted for use on land, is from the
“Observer’s Handbook” of the British Meteorological
Office:
Beaufort
number |
Explanatory
titles |
Specification of Beaufort Scale for use on land based on observations made at land stations |
Equivalent speed in miles per hour at 33 feet |
| 0 |
Calm |
Calm; smoke rises vertically |
0 |
| 1 |
Light air |
Direction of wind shown by smoke drift, but not by wind vanes |
2 |
| 2 |
Slight breeze |
Wind felt on face; leaves rustle; ordinary vane moved by wind |
5 |
| 3 |
Gentle breeze |
Leaves and small twigs in constant motion wind extends light flag |
10 |
| 4 |
Moderate breeze |
Raises dust and loose paper; small branches are moved |
15 |
| 5 |
Fresh breeze |
Small trees in leaf begin to sway; crested wavelets form on inland waters |
21 |
| 6 |
Strong breeze |
Large branches in motion; whistling heard in telegraph wires; umbrellas used with difficulty |
27 |
| 7 |
High wind |
Whole trees in motion; inconvenience felt when walking against wind |
35 |
| 8 |
Gale |
Breaks twigs off trees; generally impedes progress |
42 |
| 9 |
Strong gale |
Slight structural damage occurs (chimney pots and slates removed) |
50 |
| 10 |
Whole gale |
Seldom experienced inland; trees uprooted; considerable structural damage occurs |
59 |
| 11 |
Storm |
Very rarely experienced; accompanied by widespread damage |
68 |
| 12 |
Hurricane |
|
Above 75 |
85
The clouds receive more attention at some weather
stations than at others. A routine observation consists
of noting the kinds of clouds visible, the direction
or directions from which they are moving, and
the degree of cloudiness—i. e., the extent to which
the sky is clouded, stated in tenths, from O = cloudless,
to 10 = completely overcast. At many of the86
more important stations the movements of clouds
are observed with a nephoscope. The reflecting
nephoscope, used in this country, consists of a
black mirror in which the image of the moving
cloud is watched, the direction of its motion being
read off from the graduated circular frame of
the mirror. There is also a device for measuring
the apparent speed of the cloud. From this the
actual speed can be calculated if the height of
the cloud is known. There are other nephoscopes,
such as Besson’s in which the cloud’s movements are
watched directly, and not by reflection.
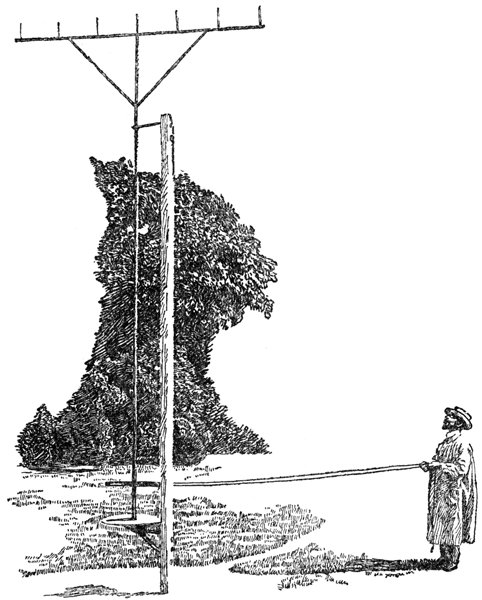
BESSON’S COMB NEPHOSCOPE
The importance of sunshine among the elements of
weather and climate is evidenced by the fact that
at least two States of the Union, South Dakota
and California, contend for the title of “the Sunshine
State”—which does not properly belong to
either of them. Arizona is the sunniest State of
all, and the whole Southwest is sunnier than
South Dakota.
Devices for registering the duration of sunshine
are called sunshine recorders. One type (the Campbell-Stokes)
works on the burning-glass principle;
in others the sun’s rays trace a record on photographic
paper. The instrument used by the Weather
Bureau consists of an air thermometer having a
bulb at each end, one bulb being coated with lampblack.
There is a small column of mercury between
the two inclosed masses of air. The thermometer is
inclosed in a sheath of glass, from which the air
is exhausted. When the sun shines on this instrument,
the air in the black bulb warms and expands,
and the mercury is forced toward the other bulb
until it comes in contact with a pair of electrodes,
thus closing an electrical circuit. While the87
circuit is closed, the registering apparatus connected
with the instrument makes a step-shaped
mark once every minute. When the sun stops
shining, the mercury drops back, the circuit is
broken, and the recording pen merely traces a
straight line.
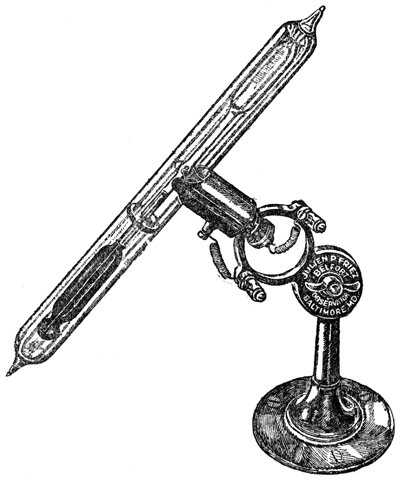
ELECTRICAL SUNSHINE RECORDER
At the larger stations of the United States Weather
Bureau the direction and speed of the wind, the rainfall
and the duration of sunshine are all recorded
on a single sheet of paper, wound around a large88
cylinder, which is turned by clockwork. The paper
is ruled with lines to denote the hours and minutes
of the day, and a fresh sheet is put on the cylinder
every day at noon. This complex registering device,
sometimes called in book language a meteorograph,
but colloquially referred to by weather men as the
“triple register,” is entitled to high rank among
labor-saving machines; for, with hardly any attention,
except for a few minutes at noon, it does the
work of a staff of trained meteorologists on duty day
and night.
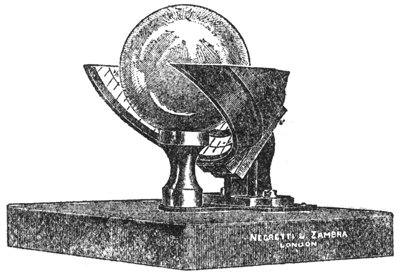
BRITISH TYPE OF SUNSHINE RECORDER
(Campbell-Stokes Pattern)
We have now enumerated the elements of weather
most commonly observed at meteorological stations,
and the principal types of meteorological instruments,
with special reference to those used in the
United States. In nearly every civilized country
there are certain stations at which regular observations
are maintained of a number of phenomena not
mentioned in the foregoing paragraphs, such as the
intensity of solar radiation (measured with the
pyrheliometer), evaporation (measured with atmometers89
or evaporimeters), and the temperature
of the soil; and the number of stations is rapidly
growing at which the winds and weather far aloft
in the atmosphere are observed by means of kites
and balloons. Meteorologists of the Old World use
a great many types of apparatus that are rarely seen
in this country, and some of our instruments are but
little known abroad.
90
CHAPTER VI
CLOUDLAND
One of the things a tea kettle is good for is to provide,
by means of the little cloud seen at its nozzle
and erroneously called “steam,” an example of what
happens when the invisible gas that is truly steam,
or water vapor, is cooled below its dew point in the
free air. This cloud has, however, been the starting
point of a vast number of halfway explanations. A
generation or so ago physicists were content to say
that aqueous vapor turns to drops of water in the
air merely on account of being cooled. The question
of how the drops get their start, or why the moisture
forms drops at all, does not seem to have troubled
them.
One way in which air or any other gas is cooled
is by expanding against pressure. Some of the energy
in the gas, originally manifesting itself as heat,
is applied to the work of expansion, and thus
ceases to be heat. Hence the temperature of the
gas falls. Conversely, if a mass of gas is compressed,
the mere process of compression raises its
temperature. The heat produced in pumping up a
bicycle tire is the classic example of the latter fact.
Heating by compression and cooling by expansion
are called, respectively, “dynamic heating” and
“dynamic cooling.” The processes thus described are
of the utmost importance in meteorology.
91
If air of average humidity is admitted to the receiver
of an air pump in the usual way and suddenly
expanded by partial exhaustion, a cloud of moisture
is seen to form in the receiver. This moisture is
condensed and made visible by the dynamic cooling
of the air. If, however, after the receiver is exhausted
air of the same humidity as before is admitted
through a filter of cotton wool, and is then
similarly cooled by expansion, no cloud will form.
Evidently the filter has removed from the air something
that is essential to the process of condensation.
Perhaps it will occur to the reader that, in some
obscure way, the filter has prevented water vapor
itself from entering the receiver. There are several
methods by which we can ascertain whether
such is the case. One of the simplest is to admit a
little smoke to the receiver before expanding the filtered
air. In this case the cloud does form, showing
that moisture is present, and also showing that
smoke, though a perfectly dry substance, aids the
formation of the water drops.
Such experiments have led to the conclusion, now
universally admitted, that when water drops form
in the atmosphere they always form around “nuclei”
of something that is not water. These nuclei are
often referred to as “dust particles,” but it is recognized
that a vast proportion of them are very much
more minute than the dust that worries housewives.
They are largely beyond the power of the microscope,
and some of them, indeed, appear to be of molecular
size, consisting of molecules of hygroscopic gases,
such as the oxides of sulphur and of nitrogen.
Another important fact about water drops in the
atmosphere has come to light within the last half
century. Since water is much heavier than air,92
meteorologists of an earlier generation were puzzled
by the fact that the drops in clouds apparently
float, instead of falling to the ground. In the attempt
to account for this supposed floating, bygone
authorities assumed that the drops were hollow
“vesicles,” like little bubbles. This assumption was
eventually disproved by the optical phenomena exhibited
by the drops, as well as on other physical
grounds. Moreover, it is now known that a cloud
never really floats, though the rate at which its constituent
particles fall with respect to the air is generally
very small, on account of the resistance
they encounter. Thus a very slight upward current
usually suffices to maintain the altitude of a cloud,
or even to increase it. The speed with which a drop
falls increases with its size. Hence large drops may
fall rapidly from great heights all the way to the
ground, constituting rain; but in a great many cases
such drops evaporate on falling into warmer air
below the cloud level, and thus the lower surface of
the visible cloud remains at about a constant height.
The drops in clouds and fog have often been measured,
either by noting their optical effects or by
microscopic examination. Many are found to be
from 0.0006 to 0.0008 inch in diameter. The speed
with which such drops fall through still air can be
calculated. A drop 0.0008 inch in diameter falls at
the rate of about half an inch a second, or 150 feet
an hour. Even if a cloud consisting of such drops
preserved its integrity for an hour or more while
sinking, its descent at this slow rate would hardly
be perceptible from the ground.
Some clouds consist of ice needles or tiny snowflakes.
Apparently these icy particles are produced
directly in solid form, without passing through the93
liquid stage. It is supposed that, like drops, they
require nuclei on which to condense, but this matter
has not been fully investigated. Another point that
awaits elucidation is the fact that the clouds that
form in air much below the freezing point sometimes
consist of water and sometimes of ice. The common
fleecy clouds of our winter skies are composed of
water drops, and such clouds also occur in the polar
regions. Dr. G. C. Simpson, when serving as
meteorologist of Scott’s antarctic expedition, observed
fog consisting of liquid water at a temperature
of 29° below zero, Fahrenheit. Why such
greatly “undercooled” drops should sometimes occur
in the atmosphere when at other times, with higher
temperatures, atmospheric moisture takes the form
of ice is not at all clear.
There are several ways in which the free air may
be cooled to the point at which condensation occurs.
The commonest is dynamic cooling, due to the rise of
a mass of moist air and its expansion under the reduced
pressure that prevails at the higher levels.
This process is beautifully illustrated in the formation
of the roundish masses of fleecy cloud known
as cumulus, on a warm summer day. Each of these
clouds marks the summit of a column of air that is
rising after having been heated at the surface of
the earth. When the process goes on very actively,
the cloud may tower up to enormous heights, forming
a thundercloud. Some clouds are formed by the
mixing of air of different temperatures. Fog, which
is merely cloud at the surface of the earth, is often
formed by the cooling of the air in contact with cold
land or water. The persistent fogs of the Newfoundland
Banks are due to the passage of warm
moist air from the Gulf Stream region over the94
cold Labrador Current. On the other hand, a cold
wind blowing over warm water will also often produce
a fog by lowering the temperature of the moist
air overlying the water. A common cause of land
fog is the cooling of the air adjacent to the ground
in consequence of nocturnal radiation. The moister
the air, the more readily fog forms, and hence the
frequent formation of fog by night along rivers
and over marshes and damp valleys.
Town fogs, such as the famous “London particular”
and the fogs of Lyons, usually consist partly
of smoke. Dense fogs of this sort occur when the
conditions of the atmosphere are such as to cause
the smoke to hang low over the city, instead of being
dispersed. These fogs constitute a serious economic
problem. Thus it is estimated that they cost the
people of London upwards of half a million dollars
a year, due to extra lighting, damage to vehicles, loss
of business, etc. Since marine fog is also a source
of enormous loss, through causing delays and accidents,
and since fog along air routes is the greatest
of all obstacles to successful aerial navigation, it is
no wonder that much ingenuity has been devoted to
the attempt to disperse fog artificially. Electric discharges
have been successfully used for this purpose
on a small scale.
The depth of a fog may be anything from inches
to miles. Measurements made by the United States
Coast Guard during the international ice patrol of
the North Atlantic show that the fogs on the Newfoundland
Banks are very commonly so shallow that
the mastheads of vessels rise above them, though in
some cases they were found, from observations with
kites, to be from 2,500 to 3,000 feet thick. Observations
on the mountains of the California coast show95
that the upper level of fog in that region rarely exceeds
4,000 feet. On the other hand, aviators flying
between London and Paris have encountered fog
more than 10,000 feet deep.
The United States Weather Bureau classifies a fog
as “dense” if it hides objects at a distance of 1,000
feet; otherwise it is described as “light.” British
meteorologists record fogs on a scale of five degrees.
During the ice patrol of the Seneca in 1915
samples of foggy air were examined for the purpose
of calculating the amount of water and the number
of drops they contained per unit volume, as well as
the size of the drops. A block of dense fog 3 feet
wide, 6 feet high, and 100 feet long was found to contain
less than one-seventh of a glassful of water, distributed
in 60,000,000,000 drops. During the densest
fog of the voyage the diameter of the fog particles
averaged 0.0004 inch; just about the limit of visibility
with the naked eye.
In spite of the extremely attenuated state of the
water in fogs, as indicated by these figures, the
moisture they deposit on terrestrial objects is great
enough to be of considerable agricultural importance
in some parts of the world. Thus along the coast
of Peru, where the rainfall is negligible (though not,
as often stated, nonexistent), a wet fog known as
the “garúa” suffices to maintain a luxuriant vegetation
during several months of each year.
There are frozen fogs as well as frozen clouds.
The “frost smoke” that rises over the Norwegian
fjords and over ice-free spots in the polar seas is
generally composed of icy particles or snowflakes.
An ice fog that sometimes forms in mountain valleys
in the western United States is known as the
“pogonip”—a name derived from the Shoshonean96
language. This fog often appears very suddenly,
even in the brightest weather. The minute needles
of ice of which it consists are said to be extremely
injurious to the lungs. There are tales of a whole
tribe of Indians perishing from its effects. Whatever
truth there may be in such stories, it is greatly
dreaded by both the Indians and the whites. The
mountains of Nevada appear to be the favorite home
of the pogonip.
What meteorologists call “dry fog” is a haze of
dust or smoke, sometimes very dense. We have
already described the prevalence of this turbid state
of the atmosphere following volcanic eruptions, the
burning of forests and moors, and desert dust
storms. Under the head of dry fog many writers include
a sort of heat haze, which does not necessarily
involve the suspension of either solid or liquid
matter in the air, but is due to the mixing of
local air currents of different densities, especially
when evaporation is proceeding rapidly from moist
ground under strong sunshine. The callina of
Spain and the qobar of the upper Nile region
are probably due partly to this cause, and partly
to dust.
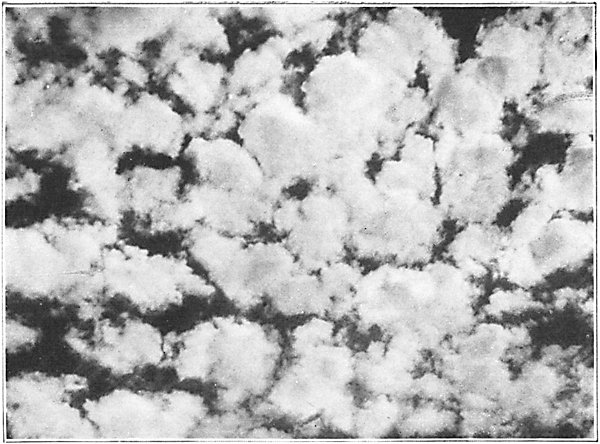
Alto-Cumulus Clouds. These clouds always occur in roundish
fleecy masses or in elongated fleecy rolls, with blue sky between. A
score of different types have been distinguished and named by certain
cloud specialists. (Photographed by A. J. Weed.)

Cumulus. Cloud photography has become a special branch of photographic
art, entailing not only the use of appropriate lenses and
plates, but also of ray filters, or other special devices for sharpening
the contrast between the cloud and the blue sky. Mr. Ellerman’s
pictures, made on Mt. Wilson and elsewhere in California, stand in
the front rank. (Photographed by F. Ellerman.)
One more species of fog requires mention here,
viz., the dirty, foul-smelling “painter” of the Peruvian
coast, which deposits on vessels lying in the
harbor of Callao and elsewhere a slimy brown substance
known as “Peruvian paint.” This substance
comes from the ocean and is probably due to the
decomposition of marine organisms. The “painter”
prevails during the months December to April.
According to a plausible hypothesis a change in
the temperature of the water at that season, resulting
from a periodical shift of ocean currents,97
kills vast quantities of plankton, the decay of which
would give rise to the phenomena observed.

Mammato-Cumulus. A rather rare cloud form, associated with thunderstorms
and tornadoes. It is known in Scotland as the “pocky”
(i. e. baggy) cloud and in parts of England as “rain balls.” (Photographed
by L. C. Twyford.)
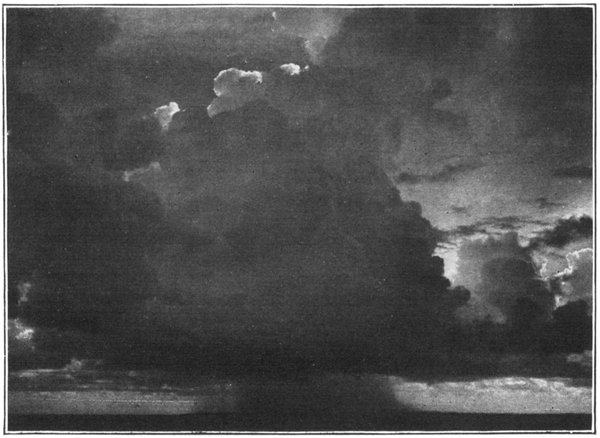
Cumulo-Nimbus. This is the thundercloud. (Courtesy of the Naval
Air Service.)
Clouds, though they are nothing more than masses
of fog situated at some distance from the earth, are
susceptible of a classification, according to shape and
texture, that is not applicable to fog. Among the
billions of human beings who, in all ages, have
amused themselves by discovering pictures in the
clouds it would be remarkable if a good many had
not, from time to time, conceived the idea of reducing
these pictures to a few general types. According
to a note published a few years ago in the
“Quarterly Journal” of the Royal Meteorological
Society, there is some reason to believe that an
elaborate classification of the clouds was in use
among the ancient Hindus. A passage quoted from
an Indian work of the fourth century B. C. says:
“Three are the clouds that continuously rain for
seven days; eighty are they that pour minute drops;
and sixty are they that appear with the sunshine.”
In the occidental world, however, we have no record
of any attempt to classify the clouds prior to the
year 1801, when the following classification was proposed
by the French naturalist Lamarck:
- Nuages en balayures (cloud sweepings),
- Nuages en barres (clouds in bars),
- Nuages pommelés (dappled clouds),
- Nuages groupés (grouped or piled clouds),
- Nuages en voile (veil clouds),
- Nuages attroupés ou moutonnés (clouds in flocks).
In 1803 the English meteorologist Luke Howard
published the system of classification that, with some
additions and modifications, is now in general use.
This system is based upon three fundamental forms;
viz., fibrous or feathery clouds (cirrus), clouds with98
rounded tops (cumulus), and clouds arranged in
horizontal sheets or layers (stratus). Intermediate
forms are described by compounding the names of
the primary types; e. g., cirro-cumulus, cirro-stratus,
etc. The rain cloud is called nimbus. Howard’s
classification was quickly adopted in all countries.
His definitions were translated into German by no
less a personage than Goethe, who, in his enthusiasm
over Howard’s achievement, wrote a poem about it,
and also a separate poem about each of the principal
types of cloud!
The Latin names that Howard gave to the clouds
made his system immediately available for international
use; and in nearly all of the many systems of
cloud nomenclature that have since been proposed
the excellent plan of using Latin names has been
preserved. Very soon, however, after Howard’s
classification appeared, a list of proposed English
equivalents of his names was published in the “Encyclopædia
Britannica”—which, nevertheless, did
not change its name to “British Encyclopædia”—for
the benefit of the unlettered majority, supposed
to be incapable of using a few Latin terms that were,
in fact, shorter and no more difficult to pronounce
than their suggested English substitutes! A piquant
sequel to this episode is that these superfluous English
cloud names, “curl cloud,” “stackencloud,” “fall
cloud,” “sondercloud,” “wane cloud,” and “twain
cloud,” still survive in the dictionaries—and nowhere
else. They are practically unknown to meteorologists,
and were never adopted generally by the laity.
Of course some English names, which have been
evolved and not deliberately invented, are applied
to certain types of cloud in English-speaking countries;
but the Latin names, comprised in the International99
Cloud Classification, should be learned
by everybody. This classification, which has been
adopted by the International Meteorological Committee
and is used by all official weather services,
is a little more detailed than Howard’s, upon which
it is based; and there is a tendency to add new
terms to it from time to time.
There are ten principal types of cloud in the International
Classification, and the name of each
type has an official abbreviation (a great convenience
for those who record the clouds from day to
day). The following definitions, translated from the
French text of the “International Cloud Atlas,” have
been published by the British Meteorological Office:
1. Cirrus (Ci.)—Detached clouds of delicate
appearance, fibrous (threadlike) structure and
featherlike form, generally white in color.
Cirrus clouds take the most varied shapes, such
as isolated tufts of hair—i. e., thin filaments on a
blue sky—branched filaments in feathery form,
straight or curved filaments ending in tufts (called
cirrus uncinus), and others. Occasionally cirrus
clouds are arranged in bands, which traverse part
of the sky as arcs of great circles, and as an effect
of perspective appear to converge at a point on the
horizon, and at the opposite point also, if they are
sufficiently extended. Cirro-stratus and cirro-cumulus
also are sometimes similarly arranged in long
bands. [Certain forms of cirrus are called “mares’
tails.” The long bands crossing the sky, as just
described, are known as “polar bands” or “Noah’s
ark.”]
2. Cirro-stratus (Ci.-St.)—A thin sheet of
whitish cloud; sometimes covering the sky completely100
and merely giving it a milky appearance; it
is then called cirro-nebula, or cirrus haze; at other
times presenting more or less distinctly a fibrous
structure, like a tangled web.
This sheet often produces halos around the sun or
moon.
3. Cirro-cumulus (Ci-Cu.) (Mackerel sky)—Small
rounded masses or white flakes without
shadows, or showing very slight shadow; arranged
in groups and often in lines.
4. Alto-stratus (A.-St.)—A dense sheet of a
gray or bluish color, sometimes forming a compact
mass of dull gray color and fibrous structure.
At other times the sheet is thin, like the denser
forms of cirro-stratus, and through it the sun and
moon may be seen dimly gleaming as through
ground glass. This form exhibits all stages of
transition between alto-stratus and cirro-stratus,
but, according to measurements, its normal altitude
is about one-half that of cirro-stratus.
5. Alto-cumulus (A.-Cu.)—Larger rounded
masses, white or grayish, partially shaded, arranged
in groups or lines, and often so crowded
together in the middle region that the cloudlets
join.
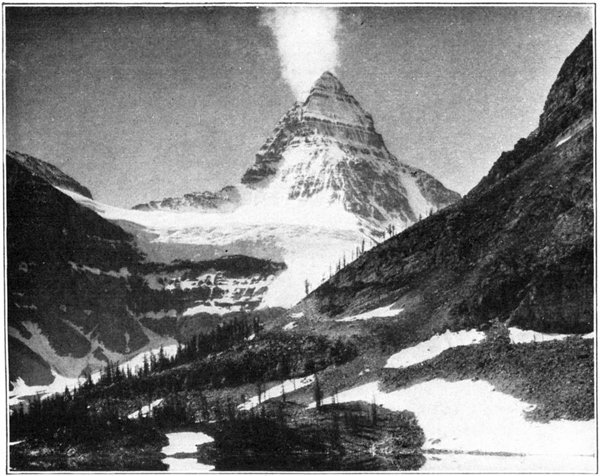
A Cloud Banner Over Mt. Assiniboine, Canadian Rockies. (Photographed
by Dr. C. D. Walcott.)
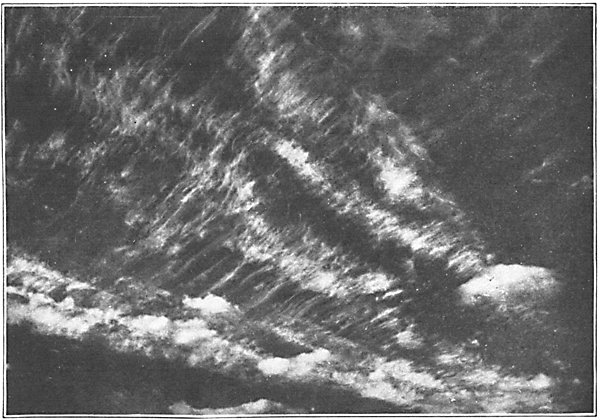
Cirrus (with a few patches of lower clouds in the foreground). This
is cirrus, but not of the “mare’s tail” variety. There are many distinct
types of cirrus, which have sometimes been given separate names.
(Photographed at the Observatory of Trappes, France.)
The separate masses are generally larger and
more compact (resembling strato-cumulus) in the
middle region of the group, but the denseness of
the layer varies and sometimes is so attenuated that
the individual masses assume the appearance of
sheets or thin flakes of considerable extent with
hardly any shading. At the margin of the group
they form smaller cloudlets resembling those of cirro-101cumulus.
The cloudlets often group themselves in
parallel lines, arranged in one or more directions.
6. Strato-cumulus (St.-Cu.)—Large lumpy
masses or rolls of dull gray cloud, frequently covering
the whole sky, especially in winter.
Generally strato-cumulus presents the appearance
of a gray layer broken up into irregular masses and
having on the margin smaller masses grouped in
flocks, like alto-cumulus. Sometimes this cloud form
has the characteristic appearance of great rolls of
cloud arranged in parallel lines close together (“roll
cumulus”). The rolls themselves are dense and dark,
but in the intervening spaces the cloud is much
lighter and blue sky may sometimes be seen through
them. Strato-cumulus may be distinguished from
nimbus by its lumpy or rolling appearance, and by
the fact that it does not tend to bring rain.

Copyright O. P. Anderson
A Lenticular Cloud Over Mt. Rainier
7. Nimbus (Nb.)—A dense layer of dark, shapeless
cloud with ragged edges from which steady rain
or snow usually falls. If there are openings in the
cloud an upper layer of cirro-stratus may almost invariably
be seen through them.
If a layer of nimbus separates in strong wind
into ragged cloud, or if small detached clouds are
seen drifting underneath a large nimbus (the “scud”
of sailors), either may be specified as fracto-nimbus
(FR.-NB.).
8. Cumulus (Cu.) (Wool-pack cloud)—Thick
cloud of which the upper surface is dome-shaped
and exhibits protuberances, while the base is generally
horizontal.
These clouds appear to be formed by ascensional
movement of air in the daytime, which is almost102
always observable. When the cloud and the sun are
on opposite sides of the observer, the surfaces facing
the observer are more brilliant than the margins
of the protuberances. When, on the contrary, it is
on the same side of the observer as the sun, it appears
dark with bright edges. When the light falls
sideways, as is usually the case, cumulus clouds show
deep shadows. True cumulus has well-defined upper
and lower margins; but one may sometimes see
ragged clouds, like cumulus torn by strong wind, of
which the detached portions are continually changing;
to this form of cloud the name fracto-cumulus
may be given.
9. Cumulo-nimbus (Cu.-Nb.)(The thundercloud)—Great
masses of cloud rising in the form of mountains
or towers or anvils, generally having a veil or
screen of fibrous texture (“false cirrus”) at the top,
and at its base a cloud mass similar to nimbus.
From the base local showers of rain or snow,
occasionally of hail or graupel, usually fall. Sometimes
the upper margins have the compact shape of
cumulus, or form massive heaps round which floats
delicate “false cirrus.” At other times the margins
themselves are fringed with filaments similar to
cirrus clouds. This last form is particularly common
with spring showers. The front of a thunderstorm
of wide extent is frequently in the form
of a large low arch above a region of uniformly
lighter sky.
10. Stratus (St.)—A uniform layer of cloud, like
fog, but not lying on the ground.
The cloud layer of stratus is always very low. If
it is divided into ragged masses in a wind or by
mountain tops, it may be called fracto-stratus. The103
complete absence of detail of structure differentiates
stratus from other aggregated forms of cloud.
We have given the foregoing official definitions
and descriptions in full in order to aid the reader
as much as possible, so far as verbal information
goes, in learning to call the common clouds by their
names. Good pictures are, of course, an essential
part of this process, and apart from those that illustrate
the present text, many collections of such pictures
are easy of access. Some may be obtained free
or at nominal cost from the Weather Bureau in
Washington and from the Meteorological Office in
London. The “International Cloud Atlas” (second
edition, Paris, 1910) is now out of print, but may
be consulted in libraries.
Of the clouds above enumerated, cirrus, cirro-cumulus,
and cirro-stratus are the highest, and are
always ice clouds. They consist in some cases of
separate, minute crystals—a fine dust of ice—producing,
according to the forms of the crystals, one
or another of the various forms of halo around the
sun and moon; while in other cases the crystals are
aggregated in small snowflakes, so that the cloud
is a real snowstorm in midair. The altitude of these
clouds generally ranges from 4 to 8 miles. In the
equatorial region their height is often 10 miles or
more. The other main types of cloud are composed
wholly or chiefly of water. Alto-cumulus and alto-stratus
are clouds of medium altitude; strato-cumulus
and nimbus are low clouds (generally not more
than a mile high); while stratus, the lowest cloud of
all, grades into fog, which commonly rests on the
earth. Since cumulus and cumulo-nimbus are produced
by the condensation of moisture from rising
air currents, the height of their bases varies widely104
with the temperature and humidity of the lower air;
the average height is rather less than a mile. Their
vertical extent, however, is much greater than that of
the other cloud types. Cumulo-nimbus sometimes
towers to a height of 4 or 5 miles above its base, and
it is then commonly crowned with ice clouds, including
a filmy “scarf cloud” draping the summit, and
spreading wisps of so-called “false cirrus,” drawn
out horizontally by the upper winds.
Besides the ten main classes of clouds, a few distinct
minor varieties are recognized by all meteorologists.
Among these is the “lenticular cloud”; an
isolated small cloud, which frequently shows iridescence,
and the shape of which has been compared to
that of a lens or an almond. This cloud may remain
stationary, or nearly so, but it really marks the position
of a billow in a stream of air, the moisture condensing
at one edge of the cloud and dissolving at
the other. Another distinctive and rather rare form
of cloud, seen chiefly in connection with thunderstorms,
is mammato-cumulus, likewise known as
“pocky cloud,” “festoon cloud,” “rain balls,” etc. It
consists of numerous sacklike or udderlike protuberances,
convex downward.
When a stream of moist air is forced to ascend in
passing over a mountain its moisture is often condensed
by the process of dynamic cooling, already
explained, and a “cloud cap” is seen over the summit.
In local weather lore such caps are generally
regarded as a sign of rain. These clouds attached
to mountains were called “parasitic clouds,” by
writers of a century ago, who proposed some naïve
explanations of them. Occasionally a “cloud banner”
streams far to the leeward of the mountain.
One of the most famous and striking of cloud caps105
is the “tablecloth” that spreads over Table Mountain,
near Cape Town, when a moist wind blows in
from the sea. Sometimes the local topography
causes the wind that has swept up over a mountain
to form a second “standing” wave to the leeward of
the summit, and this may also be marked by a cloud,
which, like the cloud cap, presents a delusive appearance
of permanence, while it is, in reality, in constant
process of formation on the windward side
and dissipation on the leeward. The two clouds thus
formed, one over the summit and the other to the
leeward, are often seen at Table Mountain, and are
further exemplified in the celebrated “helm and
bar” of Crossfell, in the English Lake District.
In the case of a wind blowing athwart a ridge or
mountain range, a bank of cloud may extend along
the whole crest, as in the “foehn wall” that appears
along Alpine heights when the foehn wind is blowing.
Some day meteorology will be taught in art
schools, for the same reason that anatomy now is.
When that blissful day arrives painters will probably
show us skies less at odds with nature than
those that deface the work of artists of all degrees
of celebrity, including the “old masters.”
106
CHAPTER VII
PRECIPITATION
Meteorologists have been in much perplexity
over the naming and classification of the
various deposits of atmospheric moisture known collectively
as “precipitation.” The subject is one to
which a good deal of attention has been paid in
recent years, but it must be admitted that, even at
the present time, the terminology of this group of
atmospheric phenomena is not yet satisfactorily settled,
either in English or in any other language.
When, for example, a record of weather occurrences
states that hail has fallen, this statement,
unequivocal as it may seem to the layman, often
raises a question in the mind of the meteorologist.
For centuries people talked and wrote about hail
before it occurred to men of science to inquire
whether one and the same thing was always described
under this name. The pursuit of this
inquiry led to disconcerting results, one of them
being the discovery that we do not now know,
in many cases, what bygone weather observers
meant when they made the entry “hail” in their
records.
There are at least three different kinds of icy
lumps and pellets that fall from the sky, and they
have all been called hail. What science now regards
as true hail occurs only in connection with thunderstorms,
and therefore chiefly in warm weather. It107
consists of balls or irregular lumps, each of which,
on examination, is found to have an opaque snowlike
center, surrounded by ice, which is often in
alternately clear and opaque layers. The second
class of icy particles takes the form of miniature
snowballs, about the size of large shot or small peas.
It falls in cold weather, often in conjunction with
ordinary snow. Because it readily crumbles, English-speaking
meteorologists have called it “soft
hail”; but this name is inappropriate for the two
cogent reasons that, though friable, it is not soft,
and that it is not hail; hence this term is now giving
way to the German name “graupel” (in which au =
ow in “growl”). Lastly, little pellets or angular
particles of clear ice sometimes fall in cold weather.
These frozen drops, though fairly common, have,
until recently, enjoyed the distinction of being
anonymous, so far as the scientific world was
concerned, while the general public called them
various things, including “hail.” A few British
authorities have tentatively styled this form of precipitation
“ice rain,” a name which has, however,
been otherwise applied. Finally, in the year 1916,
the United States Weather Bureau took the bull by
the horns and decreed that such ice particles should
be called “sleet.”
Although this decision of the Weather Bureau
was arrived at only after an exhaustive overhauling
of literature and much correspondence with philologists,
scientific men, engineers, and others, it remains
to be seen whether it will eventually prevail
throughout the English-speaking world. In England
“sleet” nearly always means a mixture of snow
and rain. On the other hand, a great many Americans
have been in the habit of applying this term108
to the coating of smooth ice, due to rain in cold
weather, which often breaks down the branches of
trees, lays low miles of wires, and incidentally produces
one of the most beautiful spectacles of American
winters.
This leads us to another difficulty. The icy coating
just mentioned has, for some years, been called
“glazed frost” by the British Meteorological Office,
and the United States Weather Bureau now calls
it “glaze.” It has likewise been called, even in scientific
books, “silver thaw”; and an instance of its
occurrence on a large scale is termed, both popularly
and scientifically, an “ice storm.”
To pursue this lamentable record of cross-purposes
just a little further, it may be added that the expression
“silver thaw,” besides being one of the
aliases of glaze, or glazed frost, has been applied in
various official British publications, until recently,
to a very different rough or feathery deposit of ice
from fog, now called by both the Meteorological
Office and the Weather Bureau “rime.”
Needless to say, when the scientific authorities
are unable to agree about these terms, our dictionaries
are sadly at sea in regard to them; so, altogether,
the task of writing a chapter on precipitation
is beset with verbal difficulties that would not
be encountered in writing on many far more recondite
subjects.
Fortunately the name of the most important kind
of precipitation—rain—is reasonably free from
ambiguity. To be sure, opinions may differ as to
whether a “Scotch mist” is a rain or a wet fog—and
if one happened to have insured a lawn fête
against rain at Lloyds’ the uncertainty on this point
might lead to litigation—but, generally speaking,109
“it rains or it does not rain,” as we are told in the
books on logic.
“Rain,” says Dr. Hellmann, “is the most widespread,
most frequent, and most copious form in
which the aqueous vapor of the atmosphere condenses.
The area of its distribution embraces the
whole surface of the earth, with the exception of
the interior of Antarctica and probably of northern
Greenland. The English and the Norwegian expeditions
found no rain even at the edge of Antarctica.
As the land rises inland to an altitude of
about 2,800 meters about the South Pole, it may
safely be assumed that only snow and no rain falls
in the heart of Antarctica. At the North Pole,
which lies in the midst of the sea, it probably rains
at times; while on the high plateau of northern
Greenland probably snow alone falls. As to its frequency,
there are arid regions in which the average
annual number of days with rain is less than one,
while this number probably rises to 280 in some
tropical districts. With the exceptions of the polar
regions already mentioned, there are probably no
regions where it never rains.”
In its intensity rain varies all the way from the
finest drizzle or the sprinkle of occasional drops up
to the torrential downpours often known as “cloud-bursts.”
Before citing instances of heavy rains, it
may be well to remind the reader that an inch of
rainfall is equivalent to 101 tons of water per acre,
or 64,640 tons per square mile. In the county of
Norfolk, England, in August, 1912, a single day’s
rainfall brought down 670,720,000 tons of water—more
than twice the volume of water contained in
England’s largest lake, Windermere. Doubtless this
record, for showers of similar extent and duration,110
has often been surpassed in other countries, including
our own, and a fortiori within the tropics.
The most remarkable example of a heavy brief
shower was recorded at Porto Bello, on the Isthmus
of Panama, May 1, 1908, when a fall of 2.47 inches
in three minutes was registered by a self-recording
rain gauge. An average heavy rainstorm in the
eastern United States yields about this amount in
twenty-four hours. At Baguio, in the Philippines,
forty-six inches of rain fell from noon of July 14,
1911, to noon of the following day—probably a
“world record” for twenty-four-hour rainfall. The
corresponding record for the United States is 22.22
inches at Altapass, N. C., July 15–16, 1916.
Statistics of what the meteorologist calls “excessive
rainfall”—i. e., abnormally heavy rain during
brief periods—have been collected over the greater
part of the world for much more weighty reasons
than to satisfy curiosity as to which showers were
“record breakers.” Such data are indispensable to
engineers in connection with the building of sewers,
reservoirs, and dams, and in flood-protection work.
Sewers must be made large enough to carry off the
“storm water” from the heaviest showers that ever
occur in the locality; while, on the other hand, in
the absence of rainfall statistics, much money might
be wasted in making them larger than necessary.
A great flood raises questions as to the intensity of
the rainfall that caused it, and the frequency with
which similar rains may be expected to occur in the
drainage area concerned. The unprecedented floods
in the Ohio Valley and adjacent regions in March,
1913, which caused losses amounting to $200,000,000,
led to an exhaustive study of the records of
storm rainfall in the eastern United States, carried111
out by the engineers of the Miami Conservancy District.
Their report on this subject (published at
Dayton, Ohio, in 1917) is probably the most elaborate
discussion of the kind hitherto prepared for
any part of the world. Of the 2,641 storms investigated,
seventy-eight, which covered areas of 500
square miles or more, were found to have had a
rainfall amounting to at least 20 per cent of the
normal rainfall for a year.
The distribution of rainfall over the earth (using
the word “rainfall” in the broad sense to include
snow reduced to its water equivalent) is most conveniently
described in terms of mean annual values.
This element is very unevenly divided between different
parts of the globe and between the different
regions of every large country. The raininess
or dryness of a climate is determined especially
by the prevailing movement of moisture-bearing
winds and the relief of the land, while a second important
control is the location of a region with respect
to storm tracks. The rainiest regions are
found on the windward slopes of mountain ranges
not far from the ocean, where the moist winds,
forced by the mountains to ascend rapidly, cool
dynamically and shed their moisture. Thus the
southern slopes of the eastern Himalaya receive
an enormous rainfall from the southwest monsoon,
blowing from the Indian Ocean, and an abundant
rainfall also prevails on the south slopes of the high
mountains of eastern Tibet, while northern Tibet,
in the lee of the mountains, is a desert.
For more than half a century the little hill station
of Cherrapunji, in Assam, at an altitude of 4,100
feet, has been credited with having the heaviest
rainfall in the world. According to the latest official112
record, its average annual precipitation is 426
inches. Recently it has come to light that Cherrapunji
has a serious rival in the Hawaiian Islands.
A fragmentary record totaling 90 months, between
1911 and 1921, kept on Mount Waialeale (altitude
5,075 feet), in the island of Kauai, showed an average
of 455 inches per annum, and there is reason to
believe that a longer record will give an even higher
average for this place. The spot in question, which
has been described as “Uncle Sam’s dampest corner,”
is so difficult of access that it can be reached only
after a three-day trip on foot over mountain trails.
Hence the United States Geological Survey has installed
here a huge rain gauge—said to be the largest
in the world—capable of holding an entire year’s
rainfall, so that measurements need be made only
once a year.
The heaviest average annual rainfall in the
United States (not including Alaska) is about 130
inches in Tillamook County, Ore. Over most of our
Atlantic seaboard States the rainfall ranges from
forty to fifty inches. Extensive tracts in southern
California and western Nevada have a rainfall of
five inches or less. Any region with an annual rainfall
of less than ten inches is normally a desert,
though irrigation or “dry farming” methods may
enable its inhabitants to practice agriculture.
The process of rain formation is not well understood.
As we have seen, the existence of nuclei in
the air serves to explain why, when the conditions
of temperature and humidity are right, moisture
condenses in the tiny droplets that constitute clouds.
The difficulty is to explain how, at certain times,
quantities of drops are formed of a size large enough
to carry them rapidly to the earth. The number of113
nuclei is so great that, as Humphreys has pointed
out, even if all the water vapor in a volume of
humid air was condensed upon them, the size of
each drop would remain very small. He has suggested
that, in a column of rising air, the small
drops formed at the base of a cloud filter out most
of the nuclei, so that at greater heights there are
relatively few of the latter, which can, therefore,
gather sufficient water about them to form drops of
“falling” size.
The speed with which drops fall through the air,
which is only a fraction of an inch per second for
the average cloud droplet, increases rapidly with the
size of the drop up to a certain point, but for
the drops that reach the earth as rain the speed of
fall tends to become approximately uniform. Several
investigators have measured the size of raindrops.
One method of doing this is to allow the
drops to fall into a shallow layer of fine, uncompacted
flour. Each drop forms a little pellet of
dough, which is found, by experiments with previously
measured drops (produced for the purpose
and dropped from various heights), to correspond
very closely with the size of the drop. These pellets
dry and harden, and can then be carefully measured,
photographed, etc. Hundreds of samples of raindrops
were thus measured by Mr. W. A. Bentley of Jericho,
Vt., and the measurements were tabulated with reference
to the kinds of clouds from which they fell,
the distribution of large and small drops in the different
parts of a storm, and other circumstances
attending their fall. Drops of very different dimensions
are found to fall at one time. The commonest
sizes recorded by Bentley were from one-thirtieth
to one-eighth of an inch in diameter; but many114
drops too minute to form casts were estimated to
be less than a hundredth of an inch in diameter,
while the largest drops observed had a diameter of
a quarter and even a third of an inch. This range
of size corresponds to a range in the rate of fall
from about five feet a second for the smallest drops
up to about twenty-five feet a second for the largest.
The maximum size of raindrops is limited by the
fact that very large drops are broken up in their
fall through the air. Theoretically, the limiting size
is somewhat less than the largest sizes found by
Bentley.
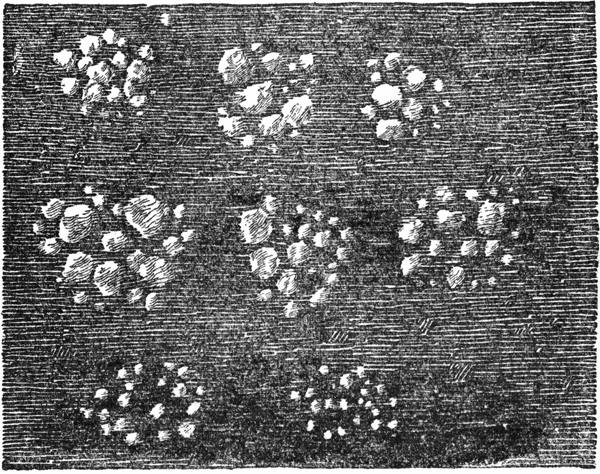
CASTS OF RAINDROPS FROM A THUNDERSHOWER
Collected and Photographed by W. A. Bentley
While rain is often the final product of snow that
melts before it reaches the ground, snow is probably
never formed from raindrops, but always condensed115
directly from water vapor. The finest snow
consists of separate ice crystals, while snowflakes
of larger sizes are always made up of several crystals
partly melted together. The flakes on rare occasions
attain a diameter of three or four inches,
and larger sizes have been reported.
For ages mankind has admired the diversity of
beautiful forms exhibited by snow crystals. Drawings
of such crystals, and also of the frost tracery
on window-panes, were made as early as the sixteenth
century, by the learned Swedish historian
Olaus Magnus, and many collections of similar
drawings have been published since his time; but
nowadays the combination of the camera and the
microscope gives us a far greater wealth of information
concerning these interesting objects. Bentley,
whose study of raindrops we have just mentioned,
has made and published photomicrographs
of hundreds of different forms of snow and ice crystals,
and several collections have been published in
Europe.
One of the facts revealed by the camera is that
the perfectly regular forms of these crystals seen in
drawings are comparatively uncommon in snow as
it reaches the ground. A snow crystal is so fragile
that it is easily mutilated by the wind and by contact
with other crystals. In very calm weather
and at the beginning of a snowstorm many single
and perfect crystals are wafted gently to the ground,
and their beauty is revealed when they fall on dark
objects, especially if they are examined with a magnifying
glass. In spite of their immense variety in
detail, all perfect snow crystals and other ice crystals
have six sides or principal rays. When secondary
rays form they are parallel with the adjacent116
primary rays. There are two principal forms of
ice crystal—the tabular and the columnar. Sometimes
the two forms are combined; a column or rod
of hexagonal section will have at one or both ends
a hexagonal plate. Both the size and the shape of
snow crystals depend to some extent upon the temperature
of the air. The smallest crystals form in
the coldest weather. Star-shaped crystals are most
abundant when the temperature is not far below
freezing, while at lower temperatures there is a
preponderance of hexagonal plates.
The cohesive character of moist snow, which is
utilized by the younger generation in the making
of snowballs and snow men, enables this substance
to assume naturally a variety of striking
forms. Thus a strip of snow lying along a window
ledge or the branch of a tree, will sometimes slip
down in the middle and hang in festoon-shape, supported
only at the ends, constituting a “snow garland.”
Over a level or gently sloping surface of
snow the wind occasionally rolls muff-shaped snowballs,
which are known as “snow rollers.” Thousands
of them are sometimes formed at once, and
the largest may grow to the size of barrels. Huge
overhanging caps of snow formed on tree stumps,
posts, and the like have been aptly named “snow
mushrooms” by Mr. Vaughan Cornish, who has described
those that occur in great numbers in the
Selkirk Mountains of western Canada.
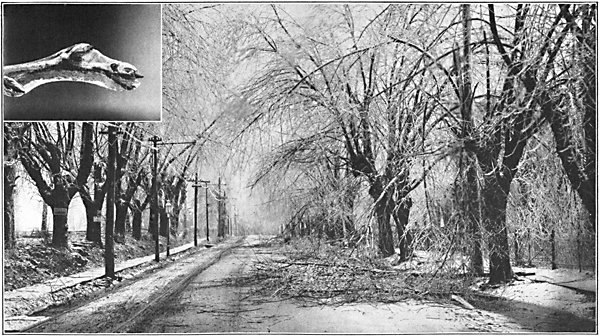
An Ice Storm at Philadelphia, December, 1914. The branches are broken by heavy deposits of glaze. The photograph
in the upper left corner, by Dr. David Fairchild, shows a glaze-incased twig. (Photographs from U. S. Weather Bureau.)
Perhaps the strangest of all the shapes assumed
by snow is seen in the greatest perfection in the
high Andes of tropical Argentina and Chile. Here
are found innumerable pinnacles of snow or glacier
ice, averaging from four to seven feet in height,
though sometimes much higher. Viewed from a117
distance, they bear an uncanny resemblance to
throngs of white-robed human beings, and they
have thus acquired the Spanish name of nieve de
los penitentes (“snow of the penitents”). In the
abridged form nieve penitente this name is now
applied to more or less similar formations in other
mountainous regions. Fine examples are found
in the Himalaya, and one of the Himalayan peaks
has been named Mount Nieves Penitentes. The
origin of these pinnacles has been the subject of
much discussion. Sunshine and wind both appear
to take part in their formation. Some
remarkable “snow honeycombs,” approaching the
form of nieve penitente, are produced in hot,
dry summer weather among the glacier fields of
Mount Rainier.
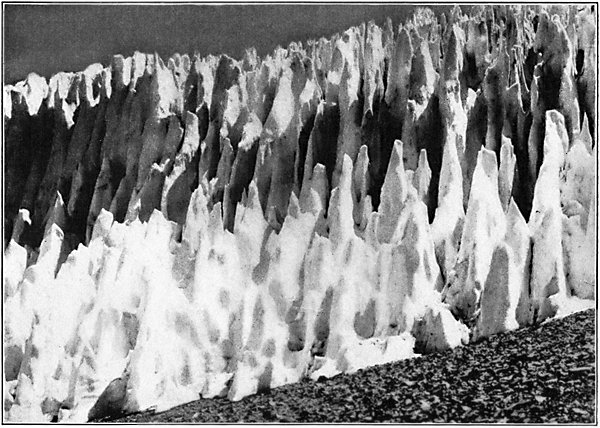
THE NIEVE PENITENTE IN THE ARGENTINE ANDES
(Photograph by Dr. Juan Keidel.)
Snow has its economic aspects, comparable in importance
to those of rain. The problem of snow-removal
crops up every winter in our American
cities, and is not always solved with brilliant success.
In the larger cities of Europe snow is removed
by spreading salt on the streets to reduce
the snow to slush, which is then washed into the
sewers with water, but this method does not seem
to be generally applicable to the heavier snowfall
of this country. The snow-removal conference held
by a number of municipal engineers in Philadelphia
in 1914 brought this difficult phase of street cleaning
prominently before the engineering world, and
it has been actively discussed in recent years in the
technical journals. Snow presents a formidable
problem in the operation of many railway lines, the
solution of which takes the form of snow sleds,
fences, plows of various types, flangers, gasoline
torches for melting snow in switches, etc.
118
Economically, snow is perhaps most important in
its effects on water supply, and this is true especially
of mountain snowfields, the melting of which
feeds adjacent streams. There are great areas in
our Western States where the water required for
irrigation is obtained almost entirely from melting
snow. The mountain slopes constitute natural reservoirs,
from which the moisture that falls in the
winter as snow is gradually fed through the spring
and summer to the surrounding country. In these
regions extensive “snow surveys” are sometimes
made in the early spring, in order to ascertain the
total amount of water available. Professor J. E.
Church, of the University of Nevada, was one of the
pioneers of this idea, and both he and the experts
of the Weather Bureau have developed ingenious
apparatus and methods for making rapid estimates
of the snowfall and its equivalent volume of water
lying over a given area. The snow surveyor travels
over the watershed, often on skis or snowshoes, cutting
sections of snow with a cylindrical “snow sampler”
and weighing them with a small spring balance.
The Weather Bureau also maintains in the
Western mountains a number of special stations at
which daily measurements of snowfall are made
for the benefit of irrigation projects. The use of
“snow bins” and other forms of gauge for holding
an entire winter’s snowfall—thus obviating the
necessity of frequent measurement—has not proved
very satisfactory in this country. An analogous
device, known in French as a totalisateur, is,
however, very extensively used in the Swiss and
Italian Alps.
The heaviest snowfall in the United States occurs
in the high Sierra Nevada of California and in the119
Cascade Range of Washington and Oregon.
At places in both of these regions more than
sixty-five feet of snow has fallen in a single
winter. The snow sometimes lies twenty-five feet
deep on the ground, burying one-story houses to
the eaves.
A fall of snow under a cloudless sky is fairly common
in the polar regions and is sometimes observed
in calm and very cold weather in the temperate
zones. Rain from a cloudless sky is a more doubtful
phenomenon, of which only a few observations
are recorded, most of them of early date. If such
rain occurs, it may come from clouds that have
passed beyond the horizon before the raindrops
reach the earth. Probably the older reports of this
phenomenon really relate to dew, which was once
believed to fall from the sky.
Of the three haillike forms of precipitation that
we have mentioned above, true hail is much the
most important, on account of the large size sometimes
attained by hailstones and the damage that
they are consequently able to cause. The maximum
possible size of a hailstone cannot be positively
stated, but stones larger than a man’s fist and
weighing over a pound have several times been reported
on good authority. During a hailstorm in
Natal, on April 17, 1874, stones fell that weighed a
pound and a half and passed through a corrugated
iron roof as if it had been made of paper. Hailstones
fourteen inches in circumference fell in New
South Wales in February, 1847. At Cazorla, Spain,
on June 15, 1829, houses were crushed under blocks
of ice, some of which are said to have weighed four
and one-half pounds. In October, 1844, a hailstorm
at Cette, France, wrecked houses and sank vessels.120
In the state of Bihar, India, October 5, 1893, hail
covered the ground to a depth of four to six feet;
six persons were buried beneath it and perished,
and hundreds of cattle were killed. In the Moradabad
district of India, May 1, 1888, about 250 people
were killed by hail. The velocity attainable by falling
hailstones is perhaps most strikingly shown by
the fact that, even when falling obliquely, they have
been known to pierce a pane of glass with a clear
round hole, like a bullet hole, leaving the rest of the
pane intact.
Hail appears to be formed in the violent updraft
of air at the front of a thunderstorm. In this turbulent
region the hailstone, first frozen at a high
level, probably makes several journeys alternately
up and down, as it encounters stronger or weaker
rising currents; at one time gathering a coating of
snow aloft, and at another a coat of ice from the
rain below, until finally, on account of its large size
or on account of a weakening of the upward blast,
it falls to the ground. A record of these ups and
downs in the life of a hailstone is seen in the concentric
layers of clear and snowlike ice of which it
is composed.
Although, from immemorial usage, we still speak
conventionally of the “falling of the dew,” it has
now been known for more than a century—especially
since the publication of Wells’s “Essay of Dew”
in 1814—that dew does not fall. The cooling of air
below the dew point of its water vapor by contact
with any cold object results in a deposit of visible
moisture, which is liquid or frozen, according to
whether the temperature is above or below the
freezing point, respectively. This process is not exclusively
nocturnal. It is observed by day in the121
familiar “sweating” of ice pitchers and also in the
appearance of moisture on pavements, stone walls,
and the like, in places shaded from the sun. At
night the rapid cooling of the earth by radiation,
especially (but not, as often stated, exclusively)
under a clear sky and in still weather, favors this
condensation of moisture, in the liquid form, as
dew, or in the frozen form, as hoarfrost. The deposit
occurs most copiously on objects that lose heat
rapidly by radiation and gain it but slowly by conduction.
Water vapor exhaled from the tissues of
plants and from the soil undoubtedly contributes its
quota to the moisture available for condensation,
but this hardly seems to be a reason for asserting,
as some writers have done, that dew comes mainly
from the earth rather than the air.
Hoarfrost is often described as “frozen dew.”
This expression is misleading, for, although dew-drops
are sometimes frozen into little globules
of ice, hoarfrost is more often condensed directly
from atmospheric water vapor in the shape of ice
crystals.
“Glaze” and “rime”—to use the latest official designations
of the two kinds of ice coating formed
from water in the atmosphere—differ greatly in
appearance, as a rule, though transition forms are
sometimes found. Glaze is produced by the falling
of rain on surfaces whose temperature is below
freezing, and is typically smooth and transparent.
Rime is a rough deposit formed from fog, the drops
of which are “undercooled”—i. e., are below the
freezing point—and turn to ice on coming in contact
with solid objects. The most remarkable examples
of rime are seen on mountains and in the polar
regions. It occurs on the branches and leaves of122
trees, and on the corners and edges of upright objects,
rather than on horizontal surfaces. In drifting
fog it grows most rapidly if not entirely on the
windward side of objects—i. e., it builds up against
the wind. On Ben Nevis it has been observed to
grow at a rate of more than an inch an hour.
Trees, posts, telegraph poles, and the like are thus
eventually changed to shapeless masses of rough or
feathery ice.
123
CHAPTER VIII
WINDS AND STORMS
The study of the movements of the atmosphere
constitutes a rather formidable branch of science
known as dynamic meteorology. This subject has
engaged the attention of a number of able physicists—though
far too few—and has begun to assume the
character of an exact science, but is still fruitful of
unverified hypotheses.
We shall have only a little to say here about the
theories and hypotheses relating to atmospheric circulation.
They are at present, to a notable degree,
in process of revision. Important modifications in
them have resulted from the revelations of upper-air
research, as well as from progress in other fields
of inquiry. There are, however, a few fundamental
matters that we must not ignore. We shall start
with the solar heat that keeps the atmospheric machinery
in motion.
Of the heat that comes to us from the sun, it is
estimated that more than one-third is reflected by
clouds and the earth, or scattered by dust and air
molecules, and thus passes back into space without
having had any effect in heating the atmosphere.
Part of the remainder heats the atmosphere directly,
and the rest indirectly, after first heating
the underlying land and water. In both cases, certain
atmospheric gases—notably water vapor—absorb
a great deal more heat than others.
124
The first step in the production of a wind is a
difference in temperature between two parts of the
earth’s surface, and hence of the overlying air.
Such contrasts of temperature always exist, both
locally and on a large scale. The high sun of the
equatorial regions heats the earth much more
strongly than the low sun of high latitudes; a water
surface has a more equable temperature than an
adjacent land surface; a stretch of bare earth is
warmer by day and colder by night than a neighboring
tract covered with vegetation; and so on.
Differences in atmospheric temperature produce
differences in pressure, which gravity tends to adjust
by setting up a circulation.
The exact manner in which this circulation is
begun and maintained is not yet perfectly clear, and
current ideas on the subject are difficult to put into
brief language. Meteorological writers now lay
less stress than formerly upon the lateral spreading,
at high levels, of air that has been heated and
expanded at the earth’s surface, and the inward
flowing of the lower air toward the heated area.
There is, we know, an initial impulse that tends to
drive air from a region of high pressure toward a
region of low pressure; but the actual movement of
the air is another matter. The “life history” of an
air current is found to be a very devious affair.
The important fact, for practical purposes, is
that air does not flow in a straight line from the
place where the pressure is high to that where it
is low. As soon as it begins to flow it curves from
the straight path, in accordance with Ferrel’s Law,
which is thus stated:
“In whatever direction a body moves on the surface
of the earth, there is a force arising from the125
earth’s rotation that deflects it to the right in the
northern hemisphere, and to the left in the southern
hemisphere.”
This law applies to all bodies moving freely over
the earth, and not merely to the winds.
At the earth’s surface, if the atmospheric pressure
is measured simultaneously at various places
by means of barometers, we can get a clear picture
of the horizontal distribution of pressure by drawing
on a map lines, called isobars, through places at
which the pressure is identical. The isobars reveal
the presence of extensive areas over which the pressure
is above the average and of others over which it
is below the average. If, at the same time, we chart
the flow of air by indicating the direction of the
winds at various points, we shall notice that the air
shows a strong tendency to travel around these
areas; and if we could observe its course a thousand
feet or so above the earth we should find the tendency
even more pronounced at that level.
Another important law, springing in part from
Ferrel’s Law and describing the movements of the
air around areas of high and low pressure, is called
Buys Ballot’s Law. One way of stating this law is
as follows:
“If you stand with your back to the wind, in the
northern hemisphere, the barometer will be lower
on your left than on your right. The reverse is true
in the southern hemisphere.”
The reader, whether he lives in the United States
or any other civilized country, will have no difficulty
in securing documentary evidence of the correctness
of Buys Ballot’s Law in the shape of the daily
weather maps issued by the various meteorological
services. On a weather map showing conditions126
anywhere in the northern hemisphere it will be
found that the winds (which are indicated by little
arrows), though subject to a good many local variations,
have a general tendency to blow in the direction
followed by the hands of a clock (“clockwise”)
around an area of high pressure, and in the opposite
direction (“counterclockwise”) around an area of
low pressure. It will likewise be noticed that, in
general, the winds, instead of blowing along the
isobars, are strongly inclined inward in the case of
a low-pressure area and outward in the case of a
high-pressure area. Lastly, if the map indicates the
force of the winds at different places, it will be seen
that winds are strongest where the isobars are close
together and weakest where they are far apart.
It is a matter of much interest to aeronauts that
the force of the wind generally increases with altitude,
and that, in the lower flying levels, the winds
are little, if any, inclined to the isobars.
The spacing of the isobars is called the barometric
gradient. One of the conventional ways of expressing
a gradient numerically is to state the horizontal
difference of pressure, in hundredths of an inch, for
an interval of fifteen nautical miles; but meteorologists
as a rule merely describe gradients as “steep,”
“gentle,” “moderate,” etc., without indicating their
numerical values.
If the great difference in temperature between
the equatorial and polar regions were the only factor
in the control of atmospheric circulation, there
would be a strong barometric gradient between
these regions and there would result a simple circulation
of winds, blowing poleward from the equator
aloft and equatorward from the poles at the earth’s
surface. The former tendency of writers on meteorology127
and physical geography was to regard such
a circulation as a substantial fact, though modified
by the effects of the earth’s rotation and various
local causes. Thus the idea has prevailed of a
wholesale, direct exchange of air between the poles
and the equator. Nowadays we can hardly maintain
this idea, because we see that, on account of the
great deflections they undergo, the main drifts of
air are approximately along parallels of latitude
and not along meridians of longitude. Within the
tropics the general drift of the lower air is from
the east (and near the equator this drift prevails
up to a great height); in middle latitudes it is from
the west; and in the circumpolar regions it is again
from the east. Air from the equator presumably
does find its way to high latitudes, and vice versa,
but neither rapidly nor directly.
Perhaps the dominant feature of the whole circulation
is the banking up of the air in so-called high-pressure
belts at about latitude 30° North and
South. From these “belts”—which are really broken
up into separate areas of high pressure, and which
shift north and south to a certain extent with the
seasons—blow the northeast and southeast trade
winds, in the full development of which, found only
over the Atlantic and the eastern Pacific, we have the
most remarkable “permanent winds” of the globe.
Between the trade wind belts lies the equatorial
region of low pressure, known as the “doldrums.”
This is, in general, a region of light and variable
winds, heavy rains, and thunderstorms.
In the temperate zones of both hemispheres, on
the poleward side of the high-pressure belts above
mentioned, the general drift of the atmosphere near
the earth’s surface is from west to east. In the128
south temperate zone there is a very strong preponderance
of west winds, especially over the vast oceanic
tract of the “roaring forties,” where blow the
boisterous “brave west winds,” well known to sailors.
The corresponding belt of the northern hemisphere,
which includes all but the southernmost part
of the United States, is described as a region of
“prevailing westerly winds,” but it is also a region
of storm tracks, and hence, as local episodes in the
general movement of the atmosphere from west to
east, there are constant shifts of the wind to all
points of the compass, for reasons that will presently
be explained.
On the poleward borders of the two belts of “prevailing
westerlies,” a little outside the Arctic and
Antarctic Circles, there are zones of low pressure.
That of the southern hemisphere is a continuous girdle
around the earth, and has the lowest pressures
found anywhere in the world. The corresponding
subarctic zone, while fairly continuous in summer,
is broken up in winter by the formation of high-pressure
areas over Siberia and northern Canada.
The permanent ice sheets of Greenland and Antarctica
are regions of high pressure, with calm air
in the interior and strong outblowing winds at the
borders. Furious blizzards prevail at the margin of
Antarctica.
The table on the opposite page will serve as a
recapitulation of the facts above stated.
- NORTH POLE
- Calms and high pressure over the interior of Greenland. Out-blowing winds at the border.
- More or less broken subarctic belt of low pressure.
- Prevailing westerlies (much interrupted by moving cyclones and anticyclones).
- Belt of high pressure at about lat. 30° N. “Horse latitudes,” or “calms of Cancer.”
- Northeast trade winds.
- Equatorial belt of low pressure, calms, and variable winds. The “doldrums.”
- Southeast trade winds.
- Belt of high pressure at about lat. 30° S. “Calms of Capricorn.”
- Prevailing westerlies, more constant than in the northern hemisphere. “Brave west winds.”
- Subantarctic belt of very low pressure.
- Calms and high pressure over the interior of Antarctica. Violent outblowing winds at its border.
- SOUTH POLE
WIND AND PRESSURE BELTS OF THE GLOBE.
The great wind and pressure belts of the globe
are much more constant and sharply defined over
the oceans than over the land, and it was upon the
high seas that mankind first distinguished them and
gave them their names. The northeast trade winds
of the Atlantic wafted Columbus to the New World129
and aroused the misgivings of his sailors, who wondered
how they should ever sail homeward against
them. The high-pressure belt north of these trade
winds is a region of calms, which Maury called the
“calms of Cancer.” This region, or a part of it, is
likewise known as the “horse latitudes,” the story
being that, in the old sailing days, vessels laden with
horses were often becalmed here so long that the
cargoes had to be thrown overboard. As a matter
of course, the prosaic modern etymologist declines
to accept this origin of the name and has proposed
others less picturesque. The so-called equatorial
calms, which lie mostly a little north of the equator,
are often nicknamed the “doldrums,” or sometimes
the “equatorial doldrums,” to distinguish them from
other regions of dolorous, baffling calms. The doldrums
vary a great deal in width and the masters
of sailing ships try to cross them where they are
narrowest.
130
The name of the trade winds implies that, according
to the old nautical phrase, they “blow trade,” or
constantly in one direction. Strictly speaking, they
vary considerably in direction, at any one spot,
though they are nearly always from an easterly
quadrant, and they are even more variable in force.
The average speed of the Atlantic trades is about
eleven miles an hour. In view of the prospective requirements
of aeronauts, it is a fact of much interest
that the trades are rather shallow winds. Their
vertical thickness has been found, by observations
with pilot balloons and otherwise, to range from less
than a mile to two or three miles. Some distance
above the trades there are winds blowing more or
less in the opposite direction, known as the counter-trades.
Aircraft will probably use the trade winds
in flying from southern Europe to the Caribbean, and
the countertrades on the return voyage to Europe.
In contrast to the permanent or quasi-permanent
winds just described, there are certain important
winds of the “periodic” type, which reverse their
directions in the course of the year or from day to
night. Some of these, also, first became generally
known through the reports of mariners. The ancient
Greek navigators utilized the monsoons in
trading with India; while we owe to the voyages of
William Dampier, in the seventeenth century, one of
the earliest and best descriptions of land and sea
breezes.
A monsoon is a wind that blows from a continent
toward the sea in winter, when the land is colder
than the water, and in the opposite direction in
summer, when the reverse conditions of temperature
prevail. The pressure gradient is reversed
with the seasons, and the wind varies accordingly.131
The most striking example of monsoon winds is
found in southern Asia—where these winds are of
special economic importance because they control
the rainfall of India—but well-developed monsoons
also occur in Australia and West Africa, over the
Caspian Sea, on the coast of Texas, and elsewhere.
An analogous reversal of gradients, due to the
change of temperature over the land from day to
night, is of common occurrence on the shores of
large bodies of water, resulting in land and sea
breezes (or land and lake breezes). The breeze
blows from the land to the water by night and in the
opposite direction by day. These breezes are generally
best developed and most regular within the
tropics, and particularly on shores adjacent to
mountains. East Indian fishermen put out to sea
with the land breeze in the early morning and come
home with the sea breeze in the afternoon. The
refreshing and health-giving character of the sea
breeze of tropical climates has earned it the sobriquet
of “the doctor.”
Mountain and valley breezes furnish another example
of diurnally reversed winds. Relatively cold
and heavy air drains down from the upper slopes
by night, constituting the mountain breeze. By day
the air in the valley is warmed and expanded, and
as it is confined laterally by the sides of the valley
it flows up the slopes, constituting the valley breeze.
Long before meteorologists undertook to classify
the winds of the globe, these mountain air currents
attracted attention and acquired local names.
Among the Alps, alone, we find scores of such names.
In many cases, too, the breezes have acquired a
legendry of their own. Thus the pontias, a cold,
nocturnal wind that blows out of a narrow valley132
opening upon the plains of the Rhône near the town
of Nyons, is said to have been brought thither in a
glove by St. Cæsarius, Archbishop of Aries, for the
purpose of improving the fertility of the valley!
There is a quaint little book about the pontias, published
by Gabriel Boule in 1647, in which the author
sets forth at length the arguments for and against
the miraculous origin of this wind. The Italian
lakes are especially rich in locally named mountain
and valley breezes.
Parenthetically it may be remarked that wind
nomenclature in general is a vast subject, owing to
the habit that prevailed in prescientific times, and
still prevails to some extent among nonscientific
people, of giving individual names to the winds
characteristic of different localities. As a matter of
curious interest, we set down here some of these
names (a small fraction of the total number):
Khamsin, leveche, leste, levanter, pampero, zonda,
papagayo, buran, purga, brickfielder, southerly
burster, williwaw, willy-willy, pontias, vésine,
solore, joran, morget, rebat, vaudaire, breva, tivano,
ora, Wisperwind, Erlerwind, Rotenturmwind, vent
du Mont Blanc, vent d’aloup, autan, tramontana,
gregale, imbat, kite and junk winds, bad-i-sad-o-bist
roz (the furious “wind of 120 days” of Persia
and Afghanistan).
The present writer has collected several hundred
local wind names—and is constantly adding to the
list.
There are several other types of wind peculiar to
mountains besides the alternating mountain and valley
breezes. Most of these are descending winds, or
“fall winds,” which may blow by day as well as by
night. Thus a strong daytime wind sometimes blows133
down from lofty snowfields and glaciers. A foehn
(pronounced like “fern,” but without the r) is a
wind that has been robbed of most of its moisture
through precipitation on the windward slope of
mountains and which is further dried, and also
strongly heated by compression, in descending the
leeward slope. Winds of this type are common in
the Alps, where they were first described and
named, and their heat and aridity led to the belief
that they came by way of the upper atmosphere
from the distant deserts of Africa. Now that their
origin is better understood, we find that foehns prevail
in many other mountainous countries throughout
the world, including the western United States,
where they are called chinooks. When the foehn
blows in winter, it causes snow to disappear with
amazing rapidity—not only melting it, but speedily
drying the ground—whence it has earned the name
of “snow eater” in America, and “Schneefresser,”
which means the same thing and a little more, in
Switzerland.
The bora of the Adriatic and the mistral of southern
France are winds that blow from a cold, mountainous
interior down to a warm coastal region,
where they arrive as relatively cold winds, in spite
of the dynamic heating they have undergone in their
descent. The bora is sometimes moderate (borina)
and at other times a tremendous gale (boraccia),
while the mistral has been known to blow a railway
train from the track in the valley of the Rhône.
The blizzard is a wind of which Americans once
thought they had almost a monopoly until Sir Douglas
Mawson located the “home of the blizzard” on
the shores of the Antarctic continent. The true
blizzard, whether American or Antarctic, is a violent,134
intensely cold wind, heavily charged with snow.
Such winds are a characteristic feature of the winter
climate of our Middle Western States. Although
the name of this wind first became current as recently
as the seventies of the last century, nobody
knows its origin. Nowadays the name is often
loosely applied to big snowstorms that are not really
blizzardlike.
The dry “hot winds” that sometimes wither the
crops of our western plains are the American antithesis
of the blizzard. These winds belong to the
great sirocco family—the name “sirocco” having
become, in recent scientific usage, a generic designation
for extensive hot winds, whether dry or moist,
as distinguished from local hot winds, such as the
foehn.
The harmattan of West Africa is a dry, dusty
wind from the Sahara, and one that feels relatively
cool; perhaps on account of causing rapid evaporation
from the skin. The simoom (with a final m),
especially the variety blowing in southern Asia, is
perhaps the hottest and most parching of all winds—judging
from its effects on animal life.
The great majority of the winds above enumerated
are merely minor features of what are called
cyclonic and anticyclonic wind systems. Reverting
to what has been said about weather maps and Buys
Ballot’s Law—if the reader will examine a series of
maps for successive days, he will notice that the
areas of high pressure and low pressure are not stationary,
but show a more or less rapid displacement,
the general direction of which, in our latitudes, is
from west to east. The fact that there are great
traveling vortices or swirls in the atmosphere,
which, in whatever regions they occur, partake of135
the general drift of the air around the globe, has
been known for about a century, and constitutes the
corner stone of practical meteorology. In the temperate
zone, where these swirls are sometimes of
moderate force and sometimes very stormy, they are
the chief factor in controlling changes of weather
from day to day, and their observation is the basis
of weather forecasting. Within the tropics, where
they are much less frequent and are confined to a
few restricted regions, they are always violent
storms.
An area of high pressure, with its attendant system
of winds, is called an anticyclone or high. An
area of low pressure, with its winds, is called a
cyclone—sometimes. The word “cyclone” was invented
by Henry Piddington in the year 1848.
Nearly all the early studies of cyclones were made
chiefly for the benefit of mariners, and related to
the severe revolving storms encountered at sea.
Hence the word “cyclone” passed into the general
vocabulary with a connotation of violence, which,
in everyday speech, it still retains. Perhaps the
early “cyclonologists” themselves hardly realized
that a “gentle cyclone” was not a contradiction in
terms.
Meteorologists are still so much under the influence
of the popular idea of a “cyclone” that they
hesitate to apply this term to a disturbance of moderate
force, except in a few special phrases (such
as “extra-tropical cyclone”), though the adjective
“cyclonic” is used freely without reference to the force
of the wind. British meteorologists speak mostly of
“depressions,” while American meteorologists speak
of “lows.” The status of the latter term, as well as
that of the term “high,” is, however, paradoxical.136
Though both words have been used for years, they
are nearly always printed with quotation marks
around them, as if they had not yet been assimilated
in the vocabulary. The Weather Bureau has lately
taken to printing these words in capital letters.
Neither of these practices will be followed in the
present book.
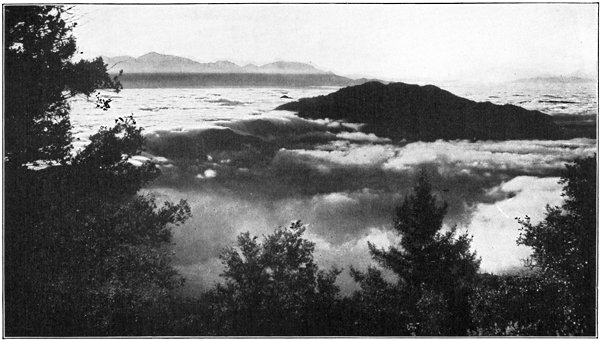
Photo by Prof. Ellerman Showing Clouds or Fog Cascading Through Last Fork Cañon and into the Santa Anita
Cañon. (Letter from F. A. Carpenter, May 29, 1919.)
Tropical cyclones are called “hurricanes” in the
West Indies and the South Pacific, “typhoons” off
the east coast of Asia, “baguios” in the Philippines,
and “cyclones” in the Indian seas. They form in
the doldrums, and generally take a long, sweeping
course, curving westward and poleward, and sometimes
passing into the temperate zones, where
they either die out or increase in size, diminish in
violence, and become similar to the storms originating
in the higher latitudes. One of the curious features
they often exhibit within the tropics is the
calm center at the “eye of the storm,” to which
Tennyson alludes when he writes of the blast (unknown
to meteorologists) that drove a ship
Across the whirlwind’s heart of peace,
And to and thro’ the counter-gale.
These cyclones are the worst of all storms found
at sea, and also exercise their destructive effects
over islands and along continental coasts. The
greatest disasters attending them have been due to
the inundation of low-lying shores by the huge
waves they generate, as in the Galveston hurricanes
of 1900 and 1915 and in the far worse catastrophes
that have occasionally visited the coast of India.
Hurricanes of the West Indies occur chiefly from
August to October, inclusive. The number varies from
none to a dozen a year (with four as an average).
137

Copyright, Ewing Galloway
A CLOUDBURST NEAR CEDAR BRAKES, UTAH
A snapshot taken from the edge of the cañon.
Over the large land areas of the north temperate
zone highs and lows show a tendency to travel over
typical tracks, the locations of which vary a good
deal with the season. One of the most remarkable
facts about the lows of North America is that, wherever
they come from, whether from the Canadian
northwest, the western United States, or the West
Indies, they nearly always leave the continent by
way of the Gulf of St. Lawrence or the northeastern
corner of this country. Our North American lows
travel at an average speed of 600 miles a day. Highs
travel somewhat more slowly; about 540 miles a day
is the average in this country.
A tornado is a small vortex in the atmosphere,
occurring generally in the southeastern part of a
cyclonic area, where, in some cases, several separate
tornadoes develop at the same time. The tornado,
for some reason that is not altogether clear, is far
more common in the interior of North America, east
of the Rocky Mountains, than anywhere else in the
world, though true tornadoes do occur in other countries.
The West African storms bearing this name
are merely thundersqualls, quite different from the
American tornado. The chief visible feature of a
tornado is the so-called funnel-shaped cloud (sometimes
balloon-shaped or, again, like a great coiling
serpent), which is always in contact with the
ground when destruction is in progress. The passage
of the storm is attended by a loud roaring or
rumbling. The path of a tornado varies in width
from a few rods to half a mile or (rarely) more.
Within its borders buildings are blown to pieces,
trees are uprooted and human beings only find
safety underground; while even at a distance of a
few yards outside the path no damage is done. The138
tornado travels at an average speed of about twenty-five
miles an hour. Its speed of rotation has been
estimated, from the effects produced, to amount to
500 miles an hour in some cases; a wind force far
exceeding that of any other type of storm.
Waterspouts, which occur on the ocean and other
large bodies of water, are similar in character to
tornadoes, though much less violent. They range
in height from 100 to 1,000 yards, or more. One
measured recently from the British steamer War
Hermit, near Cape Comorin, was 4,600 feet high
to the base of the overlying cloud. The column
tapered from 500 feet wide at the junction with the
cloud to 150 feet wide at the sea. Spray was thrown
up to a height of more than 800 feet over a region
250 feet in diameter.
Thunderstorms occur chiefly in warm climates
and during the warm season in temperate climates,
but they are by no means unknown in the polar regions.
They are characterized by rapidly rising air
currents, which may be either incidental to the circulation
of a low, or due to local overheating of
the lower atmosphere. In the former case they are
called “cyclonic thunderstorms,” and in the latter
“heat thunderstorms.” This is only a rough classification,
however. Some thunderstorms partake of
the features of both these types, and, on the other
hand, additional classes are distinguished by many
authorities. It is a common occurrence for thunderstorm
conditions, starting in some small area, to
travel across country at a speed of perhaps thirty
or forty miles an hour, at the same time spreading
out fanwise until the front of the storm is hundreds
of miles in length. This front constitutes a “line
squall” (so called from the long line or apparent139
arch of dark cloud that marks its location), and is
attended by more or less thunder and lightning, but
is not necessarily a continuous thunderstorm. The
characteristic wind of a thunderstorm is the squall
that rushes out in front of the storm when close at
hand. This blast of wind, lightning, hail and torrential
rain are all agencies of destruction in severe
thunderstorms.
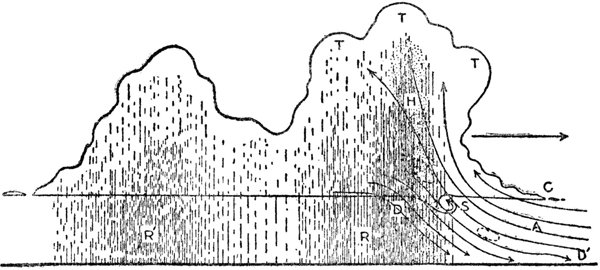
IDEAL CROSS SECTION OF A TYPICAL THUNDERSTORM
A, ascending air; D, descending air; C, storm collar; D’, wind gust;
H, hail; T, thunderheads; R, primary rain; R’, secondary rain. (W. J.
Humphreys.)
Concerning the winds of the globe in general and
the remarkable atmospheric interchanges that they
involve, Sir Napier Shaw writes:
“Of the millions of tons of air which form the
atmosphere nearly the whole is moving. The regions
of calm at the surface at any one time, taken
all together, do not form a large part of the earth’s
surface, and above the surface calm regions are still
rarer. Let us remember that the motion of the air
is always ‘circulation’; air cannot move forward or
backward or upward or downward without displacing
other air in front of it and being replaced by
other air behind it, though the circulation may be140
quite local and limited in extent, as is frequently the
case when warm air rises or cold air sinks. In the
course of investigations into the life history of surface
air currents in the Meteorological Office we
have traced air over long stretches of the surface of
the Atlantic. We have found, on one occasion, the
shores of Greenland to be fed with air that left the
middle of the Atlantic four days previously, while
in the course of six days air traveled from Spitsbergen
to join the northeast trade wind off the west
coast of Africa. On another occasion the air that
formed the wind off the south of Ireland was traced
back to the north of Africa, but that which blew at
the opening of the Channel two days later came
from Hudson Bay, via the Azores.”
Such are the ever-shifting currents of the ocean
of air.
141
CHAPTER IX
ATMOSPHERIC ELECTRICITY
Every schoolboy has read how Benjamin Franklin,
by means of his famous kite experiment,
demonstrated the electrical nature of lightning, and
how the same versatile genius invented the lightning
rod. It is not proposed to repeat familiar history
here. Neither shall we discuss the dubious statements
frequently put forth that lightning rods were
known before Franklin’s time, nor consider how
much credit is due the many philosophers who, at
earlier periods, suspected lightning to be a manifestation
of electricity. The facts and ideas concerning
atmospheric electricity that we have to
present in this chapter were, for the most part, quite
unknown to Franklin and to many generations of
savants after him, and some of them are just now
finding their way into the textbooks.
Science still recognizes the existence of two kinds
of electricity—positive and negative—which, by
combining, neutralize each other’s effects. According
to current ideas, however, the more active agent
in electrical phenomena is negative electricity, which
is believed to consist of (or to provide electrical
charges for) exceedingly minute particles called
electrons.
Only a few years ago the smallest thing that
science had to deal with was the atom, and the lightest
of atoms is that of hydrogen. The discovery of142
electrons marks a new step toward the infinitely
little. The mass of the electron—or, in more popular
and less exact terms, its weight—is about 1/1800 that
of a hydrogen atom. As to its size: Imagine a billiard
ball magnified to the size of the earth. Its constituent
atoms would be the actual size of billiard
balls, but the electrons of which each atom is composed
would still be too small to be seen with the
naked eye. Now imagine each of these billiard-ball
atoms further magnified to the size of a large church.
The electrons would then be about as big as one of
the periods on this page.
When we say that a body has an electrical charge
we mean that it has an excess of positive or negative
electricity. An ordinary molecule of an atmospheric
gas contains (or perhaps actually consists of) equal
amounts of the two kinds of electricity, and is therefore
not charged. There are, however, various ways
in which an electron may be detached from such a
molecule, leaving it positively charged; and again it
may receive an extra electron, and thus acquire a
negative charge. Under the former circumstances
it becomes a positive ion, and under the latter a
negative ion. Ions play a very important role as
carriers of electricity, because they are impelled to
move toward oppositely charged bodies or particles
and combine with them. A gas containing ions is
said to be ionized; and it is the ionization of the
atmosphere that makes it a conductor of electricity.
The number of ions in a given volume of air has
been the subject of a great many measurements, both
at observatories on land and in the course of scientific
expeditions at sea. There are ingenious instruments
called “ion counters,” in which air is drawn
at a measured rate through the apparatus and its143
electrical effects are noted. The number of positive
ions found in a cubic centimeter of the lower atmosphere
varies from a few hundred to a thousand or
more, while the number of negative ions in the same
space is generally one or two hundred smaller. The
ionization is about the same over the ocean as over
the land.
There are several ways in which the air may become
ionized. The different rays given off by radioactive
substances (Alpha, Beta, and Gamma rays)
all have the power of driving off electrons from the
molecules of gases; i. e., ionizing them. Air is undoubtedly
ionized by radioactive matters in the soil
(radium and thorium) and especially by the gaseous
“emanations” of these substances in the atmosphere,
which are also radioactive. It has, however, been a
problem to account for ionization over the ocean; because
the amount of radioactive matter in sea water
is immeasurably small, while the amount of radioactive
emanation in sea air is, according to the latest
observations, only about 2.5 per cent of that occurring
over the land.
The clue to this mystery seems to be found in a
special kind of Gamma rays coming from some region
far above the surface of the earth. These rays
are called the “penetrating radiation,” because they
not only are able, like the Gamma rays due to radioactive
substances on earth, to pass through the walls
of hermetically sealed metal vessels and ionize the
air inside, but they also have the power of passing
through a great extent of atmosphere without being
absorbed. They are estimated to be about ten times
as “penetrating” as the Gamma rays coming from
known terrestrial substances. The best proof that a
radiation of this sort comes from above is that when144
closed metal vessels are carried up in balloons, there
is, above an altitude of about half a mile, a rapid
increase in the rate at which ions are produced within
them. As to the source of this radiation, one suggestion
has been that it comes from strongly
radioactive cosmic dust in the upper atmosphere. A
hypothesis that seems more plausible at present attributes
it to the bombardment of the atmosphere by
electrons shot off from the sun.
The knowledge of ions in the atmosphere is one
of the recent acquisitions of science. On the other
hand, it has been known for some generations that
the earth has normally a negative charge as compared
with the air, or the air a positive charge as
compared with the earth. Thus between the earth
and any point in the air (except, as we now know,
at great altitudes) there is a difference of what is
called “potential,” of such a character that negative
electricity will follow any conductor provided for it
away from the earth. Variations of potential with
altitude have long been measured by means of instruments
called “collectors,” which gather, so to
speak, a sample of the electrical charge of the air at
any point and enable it to be compared with that of
the earth. The difference of potential is measured
in volts per meter of vertical distance. Thus we get
the “potential gradient,” which averages about 150
volts per meter in the lowest part of the atmosphere.
It is subject to great irregular variations—especially
during thunderstorms—and also to somewhat regular
rises and falls during each day, and to an annual
fluctuation, being much greater in winter than
in summer.
It has also been known for a good many years
that the air is a conductor of electricity—though a145
poor one—and, therefore, does not insulate the earth.
Dr. W. F. G. Swann has expressed the extremely
small conductive capacity of the air for electricity
in the statement that a column of it one inch long
offers as much resistance to the passage of an
electrical current as a copper cable, of the same
cross section, thirty thousand million million miles
long!
A fact more recently learned, from observations in
balloons, is that the potential gradient falls off rapidly
at high levels, and becomes practically zero at an
altitude of about six miles. From this fact it is concluded
that the lower six miles of the atmosphere
contains a charge of positive electricity just equal to
the negative charge at the earth’s surface. In other
words, the lower atmosphere is not only positive
with respect to the earth, but in an absolute sense it
contains an excess of positive electricity.
Thus we have a negatively charged earth surrounded
by a layer of positively charged air. Since
air is a conductor, it is not easy to see why the opposite
charges of the earth and the atmosphere do not
combine and neutralize each other. An interchange
is, in fact, always going on between them; negative
ions flow upward from the earth and positive ions
flow in the opposite direction. This “earth-air current”
is, however, exceedingly small. Moreover, the
opposite charges of the earth and air remain from
year to year in spite of it.
How does the earth retain its negative charge and
the air its positive charge? No other question relating
to atmospheric electricity has, in recent years,
been so much debated as this. Discussion centers,
as a rule, upon the negative charge of the earth; for
there are certain reasons for assuming that, when146
once this is explained, the positive charge of the atmosphere
will require no special explanation.
One hypothesis is that the earth is bombarded by
positive and negative corpuscles from the sun, and
that the negative corpuscles have such penetrating
power that they are able to reach the earth, while the
positive corpuscles are caught by the atmosphere.
Another hypothesis (Swann’s) is that the same
“penetrating radiation” that, as we have seen, helps
to ionize the lower atmosphere has the effect of driving
downward a stream of electrons detached from
the air molecules, thus maintaining a constant supply
of negative electricity to the earth. The question
is not yet settled.
It is now time to turn from these somewhat abstruse
matters to a subject of universal interest; viz.,
lightning. As recently as a few decades ago, though
there was already a copious literature on the subject
of lightning, very little was really known about it.
Even its superficial features were strikingly misunderstood
until the advent of photographic methods of
investigation. Thus until the middle of the nineteenth
century sharply zigzag lightning flashes were
represented in scientific books as they still are in
conventional art. That so-called zigzag lightning is
really sinuous was first asserted by James Nasmyth,
in 1856, and his contention was soon afterward confirmed
by photography. The camera has revealed a
large number of other interesting things about
lightning.
Everybody has noticed an appearance of flickering
in lightning flashes that are of sensible duration.
Several early investigators, such as Arago, Dove, and
O. N. Rood, had reached the conclusion that such
flashes are multiple, consisting of several successive147
discharges along an identical path. Rough measurements
of the intervals of time between these discharges
were made with various forms of rotating
disk. Far more accurate information is now obtained
on this subject by the use of a camera mounted
on a vertical axis and swung in a wide arc, at a fixed
rate, by clockwork. The perfection of this device is
due, in part, to A. Larsen, in America, but especially
to Dr. B. Walter, of Hamburg, whose achievements
in the photography of lightning far surpass those of
any other investigator.
It is obvious that if a discharge of lightning is not
instantaneous, but has a sensible duration, the rotary
movement of the camera, arranged as just mentioned,
will spread out the image of the flash, on the
photographic plate, into a more or less broad band or
ribbon. Most photographs of ribbonlike streaks of
lightning made with ordinary cameras are, in fact,
due to accidental movements of the apparatus during
exposure—such as an involuntary start of the operator,
in case the camera is held in the hands—though
a certain amount of spreading of the image is sometimes
caused by what photographers call “halation.”
Pictures taken with the revolving camera show that
some flashes are practically instantaneous while
others may last as long as half a second or more.
Those of the latter class nearly always show several
parallel streams of light, more or less distinctly separated
by darker spaces. Each of these bright
streams represents a separate discharge along the
common path. As the speed with which the camera
turns is known, it is possible to determine the intervals
of time between the discharges of a multiple
flash. These intervals may vary from a few thousandths
to one or two-tenths of a second, while the148
duration of each of the consecutive discharges is
probably not more than two or three hundred-thousandths
of a second in most cases. Sometimes the
path of the lightning flash is shifted by the wind
while the picture is being taken. In one case this
shift was estimated at 36 feet.
Photography is also applied to determining the distance
of a lightning flash and hence the dimensions
of any of its features. For this purpose a stereoscopic
method is used, two cameras being mounted
side by side and exposed at the same time. Sometimes
one of the cameras is made to revolve, while
the other remains stationary. The stationary camera
will then show the relative positions of the flashes
occurring during exposure, while the moving camera
will indicate the times at which they occurred.
Streaks of “black lightning” and black borders of
the white flashes, both often seen in photographs,
are a trick of the camera and are due to what is called
the “Clayden effect.” Some kinds of plates are much
more susceptible to this effect than others. When a
flash of lightning has registered its impression on
such a plate, and, before the shutter is closed, another
flash occurs, the general illumination of the
field by light reflected from clouds, etc., often “reverses”
the original image, and consequently it
prints black.
“Sheet lightning” presents the appearance of a
diffuse glow over the sky. When lightning of this
character is seen playing about the horizon on summer
evenings, in the absence of an audible thunderstorm,
it is often called “heat lightning.” Most sheet
lightning is probably a mere reflection of ordinary
streak lightning below the horizon or hidden by
clouds. Some authorities believe, however, that diffuse,149
silent discharges actually occur in the clouds.
Balloonists claim to have encountered such discharges
near at hand. An analogous phenomenon
is the glowing of so-called “incandescent” or self-luminous
clouds, to which several observers have
called attention. A remarkable phenomenon of
somewhat similar character has been reported by Dr.
Knoche, late director of the Chilean meteorological
service, who states that it occurs on a vast scale along
the crest of the Andes during the warm season. The
mountains seem to act as gigantic lightning rods,
giving rise to more or less continuous diffuse discharges
between themselves and the clouds, with occasional
outbursts simulating the beams of a great
searchlight. These displays are visible hundreds of
miles out at sea. Something akin to this so-called
“Andes lightning” has occasionally been reported
from other mountainous regions, including the mountains
of Virginia and North Carolina.
“Beaded” lightning and “rocket” lightning are as
rare as they are interesting. The former resembles
a string of glowing beads, while the latter is a form
of streak lightning that shoots up into the air at
about the apparent speed of a skyrocket.
“Ball lightning” takes the form of a fiery mass
(not always globular), which generally moves quite
deliberately through the air or along the ground, and
in many cases disappears with a violent detonation.
It occurs inside of buildings, as well as out of doors.
In order that a discharge of electricity may break
through the resistance of the air along paths as long
as those commonly observed, enormous differences of
potential must exist in the atmosphere during thunderstorms.
How such conditions arise has been the
subject of an immense amount of speculation. The150
explanation now generally accepted was proposed in
the year 1909 by the English physicist and meteorologist,
Dr. George Simpson. This hypothesis is
based upon the fact, well attested by laboratory experiments,
that the breaking up of drops of water
involves a separation of positive from negative electricity;
in other words, the production of both positive
and negative ions. In this process the drops
become positively charged; i. e., they retain a greater
number of positive than of negative ions, the latter
being set free in the air. About three times as many
negative as positive ions are thus released.
Now a thunderstorm is accompanied by strong upward
movements of the air; so strong that small
drops cannot fall to the ground, while large drops,
which would be heavy enough to fall through such
rising currents if they could retain their integrity,
are broken up by the blast of air and carried aloft,
where they tend to accumulate, recombine, and fall
again. This process may be repeated many times,
so that the positive charge of the drops is continually
increasing, and at the same time negative ions are
being set free and carried by the ascending air to
the upper part of the clouds. Here they unite with
the cloud particles and give them a strong negative
charge. Thus eventually there is formed a
heavily charged positive layer of cloud between
a heavily charged negative layer above and the
negatively charged earth beneath. When the
differences of potential thus brought about become
great enough, disruptive discharges of electricity
will occur, and these may be either between
the upper and lower layers of cloud or between the
clouds and the earth, or, sometimes, between two
different clouds.
151
Probably much the most frequent lightning flashes
are those that occur within a single thundercloud
and do not reach the earth. However, it will often
happen that the negatively charged upper layer of
cloud is either carried very high or drifted away by
the wind, and then the discharges that occur will be
chiefly between cloud and earth. Such conditions
are likely to prevail in the case of cyclonic thunderstorms,
in which there is often great difference in
the direction and force of the winds at different
levels. On the other hand, heat thunderstorms
usually occur when the general winds are light at all
levels, and it is probable that such storms are relatively
free from cloud-to-earth discharges. We seem
to have here an explanation of the paradox that
tropical thunderstorms, which are nearly always of
the noncyclonic type, though notoriously violent, are
generally harmless.
It must not be inferred from what has been said
above that the mystery of the lightning flash is now
fully resolved. This is far from being the case. It
is not at all clear how an electrical discharge can
break down the resistance of the air along a path a
mile or more in length, as commonly happens in the
thunderstorm. It was formerly stated, on good
authority, that the difference of potential required
to produce such a flash would amount to upward of
5,000,000,000 volts. Certain facts have lately been
adduced to show that such great differences of
potential need not be assumed. Moving-camera
photographs of the sparks produced by electric
machines show that such sparks begin with small
brush discharges which gradually ionize the air and
thus build up a conductive path for the complete
discharge. Something of this kind may occur in the152
atmosphere. Streaks of air already strongly ionized
and more or less continuous sheets of rain would
also help to provide conductors for a discharge. If
lightning does build up its path somewhat gradually,
the process might, in certain cases, be so slow as
to account for the deliberate movement of rocket
lightning, and also, perhaps, furnish a clue to the
hitherto unsolved mystery of ball lightning. Humphreys
has tentatively suggested that all genuine
cases of ball lightning are “stalled thunderbolts”;
i. e., lightning discharges that have come to a halt,
or nearly so, in their progress through the air.
As to the visibility of lightning Humphreys says,
in his “Physics of the Air”:
“Just how a lightning discharge renders the atmosphere
through which it passes luminous is not definitely
known. It must and does make the air path
very hot, but no one has yet succeeded, by any
amount of ordinary heating, in rendering either
oxygen or nitrogen luminous. Hence it seems well-nigh
certain that the light of lightning flashes owes
its origin to something other than high temperature,
probably to internal atomic disturbances induced by
the swiftly moving electrons of the discharge, and
to ionic recombination.”
A few attempts have been made to measure the
strength of current in a lightning discharge. Many
substances become magnetized when an electric discharge
occurs in their vicinity, and it has been
pointed out by F. Pockels that when basalt rock is
magnetized in this way the amount of magnetism is
an indication of the greatest strength of current to
which it has been exposed. Pockels examined specimens
of basalt from the top of Mount Cimone, in
the Apennines, where lightning strokes are common,153
and found many of them more or less magnetized.
He also exposed blocks of basalt close to a branch of
a lightning rod in the same region. He thus obtained
values for the strength of current in lightning
discharges ranging from 11,000 to 20,000 amperes.
Humphreys, from the crushing effect of a lightning
stroke upon a hollow lightning rod, has computed
the strength of current in the case examined to be
about 90,000 amperes.
The effects of lightning are so various that it would
take a book to describe them all. Its audible effects
are discussed in our chapter on atmospheric
acoustics. Its chemical effects consist chiefly in the
production of oxides of nitrogen, ozone, and probably
ammonia from the constituents of the atmosphere
along the path of the discharge, and these substances,
either directly or after further combinations in the
atmosphere, contribute to the fertility of the soil.
Lightning sometimes bores holes several feet deep
in sandy ground and fuses the material along its
path, forming the glassy tubes known as fulgurites.
Similar holes are bored in solid rock.
The destructive effects of lightning are due chiefly
to the heat generated by the passage of an electric
current through a poor conductor. When moisture
is present in the object struck, its sudden conversion
into steam produces the explosive effects seen in the
shattering of trees, the ripping of clothes from the
human body, etc. There is almost no end to the
curious pranks played by lightning—some disastrous,
some comical, and some benevolent, as when persons
crippled with rheumatism, after having been knocked
down and temporarily stunned by a stroke of lightning,
have found themselves completely cured of
their malady! A well-known book by Camille Flammarion,154
translated into English under the title
“Thunder and Lightning,” is almost wholly devoted
to these eccentricities of the lightning stroke.
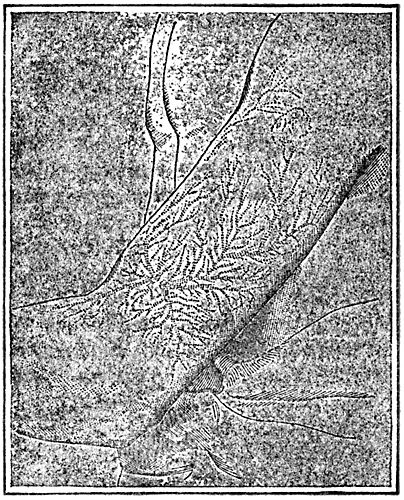
A LIGHTNING PRINT ON THE ARM OF A BOY STRUCK BY
LIGHTNING NEAR DUNS, SCOTLAND, IN 1883
Drawn from a photograph taken a few hours after the
accident. From the Lancet.
There is a very common belief that lightning sometimes
impresses a photographic image of trees or
other objects of the landscape upon the human body.
The ramifying pink marks, known as “lightning
prints,” often found on the skin of persons who have
been struck by lightning, are, however, in no sense
photographic, but are merely the lesions due to the155
passage through the tissues of a branching electric
discharge.
A few practical suggestions in regard to danger
from lightning are offered by Humphreys, as
follows:
“Generally it is safer to be indoors than out during
a thunderstorm, and greatly so if the house has
a well-grounded metallic roof or properly installed
system of lightning rods. If outdoors it is far better
to be in a valley than on the ridge of a hill, and it is
always dangerous to take shelter under an isolated
tree—the taller the tree, other things being equal,
the greater the danger. An exceptionally tall tree
is dangerous even in a forest. Some varieties of
trees appear to be more frequently struck, in proportion
to their numbers and exposure, than others, but
no tree is immune. In general, however, the trees
most likely to be struck are those that have either
an extensive root system, like the locust, or deep tap
roots, like the pine, for the very obvious reason that
they are the best grounded and therefore offer, on
the whole, the least electrical resistance.
“If one has to be outdoors and exposed to a violent
thunderstorm, it is advisable, so far as danger from
lightning is concerned, to get soaking wet, because
wet clothes are much better conductors, and dry
ones poorer, than the human body. In extreme cases
it might even be advisable to lie flat on the wet
ground. In case of severe shock, resuscitation should
be attempted through persistent artificial respiration
and prevention from chill.
“The contour of the land is an important factor in
determining the relative danger from lightning because
the chance of a discharge between cloud and
earth, the only kind that is dangerous, varies somewhat156
inversely as the distance between them. Hence
thunderstorms are more dangerous in mountainous
regions, at least in the higher portions, than over a
level country. Clearly, too, for any given region the
lower the cloud the greater the danger. Hence a
high degree of humidity is favorable to a dangerous
storm, partly because the clouds will form at a lower
level and partly because the precipitation, and probably
therefore the electricity generated, will be
abundant. Hence, too, a winter thunderstorm, because
of its generally lower clouds, is likely to be
more dangerous than an equally heavy summer one.”
It is estimated that the total property loss due to
lightning in the United States is about $8,000,000 a
year, and the number of persons struck about 1,500,
of whom one-third are killed. Nine-tenths of these
accidents occur in rural localities.
Lightning rods neither prevent lightning stroke
nor do they, as is sometimes alleged, attract lightning
to buildings. They merely provide good conductors
along which a stroke of lightning may reach
the earth without doing damage, and, within very
moderate limits, determine the path of discharge.
While there are many unsettled points regarding the
theory of lightning rods and details of construction,
their general utility is strikingly indicated by statistics
showing the comparative amount of damage done
by lightning to rodded and unrodded buildings. According
to the United States Bureau of Standards,
information gathered in this country shows that
“taking rods as they come in the general run of installations,
they reduce the fire hazard from lightning
by 80 to 90 per cent in the case of houses, and
by as much as 99 per cent in the case of barns.”
The same bureau, in its valuable publication, “Protection157
of Life and Property Against Lightning”
(Washington, 1915), supplies the answers to a multitude
of questions that are constantly asked about
lightning rods.
Buildings with metal roofs and frames connected
with the ground are generally well protected from
lightning (except as to nonmetallic chimneys) without
rods.
During actual thunderstorms, and also at other
times when there are high potential gradients in the
atmosphere, luminous electric discharges of a more
or less continuous character are sometimes observed
to occur in the shape of small jets and flames, chiefly
from pointed objects, including lightning rods, the
masts and spars of vessels, the angles of roofs, etc.
These are identical in character with the “brush”
discharges, or incomplete sparks, produced by electric
machines. They are accompanied by a hissing or
crackling sound. Their luminosity is comparatively
feeble, and for this reason they are much more often
observed by night than by day. They are especially
common during snowstorms.
This phenomenon is known as St. Elmo’s fire or
corposants (not to mention a score of other names,
ancient and modern). As seen at sea, corposants
sometimes take the form of one or two starlike objects
at the trucks of the masts or the ends of yard
arms, but occasionally the spars, rigging and other
parts of the ship are lighted up with a great number
of stationary or moving flames, producing a weird
spectacle. The finest examples of corposants are,
however, observed on high mountains, and the
phenomenon has been carefully studied at certain
mountain observatories, such as those on Ben Nevis
and the Sonnblick.
158
Of its occurrence on Ben Nevis, Angus Rankin
writes: “The most frequent manner in which it
makes its appearance is as caps of light on the tips
of the lightning rod, but occasionally it appears as
jets of flame projecting from all objects on the top
of the tower and from the cowl of the kitchen
chimney, which rises from the roof at some distance
from the tower. These jets are at times from 4 to 6
inches in length, and make a peculiar hissing sound.
During a very brilliant display, the observer’s hair,
hat, pencil, etc., are aglow with the ‘fire,’ but, except
for a slight tingling sensation in the head and hands,
he suffers no inconvenience from it. On such occasions,
if a stick be raised above the head, jets of
electric light will be seen at its upper end. The only
drawback to observing it with advantage is the unpleasant
character of the weather in which it appears,
namely blinding showers of snow and hail,
and squally winds, causing a good deal of snowdrift.”
Rankin records that it was sometimes heard in the
daytime, when its light was invisible. On the Sonnblick
a display of St. Elmo’s fire has been observed to
last as long as eight hours.
No luminous electrical phenomenon is more beautiful
or, at first sight, more mysterious than the aurora,
popularly known, in the northern hemisphere, as the
“northern lights.” This phenomenon is due to the
passage of electrical discharges through the rarefied
gases of the upper atmosphere, and it now appears to
be settled beyond controversy that the discharges are
caused by corpuscles or radiations of some kind
emitted from the sun.
Most accounts of the aurora describe the typical
appearances that it assumes as seen from a single
place on the surface of the earth, but say little, if159
anything, about the form of the phenomenon as a
whole or about its position in space. We shall follow
a different plan here, and ask the reader, first of all,
to imagine himself viewing the aurora from a point
some thousands of miles away from our planet.
The solar emission above mentioned, when sufficiently
intense, produces in the upper atmosphere a
glow like that seen in a vacuum tube when an electrical
discharge passes through it. From our vantage
point in outer space we shall notice that this glow is
not spread over the whole globe, but forms two rings,
which encircle the polar regions of both hemispheres,
though neither the geographic nor the magnetic poles
lie at their centers. The rings do not extend down
into the lower atmosphere, but hang about 60 miles
above the earth’s surface.
The reason for this segregation of the aurora in
high latitudes is that the earth is a great magnet,
and magnets have the power of deflecting an electrical
discharge in their vicinity. An appearance
much resembling the two auroral zones of the earth
was produced, on a small scale, by the late Professor
Kr. Birkeland of Christiania, who magnetized a
metal globe and allowed an electrical discharge to
play upon it in a vacuum. The surface of the globe
was coated with a phosphorescent substance, which
glowed under the discharge in two rings, corresponding
roughly to those of the aurora. In both cases
the discharge follows what are called the magnetic
“lines of force.” Our earth, like other magnets, is
enveloped and penetrated by such lines. At any
point on the earth the direction of the neighboring
lines of force is shown by the dipping needle, which
assumes a position parallel to them. At a magnetic
pole the needle points straight up and down, and160
everywhere in high latitudes it has a position not
very much inclined to the vertical, while in low latitudes
it is more or less horizontal.
If, now, for the sake of simplicity we confine our
attention to the northern hemisphere, and imagine
ourselves maintaining our watch for months and
years together, we shall discover that much of the
time there is no ring to be seen; at other times there
may be a small or partial ring; and occasionally there
is a very broad, conspicuous ring, spreading so far
south that it overlies the northern part of the United
States and most of Europe. Evidently the emission
from the sun that causes the auroral discharge varies
greatly in strength, and this is in accordance with
what we know about solar activities in general.
Next let us take a closer look at the ring, whether
from outer space or from the earth’s surface. We
shall find that it is made up, at least in part, of a
multitude of luminous beams directed out into space
and undergoing rapid changes in position and form.
These beams, which really mark out the streams of
the discharge in the upper air, follow the lines of
force. In high latitudes they are nearly vertical with
respect to the underlying surface of the earth. Even
in the United States (when the aurora extends so
far south) they are much more nearly vertical than
horizontal. A dipping needle will show, at any place,
just how they should stand.
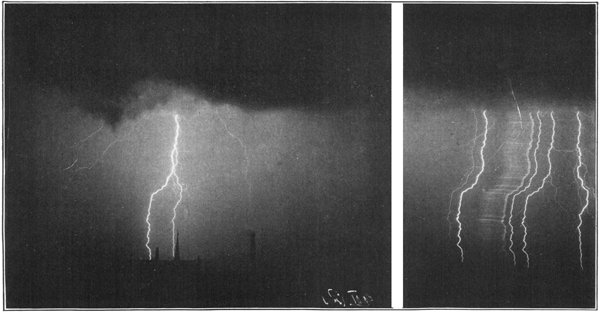
Photographic Analysis of Lightning. This double photograph was made by Dr. B. Walter of Hamburg, the leading expert
in the field of lightning photography. The picture at the left was taken with a stationary camera. The photograph at the
right, taken at the same time with a revolving camera, shows that one of the main flashes (the one to the right) was a
single discharge, and the other a multiple discharge.
From any distant point on the earth’s surface
either north or south of it, the visible portion of the
auroral ring presents the appearance of an arch
across the horizon. Arctic explorers, far within the
Arctic Circle, see this arch to the south of them. In
our latitudes it spans the northern horizon. Separate
beams or streamers may be distinguishable or161
not, according to the brightness of the discharge or
its distance from the point of observation. Combinations
of beams constitute so-called “draperies.”
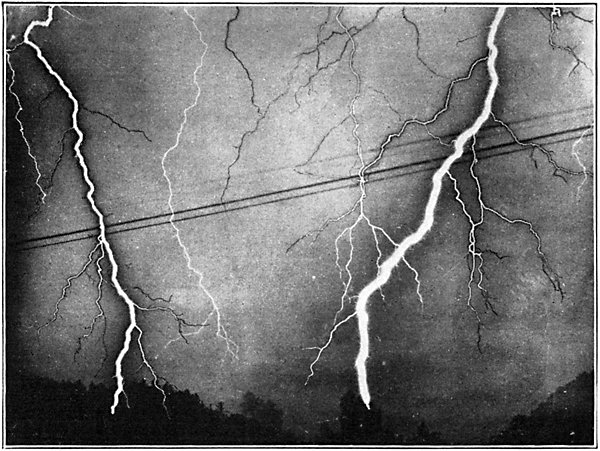
Photograph of Lightning, Showing “Black” Flashes.
(graph by F. Ellerman.)
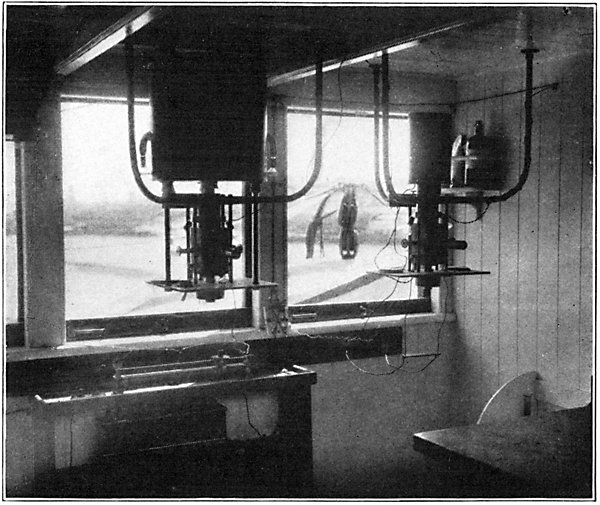
Atmospheric Electricity Instruments on Board the
“Carnegie.” Left: Penetrating radiation apparatus. Right:
active-content apparatus. Below: Arrangement for supplying
potentials to electroscopes and ionization chambers,
(Carnegie Institution.)
Occasionally, at times of great solar activity, part
of the ring actually overlies our Northern States, and
the aurora then becomes a magnificent spectacle in
this part of the world. The whole sky may be filled
with the shifting streamers, along which travel rapid
pulsations of light, so that the phenomenon then suggests
strongly what it really is—a vast electrical discharge
passing down through the atmosphere from
outer space. When the observer is thus surrounded
by the beams, they seem, on account of perspective,
to converge toward a point south of the zenith, where
they form a beautiful corona or crown. The position
of this crown depends upon the slant of the beams,
which, as already explained, follow the lines of force.
A brilliant aurora is always accompanied by disturbances
of the magnetic needle, which moves about
erratically, so that compasses can no longer be depended
upon. At the same time there are strong
“earth currents,” which interfere with the operation
of telegraph lines.
Observations with the spectroscope seem to show
that the light of the aurora is chiefly due to glowing
nitrogen, though the most prominent line in the
auroral spectrum has sometimes been referred to an
unknown atmospheric gas. The various colors seen
in bright auroras, including reds, greens, and yellows,
are believed by some authorities to depend upon
the varying speed of the electrical discharge. Experiments
with vacuum tubes show that nitrogen,
especially, gives great changes of color with changes
in the velocity of the discharge. Another interesting
revelation of the spectroscope is that there is162
apparently, a faint auroral illumination in the sky
at all times and in all parts of the world, the so-called
“permanent aurora.”
Photography has been used with great success in
studying the aurora, especially by the Norwegian
physicists Störmer, Vegard, and Krogness. Simultaneous
photographs of a single detail are taken from
two points several miles apart against a background
of stars. The apparent position of the auroral detail
among the stars will differ in the two pictures,
and a comparison of them makes it possible to determine
the actual position of the aurora in space. A
slow-moving cinematograph has also been used to
obtain series of pictures. The measurements of these
observers show that the base of the aurora is, generally
between 60 and 70 miles above the earth with
a strong tendency to assume a definite location at
an altitude of about 61 or 67 miles. Its upper limits
are not well defined, but it has been photographed
up to an altitude of more than 300 miles. Earlier
observers reported seeing the aurora at altitudes of
only a few miles, and even down to the earth’s surface,
but recent authorities are inclined to discredit
these observations.
One more phenomenon of atmospheric electricity
requires brief mention, viz., the electric waves that
produce the erratic disturbances known to wireless
telegraph operators as “strays” or “static.” As
heard in the receiver of a wireless outfit the noise of
strays has been described as “like hailstones beating
against a sheet of tin,” or “short hisses from a
steam pipe,” or “periodic discharges of coal down
a chute.” Another characteristic sound is a sharp
“click.” The study of strays has been carried out on
a world-wide scale by a committee of the British163
Association for the Advancement of Science, but
their nature is not yet fully understood. Some strays
are undoubtedly due to near or distant discharges of
lightning, and special forms of wireless apparatus,
known as “thunderstorm recorders” or “ceraunographs,”
have been used to give notice of the approach
of thunderstorms. On the other hand, strays
seem frequently to have no connection with thunderstorms,
and their principal origin is now sought in
electrical disturbances in the upper atmosphere, perhaps
similar to those which cause the aurora, and,
as in the case of the aurora, having their ultimate
source in the sun.
164
CHAPTER X
ATMOSPHERIC OPTICS
When we look up into the sky on a cloudless
day we behold a continuous canopy, the prevailing
color of which is blue. This canopy is a veil
that hides the starry hosts beyond, and its presence
seems, at first sight, incompatible with the fact that
the air is a transparent medium. We see the stars
by night through the same intervening atmosphere.
Why are they cut off from our sight by day? The
answer to this question can, perhaps, best be made
plain by a simple experiment. Place a lighted candle
behind a sheet hung across a room not otherwise
illuminated. The flame of the candle will be distinctly
visible through the sheet. Next, let the room
be brightly lighted, say with electric light or daylight.
The candle can now no longer be seen through
the sheet, owing to the bright illumination of the latter
as compared with the feeble light of the candle.
In the atmosphere the counterpart of our sheet is
a layer, several miles in depth, of minute particles,
which by day are lighted up by the sun. Some of
the particles are tiny dust motes, others are fine
droplets of water or bits of ice, and the rest are the
molecules of the atmospheric gases themselves. It is
the light that comes to us from these particles that
makes our eyes insensitive to the fainter light of the
stars, and makes the sky itself a visible luminous
vault.
165
Next, why is the clear sky generally blue, rather
than some other color? To answer this question,
we must recall the fact that sunlight is made up of
ether waves of many different sizes. In combination,
these waves produce upon our eyes the sensation
of white light. When they are separated, as by
passing through a prism, the smallest waves—or, in
more technical language, the vibrations of shortest
wave length—register the sensation of violet, and
the largest or longest waves that of red. The whole
sequence of colors runs in the order violet, indigo,
blue, green, yellow, orange and red (easily fixed in
the memory by means of the word VIBGYOR,
formed from the initial letters of these words).
Now the passage of sunlight through the atmosphere
is obstructed to a certain extent, not only by
suspended dust particles, but also by the molecules
of the air. Let us consider, first, the effect of air
molecules and of the finest dust particles, not much
above molecular size. These tiny objects have different
effects on light waves of different lengths.
The longest waves are little disturbed by them, just
as ordinary waves in water are little affected by a
floating cork, for instance. The shortest waves are
so small in proportion to the size of the obstacles
that they are diffused or scattered by them, as a tiny
ripple in water might be broken up by a floating cork.
It is this diffuse light, of short wave length, that
gives the sky its color. A large part of the violet
and indigo light is lost by further scattering before
it reaches the earth, leaving a preponderance of blue
in the sky as we see it. When the air contains a
considerable amount of suspended particles larger
than those above considered—whether in the form
of solid dust or crystals of ice or tiny droplets of166
water—light of all wave lengths is reflected by them,
and the sky looks white or grayish.
On account of the action of atmospheric particles in
filtering out the shorter light waves, as just described,
sunlight becomes relatively rich in red and orange in
passing through the air. When the sun is high, the
path of the sunbeams to the earth is short, and the
color of their light is but little affected. Near the
time of sunrise and sunset, however, sunlight comes
to us through a much greater extent of air, and the
filtering process is much more effective. Hence the
sunshine is both enfeebled and reddened when the
sun is near the horizon. The diffuse light of the sky
around the sun is filtered in the same manner, and
therefore is commonly red when the sun is low.
A gray sunset sky after a clear day is due to the
presence of water drops in the air, and indicates
conditions favorable for rain, since, unless the air
were saturated to a considerable altitude, the comparatively
warm sunshine of the afternoon would
favor evaporation rather than condensation of moisture.
A gray sunrise sky has, as a general rule,
just the opposite meaning. It often indicates the
presence in the air of water drops formed on dust
particles during the night, after the manner of dew,
because the upper air has been dry enough to permit
rapid radiation from the dust. These drops will
be speedily evaporated by the rising sun, and the
general dryness of the atmosphere will not favor
further condensation. Several familiar weather
proverbs are thus justified, e. g.:
Evening red and morning gray
Help the traveler on his way;
Evening gray and morning red
Bring down rain upon his head.
167
There are many other interesting optical phenomena
connected with sunrise and sunset, including,
first of all, the morning and evening twilight.
When the sun, or any other heavenly body, is only
a little below a clear horizon, it is still visible, on
account of the bending of its rays by the atmosphere.
This lifting effect, known as astronomical
refraction, amounts to about half a degree (at the
horizon), which is about equivalent to the apparent
diameter of the sun or moon. As the sun sinks farther
below the horizon, in the evening, the only daylight
that comes to us is that reflected from the upper
levels of the atmosphere, which are still illuminated.
This is called twilight, and it lasts until the sun is
about 18 degrees below the horizon, when total darkness
sets in. The period as a whole is sometimes
called astronomical twilight, in distinction from the
briefer period known as civil twilight, during which
there is light enough for outdoor occupations; the
latter lasts from sunset until the sun is about 6 degrees
below the horizon. Morning twilight is more
commonly called “dawn.”
An interesting succession of light and color
effects is observed before and after sunset and, in
inverse position and order, about sunrise. Considering
sunset only: After the sun has sunk out of
sight, a broad band of golden light, called the bright
segment, is seen along the western horizon. Above
this, in the western sky, appears a more or less circular
expanse of rosy glow, known as the purple
light. In the eastern heavens, after sunset, there
rises steadily from the horizon the so-called dark
segment, which is the blue or ashy shadow of the
earth on the sky. This is bordered above by the
pink or purplish antitwilight arch. As time goes168
on, the purple light in the west, after increasing in
brightness for a while, finally sinks behind the
bright segment; while in the east the rising dark
segment encroaches upon and finally obliterates the
antitwilight arch. Sometimes, in clear weather,
there is a fainter repetition of these lights and colors
(second purple light, etc.).
Among the Alps and other snow-capped mountains,
these sunset and sunrise phenomena assume a
particularly beautiful form, known as the Alpenglow.
In fine weather, just before sunset, the peaks
to the eastward begin to show a reddish or golden
hue. This fades gradually, but in a few minutes,
when the sun is a little below the horizon of the observer,
but the peaks themselves are still bathed in
direct sunlight, an intense red glow, beginning down
the slopes, moves upward to the summits. This is
identical with the antitwilight arch described above.
Presently this glow is succeeded by an ashy tint, as
the peaks are immersed in the rising shadow of the
earth (the dark segment). Their rocks and snows
assume a livid appearance, aptly described by the
inhabitants of Chamonix, whence the phenomena in
question are well seen on the summit of Mont Blanc,
as the teinte cadavéreuse. In ordinary weather
darkness succeeds without any further notable phenomena,
but occasionally there occurs a remarkable
renewal of rosy light upon the peaks, known as
the recoloration or afterglow. At Chamonix this is
termed the “resurrection of Mont Blanc.” The afterglow
has been variously explained, but it is probably
due, mainly at least, to the reflection of the purple
light in the western sky. Sometimes it lasts until
an hour after sunset, and it passes away from below
upward. On very rare occasions there is a second169
afterglow, presumably the reflection of the second
purple light mentioned above. Similar phenomena
are often seen in reverse order at sunrise.
A pretty phenomenon observed chiefly in the late
afternoon and early morning consists of beams of
light radiating from the sun, known technically as
crepuscular rays. The beams are made visible by
the presence of abundant dust or water droplets in
the atmosphere, and the intervening dark spaces are
the shadows of clouds. When the sun is above the
horizon and the beams are directed downward, the
phenomenon is popularly described as “the sun
drawing water” and is regarded as a sign of rain.
Sailors call these beams the “backstays of the sun,”
and they have several other names based upon the
legendry associated with them in different parts of
the world. After sunset or before sunrise a fanlike
sheaf of the beams often extends upward from
the western or eastern horizon, respectively. The
Homeric expression “rosy-fingered dawn” probably
refers to this phenomenon. In all cases the apparent
divergence of these beams is an effect of
perspective, as they are really parallel. A rarer
phenomenon is that of anticrepuscular rays, which
appear to converge to a point opposite the sun. In
this case the beams and shadows are projected entirely
across the sky, but their paths can very seldom
be traced in the upper part of the heavens because
in this direction the observer’s line of sight
passes through a comparatively shallow extent of
dusty atmosphere.
An analogous phenomenon is seen in the shadows
which near-by isolated mountain peaks frequently
cast upon the sky opposite the sun at sunrise and
sunset. Travelers have described such shadows cast170
by Adam’s Peak in Ceylon, Pike’s Peak in the Rocky
Mountains, and Fujiyama in Japan. The phenomenon
is said to be especially striking in the polar
regions, where the air is often heavily charged with
particles of ice.
One more optical phenomenon of sunrise and sunset
that requires mention here seems to be comparatively
little known to the nonscientific public,
notwithstanding the fact that it has supplied the
subject and title of a diverting novel by Jules Verne.
The conditions required for its appearance are a
clear and steady atmosphere and a sharply defined
horizon, such as that of the ocean. At the instant
the sun is appearing or disappearing, and when
only a very small segment of its disk is visible above
the horizon, this portion appears to be colored a
bright emerald green, sometimes blending into blue.
This transient phenomenon is known as the green
flash. It is best explained as due to the different
degrees of refraction undergone by rays of different
wave lengths coming to us from the sun. The effect
of refraction in elevating the solar image as a whole
when near the horizon has already been mentioned.
This effect is a little greater for the green and blue
rays than for the orange and red. It is still more
pronounced for the violet and indigo rays, but these
are mostly sifted out of the solar beams in their long
passage through the atmosphere when the sun is
low. Hence at the upper edge of the solar image
there is a narrow green or blue fringe, which is not,
however, perceptible except when a screen is interposed
between the eye and the bright image of the
sun. A sharp horizon furnishes such a screen.
Through a telescope it is possible, in suitable
weather, to see the green flash—and also a corresponding171
“red flash” at the lower edge of the sun—by
placing an opaque diaphragm in the focal plane
of the object glass. Another explanation of the
green flash—which could, however, account only for
its appearance at sunset and not at sunrise—is that
it is a physiological effect; the eye, fatigued by the
reds and yellows that predominate in the light of the
setting sun, sees an “after image” of complementary
hue the instant after the real image has disappeared.
We now turn to a group of phenomena, also due
to atmospheric refraction, which includes some of
the most bizarre of optical illusions. The simplest
of these phenomena consists of a slight apparent
elevation of all objects in the surrounding landscape
through terrestrial refraction, which is identical in
principle with astronomical refraction and depends
upon the difference in density, and hence of refractive
power, of the air at different levels above the
earth.
Normally the air decreases in density at a nearly
regular rate with increasing altitude. Sometimes,
however, this change in density is greatly modified by
local effects of temperature. Over a cold surface of
land or water the adjacent air may be abnormally
dense, resulting in an unusually rapid decrease of
density with altitude. Over a hot surface, as in the
case of a desert under strong sunshine, the adjacent
air may become so much rarefied that, for a certain
distance upward, there is actually an increase of
density with ascent, instead of the reverse. The
rays of light coming to us from distant objects are
bent in different directions and to various degrees
by virtue of these abnormalities in the density of
the atmosphere. The apparent positions of such objects
depend upon the angle at which the light rays,172
coming from them, strike the eye of the observer.
Sometimes the objects appear to be lifted far above
their true positions (a phenomenon known as looming)
and sometimes depressed far below them; and
occasionally local irregularities in air density produce
curiously distorted images of these objects.
Most of these strange effects are known collectively
as mirage. There are many varieties. There
is the “desert mirage,” first made famous through
the experience of Napoleon’s soldiers in Egypt.
There are mirages that suspend the images of remote
objects in the sky; sometimes inverted, sometimes
right side up. There is the lateral mirage,
occasionally seen when one looks along the face of
a heated wall or cliff. Lastly, there are the complex
displacements and distortions of objects known as
the Fata Morgana—a name originally applied to a
phenomenon of this kind visible, on rare occasions,
at the Straits of Messina, but now used generically
for similar appearances in other parts of the world.
Some of the finest examples of Fata Morgana are
witnessed in the polar regions.
In the desert mirage an image of the lower part
of the sky is brought down to earth and simulates
the appearance of water, while the images of terrestrial
objects, also depressed and inverted by the
mirage, look like the reflections of the same objects
upon the liquid surface. Humphreys says: “This type
of mirage is very common on the west coast of
Great Salt Lake. Indeed, on approaching this lake
from the west one can often see the railway over
which he has just passed apparently disappearing
beneath a shimmering surface. It is also common
over smooth-paved streets, provided one’s eyes are
just above the street level.” The confusing and obscuring173
effects of the desert mirage were illustrated
during the fighting between the British and Turks in
Mesopotamia, in April, 1917, when, according to
the report of General Maude, a battle had to be suspended
on account of one of these optical disturbances.
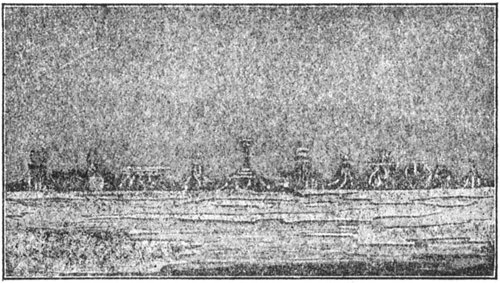
FATA MORGANA ON THE COAST OF GREENLAND
(From drawing by Scoresby)
The strong vertical contrasts in air temperature
that occur in the polar regions produce many remarkable
examples of mirage. The pictures and
descriptions of those observed a century ago along
the coast of Greenland by Captain William Scoresby,
Jr., have become classical. A recent episode connected
with mirage was the expedition sent north
in 1913 to explore “Crocker Land,” which Peary believed
he had sighted from an elevated point in
Grant Land in 1906, and which for a time figured on
all maps of the Arctic. The later explorers found no
land at the place indicated, but they observed the
same mirage that Peary had mistaken for distant
hills and mountains.
174
Currents of air of different densities produce,
through their varying effects on atmospheric refraction,
the twinkling or scintillation of the stars, as
well as of distant terrestrial lights. Twinkling is
much more violent near the horizon than near the
zenith, and more pronounced on some nights than
others. The shimmering of the air over heated surfaces
faces and the “boiling” of celestial objects as seen
in the telescope are analogous phenomena.
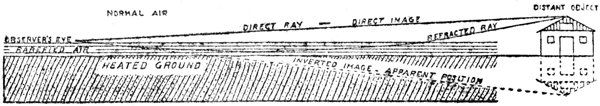
(From American Museum Journal. Drawing by Chester A. Reeds.)
Out-of-doors when a layer of warm rarefied air arises from contact
with heated ground or warm water, occupying a position below the
colder, more dense normal air, two images of a distant object may be
seen—one inverted beneath the other. This is “inferior mirage” and is
explanatory of the appearance of trees and their reflections, which haunts
the desert traveler with the hope of water.
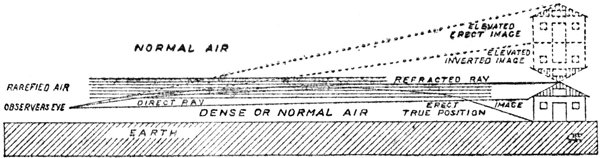
(From American Museum Journal. Drawing by Chester A. Reeds.)
When a zone of warm rarefied air is sandwiched between normal air
above and colder air below, a “superior mirage” of distant objects may
be seen. Three images are produced, one above the other, the middle one
inverted.
In the refraction phenomena that we have thus
far considered the air is the medium in which the
light rays are bent and distorted. In the production175
of the rainbow, light undergoes refraction, dispersion
(separation of the spectral colors) and reflection
by passing through drops of water in the
atmosphere; especially falling raindrops.
The rainbow, perhaps because it is such a common
sight, is seldom observed with careful attention.
Hence few people realize that there are many varieties
of this beautiful meteor, and various erroneous
ideas about it are prevalent. The rainbow is always
seen in the part of the sky opposite the sun—or
the moon, in the case of the lunar rainbow—and is
high in the heavens when the luminary is low, and
low when the luminary is high. Generally less
than a semicircle of the bow is visible, and never
more, except from an eminence. (Aeronauts occasionally
see a complete circle.) The outer border
of the bow is red and the inner blue or violet.
Contrary to popular belief and to statements sometimes
found in reference books, it is almost never
possible to distinguish all seven of the spectral
colors in a rainbow; four or five is the usual
limit.
The ordinary or primary rainbow has a radius of
about 42 degrees at its outer edge. Very commonly
a secondary rainbow is seen, concentric with the primary
bow, and having a radius of about 50 degrees.
The secondary is fainter than the primary, and its
colors are in opposite order—red inside and violet
outside. Additional bands of color, chiefly red and
green, may often be detected adjacent to the inner
edge of the primary bow and, less frequently, along
the outer edge of the secondary bow. These are
known as supernumerary bows. The space between
the primary and secondary bows is somewhat darker
than the rest of the sky.
176
The common rainbows differ much among themselves
in the number and purity of their colors, the
width of the bows, etc., these differences depending
especially on the size of the raindrops. The minute
drops of a fog sometimes give rise to a bow that
is almost devoid of color—the “white rainbow,” or
“fog bow.” The rainbows produced by the moon
commonly show little color, on account of the relative
faintness of the light, but the brighter lunar rainbows
are often very distinctly colored.
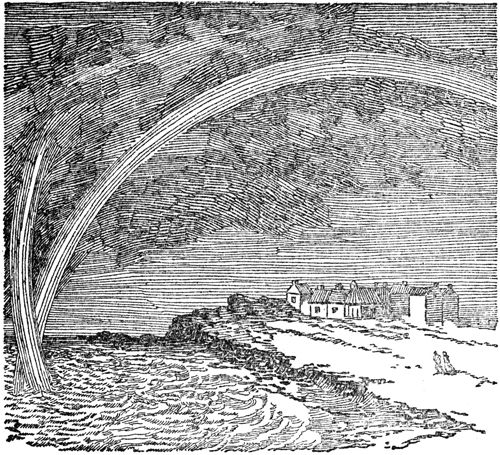
INTERSECTING RAINBOWS
(After a sketch by T. Hodge. Courtesy of Scientific American.)
Reflected rainbows are sometimes seen upon a
sheet of water; and again the image of the sun, as177
reflected by such a surface, may give rise to both
primary and secondary rainbows in the sky, which
appear to intersect those produced by the sun directly.
A horizontal layer of water drops below the
level of the observer’s eye occasionally produces the
so-called horizontal rainbow. This may be formed
over a bedewed field or other surface (the “dew
bow”); or the drops may be those of a low-lying
sheet of fog, or of water deposited on a floating film
of oil, or, finally, actual raindrops, seen from an elevation,
such as the summit of a mountain. Horizontal
rainbows formed by rain have been seen from
the Eiffel Tower.
The common saying,
A rainbow in the morning
Is the shepherd’s warning;
A rainbow at night
Is the shepherd’s delight,
is, on the whole, well justified for the following reasons:
We see the rainbow where rain is falling,
while the sun is shining in the opposite part of the
sky. Our rainstorms usually come from the west
and pass away to the east. A morning rainbow can
only be seen in the west, and indicates that rain is
approaching us. An evening rainbow (ignoring
lunar bows) is seen only in the east, and shows that
the rain area is receding from us, giving place to
clear skies.
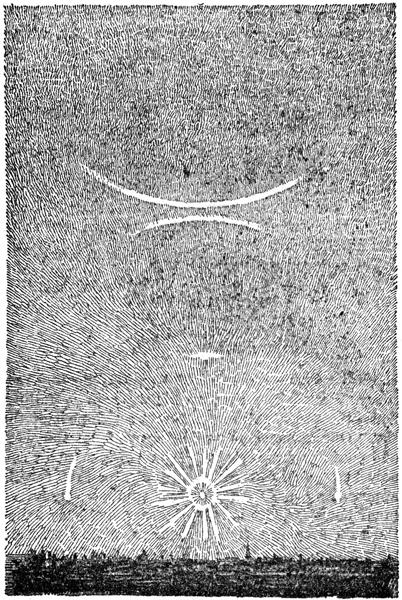
THE CIRCUMZENITHAL ARC
(From a drawing by L. Besson in La Nature.)
Parts of the halos of 22° and 46°, upper tangent arc of the 22° halo,
and two parhelia are also shown. The circumzenithal arc is always
brightly colored.
Ice crystals in the atmosphere, such as those composing
the higher clouds, produce a great variety of
optical phenomena, known as halos. Some phenomena
of this class are common, others exceedingly rare.
Moreover, there are several theoretically possible
forms of halo of which observations have never yet179
been reported, so that halo observing can be recommended
to the amateur meteorologist as offering
opportunities for making interesting discoveries.
Halos take the form of narrow rings of definite
angular size around the sun or moon (not to be confused
with the coronas, of variable dimensions, described
below), rings passing through the luminary,
arcs in various other positions, and roundish spots
of colored or white light. They may be seen separately
or in combination. In rare cases, a dozen or
more different forms of halo are visible at the same
time, producing a most spectacular display. One of
the most remarkable displays of this kind in the
history of science was seen, in different degrees of
development, over the eastern United States on
November 1 and 2, 1913; an event which greatly
stimulated interest in the study of halos in this
country. Complex halos are quite common in the
polar regions; where they are seen not only in the
sky, but also in the air, charged with ice particles,
close to the earth.
Whenever a thin veil of cirrus or cirro-stratus
clouds overspreads the sky there is a likelihood that
halos will be visible. Those formed near the sun,
however, frequently pass unnoticed, on account of the
dazzling brightness of that luminary. Smoked or
tinted glasses greatly facilitate their observation.
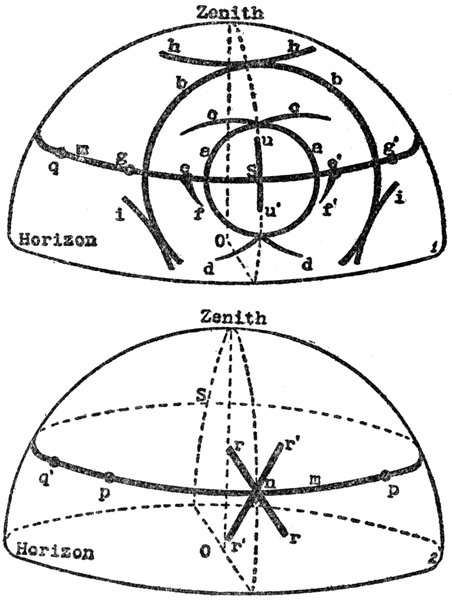
DIAGRAMS OF THE PRINCIPAL FORMS OF HALO
(After Besson, Monthly Weather Review, July, 1914.)
1. (Upper). Perspective view of the sky, showing the sun (S); ordinary
halo of 22° (a); great halo of 46° (b); upper tangent arc of the halo of
22° (c); lower tangent arc of the halo of 22° (d); ordinary parhelia of
22° (e, e’); Lowitz arcs (f, f′); parhelia of 46° (g, g′); circumzenithal
arc (h); infralateral tangent arcs of the halo of 46° (i); the parhelic
circle (m); a paranthelion of 90° (q); light pillar, (u, u′); the observer
(O). 2. (Lower). Perspective view of the sky, showing the observer
(O); the parhelic circle (m): ordinary paranthelia of 120° (p); the
paranthelion of 90° (q’); the oblique arcs of the anthelion (r, r′); and
the anthelion (n).
The commonest halo is a circle of 22 degrees radius
(the 22-degree halo) about the sun or moon. When
formed by the sun it generally shows a distinct reddish
inner border and traces of other spectral colors.
The lunar 22-degree halo usually appears colorless.
This halo is visible, in whole or in part, to the attentive
observer about once in three days, on an average.
Less common, but by no means rare, are the parhelia180
or “sun dogs” of 22 degrees (called paraselenæ or
“moon dogs” when formed by the moon), the beautiful
circumzenithal arc, and a few other members of
the halo family. Most forms of halo are so uncommon181
that their appearance is an event of some scientific
importance.
The accompanying diagrams, by Dr. Louis Besson
of the Observatoire de Montsouris, show the positions,
with respect to the sun (or moon), of the majority
of known halo phenomena. The upper
diagram shows the halos that occur on the same side
of the sky as the sun (or moon), and the lower those
that appear on the opposite side. Most of these halos,
when bright, show the spectral colors. The circumzenithal
arc, h (commonly described, by the uninitiated,
as a “rainbow”), and the parhelia of 22
degrees, e, e′, are especially brilliant in their coloration.
The parhelic circle, m, which sometimes extends
entirely around the sky, is white, and so are
a few of the rarer forms of halo.
The upper and lower tangent arcs of the halo of 22
degrees, c and d, undergo striking alterations, with
changes in the altitude of the sun. When the luminary
is more than about 40 degrees above the horizon,
these two arcs become joined at their tips to
form the circumscribed halo, and at still greater
solar altitudes this halo contracts from an elliptical
to a circular form, thus blending into the 22-degree
halo as shown on the next page, where the
solar altitudes corresponding to the different forms
of the halo are indicated. The positions of the parhelia
of 22 degrees, e, e′, also depend upon solar altitude.
When the sun is on the horizon these “sun
dogs” are 22 degrees from the luminary, and therefore
lie in the 22-degree halo; at greater solar altitudes
they lie outside this halo.
The reader who wishes to acquaint himself further
with the different forms of halo and the methods
of observing them will find a comprehensive182
article on the subject (devoid of mathematical discussions)
in the “Monthly Weather Review” (Washington,
D. C.) for July, 1914.

SUCCESSIVE STAGES OF THE UPPER AND LOWER TANGENT ARCS
OF THE 22° HALO
When the sun is high they unite to form the “circumscribed halo.”
(Altitude of sun shown in the center of each figure.)
The ice crystals that produce halos consist of
hexagonal plates or columns, occasionally including
complications of structure, such as pyramidal bases,
combinations of plates and columns, etc. These
have the well-known effect of prisms in refracting
and dispersing light that passes through them. It is
evident that there are many possible paths for the
light rays through the sides and bases of such crystals,
resulting in different deflections and corresponding
differences in the forms and positions of
the halos produced. The attitudes assumed by the
crystals as they slowly sink through the air, and the183
oscillations they undergo, are further points to be
considered in working out the theory of each form
of halo by the application of the laws of optics.
Nearly all the known forms have been fully explained.
A few species of halo—notably the parhelic
circle (called paraselenic circle when formed
by the moon)—are due to simple reflection from the
faces of the ice crystals, and not to refraction.
The last group of optical phenomena that we shall
consider consists of those due to the process called
diffraction, which occurs when light is bent around
objects in its path, instead of passing through them,
as in refraction. The process involves separation
of the prismatic colors. The diffraction phenomena
of the atmosphere are produced by the water drops
of clouds and fog, or sometimes by fine dust.
Everybody is familiar with the nocturnal spectacle
which Tennyson describes as
... the tender amber round
Which the moon about her spreadeth,
Moving thro’ a fleecy night.
This diffuse reddish or rainbow-tinted circle is
called a corona. It occurs about the sun as well as
the moon (though not easy to see on account of the
glaring brightness of the luminary), and also about
street lamps and other terrestrial lights when
viewed through a misty atmosphere. Unlike the
halos, it has no definite angular size. It is usually
only a few degrees in radius. Small coronas are
produced by large water drops and large coronas by
small drops, while the largest of all coronas, known
as Bishop’s ring, is due to exceedingly fine dust in
the atmosphere, and has been seen after great volcanic
eruptions.
184
In its commonest form the corona consists of a
brownish-red ring, which, together with the bluish-white
inner field between the ring and the luminary,
forms the so-called aureole. If other colors are distinguishable,
they follow the brownish red of the
aureole (in the direction away from the luminary)
in the order from violet to red; the reverse of the
order seen in halos. Sometimes the sequence of colors
is repeated three or four times.
Patches and fringes of iridescence are sometimes
seen in the clouds at a greater distance from the
luminary than that of the ordinary corona. Probably
they are fragments of coronas of unusual size
produced by exceedingly fine cloud particles.
Similar in appearance to the corona is the glory;
a series of concentric colored rings seen around the
shadow of the observer, or of his head only, cast
upon a cloud or fog bank. Such a shadow, with or
without the glory, constitutes the specter of the
Brocken, often seen from mountain tops and from
aircraft. The colored circles are sometimes called
Ulloa’s rings, from the name of a Spanish savant
who observed the phenomenon among the mountains
of South America in the eighteenth century and has
left us a vivid description of it.
The Brocken specter, though it owes its name to
legends associated with the famous German mountain
where witches were once believed to assemble
on Walpurgis Night, is actually less frequently witnessed
there than in many other parts of the world.
Whenever the sun is low on one side of a mountain
and a wall of mist arises from a near-by valley
on the other, the mountaineer is likely to see his
shadow upon the mist. If the latter consists of fine
droplets of approximately uniform size, the colored185
rings will probably appear, and occasionally there
is also a white fogbow outside of the glory. As all
shadows cast by the sun taper rapidly (on account
of the angular breadth of the solar disk), a well-defined
Brocken specter can never be more than a
few yards away from the observer. Its distance is,
however, commonly overestimated—some observers
have supposed it to be miles away!—and hence the
erroneous idea prevails that the specters are of
enormous size.
Rarely from a favorable point of vantage on a
mountain, and very frequently from aircraft, the
specter, instead of being seen on a vertical wall of
mist when the sun is low, appears on a horizontal
sheet of cloud below the observer when the sun is
high. The aeronaut may thus observe the complete
outline of his balloon or aeroplane, encircled with the
rainbow tints of the glory. During the World War
the appearance of the luminous rings was likened
to the emblem painted on the wings of the Allied
aeroplanes and was regarded by superstitious aviators
as an omen favorable to their cause.
The glory is due to the light that is reflected back
to the observer after penetrating the cloud or fog
a little way and is diffracted by the superficial layer
of drops in emerging.
The Brocken specter and the glory have occasionally
been photographed.
186
CHAPTER XI
ATMOSPHERIC ACOUSTICS
Though air is but one of an unlimited number
of elastic substances that transmit sound, it is the
one through which sounds ordinarily reach our ears.
Hence the acoustic properties of the atmosphere are
of great interest to mankind.
Science deals with several kinds of “waves,” and
those of the atmosphere that produce the sensation
of sound are quite different from the waves of the
sea. In quiet unconfined air sound travels in concentric
spherical waves, consisting of successive condensations
and rarefactions of the medium. Sound
is not transmitted through a vacuum. A familiar
laboratory experiment is to install an electric bell inside
the receiver of an air pump and notice the dying
away of the sound as the air is exhausted. The
colossal eruptions that astronomers witness on the
surface of the sun would probably be audible on earth
if interplanetary space were filled with air. In the
rarefied air of high mountains the intensity of sounds
is much reduced. Thus we are told that on the top of
Mont Blanc the report of a pistol sounds no louder
than that of a firecracker at sea level.
The speed with which sound travels through air
depends upon the temperature. At 32° F. (the freezing
point) it is 1,087 feet per second, and at 68° F.
it is 1,126 feet per second. The increase of speed
with increase of air temperature is very close to 2187
feet per degree Centigrade, or a little more than 1
foot per degree Fahrenheit. The sounds of violent
explosions travel considerably faster than ordinary
sounds near the place of explosion, but slow down
to the normal speed at greater distances. This is true
of heavy claps of thunder. The effect is not important
enough, however, to invalidate the well-known
rule that, if you count seconds between the
flash and the detonation and divide the result by 5,
you get approximately the distance of the source of
sound in miles.
Since the speed of sound varies with the temperature
of the air, differences in the latter cause deviations
of the paths of sound waves similar to the
deviations which rays of light undergo on account of
differences in the density of the air. Sound is also
reflected by obstacles, in the same manner as light.
Moreover, whereas light travels too swiftly to be
affected by the wind, this is not true of sound. The
latter travels faster with the wind than against it,
and sound waves are more or less broken up by the
gusts and irregularities that are a feature of most
winds near the earth’s surface. For all these reasons
the acoustic qualities of the air are subject to marked
variations, as everybody has observed.
Unusual audibility of distant sounds is a popular
prognostic of rain. The fact underlying this belief
is that when the air is full of moisture it is likely to
be of uniform temperature, and therefore favorable
for transmitting sound.
It is impossible to assign any limit to the distance
at which loud sounds may occasionally be heard. No
fact of nature has yet, so far as we know, matched
Emerson’s metaphor of the “shot heard round the
world,” but it is literally true that the sounds of188
eruption of Krakatoa, in August, 1883, were heard,
like the roar of distant heavy guns, in the island of
Rodriguez, in the Indian Ocean, 3,000 miles from
the volcano. Moreover, the atmospheric waves set
up by this outburst actually made the circuit of the
globe, not only once, but at least three times, and the
successive journeys were registered by barometers,
if not detected by human ears. During the World
War gun firing in Flanders was very commonly heard
at places in England 140 to 150 miles distant. Several
observers also reported that pheasants appeared,
from their disturbed behavior, to hear cannonading
over the North Sea that was beyond the range of the
human ear.
Writers have often commented on the fact that
thunder cannot be heard so far as the sounds of
artillery. It has been affirmed that 10 miles or
thereabouts is its maximum range of audibility.
As a matter of fact, however, thunder has occasionally
been heard at much greater distances,
up to 20 or 30 miles; but it remains true that the distance
is always much less than that at which loud
terrestrial sounds are audible. The reasons why this
should be so are not far to seek. In the first place,
the intensity of a sound depends upon the density of
the air in which it is generated, and not upon that of
the air in which it is heard. The air, as we know,
diminishes in density upward. Balloonists thousands
of feet above the earth hear with remarkable clearness
sounds from the ground below, but people on the
ground cannot hear similar sounds from the balloon.
As thunder is mainly produced at the level of the
clouds, it is subject to this peculiarity. Again, cannonading
is heard at great distances only when the
air is comparatively calm, and perhaps only when it189
is arranged in well-defined horizontal layers of such
a character as to keep the sound from spreading far
aloft. Very different conditions prevail during a
thunderstorm; in fact the conditions are then
just such as would scatter and dissipate the sound
waves. Lastly, the noise of a cannon or the like
comes from a single place and the energy of the
disturbance is concentrated to produce a single
system of sound waves; while the disturbance
due to lightning is spread over the long path of
the discharge.
The audibility of sounds at abnormally great distances
is not usually a matter of practical importance,
but the converse phenomenon—the failure of
sounds to carry to normal distances—has been responsible
for a great number of marine disasters on
such fog-ridden coasts as those of the British Isles,
eastern Canada and California. Hence some of the
ablest physicists of both the Old World and the New
have tried to ascertain the conditions under which
this phenomenon occurs.
The scientific study of fog signals, dating especially
from Tyndall’s well-known investigations at the
South Foreland, in England, in 1873, and those of
General Duane and Professor Joseph Henry in
America, begun somewhat earlier but continued contemporaneously
with Tyndall’s, has probably raised
more questions than it has answered. The caprices
of these signals take the shape of variations in the
range of audibility—a signal may at one time carry
10 miles and at another only 2—and the formation
of “zones of silence,” comparatively near the signal,
within which the sound is not heard though audible
at much greater distances. The silent zones are
sometimes more or less permanent and are then generally190
due to peculiarities of topography; but in
many cases they are transient and opinions differ as
to their cause or causes. Since it is only when fog
prevails that fog signals are sounded (except for
experimental purposes), and that vessels meet with
accidents on account of the failure to hear such signals,
the idea has become rooted in the public mind
that these acoustic eccentricities are entirely due
to fog. When, however, experiments are made in
clear weather, similar phenomena are observed.
In foggy weather audibility is often better than
the average, because fog prevails chiefly when the
air is still and of uniform temperature, and such
conditions favor the transmission of sound. Tyndall
strongly denied that either fog or falling rain, snow,
and hail have, as has been commonly believed, a
muffling effect on sound, and he attributed the peculiar
behavior of fog signals to the presence in the
atmosphere of invisible “acoustic clouds,” consisting
of patches of air containing irregularities of
temperature and humidity. To the same cause
he ascribed the occurrence of mysterious “aerial
echoes,” not due to any visible object. Several recent
investigators have disputed these conclusions.
Thus it is asserted that when the fog signal is in
fog and the observer in a clear atmosphere, or vice
versa, or when the signal and the observer are in
different fog banks, the fog reflects the sound very
strongly. Apart from the possible effects of fog
itself, the very extensive investigations made by
Prof. L. V. King, of McGill University, at Father
Point, Quebec, led him to conclude that the effects
are chiefly due to eddies in the atmosphere. Prof.
King used in his observations the latest devices for191
obtaining exact measurements of sound and such up-to-date
meteorological apparatus as pilot balloons
for measuring the wind at various levels. He discovered,
among other things, that existing types of
fog-signal machinery are very wasteful of energy,
and he has pointed out how their “acoustic efficiency”
may be much improved. Before we dismiss
this subject it should be noted that submarine bells
and the radio compass have made mariners much
less dependent than they formerly were upon the
types of signals that are affected by meteorological
conditions.
“Zones of silence” on a much more extensive scale
than those that disturb the operation of fog signals
have been frequently observed, in recent years, in
connection with great explosions, cannonading, and
volcanic eruptions. The first case of this kind to
attract scientific notice was that of a dynamite
explosion at Förde, Westphalia, on December 14,
1903, the acoustic phenomena of which were investigated
by Dr. G. von dem Borne; and among the
many cases that have since been studied was that
of the bombardment of Antwerp in October, 1914.
Without describing these various cases separately,
we may state that when reports were collected from
the surrounding country to determine the places at
which the sounds were audible and these reports
were entered on a map, it was found that there was
a large and usually very irregular area of audibility
surrounding the source of sound, beyond which lay
a broad, more or less circular zone of inaudibility,
and finally, beginning about 100 miles from the
source, there was a second large region of audibility,
extending perhaps 150 miles from the source. In
some cases a single sound at the source gave multiple192
reports (double, triple, or quadruple), chiefly
in the outer zone of audibility.
In his attempt to explain these curious silent zones,
Von dem Borne pointed out that the atmosphere at
very high levels is supposed to consist mainly of
hydrogen, in which sound travels nearly four times
as fast as in the common gases of the lower air, and
that sound waves ascending to such heights along
a slanting course would be bent strongly toward the
earth. Another student of this phenomenon, Dr. A.
Wegener, who is the champion of the idea that the
atmosphere contains an unknown gas lighter than
hydrogen (called “geocoronium” or “zodiacon”),
sees in the prevalence of this gas at high levels the
cause of a similar quasi-reflection of sound waves.
Probably the majority of investigators, however,
believe that the effect is due chiefly or entirely to
the refraction of sound by wind.
Of acoustic phenomena that belong especially to
the domain of meteorology, probably thunder is the
one that excites most general interest. The sudden
expansion of the air along the path of a lightning
discharge, due partly but probably not entirely to
the heat generated, appears to be an adequate explanation
of the explosive sound of thunder, though
somewhat different explanations have been suggested.
If the discharge is near at hand, we generally
hear a single loud crash. More distant lightning
is usually attended by rumbling. The common
and obvious explanation of rumbling is that it is
due to the arrival of the sound progressively from
different points along the path of discharge, which
may be a mile or more in length. A crooked path
would account for reenforcements and diminutions
of the sound. Another cause of irregularities in the193
sound is probably “interference” (combinations of
waves that tend either to strengthen or to neutralize
each other), especially in the case of multiple lightning
discharges, such as we have described elsewhere.
Lastly, thunder is further complicated by
echoes from the ground and probably also from the
air (not exclusively from clouds), though much uncertainty
prevails concerning these aerial echoes.
The sounds of thunder have been the subject of some
interesting investigations on the part of an Austrian
meteorologist, Dr. Wilhelm Schmidt, who has
devised apparatus for making an automatic registration
of the sound waves that constitute a thunderclap.
He finds that there is a great preponderance
of waves of very long period, including many of too
low a pitch to be audible, though perceptible through
the rattling of windowpanes, etc. In fact, the greater
part of the energy involved is represented by these
long, inaudible waves, so that one really hears only
a small part of a clap of thunder.
The statement has often been made, on the
authority of Humboldt, that thunder is never heard
at sea, at any point far from land. This matter was
investigated by the magnetic survey yacht Carnegie
during a long cruise in the Pacific in 1915. Of twenty-two
displays of lightning, six were accompanied by
thunder.
The late war gave prominence to certain acoustic
phenomena which, though hardly mysterious, were
novel to the world at large. One of those was the
double report (triple in the case of an exploding
shell) heard near the line of fire of large guns.
This effect is due to the fact that modern projectiles
travel much faster than sound. The moving projectile
sets up its own waves in the air, like those194
at the bow of a steamer, which may reach the ear
of the observer and produce the sensation of a sharp
sound before he hears the sound coming from the
mouth of the gun. Another phenomenon frequently
observed when heavy firing was in progress was the
appearance in the sky of rapidly moving parallel
arcs of light and shade. These were generally seen
against clouds, but sometimes they swept across
blue sky. They probably occurred only in calm
weather. These arcs were the result of the successive
condensations and rarefactions of the air
constituting waves of sound—visible sound waves.
Their visibility was due to contrasts in the refraction
of light passing through air of different
densities; the same sort of refraction contrasts that
cause the tremulous appearance of the air over a
hot stove, for example. The same “flashing arcs”
of light have been described by Prof. F. A. Perret
as attending explosive volcanic outbursts at the
craters of Vesuvius and Ætna.
The humming of telegraph wires has been the
subject of a certain amount of discussion in meteorological
circles, but without altogether satisfactory
results. This sound is not, of course, caused or
affected by the electric currents passing along the
wire, and it is almost certainly due solely to the
wind, though the suggestion has been made that it
might be caused by the microseisms, or small and
rapid earthquake tremors, that are so commonly
registered by seismographs while imperceptible to
the human senses. The humming is best heard
when one’s ear is placed against a telegraph pole.
Several persons have made systematic observations
of these sounds from day to day, and it has often
been alleged that they vary with the temperature,195
the movements of storms, etc., and even constitute
a safe basis for weather predictions. They are
sometimes heard when the air appears to be perfectly
calm, but in such cases there might be some
movement of the air at the level of the wires, though
there was none at the lower level of the observer.
From what is known about “æolian tones” (such as
those of the æolian harp), it would seem that the
humming requires a wind more or less at right
angles to the wire, and that the pitch of the sound
depends upon the force of the wind and the diameter
(but not the length or tension) of the wire. For a
given wire, the stronger the wind the higher the
pitch of its sound.
Of all the sounds that haunt the air, probably the
most mysterious are those which are best called by
the generic name “brontides” (coined, in the Italian
form brontidi, by Prof. Tito Alippi from two Greek
words meaning “like thunder”), though they rejoice
in scores of other names in various parts of the
world. Brontides take the form of muffled detonations,
resembling the sound of distant cannon or
peals of thunder, and are heard chiefly in warm,
clear weather. The first systematic investigations
of these phenomena were made in India. The fact
that they were frequently reported from the neighborhood
of Barisal, a town in the Ganges delta, led
to their being called “Barisal guns,” under which
name they were first made known to European science
in 1890. A few years later they were discussed
in an extensive memoir by E. van den Broeck,
who had collected numerous reports of their occurrence
in Belgium, especially on the seacoast, where
they are known as “mistpoeffers” (i. e., “fog belchings”
or “fog hiccups”). The majority of descriptions,196
however, have come from Italy, where the
sounds appear to be extremely common, though
peculiar to certain localities, and where they bear
a great variety of names. In Australia the noises
are called “desert sounds,” in Haiti, “gouffre,” etc.
They have been reported from parts of the United
States, including California and, above all, from the
vicinity of Moodus, Conn., which owes its original
Indian name, Morehemoodus (“place of noises”), to
the brontides which appear to have formerly been
much more common there than they are to-day.
There is a reference in one of Lord Bacon’s works
to “an extraordinary noise in the sky when there is
no thunder”; apparently a description of brontides.
The source of these sounds is undoubtedly subterranean
in a great many cases, though perhaps not in
all. Prof. W. H. Hobbs, who has made a painstaking
study of the seismic geology of Italy, concludes
that the brontides of that country are due to the
slow settling of the blocks of the earth’s crust; a
process which, in its more abrupt and violent phases,
causes definite earthquakes. Alippi believes that in
order that the sounds may be heard they must be
reenforced by a peculiar configuration of the
ground, above or below the surface, and he attaches
special importance to the effects of caverns, which
he suggests act as resonance boxes in the production
of audible brontides. Occasionally an apparent
brontide may be due to the explosion of an unseen
meteor. Lastly, a certain proportion of these thunderlike
sounds, if not merely distant thunder, may
be such noises as cannonading, blasting, or the like,
made audible at unusual distances by the refraction
of sound waves.
197
CHAPTER XII
CLIMATE AND CLIMATES
Some day the meteorologists of the world will
join forces to produce a great encyclopædia of
climate. No work of science is more sorely needed,
but the magnitude that it would, ideally, assume is
simply staggering.
Few people realize the multiplicity and complexity
of climates. It is a common occurrence for a prospective
traveler or a business man to write to a
meteorological establishment requesting, for example,
a description of the climate of South America.
Of course, no such thing exists. A continent does
not have a climate, but a multitude of climates.
Even to set forth, in general terms, the more important
types of climate that prevail between
Cape Horn and Panama is no small undertaking.
Moreover, general descriptions often fail to supply
the needs of those who make inquiries about
climate.
Suppose, instead of the wholesale order above
mentioned, the meteorologist receives the relatively
modest request to describe the climate of Buenos
Aires or Rio de Janeiro. Is it easy to comply with
such a request? That depends. If the information
is sought by a tourist who wishes chiefly to
know whether he will need light or heavy clothing at
a specified season, or whether his excursions are
likely to be hampered by frequent rains, we can enlighten198
him in a few brief paragraphs. If the inquiry
comes from a manufacturer who aspires to
invade the South American markets, we must know,
before replying, what kind of goods he purposes to
export, and just how they are affected by climatic
conditions. Are they liable to injury by high or low
temperatures, dryness or humidity? Does the demand
for them depend, as in the case of rubber
coats, upon the prevalence of rain, or, as in the case
of electric fans, upon the occurrence of hot weather
during at least a part of the year? For each branch
of the export trade certain elements of climate are
important, and the more detailed and explicit the
information that can be obtained about them the
better. Suppose, again, climatic data are desired by
a horticulturist who has to solve the problem of introducing
a South American plant into the United
States. In order to find the best environment for it
in this country, he should know something about the
climate of its original home. The data he requires
are, however, different from those sought by the
tourist or the manufacturer. Is the plant’s habitat
a region where frosts occur? How long is the growing
season? Is the rainfall rather evenly distributed
over the year, or are there definite dry and rainy
seasons? Such are some of the questions he will
ask. For the purposes of medical climatology a
different set of data will be sought. The astronomer,
selecting a site for a new observatory, will ask about
freedom from clouds, and also about the pureness
and steadiness of the air that insure good “seeing.”
The aviator will want information about winds and
fog. And so on.
Thus it appears that climate means very different
things to different people.
199
Climate has been variously defined as the sum total
of weather, average weather, typical weather, etc.,
but the conception is still somewhat indefinite. We
know that, while the weather of any place is subject
to incessant changes, its climate persists; but we
need not assume that it persists indefinitely. The
geological record proves, on the contrary, that vast
changes of climate have occurred in the course of
long ages. In Antarctica and in Spitzbergen are
found deposits of coal, constituting the débris of
ancient forests such as could not exist in the climates
now prevailing in those regions. There are plenty
of other proofs that great climatic changes have
taken place from one geological period to another;
but what of changes in shorter intervals of time?
An immense amount of zeal and energy has been
devoted to the study of supposed changes of climate.
Evidence of such changes is sought, on the one
hand, in a painstaking examination of weather records
(a process often involving the tabulation of
hundreds of thousands of figures), and, on the other,
in the collection of geographical and historical data
bearing on the question. There have been numerous
reports of the gradual drying up of African and
Asiatic lakes, of the discovery of ancient ruins indicating
that prosperous agricultural communities
once flourished in regions that are now deserts, and
of various other tokens that marked vicissitudes of
climate have occurred within historic times. A recent
ingenious method of studying climatic variations
is to measure the successive annual rings seen
in cross sections of old trees. Thick rings are supposed
to have been formed during periods of abundant
rainfall, and thin rings when the rainfall was
deficient. This method has been applied to the giant200
Sequoias of California, some of which are more than
3,000 years old.
The net result of a wide range of investigations
appears to be that, on the whole, climate has everywhere
been remarkably constant since the dawn of
human history. There is much evidence that, in
certain regions, there have been alternate increases
and decreases—recurrent oscillations—of temperature,
rainfall, etc., but there is little evidence of progressive
changes in one direction.
In contrast to the uncertainty that still prevails
in the scientific world on the subject of climatic
changes is the confidence with which the average
layman may be heard to assert that such changes
have taken place within his own recollection. The
popular idea that climate has changed perceptibly
within a single human lifetime is a world-wide delusion,
and one that has, apparently, always flourished.
In the United States we hear of the “old-fashioned
winter,” with its unlimited sleighing, and also of a
marked increase or falling off in the rainfall in
certain districts. It is an interesting fact that a
century and more ago Americans were indulging in
the same sort of retrospections.
In the year 1770, when Benjamin Franklin was
president of the American Philosophical Society of
Philadelphia, a paper was read before that society
entitled: “An Attempt to account for the Change of
Climate which has been Observed in the Middle Colonies
of North America.” It is published in the first
volume of the society’s Transactions. Barring the
long s’s and the use of the word “colonies,” the
greater part of it might have been addressed to the
owners of automobiles and Liberty bonds. We are
told of a “very observable change of climate,” remarked201
by everybody who has resided long in
Pennsylvania and the neighboring colonies. “Our
winters,” says the author, “are not so intensely cold,
nor are our summers so disagreeably warm as they
have been.” These changes he ascribes to the clearing
and cultivation of the country.
Another firm believer in old-fashioned winters and
old-fashioned summers was Thomas Jefferson. In
his “Notes on Virginia,” written in 1781, he says:
“A change in our climate is taking place very
sensibly. Both heats and colds are become much
more moderate, within the memory even of the middle-aged.
Snows are less frequent and less deep.
They do not often lie, below the mountains, more
than one, two or three days, and very rarely a week.
They are remembered to have been formerly frequent,
deep, and of long continuance. The elderly
inform me, the earth used to be covered with snow
about three months in every winter.”
Samuel Williams, who published a “History of
Vermont” in 1794, uses almost identical language
in reference to the climate of that State. “Snows,”
he says, “are neither so frequent, deep, or of so long
continuance as they were formerly; and they are yet
declining very fast in their number, quantity, and
duration.” That these changes, he adds, “are much
connected with and greatly accelerated by the cultivation
of the country cannot be doubted.”
What are the facts? When the statements above
quoted were written few regular records of the
weather had been maintained for any length of time
in this country. The earliest instrumental record
was begun at Charleston, S. C., in 1730. Much information
was, however, available concerning the
dates of harvest, of the formation and breaking up202
of ice in rivers and harbors, and other events dependent
upon the weather, which, if anybody had
taken the trouble to collect and analyze it, would
have dispelled the universal belief that marked
changes of climate had recently taken place. Nowadays
it is much easier to refute the common assertion
that the climate has changed within the memory
of living men. The meteorological history of our
country for more than three-quarters of a century
has been recorded from day to day by a host of careful
observers in every State of the Union. The records
show that, while the weather of one year has
often differed strikingly from that of the next, there
has been no real change in climate. “Old-fashioned”
winters, for example, were neither more nor less
common half a century ago than they are to-day.
Our memories of past weather mislead us, chiefly
because we remember the exceptional weather and
forget that which commonly prevailed. Other circumstances
may contribute to the illusion. Thus
many people who now live in cities, where modern
appliances make them more or less independent of
the weather, passed their childhood under the more
primitive conditions of the country.
If climates were not fairly constant for long
periods of years, it would be a waste of time to compile
the climatic statistics that, as we have seen,
are wanted by so many different kinds of people for
so many different purposes. Such statistics are
based upon past events, but their practical value
depends upon the fact that, within certain limits,
they are a safe guide to the future.
The climatic data for any place are a sort of digest
of the meteorological observations that have been
made there, special emphasis being given to those203
features of the meteorological record that bear
important relations to the life and activities of
mankind. Temperature and rainfall are the leading
elements of climate; others are wind, humidity,
evaporation, cloudiness, etc. We have not space to
enumerate here all the kinds of data found in elaborate
climatic tables; but in order to illustrate how
the records of a meteorological station are utilized
in compiling climatic statistics and to show what
complications may arise in this process, we shall
consider the question of temperature alone.
The instruments used in measuring temperature
have been described in another chapter. From these
instruments are obtained the current temperature of
the air, the wet bulb temperature (used to compute
the humidity), and the maximum and minimum temperatures
of the day. Readings are made at fixed
hours, known as “term hours.” At regular stations
of the United States Weather Bureau the term hours
for the observation of all the meteorological elements
are 8 a. m. and 8 p. m., Eastern Time, and
an observation of temperature, humidity, and clouds
is made at noon. In most other countries tri-daily
readings have been the rule, though in Europe four
or more observations a day are now taken at many
stations in order to supply the frequent weather
bulletins required by aeronauts. Important stations
are generally equipped with thermographs, which
make a continuous record of temperature.
Theoretically, the mean temperature of any day
is the average of 24 hourly observations, from midnight
to midnight. In practice, the mean is generally
computed from the observations at the term
hours, or from the maximum and minimum. Having
obtained the mean daily temperature for each204
day of a month, the average of these values gives
us the mean monthly temperature. The average of
the mean temperatures for the twelve months of the
year is the mean annual temperature.
These data for each day and month, and for the
year—sometimes also for other intervals, such as
five-day periods, or “pentads,”—are computed year
after year, and eventually the values for all the years
of the record are averaged to form what are called
“normals.” We thus obtain, for example, for a given
station, the normal temperature for January 21,
the normal temperature for the month of March,
the normal annual temperature, etc.
All this is a mere beginning toward the complete
discussion of a body of temperature observations for
the purposes of climatology. We have still to obtain
from the readings of the maximum and minimum
thermometers the normal maximum and minimum
temperatures and range of temperature for each
day, each month, and the year; also the “absolute”
maxima, minima, and ranges (i. e., the extreme
values that have occurred during the entire record)
for corresponding intervals of time. These data
furnish answers to such questions as: What was
the lowest temperature ever recorded on January
21? What is the lowest on an average January
21? What is the average range of temperature in
March? What was the highest temperature ever
recorded, on any day, at the station?
Having thus disposed of the extremes and ranges,
we may compute what is called the “variability” of
temperature, i. e., the average difference between
the means of two successive days in a given month,
and the corresponding average for the entire year.
These data are of considerable importance in medical205
climatology. We may also compute the frequency
of occurrence of various values among the
temperature data above enumerated. The most
frequent value is often quite different from the
average value. Many climatologists compute the
number of days, in an average year, on which the
temperature rises to 77 degrees (Fahr.) or above
(“summer-days”), and the number of days on
which the temperature does not rise above the
freezing point (“winter-days”). Especially valuable
in agricultural regions are data of the average and
extreme dates of the last frost in spring and of the
first frost in autumn. These define the length of the
“growing season.” Statistics of the temperature of
the ground at the surface and at various depths
below the surface are also of agricultural interest.
From the foregoing outline it will be seen that a
bewildering variety of climatic statistics may be
computed merely from observations of temperature,
and the same is true of the other elements. Moreover,
the list set forth above is by no means exhaustive
even for temperature. In fact, there is almost
no limit to the number of ways in which the raw
material of climatic data—i. e., the original records
of observation—may be grouped, averaged, or otherwise
treated in order to bring out certain features
of the climate that may conceivably serve some useful
purpose. The reader will now be able to understand
why a treatise on the climate of a single
locality often fills a substantial volume.
The numerical data contained in such a work are
generally supplemented by text descriptions and by
various graphic devices, such as curves showing the
normal fluctuation or “march” of a weather element
during a day, year, or other interval. Works206
which deal with the climates of larger areas, such as
whole countries, are usually accompanied by climatic
charts. These charts furnish a quick and easy way
of getting a general idea of the climate of a region.
Among the more important climatic charts are the
following:
1. Temperature (isothermal) charts. These include
charts showing the distribution of normal temperatures
for months, seasons, and the year; normal
range of temperature for similar periods; highest
and lowest temperatures ever recorded at the different
stations; etc. Lines known as isotherms are so
drawn as to pass through places having identical
values of the element in question (mean temperature,
highest temperature, etc.).
2. Rainfall (isohyetal) charts. These show the
distribution of rainfall (including snowfall, expressed
in equivalent depth of water); especially for
each month and for the year. Other charts may
show the average number of rainy days; average
snowfall (actual depth, not water equivalent); seasonal
distribution of rainfall; etc.
3. Wind charts. These are drawn in various
forms, to show the prevailing wind directions, the
frequency of winds from different directions, the
average force of the winds, etc. Charts of the winds
at different levels above the earth’s surface will
eventually be drawn for the use of aeronauts, but
such charts are still in a tentative stage.

A MODERN ISOTHERMAL CHART OF THE GLOBE. (Hann, 1901)
The isotherms show the mean annual temperature in centigrade degrees.
As in the case of tabulated climatic data, the number
of charts that might be drawn to bring out different
features of climate is practically unlimited.
Sunshine, cloudiness, humidity, barometric pressure,
and the frequency of various special phenomena,
such as thunderstorms, hail, tornadoes, droughts,208
etc., are all charted in some of the more extensive
works on climate. Large atlases have been published
to portray the climates of certain countries. The
study of the actual distribution of climates over the
earth, as distinguished from that of climate in general,
is sometimes called climatography.
Climates are variously classified, usually on the
basis of one or more of the climatic elements, but
sometimes with reference to their effects. The most
familiar classifications refer to temperature. We
speak of tropical, temperate, and polar climates; but
in using these terms it should not be forgotten that
other things besides latitude control the distribution
of temperature. Location with respect to the ocean
or other large bodies of water is almost equally important.
A land surface grows warm by day and
in summer, and grows cold by night and in winter,
much more rapidly than a water surface, and the
adjacent air varies in temperature accordingly.
Hence we have a classification of climates as marine
and continental. The former, under the influence
of oceanic winds, have a moderate range of temperature,
while the latter are subject to extremes
of heat and cold. With increase of altitude temperature
is diminished, but rainfall is generally
increased. The distribution of rainfall is also determined
to a great extent by the paths of cyclonic
storms. Such are a few of the many things that
control the complex distribution of climates.
People who never travel far from their own homes
usually cherish quite erroneous ideas regarding the
climates of distant lands. It is hard for most Americans
to realize, for example, that the Isthmus of
Panama, in the heart of the tropics, never experiences
temperatures nearly so high as those which209
occur every summer in the United States. A citizen
of South Dakota, where the mercury, in the shade,
frequently rises above 100° Fahr., and has been
known to reach 115°, will be inclined to revise
his definition of the term “tropical” when he
learns that at Colon, the Atlantic terminus of the
Canal, a temperature as high as 90° is decidedly
exceptional, and that the maximum reading during
a period of six years was only 92°. In
thirteen years Canal Zone vital statistics showed
only two deaths from sunstroke and twenty-one non-fatal
cases of heat prostration among a population
of 120,000. It will also surprise most Americans to
learn that the highest natural air temperatures
that have been recorded anywhere on earth were not
observed near the equator, but in a California desert.
At a place on the edge of Death Valley, rejoicing in
the ironical name of Greenland Ranch, a temperature
of 134° Fahr. was registered in July, 1913.
The thermometer which furnished this remarkable
reading was a tested instrument, installed in a
standard screen over an alfalfa sod, and not exposed
to the reflected heat of the desert. At the
same place the temperature reached 100° or more
on 548 days in four years. Outside of the United
States the highest temperature ever recorded at a
meteorological station was 127° Fahr. at Wargla
(Ouargla), Algeria.
The lowest temperatures encountered by polar explorers
are considerably higher than those experienced
each winter by the inhabitants of northern
Siberia. The “record,” so far as instrumental observations
go, is held by the town of Verkhoyansk,
at which the temperature fell to 90° below zero
(Fahrenheit) in February, 1892. Strange to say,210
this “winter cold pole” of the earth has warm summers.
At Verkhoyansk the temperature sometimes
rises to 80° above zero, or higher. At Yakutsk,
Siberia, the thermometer has been known to fall to
84° below zero in winter and to rise 102° above zero
in summer; a range of temperature exceeding the
interval between the freezing point and the boiling
point of water!
Another climatic paradox is that experienced by
mountaineers who, in scaling peaks mantled in
eternal snow, often suffer with the heat, on account
of the intensity of solar radiation in the pure, dry
air of high altitudes. At the health resort of Davos,
in the high Alps (altitude 5,250 feet), invalids sit
out-of-doors without wraps in midwinter, and, indeed,
are sometimes driven into the shade to escape
the too ardent rays of the sun. At the same time the
temperature of the air itself may be far below freezing,
and the ground covered with snow.
Certain parts of the world are often loosely described
as “rainless,” but, as we have stated elsewhere,
there is actually no spot on earth at which
rain (or snow, in the polar regions) has never been
known to fall. In the driest part of the Sahara—the
Libyan Desert, between Dakhel and Kufra—the
explorer Rohlfs experienced a drenching rainstorm
of three days’ duration in 1874. Neither is the
Sahara, in spite of its proverbial heat, exempt from
touches of real winter. Snow is a common occurrence
in many parts of this desert, even at moderate
altitudes. On the higher Saharan peaks snow lies on
the ground all winter, and is sometimes found, in
sheltered spots, in summer. Occasional falls of snow
occur in all parts of Algeria, and several falls have
been recorded in Lower Egypt.
211
When all is said and done, the whole fabric of
what now constitutes the science of climatology
leaves much to be desired. Climate is of practical
interest, first of all, on account of its effects on
human life and health, and secondly because of its
influence upon the crops that are the mainstay of
man’s material prosperity. Under both these heads
climatic data, as now commonly presented, ignore
certain atmospheric activities of the utmost importance.
For biological purposes no description of a
climate can be regarded as even approximately complete
that does not furnish, for the region under discussion,
a detailed account of the different kinds of
radiation received from the sun, their intensities and
fluctuations; and there are few places in the world
at which even a beginning has been made in the collection
of such data. Again, the phenomena of atmospheric
electricity, including radioactivity, are
probably of real climatic significance, but we are still
in the stage of speculation with regard to this subject.
Possibly there are still other elements of
climate, now wholly neglected, that will figure prominently
in the climatology of the future.
212
CHAPTER XIII
ORGANIZED METEOROLOGY
No other branch of science is so dependent upon
the constant systematic cooperation of a multitude
of workers as meteorology. There are, to be
sure, some kinds of atmospheric phenomena that can
be studied advantageously by the individual meteorologist,
with no further aid from his scientific confrères
than the same sort of interchange of ideas
that prevails in all departments of knowledge; but
the widespread processes that constitute weather
and climate require for their observation—whether
the purpose in view be weather forecasting, or the
collection of climatic statistics, or the assembling of
data from which to deduce the laws of atmospheric
movements—a veritable army of colaborers, equipped
with standardized instruments and keeping their
records according to a uniform plan.
Probably few people, in looking at the charts portraying
the climates of the world that are found in
reference books, realize how many observers have
contributed to the preparation of such charts or the
number of separate instrumental observations upon
which they are based. In the United States alone
there are something like 6,000 meteorological stations,
at which upward of two and a quarter million
observations are made every year—and a climatic
chart is, of course, the fruit of many years of observations.
At the beginning of the present century213
it was estimated that there were 31,000 meteorological
stations in operation throughout the world.
The present number is doubtless much greater. At
some of these stations observations have been made
regularly, once, twice or three times a day, for 100
or 150 years. In round numbers one may say that,
during the last few decades, meteorological observations
have been made, the world over, at the rate of
ten million a year, and the total number, since the
keeping of regular weather records began, runs far
up in the hundred millions.
Organized meteorological observations were not
unknown to antiquity—we have mentioned elsewhere
the early rainfall measurements in India and
Palestine—but the present era of such undertakings
dates back only to the middle of the seventeenth
century. In the year 1654 the Grand Duke Ferdinand
II of Tuscany, through his chaplain and secretary,
Luigi Antinori, secured the cooperation of
several observers in Italy and the adjacent countries,
to whom were distributed instruments and forms for
maintaining daily records of the principal meteorological
elements. Antinori and most of the observers
belonged to the Jesuits, an order which has
displayed extraordinary zeal in the furtherance of
meteorology down to the present day. The observations
thus inaugurated appear to have been kept up
until about 1667, but unfortunately few of the records
have been preserved. Several undertakings of
similar character were launched during the next
hundred years in France, England, and Germany.
The most notable of such enterprises, however, antedating
the foundation of the present official weather
services, was the international system of observations
maintained by the Meteorological Society of the214
Palatinate, founded at Mannheim in 1780 under the
auspices of the Elector Karl Theodor. The chief
credit for the epoch-making work of this society is
due to its secretary, J. J. Hemmer. The society distributed
standard instruments to its observers, who
were widely scattered over the world; viz., fourteen
in Germany, two in Austria-Hungary, two in Switzerland,
four in Italy, three in France, four in
Belgium and Holland, three in Russia, four in Scandinavia,
one in Greenland, and two in North America
(at Bradford and Cambridge, Mass.). The very
detailed observations of this network of stations
down to the year 1792 were published in twelve
large volumes.
Although the activities of the Mannheim society
came to an end in the troublous days of the French
Revolution, the records that it had collected served
as the groundwork for fruitful studies during the
next generation. There are two distinct uses that
can be made of statistics of this sort. First, they
can be digested in such a way as to bring out the
characteristic features of the climate at each of the
localities included in the collection, and likewise to
illustrate the distribution of climates over the globe.
Second, the data for individual days from the various
stations can be charted separately, so as to
illustrate the instantaneous distribution of barometric
pressure, wind and weather, and, by a comparison
of the charts for successive days, to provide
a sort of moving picture of the atmospheric machinery
in operation.
Charts based on approximately simultaneous observations
showing the state of the atmosphere at a
particular moment of time over an extensive area
of the earth are called synchronous charts, or sometimes215
synoptic charts, though the latter term is also
applicable to charts showing average values for a
particular month, year, etc. Synchronous charts, as
used nowadays for the purpose of making forecasts,
are prepared from data collected by telegraph; but
the same kind of charts can be prepared in a more
leisurely manner from the statistics gathered at any
previous time, and such charts were frequently
made for the purpose of study before the days of
telegraphy. The pioneer in such undertakings was
the German physicist, H. W. Brandes, who, about
1820, utilized the observations collected by the
Meteorological Society of the Palatinate, together
with some others, in compiling a series of daily
synchronous charts of Europe for the year 1783.
Very similar studies were carried out in America,
a few years later, by J. P. Espy, W. C. Redfield and
Elias Loomis. Early in the nineteenth century a
copious fund of meteorological observations had
already accumulated in this country. The first undertaking
in the nature of a meteorological organization,
foreshadowing the present Weather Bureau,
was due to Josiah Meigs, Commissioner of the General
Land Office, who in 1817 established a system
of tri-daily observations at the various land offices.
At an almost equally early period the Surgeon
General of the Army inaugurated regular weather
observations at the military posts throughout the
country. Local systems of observations were established
by the authorities of New York State in 1825
and Pennsylvania in 1837, and systems of broader
scope by the Patent Office in 1841 and the Smithsonian
Institution in 1847. Experiments in collecting
weather reports by telegraph for the purpose of forecasting
storms were undertaken by the Smithsonian216
Institution as early as 1849. At about the same
period Lieut. M. F. Maury, of the navy, was gathering
meteorological reports from mariners and laying
the foundations of marine meteorology. Finally, in
1870, Congress was induced to establish a full-fledged
telegraphic weather service, similar to those
that were already in successful operation in Europe.
One of the great promoters of this enterprise was
Dr. I. A. Lapham of Wisconsin; it had been repeatedly
advocated by Maury; and a convincing object
lesson in its behalf was furnished by the local service
of reports and forecasts conducted by Prof.
Cleveland Abbe, at the Cincinnati Observatory, with
the aid of the Western Union Telegraph Company,
in 1869 and 1870. During the first twenty years of
its existence, from 1870 to 1890, the Federal weather
service was under the Signal Corps of the army.
Since 1890 it has been a branch of the Department
of Agriculture, as the United States Weather
Bureau, though the name “Signal Service” stuck to
it, in popular speech, long after it ceased to belong
to the army.
In this country weather forecasts are—or once
were—said to emanate from “Old Probabilities,” or
“Old Probs.” Our first “Old Probs” appears to have
been Professor Abbe, who has explained the origin
of this name in an account of his pioneer forecasting
experiments at Cincinnati. He says of the
initial Cincinnati Weather Bulletin, issued September
1, 1869:
“It contained only a few observations telegraphed
from distant observers and announced ‘probabilities’
for the next day. This bulletin, in my own hand-writing,
was posted prominently in the hall of the
Chamber of Commerce, but unfortunately I had misspelled217
‘Tuesday,’ and I soon found below my Probabilities
the following humorous line by Mr. Davis,
the well-known packer: ‘A bad spell of weather for
“Old Probs.”’ This established my future very
popular name of ‘Old Probs.’” The name has,
however, been more particularly associated with
Gen. Albert J. Myer, who, as Chief Signal Officer,
was the first head of the Federal meteorological
service.
Desultory experiments in the collection of current
weather reports and their use in constructing
weather maps were first carried out in Europe at
about the same time as the early undertakings of
this character in America. Such reports were gathered
and published by James Glaisher, with the cooperation
of the British railways, in 1849. The
existing national weather services of the Old World
owe their origin to an episode of the Crimean War.
In November, 1854, a violent storm wrought havoc
among the French and British warships in the Black
Sea and sank many vessels containing invaluable
stores intended for the Allied armies in the Crimea.
The French astronomer Le Verrier, director of the
Observatory of Paris, collected information showing
the progress of this storm across Europe, and the
results of this inquiry were so significant that he
submitted to the Emperor Napoleon III the plan of
organizing an international system of telegraphic
reports, by means of which timely warning could be
obtained of similar atmospheric disturbances. The
French Government, with the aid of other European
countries, established such a system in 1855. Within
the next two decades most of these countries
organized their own services, and at the same time
maintained an international exchange of observations218
by telegraph. Before the close of the nineteenth
century nearly all the civilized countries of
the world, including many colonial possessions, such
as Canada, Australia, Algeria and the Philippines,
had established meteorological services, entailing
more or less extensive arrangements for collecting
daily reports by telegraph and issuing storm warnings
and weather forecasts. The chief exceptions
were several of the Latin-American republics and
the Ottoman Empire, in which such organizations
are still lacking.
Meteorology is essentially an international science.
The atmosphere knows no political boundaries, and
the more it is studied the more strongly meteorologists
are impressed with the fact that intimate relations
exist between the atmospheric events of widely
separated regions of the world. Thus, the great anticyclone
that is built up every year over the cold
interior of Siberia exercises an influence upon the
weather of the United States; the behavior of the
Indian monsoons has been found to have some connection
with barometric conditions in South America;
and fluctuations in the force of the trade winds
are apparently of world-wide significance—whence
these winds have been described as the “pulse” of
the general atmospheric circulation. The French
meteorologist L. Teisserenc de Bort called attention
many years ago to the existence of what he called
“centers of action”; viz., large permanent or semi-permanent
areas of high and low barometric pressure,
the variations of which correspond strikingly
with the vicissitudes of wind and weather in countries
thousands of miles distant. Last but not least,
persistent attempts have been made to interpret all
the weather happenings on our globe in terms of a219
fluctuating supply of radiant energy received from
the sun.
Fortunately meteorology has possessed an international
organization for a great many years.
The International Meteorological Organization was
founded at a conference held at Leipzig in 1872, and
was perfected at a formal congress of meteorologists
convoked at Vienna in the following year. The International
Meteorological Committee, which is the
permanent working body of the organization, was
established at the Vienna Congress. Finally, the
organization was reconstituted at a conference held
at Paris, by invitation of the French Government,
in 1919.
The International Committee consists of not more
than twenty members, all of whom are directors of
official meteorological services. It is supposed to
meet at least once in three years. At less frequent
intervals are held “conferences,” to which are invited
representatives of all the meteorological services
and the principal independent meteorological
observatories of the world. Attached to the organization
are several international “commissions,”
which supervise and coordinate the work of meteorologists
in various special fields. At the close of the
year 1921 there were commissions on the following
subjects:
Agricultural Meteorology, Weather Telegraphy,
Marine Meteorology, Solar Radiation, Application of
Meteorology to Aerial Navigation, Réseau Mondial,
and Polar Meteorology, Investigation of the Upper
Air, Terrestrial Magnetism and Atmospheric Electricity,
Study of Clouds.
Each commission includes in its membership at
least one member of the International Committee,220
besides a number of experts, from different countries,
in the particular subject with which the commission
is concerned.
The resolutions adopted at the various international
meetings of meteorologists have been
collected in the “International Meteorological
Codex,” the chief object of which is to secure uniformity
in methods of observation, forms of publication,
etc.
One of the most notable international undertakings
in the history of meteorology was the plan of
simultaneous observations, at Greenwich noon, both
at land stations and on board ships, adopted by
the Vienna Congress at the suggestion of General
Myer, and carried out under the auspices and
mainly at the expense of the United States Signal
Service. The results of these daily observations,
from 1875 to 1887, were published in detail, with
charts, by the Signal Service. The many bulky volumes
of this series, illustrating the meteorology of
the globe (or mainly the northern hemisphere) day
by day for a period of more than a decade, are the
modern analogue of the “Ephemerides” issued a century
earlier by the Meteorological Society of the
Palatinate—which cover very nearly the same
length of time. In recent years the efforts of meteorologists
have been bent toward establishing a so-called
“réseau mondial,” or world-wide network of
stations, which will not only provide telegraphic reports
for the use of forecasters, but will also send
their detailed records to an international commission
to be compiled and published. The telegraphic feature
of this project now bids fair to be realized in a
manner that was not contemplated when the plan
was originally proposed; viz., by the broadcasting221
of weather reports from high-powered radio stations
all over the world.
An effective “world weather bureau,” with permanent
headquarters and staff, is at present the most
urgent desideratum of practical meteorology. Such
a bureau would not only tie together the national
weather services of the world and greatly facilitate
their operations, but would also digest the great
mass of existing climatic statistics and provide for
extending the climatological survey of the globe
to regions where meteorological stations are scarce
or lacking.
A typical national meteorological service comprises
a central station or institute, usually, but not always,
situated at the national capital, and a network or
“réseau” of subordinate stations, which are sometimes
classified, according to the extent of their observations,
as stations of the first, second, and third
order. They may also be classified, from another
point of view, as telegraphic and nontelegraphic
stations. The former provide telegraphic reports of
their observations, which serve as the foundation for
forecasts, while the latter are maintained chiefly for
the purposes of climatology. In some countries—notably
in the United States—there are additional
classes of stations engaged in particular lines of
work; these include storm-warning stations, river
stations (which report river stages and rainfall in
the river basins), stations for agricultural meteorology,
etc. Several of the great maritime nations
collect reports from vessels on the high seas, including
a small percentage of wireless reports. A number
of the national meteorological services carry on
work in other branches of geophysics, such as
seismology and terrestrial magnetism.
222
The United States Weather Bureau is an exception
to the rule that, apart from the central offices and a
few special stations and large observatories, meteorological
stations are not generally manned by professional
meteorologists, nor are the observers paid
specifically for their meteorological work, though in
a great many cases they are public functionaries
who are expected to take meteorological observations
in addition to their other duties. In this country
there are about 200 stations at which the observers,
of whom there are from one to a dozen or
more at each station, devote all their time to the
work of the stations and are salaried employees of
the Weather Bureau, and there are several hundred
minor stations manned by part-time paid employees.
But even in the United States the great majority of
the meteorological stations are operated by unpaid
observers. There are about 4,500 of these so-called
“cooperative stations,” which provide the bulk of
the climatic statistics of the country.
Some of the leading meteorological services of the
world, and the places at which their central offices
are located, are as follows:
United States Weather Bureau (Washington),
Meteorological Service of Canada (Toronto), Meteorological
Office (London), Office National Météorologique
(Paris), Reale Ufficio Centrale di Meteorologia
e Geodinamica (Rome), Zentralanstalt für
Meteorologie und Geodynamik (Vienna), Indian
Meteorological Department (Simla), Central Meteorological
Observatory (Tokyo), Commonwealth
Bureau of Meteorology (Melbourne), Oficina Meteorológica
Argentina (Buenos Aires).
In Germany there are several mutually independent
meteorological establishments, of which the Prussian223
Meteorological Institute, with headquarters in
Berlin, is the most important with respect to climatology
and research, while the Deutsche Seewarte,
at Hamburg, is the chief center for telegraphic
weather reports and issues the principal weather
map. Russia, before her debacle, had one of the
most splendidly organized meteorological services in
the world, with headquarters at the Central Physical
Observatory in Petrograd, and a separate service for
agricultural meteorology, which was the model institution
of its kind. The Philippine Islands have a
Weather Bureau which is entirely distinct from that
of the United States. This Bureau, with headquarters
at the Manila Observatory, was founded by
the Jesuits, who also maintain a quasi-official meteorological
service in China, with headquarters at the
Zikawei Observatory, near Shanghai.
Many meteorological societies have done much
for the progress of the science, and in some cases
have shared the duties of the official meteorological
services, especially in maintaining stations for climatology.
These include the Royal Meteorological
Society and the former Scottish Meteorological Society,
in Great Britain, the French, Italian, German,
Austrian, and Japanese meteorological societies, and
the American Meteorological Society, which was
founded in December, 1919.
224
CHAPTER XIV
WEATHER MAPS AND FORECASTS
“Forecast”—with the stress on the first syllable
when it is a noun, but often on the second
when it is a verb—is a word that meteorology has
made peculiarly its own. This fact is not the result
of accident, but of design.
The founder of scientific weather prediction in
Great Britain was Admiral Robert FitzRoy—the
same talented officer who explored the coasts of
South America in the Beagle and had Darwin for
a fellow-voyager—and his first predictions were
issued in 1861 from the Meteorological Department
of the Board of Trade, which was under his charge.
The boldness of this pioneer undertaking is not
easily realized by the present generation, which is
accustomed to see the official weather forecast at
the head of every daily newspaper. Weather prognostication
had previously been the undisputed
province of charlatans and quacks. For a civilized
government to embark upon such an enterprise
must have seemed, to the educated public, very
much like charging the Astronomer Royal with the
duty of casting horoscopes.

A GLASS WEATHER MAP OF THE UNITED STATES WEATHER BUREAU
(Courtesy of U. S. Weather Bureau.)
There is much virtue in a name. A few years
ago the United States Bureau of Fisheries persuaded
the American public to eat dogfish by
changing its name to “grayfish.” Similarly, FitzRoy
induced the British public to take his weather225
predictions seriously by calling them “forecasts.”
The name has stuck; and nowadays, throughout
the English-speaking world, the expression “weather
forecast”—except as applied comprehensively to
predictions of the “long-range” variety—means
something decidedly less chimerical than the average
weather prophecy.
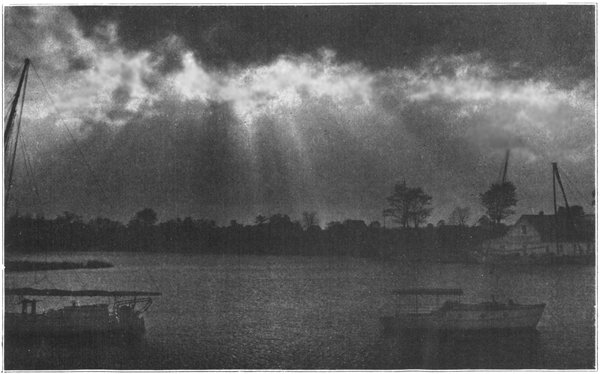
THE SUN DRAWING WATER
(Photograph by P. K. Budlong.)
It is still necessary, however, to emphasize the
distinction. There are probably many people among
us, well above the illiterate level, who have no clear
idea as to what constitutes a scientific weather forecast.
The distinguishing feature of such a prediction,
apart from the fact that it is made by a trained
meteorologist, is that it is, in all cases, based upon
a weather map.
The forecasting machine is a big one, with its
human gear spread over a wide territory. Eventually
it will be spread over the entire globe, and
then we shall have better forecasts. A little manual
entitled “The Weather Map,” published by the British
Meteorological Office, says:
“The making of a single forecast in any one of
the meteorological offices of Europe, America, Australia,
or the Far East requires the organized cooperation
of some hundreds of persons; about a
hundred observers who note the necessary observations
simultaneously at as many separate places
and hand in their reports to the telegraphists who
transmit them to one center, where the meteorological
expert charts them on a map and draws
therefrom the conclusions on which the forecasts
are based. The preparation of the map is an essential
part of the process. No meteorologist in the
modern sense attempts to forecast the weather
without reference to a map prepared either by himself226
or by some one with whom he is in direct communication,
from observations transmitted by telegraph
for the purpose. No amount of weather wisdom
or weather lore or experience is a substitute
for the map. The more expert and accomplished
the meteorologist, the more certain he is that all he
can do without the materials for constructing a
map, though he may have a barometer and other
instruments at hand, is to make a guess at what the
map is like and think out from that what the
weather changes are likely to be. It is a common
experience of professional meteorologists away
from their base to find themselves appealed to for
an opinion about the weather, judging from the
signs of the sky alone, because they are learned in
such things. That is exactly what they are not.
Accustomed to refer everything to a map, without
one they feel themselves to be rather worse off than
those who are unaccustomed to its use. A modern
meteorologist thinks in maps; his language and
modes of expression are formed thereby.”
While the weather map is prepared, first of all,
for the use of the forecaster, who makes his predictions
from the map before it has passed beyond
the manuscript stage, it has other important uses,
which justify its publication and widespread distribution.
The weather map is a weather newspaper.
Like other newspapers, it is founded on a
system of telegraphic dispatches and is designed
to keep us in touch with what is going on in the
world. Weather news is of general interest because
weather plays a part in most of the doings of humanity.
Sometimes the news we read on the face
of the map merely satisfies our curiosity; at other
times it renders us more substantial service.
227
By way of illustrating the manifold purposes
served by weather maps, let us set down two cases
that are, perhaps, at opposite ends of the scale of
utility. Our first case is that of the traveler who
scans the map to see whether the atmospheric conditions
at his distant home are propitious, that day,
for some outdoor pleasure event on the family program.
This we may describe as a sentimental use of
the map. The second case is that of an aviator embarking
on a flight some time in the fore part of the
day, soon after the morning map has made its appearance.
Here is a case in which the map is of vital
utility, purely as a record of current conditions. The
aviator is not concerned with the forecast of the morrow’s
weather, unless he is making an unusually long
flight, but he is immensely concerned with the winds
and weather prevailing along his route at the time
he flies, and these will not, as a rule, differ radically
from the conditions shown on the map of the same
morning.
Since weather affects business in a variety of
ways, people who have business interests away from
their places of residence frequently have occasion to
consult the weather map. The influence of the
weather on crops explains why the map is watched
with keen interest by dealers in agricultural products.
Owners of vessels navigating the ocean or the
Great Lakes take a practical interest in the present
as well as the future location of storms. And so on.
It is not necessary to prolong this list of those who
use the weather map, because the popular demand
for it speaks for itself. It is worth while to record
the fact that the demand far exceeds the supply. In
this country the Weather Bureau has been constantly
harassed with urgent requests for the publication228
of maps at places where, in consequence of
limited appropriations, it has not been possible to
issue them.
The weather maps published in various parts of
the world exhibit much diversity in detail, though
they have, of course, many features in common.
As a rule a weather map covers a wider area than
that of the country in which it is published. The aim
has always been to make these publications international,
as far as practicable. The longest continuous
file of printed daily weather maps in existence,
viz., that established in France by Le Verrier in
1863 and still published, has been called from its
beginning the “Bulletin International.” It embraces
nearly the whole of Europe, a little of Africa, Iceland,
and the Azores. The other European maps
now cover the same area or a considerable part of it.
Before the war the Russian meteorological service
was issuing a map that included, in addition to
Europe, a wide zone of Asia extending all the way
to the Pacific Ocean. The United States map, as
published in its most extensive form at Washington,
comprises the whole of this country and southern
Canada, besides presenting tabulated statistics for
more distant parts of the world. Manuscript maps
prepared daily at Washington have a still broader
outlook; they are drawn on a base map that
covers the northern hemisphere, and the printing
of a map of this sort, including a chain of stations
extending around the globe, was undertaken in
1914, but was interrupted by the war. The map
published by the Argentine Meteorological Office,
at Buenos Aires, covers more than half of South
America. Most national meteorological services
issue weather maps, but there are a few that do230
not. No such maps are published in South Africa
or any of the South American countries except
Argentina.
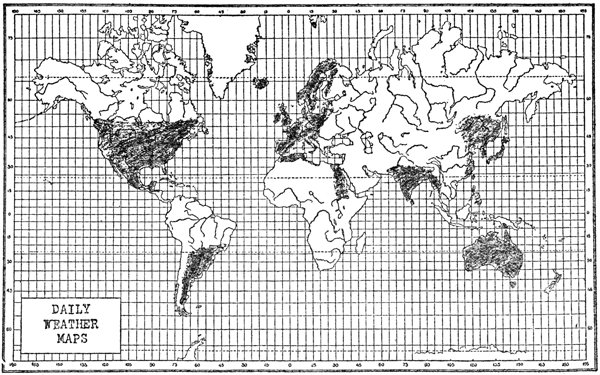
LAND AREAS EMBRACED IN DAILY WEATHER MAPS AS PUBLISHED IN 1921
Thus there is still much room for the horizontal
extension of the weather map, and there is even more
room for its vertical extension. Daily weather maps
for aeronauts (chiefly wind maps) are now more or
less on the programme of all the leading meteorological
services, and in a few cases their publication
has already begun. Probably the first maps of
this character, showing the winds at various levels
over a whole country, were those that began to appear
in Italy in 1913. The British Meteorological
Office now publishes such maps, showing winds and
clouds at different levels over the British Isles at
three hours of the day. In the United States maps
of the “wind aloft” are prepared daily, at Washington,
from the reports of kite and balloon stations, but
they are not yet published. The Weather Bureau has,
moreover, invented an ingenious method of depicting
the winds at several levels on a single map; in other
words, constructing a map in three dimensions. This
consists of attaching arrows to little metal posts
erected on an ordinary weather map at points corresponding
to the location of the upper-air stations.
Each post bears a series of arrows—one arrow for
each level charted—and the arrows are set in positions
showing the direction of the wind at each level.
Numbers on the arrowheads indicate the force of the
wind. When the map is finished it is photographed
from two different angles so as to make a pair of
pictures suitable for viewing through a stereoscope.
These stereoscopic pictures were formerly made
every day and a file of them is available for reference
and study.
231
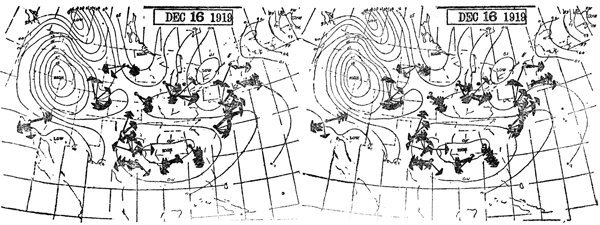
STEREOSCOPIC MAP OF THE “WINDS ALOFT”
(Larger)
232
There are a few conspicuous points of difference
between the weather maps issued in foreign countries
and those issued in this country. Thus a majority
of the foreign weather services publish two or
more charts on the same sheet; either for the sake of
showing different meteorological elements separately
or, in most cases, to represent the conditions prevailing
not only at the hour of the current morning observation,
but also at certain hours of the previous
day. One of the three editions of the British map
includes four charts, corresponding to observations
at four different hours. By means of such series
of charts one can observe the recent changes of
weather as well as the current conditions. Weather
maps published in the United States show primarily
the conditions at 8 a. m., Eastern Standard Time, of
the morning of issue; though certain features of past
weather are also indicated, including changes of temperatures,
movements of storm centers, etc. Evening
maps are drawn at Washington and at many
other places, but are not published.
In this country the publication of weather maps
has been carried out on a much more liberal scale
than elsewhere. Instead of issuing maps at only one
or a few places, as is the custom in other parts of
the world, it has been the policy of the American
service to publish them at populous centers all over
the country. In some cases they are printed or manifolded
at the local Weather Bureau station, and distributed
by mail and messenger; in other cases they
are published in the newspapers. The daily circulation
of the maps has thus, at times, run up into
the millions. This comprehensive duplication of the
chart is made possible by special arrangements with
the telegraph companies. The reports of observations233
are, to a large extent, sent over circuits, along
which the telegraph offices, besides forwarding the
local report, copy the reports from other stations as
they pass over the wires. Certain stations, forming
connecting links between the circuits, effect the
transfer of collected reports from one circuit to another;
so that, in a very short time, upward of 150
stations receive the reports from a large number of
other stations. The maps issued at stations or published
in newspapers are generally rather crude,
though they answer their purpose; but the large
lithographed map issued every day at the Central
Office, in Washington, is much the most artistic production
of its kind published anywhere in the world.
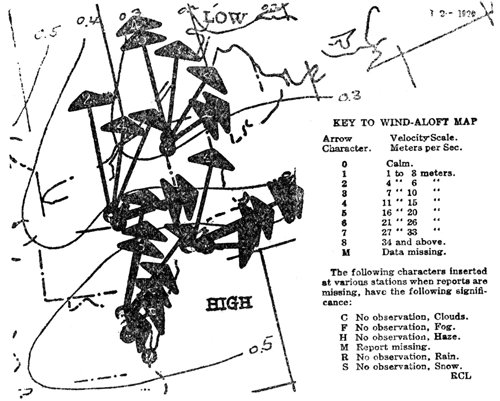
ENLARGED SECTION OF THE STEREOSCOPIC WIND MAP
Large weather maps, drawn with colored chalk on
a ground-glass base, may be seen at certain produce234
exchanges and railway stations, on the “boardwalk”
at Atlantic City, and in the Capitol at Washington.
Motion-picture weather maps, made from series of
maps showing conditions at successive intervals of
time, have been prepared experimentally in this
country and abroad.
The reports used in the construction of weather
maps are telegraphed from the stations in cipher, in
order to save expense. In Europe groups of figures
are used for this purpose, but the United States
Weather Bureau makes use of a word code, which
offers the advantage over a figure code that, as a
rule, mistakes in the telegrams can easily be detected
by anybody familiar with the code. The American
weather code is something of a literary curiosity.
In each of the many thousand words it contains
there are certain significant letters, and these
must fall in certain sequences in order to convey the
information required. The English language has
been ransacked—and somewhat stretched—to secure
the necessary words. Observers consult the code
book in enciphering their reports, but translating is
easily done without the book by those who have
mastered the relatively simple principles on which
the code is constructed.
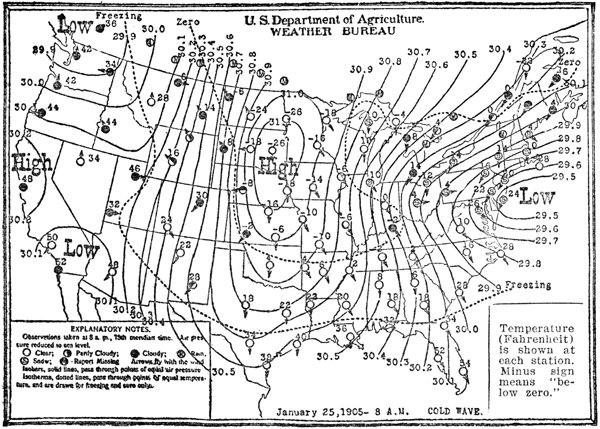
SIMPLIFIED WEATHER MAP FOR JAN. 25, 1905, 8 A. M., EASTERN STANDARD TIME
The language of lines, shadings and symbols used
in weather maps can be learned in a few minutes,
and it is, as a rule, fully explained on the face of
the map. This is true of foreign maps as well as
American. A full-fledged weather map is hardly
susceptible of reproduction in a book of ordinary
dimensions. The simplified map that we show here,
taken from a Weather Bureau bulletin, will, however,
serve to illustrate some of the features of such
publications. The reader should first fix in his mind236
the explanations printed at the lower left-hand
corner of the map and then study the map in the
light of what has been said in Chapter VIII about
the circulation and movements of highs and lows.
On this map we have an exceptionally well-developed
high over the middle of the country and a pronounced
low on the Atlantic coast. The former,
with clear skies and very cold weather, constitutes
a cold wave. The latter is attended by a widespread
snow storm and, as may be inferred from the
crowded isobars, by stormy winds.
Now bear in mind the fact that charts identical
with this one, except that they contained much more
detailed information, were issued in all the more important
cities and towns of the United States on the
morning of January 25, 1905, about a couple hours
after the taking of the morning observations, at 8
a. m., Eastern time. The same morning, weather
forecasts, cold-wave warnings and storm warnings,
deduced from this map, were issued to some hundreds
of thousands of addresses by telegraph, telephone,
mail, and messenger. The map itself conveys
information comparable in interest to the news of
public events published on the first page of the newspapers
the same day. The forecasts and especially
the warnings are, in such a case, worth millions of
dollars to the people of the United States. The following
account of the cold wave appears in the
Annual Report of the Chief of the Weather Bureau
for 1905:
“A severe cold wave appeared over the Dakotas,
Minnesota, Nebraska, and Iowa on January 24, 1905,
and on the 25th covered the central and upper
Mississippi valleys and extended over the northern
portions of the east Gulf States, the line of zero237
temperature reaching into northern Tennessee. On
the 26th the cold wave covered Florida, and temperatures
below freezing were reported as far south
as Tampa and Jupiter. At the latter place, the minimum
temperature, 24 degrees, equaled the lowest
ever recorded since the establishment of the Weather
Bureau station at that point. Considerable damage
was done to orange trees where groves could not be
fired or protected. Ample warnings had been given
of the expected low temperatures.”
The subject of making forecasts from a weather
map is one concerning which some big books have
been written, and it cannot be dealt with very satisfactorily
in the brief space at our disposal. There
are two cardinal rules—viz., (1) the weather has a
characteristic distribution in relation to the distribution
of barometric pressure, and (2) pressure systems,
with their attendant winds and weather,
move, in a general way, from west to east—but these
rules require various qualifications and are subject
to various exceptions. Thus highs and lows generally
take rather circuitous routes in getting, eventually,
to the eastward, and sometimes they break up or
fade out. The high shown on the annexed map actually
moved much more south than east during the
following twenty-four hours, while the low moved up
the coast; i. e., more north than east. These were,
however, the movements expected by the experienced
forecaster.
Well-developed highs are nearly always regions of
clear weather and, in winter, of cold weather. Lows
are attended by clouds and precipitation; rising
temperature usually precedes them and falling temperature
follows them. The professional forecaster
recognizes several types of pressure distribution238
other than ordinary highs and lows, and they, also,
have their characteristic winds and weather. The
seven typical forms of isobars, as classified many
years ago by R. Abercromby, are: Cyclone; anticyclone;
secondary; V-shaped depression, or trough;
wedge of high pressure; col, or saddle, between two
anticyclones; and straight isobars. These may be
combined in a variety of ways on the weather map.
The forecaster learns to classify these combinations
consciously or subconsciously, and grows familiar
with their habits and mannerisms. Forecasters
spend a good deal of time in studying the files of
weather maps for past years; but the results of such
studies are not easy to reduce to definite statements.
Scientific forecasting is, in its present stage, almost
wholly empirical. The dependence of weather
changes upon the phenomena of atmospheric circulation
is generally easy to make out, but the vagaries
of winds and pressure are still in the main mysterious;
notwithstanding such interesting developments
as (1) the much-discussed rules of M. Gabriel
Guilbert for predicting the movements of barometric
depressions from abnormalities in the force and
direction of the winds; (2) the systematic charting
of “isallobars,” or lines of equal pressure change,
associated especially with the name of Dr. Nils
Ekholm; and finally (3) the hypothesis of a sharp
line of demarcation between masses of equatorial
and polar air along the so-called “polar front,”
forming the basis of a system of forecasting that
originated at the Geophysical Institute of Bergen,
Norway, and has had a marked influence upon the
methods of forecasters in other parts of the world.
As to the practical results of this empirical art,
one point of the utmost importance is commonly239
overlooked by the public when it complains about
the mistakes of the forecaster. He is required to
make forecasts of weather day after day, regardless
of the kind of map that is laid before him. Sometimes
the map is so featureless (or, as the forecasters
say, “flat”) that there is little in it on which
to build a forecast. At other times there is an abundance
of features, but they are in process of rapid
and disconcerting change. In either case the ordinary
day-to-day weather forecast is likely to go astray.
The brighter side of this picture is that the
atmospheric phenomena that count heavily in terms
of dollars and imperiled human lives are not found
on “flat” maps, and, when they appear on the map,
generally behave in a simple, straightforward way.
In other words, such events as great storms and cold
waves are far easier to forecast than everyday
weather, and it is the successful prediction of these
events that furnishes the principal raison d’être of
an expensive telegraphic forecasting service.
Since weather predictions serve a variety of purposes,
many different kinds of forecasts and warnings
have been developed by meteorological services.
In this country there are, first of all, district forecasts
and local forecasts; the former, covering whole
States and groups of States, being issued at a few
main forecasting centers, while the latter, applying
to a single town and its vicinity, are issued at a large
number of the ordinary Weather Bureau stations.
There is a long list of forecasts and warnings intended
for special classes of the community; indeed
the specialization of forecasts is carried so far that
an individual citizen or a single business firm can
generally obtain, by asking for it, a forecast of any
specified predictable feature of the weather for a240
particular place. The established types of special
prediction issued regularly, or when conditions warrant,
include wind and weather forecasts and storm
warnings for mariners; shippers’ forecasts, relating
to temperatures injurious to perishable goods; aviation
forecasts; “fire-weather” warnings, issued when
the weather is conducive to fires in the western forests;
avalanche warnings; and several different
kinds of advices for the benefit of agriculture and
horticulture. The United States Weather Bureau, although
it is not the only branch of the Government
that carries on work in hydrology, is the one charged
with the duty of issuing river-stage predictions and
flood warnings. An elaborate organization is maintained
for this purpose, and the results are extremely
successful.
The period of time covered by an official weather
forecast is generally from one to two days. In this
country the morning forecast is ordinarily for 36
hours from 8 a. m., and the evening forecast for 48
hours from 8 p. m., but occasionally the period is
extended for an additional day. For some years the
Weather Bureau has issued every Saturday a forecast
in quite general terms relating to the whole of
the following week. These long-range forecasts are
made for extensive areas of the country, such as
the North and Middle Atlantic States, the Ohio
Valley and Tennessee, and the Great Lakes region.
“From the weekly forecast,” says an official publication,
“a farmer may know whether it is safe to cut
his hay at the beginning of the week or whether it
would be better to wait till the last of the week;
and a produce dealer may know whether it is safe,
at a particular time in the early spring, to start a
carload of strawberries to a northern market.” The241
British Meteorological Office follows a more cautious
plan. Its regular forecasts are for twenty-four
hours, but occasionally, when conditions are fairly
settled, announcements are made of what is termed
the “further outlook.” The same office sends notices
to the agricultural districts when a spell of fine
weather, favorable for haying or the like, appears
to be on the programme.
There are a few official meteorological establishments
that have embarked on much more ambitious
undertakings in long-range forecasting. The classic
example is furnished by the Indian Meteorological
Department, which has issued seasonal forecasts of
rainfall ever since 1882. These were originally based
upon reports of the snowfall in the Himalaya, abnormalities
of which, as noted in the spring, appear
to be related to the intensity of the subsequent monsoon
rainfall. Eventually the Indian meteorologists
began to seek in more remote regions for clues to the
character of the Indian seasons, and they believe they
have found them; the barometric pressure in South
America and at Mauritius, the rainfall at Zanzibar
and Seychelles, the Nile flood, and summer rains in
Australia all seems to bear some relation to meteorological
conditions in India.
The study of world-wide interrelations of weather,
although it has not generally, as in the case just mentioned,
furnished the basis of official forecasts, has
engaged the attention of a great many able meteorologists.
We have spoken on another page of the
“centers of action” that seem to be such important
indexes to changes in the circulation of the atmosphere,
with concomitant fluctuations in weather.
Telegraphic reports from some of these centers, including
the Iceland and Aleutian lows and the Siberian242
and Azores highs, have helped to guide the
Weather Bureau in making its weekly forecasts.
Many attempts have been made to predict the
weather months in advance from variations in the
temperatures of the water in different parts of the
ocean or from the distribution of sea ice in high latitudes.
Another line of attack upon the problem of
long-range forecasting is through observations of
solar activities, as indicated by fluctuations in solar
radiation, the prevalence of sun spots, etc. Lastly,
an immense amount of energy has been expended
in efforts to detect definite cycles or periodicities
in the weather itself, without regard to their
causes. The thirty-five year period of rainfall and
temperature variations, announced in 1890 by Prof.
E. Brückner, has found a place in all the current
textbooks on meteorology, and several other alleged
weather periods have been the subject of serious
discussion.
From all of which it appears that the professional
meteorologist is not at all inclined to discountenance
attempts at long-range weather prediction, provided
they are made both honestly and intelligently. Unfortunately
the vast majority of people who, in all
ages, have indulged in this sort of vaticination—and
their name is legion—have been either dishonest
or ignorant, or both. The world is still
well supplied with them, and they are, undeniably,
a thorn in the flesh of the scientific forecaster,
who sometimes sees his predictions confounded with
theirs by the public, and who commonly incurs the
charge of jealousy and narrow-mindedness because
he declines to acknowledge brotherhood with the
cranks and impostors who hang about the outskirts
of his profession.
243
Quack weather predictions are nearly always made
for long periods in advance, and their popularity depends
upon the fact that they give the public something—however
fallacious it may be—that science
does not attempt to give. The making of such predictions
appears to be a particularly easy way of
acquiring both fame and fortune. In this country
there has hardly ever been a time when some exponent
of this industry did not enjoy a nation-wide
reputation. It is a satisfaction to record, however,
that foreign countries produce the same sort of
celebrities. Dr. Gustav Hellmann, writing in Germany,
has recently published an extremely interesting
account of the famous “weather prophets” of the
19th and 20th centuries. Their geographical distribution
is given as follows: Belgium, 2; Germany,
36; England, 25; France, 14; Italy, 2; Austria-Hungary,
8; Russia, 1; Sweden, 1; Switzerland, 5; Spain,
2; North America, 9. The list for the United States
is, to be sure, conspicuously incomplete, but we need
not grieve over the fact that the fame of the American
prophets omitted from the list has not spread
to the Old World.
The almanac is, as it has always been, the chief
stronghold of long-range weather predicting. Nobody
knows to what extent the almanac prognostications
are taken seriously by the public, or are meant
to be by the publishers. It is to be feared that the
percentage of the population that “swears by them”
is not inconsiderable. Almanac publishers would undoubtedly
perform a public service, and perhaps
save themselves some pangs of conscience, if they
would append to their weather predictions the statement
that, like the portrait of the gentleman who displays
his anatomy to the signs of the zodiac at the244
front of the book, they are published merely for the
sake of keeping up an old custom, and if they would
conclude every almanac with the following candid
avowal, which we find in Gabriel Frende’s “Almanack
and Prognostication” for 1589:
Thou hast my guess at daily weather
Here present in thy view.
My credit shall not lie thereon
That every word is true:
Yet some to please I thought it best
To shew my mynde among the reste.
245
CHAPTER XV
AGRICULTURAL METEOROLOGY
Two farmers are grumbling about the weather.
The scene is Ohio, the time July, and the prevalent
crop corn (i. e., maize).
Farmers have grumbled about the weather from
time immemorial. The point of interest in this particular
case is that the two grumblers do not agree
about what is wrong. Farmer A thinks the corn
needs rain. Farmer B declares that at this stage
rain would do more harm than good. Plenty of warm
sunshine is, he thinks, the right prescription to insure
a “bumper” crop. Of course Providence will do
as it pleases, and whatever weather comes, since it
cannot be cured, must be endured; but it is a matter
of practical as well as academic interest to get some
inkling betimes as to how your crop is going to turn
out, and the weather is likely to be the decisive
factor. Moreover, it is a very significant fact that
our two farmers are not of the same mind about
which atmospheric blessing is in default. It is painful
to reflect that an enormous amount of grumbling
about the weather on the part of the rustic community
must, at one time or another, have been misapplied.
It is a plausible assumption that farmers
have sometimes worried themselves to death over
meteorological events that were either harmless or
actually beneficial to their crops.
How can we arrive at the facts? Admitting, as
everybody does, that the weather has a preeminent246
influence upon plant life, is this influence susceptible
of analysis? Is there anything definite about it? Are
not the effects of various atmospheric conditions so
entangled with one another, and with the effects of
soil and methods of cultivation—to say nothing of insects
and plant diseases—as to baffle all attempts to
gauge them separately?
There is a new branch of applied science that
teaches farmers how to grumble right about the
weather. It is called Agricultural Meteorology. As
a coherent branch of knowledge, this subject is so
new that the first formal textbook about it in the
English language was published in the year 1920. It
happens that the author of this book, Professor J.
Warren Smith, of the United States Weather Bureau,
began his investigations in the new field by making
a careful study of the relation of weather to the
yield of corn in Ohio. Let us see what light his
studies shed upon the question at issue between our
friends A and B.
Day after day, and year after year, the principal
atmospheric conditions are observed and measured
at a great number of points scattered over the
State of Ohio, as they are elsewhere throughout the
Union, and the records thus obtained are carefully
compiled, summed up, averaged and otherwise
discussed by officials of the Weather Bureau. Thus
a great fund of detailed statistical information
about the weather is available for comparison with
the statistics gathered by other agencies concerning
the yield of crops and their condition at different
stages of growth.
Professor Smith’s analysis of the Ohio records
revealed a fact of so much practical importance
that this discovery alone suffices to place agricultural247
meteorology among the most fruitful branches
of knowledge cultivated by mankind. He discovered
that the success of the Ohio corn crop depends
chiefly upon the amount of rain that falls during
the month of July. The normal rainfall of that
month for the State is 4 inches, while the average
yield of corn during the past sixty years has been
34.5 bushels per acre. Comparing the values for
individual years, it is found that the yield is strikingly
sensitive to variations from the normal July
rainfall, and especially so when the rainfall is a
little more or less than 3 inches. Near this critical
rainfall point, a variation of one-fourth inch of
rain in July means a variation in the value of the
corn crop of Ohio of nearly $3,000,000, and a variation
of one-half inch makes an average variation
in the value of the crop of more than $7,500,000.
When the rainfall for July averages over 5 inches
the probable yield of corn will be more than 27,000,000
bushels greater than it will be if the rainfall
averages less than 3 inches. In other words, this
difference of 2 inches in the rainfall for the month
of July adds $13,650,000 to the income derived by
Ohio farmers from corn alone.
Variations of the temperature in July, in Ohio,
have been compared with variations in the yield of
corn, with the result that the temperature of the
month appears to have little effect upon the crop.
Thus we find Farmer A to have been right and
Farmer B wrong; but both were merely expressing
personal opinions based upon an insignificant sum-total
of experience. Science rests upon a surer
foundation.
Although the case of the Ohio corn crop is probably
simpler than most of those that agricultural248
meteorology has to deal with, for the reason that a
single meteorological element is, in this case, of
decisive importance, it illustrates a rule of quite
general application that has recently come to light;
viz., that in the growth of any particular crop there
is usually a rather brief “critical period,” when it is
most sensitive to the influence of weather. For
corn, in a considerable area of the northern United
States, this period is July, or more specifically, in
Ohio, the interval from July 11 to August 10. The
rainfall and temperature of other months have,
however, definite though minor influences, which
can be evaluated for the same regions.
With respect to the American “corn belt” in general,
it is not certain how far the rules deduced for
Ohio are applicable. Professor Smith has been inclined
to look upon July rainfall as the dominating
factor for the whole of that region; so that, for
example, a difference of 1 inch in the rainfall (viz.,
a total for July of 4.4 inches or more, as compared
with 3.4 inches or less) has been held responsible
for an increase of 500,000,000 bushels of corn in
the eight principal corn-growing States. It has
also been stated that in the four States of Indiana,
Illinois, Iowa and Missouri an increase of half an
inch of rain in July meant an increase of $150,000,000
in the value of the crop. These figures have,
however, been challenged, and the subject is still
under discussion.
The study of the critical periods of different
crops, and the determination of the amounts of heat
and moisture most favorable to the success of the
crop at such periods, may be regarded as the leading
task of the agricultural meteorologist. The
most elaborate researches of this character have249
been made in Russia by Professor P. Brounov, who
founded in 1896 a meteorological bureau, attached
to the Ministry of Agriculture, with an extensive
network of stations scattered over the Russian
Empire. This bureau was quite distinct from the
ordinary meteorological service, under the direction
of the Central Physical Observatory in St.
Petersburg. Just before the war Professor Brounov
had 150 stations in operation; most of them for observing
the effects of weather on the leading cereal
crops, though some studied the corresponding relations
of horticulture or the animal industries. Each
agricultural station comprised a small plot of land,
on which a certain sequence of crops was grown
year after year under conditions of cultivation as
nearly uniform as possible, the only variable factor
being the weather. Meteorological instruments
were installed in the immediate proximity of the
plants under investigation. Prior to 1914 Brounov
had determined the critical periods of most of the
crops grown in Russia, and had published a great
deal of information on this subject that could be
turned to practical account by Russian farmers.
It will perhaps not be immediately apparent to
the reader just how such information can be utilized.
Its practical applications vary, in fact,
according to circumstances. First of all, a knowledge
of critical periods and of the weather requirements
of crops at these periods enables the farmer
to select his crops and time his farming operations
on the basis of climatic statistics. Brounov published
a series of charts showing the probability of
dry weather, as deduced from many years of observations,
for each ten-day period throughout the
agricultural year for every part of European250
Russia. With such charts at our disposal, and
knowing how long after planting each crop arrives
at its critical period with respect to moisture, we
can readily estimate the probable success of a given
crop planted at a given time and place; at least, so
far as this is determined by rainfall. If temperature
or other meteorological conditions are of special
importance at the critical periods, we shall need
additional climatic charts. Of course, the weather
in any particular year may differ widely from the
climatic averages; but in the long run crops will
prosper in proportion as their critical periods coincide
with the occurrence of favorable weather as
shown by the climatic record. It will be seen that
this is quite a different idea from the traditional
one that a certain crop needs a “moist climate,”
another a “hot climate,” etc. The agriculturist now
asks the man of science to tell him when, between
planting and harvesting, heat or moisture is of vital
importance to the crop, and how much of each will
produce the biggest yield.
In regions where irrigation is practiced it is obviously
advantageous to the farmer to know at
what stage of its growth a crop becomes sensitive to
the amount of moisture received. During the
greater part of its life the plant may be quite indifferent
to moisture, and at such times irrigation
would be wasteful. The farmer needs to know not
only when the critical period has arrived, but also
what the water requirements are at that period.
Too much water may be as bad as too little.
Even when agricultural practice ignores the
rules laid down by the agricultural meteorologist, a
knowledge of these rules may be applied with great
advantage to the prediction of crop yields. It is251
hardly necessary to tell any farmer or business man
that accurate crop forecasts are an economic desideratum
of the utmost importance. The United
States Government maintains an army of more
than 200,000 volunteer crop reporters, supervised
by a staff of experts, for the purpose of determining
month by month the condition of every agricultural
crop and its prospective yield. With regard
to the monthly announcements of the Bureau of
Crop Estimates, Professor H. L. Moore, of Columbia
University, says:
“The commodity markets are in a state of
nervous expectancy as the time approaches for the
official forecasts, because great values are at stake.
It has been estimated that in the case of the cotton
crop alone an error in the forecasts which should
lead to a depression of one cent a pound in the price
of cotton-lint would—assuming a crop equal to that
of 1914—entail a loss of eighty million dollars to the
farmers. The vast values at stake and the dangers
when no official estimate is available of the manipulation
of the markets in the interest of speculators
are held to justify the large recurrent annual
cost of the employment of the numerous correspondents,
clerks, and experts.”
Professor Moore is one of those who have pointed
out that the forecasts based upon the actual condition
of the growing crops can be vastly improved
by a mathematical analysis of the weather reports
from the various regions in which the crops are
grown. In fact, he goes so far as to assert that
much better forecasts can be made from the
weather reports alone than from reports on the
condition of the crops. Whether or not this view
is unduly optimistic, it goes without saying that252
the precise data which agricultural meteorology is
now acquiring cannot fail to enhance greatly the
accuracy of crop forecasts.
Of course, the weather has always been watched
with keen interest by everybody concerned with
the purchase or sale of agricultural products and
has been one of the chief factors determining the
rise and fall of prices. At produce exchanges
throughout the United States daily weather bulletins
are received from the agricultural districts,
and at many of them a large weather map is drawn
every morning by an employee of the Weather Bureau
detailed for this purpose. The Bureau has
made various other arrangements for supplying the
information that is so eagerly desired concerning
the weather as it affects crops, as well as the animal
industries. During the “growing season” in the
cotton, corn, wheat, sugar, rice, broom-corn and
cattle-producing areas, designated centers receive
telegraphic reports of rainfall and the daily extremes
of temperature from substations in the
regions concerned, and these are distributed in
bulletin form. Each local center, besides publishing
detailed reports from its own area, issues condensed
reports from all the others. The Bureau
also issues every week during the agricultural season
a “National Weather and Crop Bulletin,” with
text and charts setting forth the current conditions
of moisture, temperature, etc., and the state of the
crops in all parts of the country.
The use which dealers and farmers make of these
weather reports is, however, very far from having
been reduced to science. Some of these persons,
it is true, are frequently able, by a purely instinctive
process of deduction, to make successful forecasts253
of crop yields from a close study of the
weather, and others have worked out crude rules
of their own for the same purpose; but the agricultural
meteorologist approaches the problem in a
different way. Immense progress has been made
in the past decade in applying the mathematical
theory of correlation to this problem. This branch
of mathematics, originally developed chiefly for statistical
studies in biology by Galton, Pearson, and
others, is now extensively used by meteorologists not
only for studying the effects of weather on crops, but
also for finding out what correspondences or relationships
exist between variations of weather in different
parts of the world, as well as between weather
and sun spots, weather and vital statistics, etc.
Sometimes, when the farmers do not disagree
on the subject of favorable and unfavorable
weather for the crops, they hold opinions in common
that agricultural meteorology is unable to substantiate.
An illustration is found in the idea that
a good covering of snow during the winter is favorable
to the yield of winter wheat. Apparently this
is one of the host of popular ideas that are based
merely on the delusive foundation of “everybody
says so.” Smith has investigated the statistics of
wheat for Ohio and C. J. Root those for Illinois. In
both cases their results negative the prevailing
opinion. Professor Smith finds “some evidence to
indicate that wheat has a better prospect if it is not
covered by snow during the month of January,”
while Mr. Root states that, in general, “the winters
of light snowfall are followed by good wheat yields
and the winters of heavy snowfall by light yields.”
The study of the relations between weather and
crops is really a branch of a science of broader254
scope, known as phenology. This science is devoted
to the investigation of all periodic phenomena of
plant and animal life that are controlled by the
weather. There are, in some parts of the world,
large corps of phenological observers, who maintain
records year after year of the leafing, flowering,
and fruiting of both wild and cultivated plants,
the migrations and first songs of birds, and various
other events of a biological character that recur
with the seasons. In the course of time it becomes
possible to compute from such records the normal
dates of these events; and then, in any particular
year, a comparison between the actual dates and the
normal shows whether the season is early or late,
and by how many days. Phenological observations
on plants also make it possible to draw charts showing
the normal march of the seasons over a country,
expressed in terms of plant life, and such charts
are often more valuable to the agriculturist or horticulturist
as a guide in selecting varieties for cultivation
and in timing his operations, than any
charts that can be compiled from ordinary climatic
data. Some admirable charts of this kind have
been drawn for parts of Europe.
There are many practical applications of phenology
to agriculture, and there would be more if
phenological observations had been made more extensively
throughout the world. Good phenological
charts of different regions would, for example,
greatly facilitate the work of foreign plant introduction
carried on by the United States Bureau of
Plant Industry. In the United States phenological
observations were made systematically between
1850 and 1863, but only desultory work has been
done in this line subsequently. The most comprehensive255
individual record is that maintained by
Thomas Mikesell from 1873 to 1912, at Wauseon,
Ohio, and published in full by the Weather Bureau
in 1915.
The old rule of American farmers, inherited
from the Indians, that the time to plant corn is
when the leaf of the white oak is “the size of a
mouse’s ear,” illustrates the use that can be made
of so-called “index plants” of the native flora as
guides for farming operations. Professor A. D.
Hopkins writes on this subject:
“If such guide plants do not occur on the farm,
they can be found among the ornamental trees and
shrubs and hardy flowering plants of other localities
or countries and transplanted. The periodical
event of the falling of the flower catkins of the
Carolina poplar has been found to be one of the
best guides to the general early or late character
of one season as compared with the average, while
the opening of the leaf buds and unfolding of the
leaves serve as reliable guides to the progress of
spring. The various magnolias in their succession
of flowering events serve as excellent guides to the
rate of progress of spring and the time to do various
kinds of work. The ornamental Spiræas,
Deutzias, Diervillas, climbing roses, and Clematis
among the ornamentals, and the dogwood, service
tree, redbud, and oaks among the native trees of the
middle and eastern regions of the United States
are more or less constant in their response to prevailing
local influences which are indicative of the
time to plant certain field and garden crops. The
opening of the leaf and flower buds and the flowering
of the common fruit trees and shrubs of almost
every farm serve as more or less reliable guides to256
the time to spray for certain insect and plant
diseases.”
Dr. Hopkins has worked out an interesting rule
known as the “bioclimatic law,” according to which
the periodical events of plant and animal life advance
over the United States at the rate of 1 degree
of latitude, 5 degrees of longitude, and 400 feet of
altitude every four days—northward, eastward, and
upward in spring, and southward, westward, and
downward in autumn. Thus, when the date of any
phenological occurrence is known for one locality,
it may be approximately determined for any other.
This law has enabled the Department of Agriculture
to publish rules of general application concerning
the best time to plant winter wheat in order to
escape the ravages of the Hessian fly, thus saving
many millions of dollars to American farmers. The
same law is susceptible of various other profitable
uses.
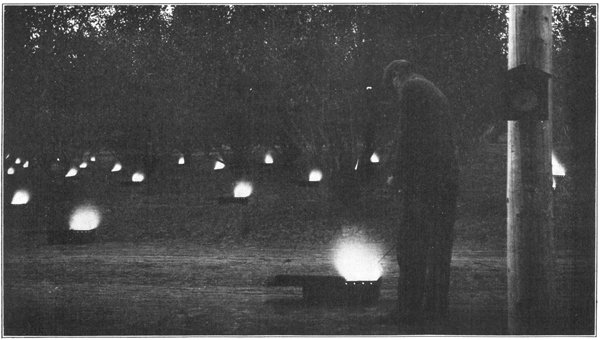
Orchard Heaters in Operation. The economical use of this method of frost protection depends upon accurate forecasts of
the right time to “fire” the orchard. (Courtesy of Hamilton Orchard Heater Co.)
The United States Weather Bureau has been a
branch of the Department of Agriculture since
1890, and a very large share of its routine work is
devoted to the agricultural interests of the country.
The climatological statistics that it has assembled
are indispensable in many departments of agricultural
research, besides furnishing varied information
of practical value to farmers. The Bureau
has developed a number of special types of forecasts
for the rural industries; such as predictions,
three or four days in advance, of favorable weather
for cutting alfalfa; forecasts of weather unfavorable
for sheep-shearing; notices to fruit growers of dry-weather
periods in which fruit trees should be
sprayed; and warnings of the occasional summer
showers that would do so much damage to the great257
raisin-drying industry of California but for the
vigilance of the forecasters and the efficient arrangements
made by the industry itself for disseminating
and acting upon the warnings. Of course, the ordinary
daily weather forecasts, storm warnings, and
cold-wave warnings are valuable in many ways to
agriculturists, and the Bureau has made great efforts
to give such information prompt and general distribution
in the rural districts. The forecasts are
generally displayed in post offices, and in many cases
the rural telephone exchanges are pressed into
service to distribute weather information regularly
to all their subscribers. Some exchanges sound a
signal every morning when the forecast is ready
for distribution. Lastly, the wireless telegraph and
the wireless telephone, which, in the immediate
future, will form part of the equipment of every
up-to-date farm, afford ideal channels for the dissemination
of weather news and are already extensively
used for this purpose.

A Snow Surveyor at Work. Note the cylindrical snow sampler, with
its serrated cutting edge, and spring balance for weighing the sample
of snow (Photographed by J. C. Aller.)
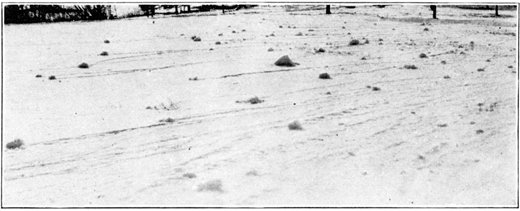
Snow Rollers, or Wind-Blown Snowballs on a Lawn at Potsdam,
N. Y. (Photographed by T. J. Moon.)
There remain to be mentioned the various steps
the Weather Bureau has taken to protect the rural
industries from the night frosts of spring and
autumn, in the shape of special forecasting arrangements,
the publication of frost charts, and a wide
range of scientific investigations. The Bureau’s
undertakings in this line are merely a part, though
a leading one, of a great campaign of frost protection
that is being carried on by scientific and
official agencies in this country on a larger scale
than anywhere else in the world.
Frosts, classified according to their severity as
“light,” “heavy,” and “killing,” are most likely to
occur in spring and autumn, when an extensive
area of high barometric pressure brings its usual258
accompaniment of clear skies and calm nights.
They are predicted on a general scale from the
weather map, and locally from indications of temperature
and humidity and a knowledge of important
topographic influences, such as those due to
hills and valleys and neighboring bodies of water.
In agricultural usage the term “frost” is applied
to the occurrence of a temperature low enough to
kill or injure tender vegetation, such as growing
vegetables or the buds, blossoms, and fruit of fruit
trees. The occurrence of a frost, in this sense, is
not necessarily identical with the deposit of ice
crystals known as “hoarfrost.” Different species
and varieties of plants are, of course, susceptible in
very different degrees to the effects of low temperature;
i. e., they differ greatly in “hardiness.” In
the case of fruits and vegetables the danger point
generally lies a little below the freezing point of
water (32 degrees F.).
The occurrence of frost is favored by the rapid
cooling, by radiation, of the earth and its plant
covering, which goes on at night under a clear sky
and in still air. Under these conditions a layer of
stagnant, cold air forms close to the ground, with
warmer air lying above it. The difference in temperature
at different levels is often so pronounced
that fruit on the lower branches of a tree is killed
while that growing on the higher branches remains
uninjured. Similarly, frost will occur in the bottom
of an inclosed valley but not on the surrounding
slopes. In the case of a valley the layer of cold
air that forms at the bottom is commonly deepened
by additional cold air draining down from the hills.
Many large orchards have their “warm spots”
and their “cold islands” or “north poles,” well259
known to the orchardist; due in some cases to the
nature of the soil rather than to topography.
Certain mountain regions in North Carolina are
famous for their “thermal belts” or “verdant
zones”; i. e., areas part way up the slopes that
escape the frosts occurring both above and below
them. These frostless belts, which have been the
subject of numerous investigations for three-quarters
of a century, seem to mark the upper level
of the pool of cold air that collects in the valley by
drainage from the mountainsides. A detailed temperature
survey of the thermal belt region of North
Carolina was made during the years 1912–1916 by
the United States Weather Bureau and the North
Carolina State Board of Agriculture. In some
places the minimum temperature at night was
found to be 15 or 20 degrees higher in the thermal
belt than at the bottom of the valley, a few hundred
feet below.
Clouds, by checking radiation from the earth,
and wind, by mixing the colder and warmer layers
of air together, both prevent frosts that would
otherwise occur. Artificial methods of protection
include covering plants with screens of wood, paper,
or cloth, building smudge fires to provide a blanket
of smoke (a method of doubtful value), and, above
all, heating by means of wood fires or various types
of “orchard heater,” burning either oil or coal. An
elaborate technique of orchard heating has been
developed, having in view especially the most
economical use of fuel and labor consistent with the
object to be attained. In many cases orchards are
provided with alarm thermometers, which ring a
bell when the temperature approaches the danger
point in the orchard.
260
The local prediction of frost from the readings
of meteorological instruments is a problem that
has not been fully solved. The idea formerly prevailed
that the temperature of the dew point, as
determined from readings of the dry-bulb and wet-bulb
thermometers in the early evening, was a safe
guide to the fall of temperature to be expected during
the night, but this belief has not stood the test
of accurate observations. At the present writing
certain formulas involving data of both temperature
and humidity are being used experimentally by
Weather Bureau specialists for predicting the
lowest temperature of the night when the general
conditions indicate that frost is possible. A comprehensive
discussion of this subject has been published
by the Bureau as Supplement No. 16 of the
“Monthly Weather Review.” (Washington, 1920.)
261
CHAPTER XVI
COMMERCIAL METEOROLOGY
It is a significant fact that the American Meteorological
Society, which was organized in 1919, has
a Committee on Commercial Meteorology. The appointment
of this committee was one of the earliest
tokens of the fact that the applications of meteorology
to business, always recognized to be important
and far-reaching, had at last been segregated as a
distinct field of inquiry. The time is near at hand
when this field will have its corps of specialists and
its textbooks. Courses in commercial meteorology
will be given in business colleges, and meteorologists
will be attached to the staffs of large business enterprises.
The chamber of commerce of a wide-awake
western city already maintains a Department of
Meteorology, with a former Weather Bureau official
at its head, and “consulting meteorologists,” now
practicing their novel profession in other parts of
the country, find their principal clientele among
business concerns.
Weather not only influences most kinds of business,
but is the foundation of many of them. Plenty
of illustrations of the latter fact will be found in
every large department store. Umbrellas, rubbers,
and mackintoshes are made and sold because of rain;
their best market is in countries with rainy climates,
and their sale from day to day fluctuates with the
state of the sky. Electric and palm-leaf fans are a262
drug on the market or the reverse, according to the
readings of the thermometer. Sleds and ice skates
are sold where and when the weather is cold. This
list may be prolonged ad lib. If we leave the department
store and walk along any business
thoroughfare, we shall discover other striking examples
of commercial undertakings that owe their
existence chiefly or entirely to the weather. Abolish
cold weather and you abolish the dealer in furnaces
and heating stoves, besides reducing the rank of the
coal-dealer considerably below the “baronial” level.
Eliminate hot weather from the meteorological program
and the ice dealer will likewise tumble from
his high estate.
All this is so obvious that it seems hardly worth
while setting down; and yet the paradox must somehow
be explained that business men have not, in
general, paid much attention to meteorology, and
that they have made only fragmentary use of the
official meteorological establishments that were
created, in part, for their benefit. Probably this
paradoxical situation is merely a case of mental
inertia. During the long ages of traffic before
there were any weather maps, scientific weather
forecasts, or climatic statistics, the weather was necessarily
an unknown quantity in the mathematics of
buying and selling. That it is not so to-day is a fact
to which the business mind has been very slow in
adjusting itself.
We have mentioned some of the obvious relations
of weather to commerce, but there are others
that are not so obvious. Many of these are indirect.
Thus the effects of the weather on agriculture are
nearly always reflected in the commercial world. It
is not the farmer alone who suffers from a prolonged263
drought, for example. It has been asserted
that every severe financial panic in our history has
been closely associated with a protracted period of
deficient rainfall, and that there has been no period
of protracted drought without a severe financial
panic except one that occurred during the Civil War.
Mr. H. H. Clayton, who published this assertion in
1901, has cited the case of the wheat crop as illustrating
the magnitude of the effect that rainfall exercises
on economic conditions in general through its
effects on agriculture.
“If,” he says, “the amount of wheat raised in the
United States were reduced one-half or even one-third
by a year of deficient rainfall, it is easy to
imagine an enormous strain on the business of the
country, and with a succession of such years the
effect might mean disaster. Such a deficiency in
the wheat supply, with wheat at 80 cents a bushel,
would mean for a single year a direct loss in wealth
of more than $100,000,000; it would mean that
nearly all the wheat which is usually shipped abroad
would be needed at home; it would mean that thousands
of railroad cars and ships which ordinarily
transport this grain would lie idle, that thousands of
men who usually handle this grain in transport
would be out of employment, that farmers in large
numbers would be unable to meet their obligations,
and consequently that banks and business of all
kinds would suffer.” Recent prices of wheat give
added force to these statements.
In contrast to such broad relations of the weather
to business, it may be interesting to point out certain
relations which are of so special a character that,
although familiar to hosts of business men, they
have generally escaped the attention of writers on264
economics. On this subject Mr. John Allen Murphy
says:
“Retail sales are influenced tremendously by the
weather. This is one factor that makes it impossible
for a retailer to equalize the peaks and valleys
in his sales chart. Favorable weather will bring
him a rush of business. A bad day will keep patrons
from his store. There is nothing he can do to prevent
it. Many merchants have tried the plan of
offering ‘stormy day specials,’ but at best such a
scheme is only a makeshift that seldom works. The
weather also affects the buying moods of people. A
dark, dreary day in summer seems to influence humans
to take on the same cast as the atmosphere.
They are grouchy and hard to please. On the other
hand, a cold day in winter has the opposite effect.
The warmth and cheer of the store is such a pleasant
contrast to the out-of-doors that shoppers like to
linger over the wares and indulge themselves more
readily in the luxury of buying.
“A stormy day or a series of them always helps
the mail-order business. In such weather people are
inclined to stay at home. In passing the time, they
are likely to thumb the pages of such catalogues as
they have and thus see in them articles that they
want. On the farm, especially in the bleak days of
winter, it is often the custom to order garden seeds,
incubators, tools, and many other things that will be
needed as soon as spring opens up. On a bad day
traveling salesmen find it easier to get the ear of a
merchant. Not being busy with customers, he is
prone to be more lenient toward the ‘boys with the
grips.’”
Another writer on this subject, Mr. F. C. Kelly,
says:
265
“In a large city, the business of a department
store is seriously hurt by rain in the forenoon, but
rain in the early afternoon is usually a big help.
Most customers of a big-city department store are
women, and nearly all of them live some distance
from the store—at the edge of the city or in the
suburbs. If it rains along about eight or nine o’clock
in the morning, the woman who had planned to go
shopping that day is quite likely to change her
mind, even though she did not intend to go until
afternoon. The rain not only suggests discomfort
in getting about, but diminishes her desire or immediate
need for certain articles, and drives the
shopping idea out of her head. On the other hand,
if it is bright and clear in the morning, but clouds up
about noon for a heavy downpour which lasts most
of the afternoon, it is the best thing that could happen
for the department store, because shoppers get
in and cannot comfortably get out. They shop all
over the store, buy luncheon there, and shop some
more. While the rain is thus helping the department
stores, it may hurt the smaller shops, because
many customers who would otherwise look around
are obliged to do their buying all under one roof.”
No aspect of business more faithfully reflects the
weather, or, in a somewhat less degree, the weather
forecasts, than advertising. So important is it, in
many lines of business, to make advertising fit the
weather that one might expect merchants to be, as
a class, as weather-wise as sailors and farmers. A
page of advertising in a great metropolitan newspaper
is a costly investment. If, for example, it invites
the public to pay a Sunday visit of inspection
to some haven for homeseekers in the suburbs and
Sunday turns out to be the kind of day that converts266
building-lots into bogs, the advertiser will perhaps
be led to inquire whether there is not some means of
avoiding another such fiasco; and he may thus make
the surprising discovery that meteorology is not
entirely a theoretical science. The conjunction of a
conspicuously advertised sale of rubbers and a soppy
week-day morning may be either a lucky accident or
the result of studying the weather map. In the
former case, supposing the business to be conducted
in the northeastern United States, where dry
weather is about twice as common as wet, the odds
would be two to one against the occurrence even of
light showers on the day the advertisement appeared,
and three or four to one against the occurrence
of such weather as would make the advertisement
decidedly à propos.
These remarks about newspaper advertising are,
to a great extent, applicable also to the dressing of
windows and the display of goods inside the shop.
In both cases a moderate amount of foresight in the
matter of weather will result in placing before the
customer the right goods at the right time. One of
the minor ways in which the merchant can turn the
science of meteorology to advantage consists of
using meteorological instruments and the official
weather forecasts and bulletins for the purpose of
attracting attention to his windows or to his stock-in-trade.
The drug-store thermometer is the illustration
of this process that comes first to one’s mind.
There is no reason why, with the progress of civilization,
this celebrated instrument should not be made
a trustworthy index of temperature as well as an
effective advertisement. In continental Europe
weather instruments are displayed along with miscellaneous
advertising matter in many of the street267
“weather columns” (Wettersäulen), which furnished
the idea of the meteorological kiosks installed
by the Weather Bureau in American cities.
One of the most important branches of commercial
meteorology relates to the effects of weather upon
transportation. This is a many-sided subject. In
the first place, the railway and steamship companies,
and other concerns engaged in the transport of
goods and passengers have their manifold weather
problems, among which one may mention, at random,
that of dealing with the snow blockades of railways,
precautions against the skidding of taxicabs in
wet weather, the avoidance of iceberg-infested routes
at sea, and the selection of climatically favorable sites
for aerodromes. The shipper has a somewhat different,
but overlapping set of weather problems.
“In the building of railroads,” says Mr. E. L.
Wells, “many phases of climate are to be considered,
including the probability of floods, deep snows, high
winds, sand storms, etc. It is not long since a considerable
length of railroad line in one of the Western
States was found to be practically worthless because
of having been built too near the bed of a
stream and therefore being too much subject to
damage from floods, so it was replaced by a line built
higher up. The writer remembers two railroads
entering the same town in one of the northern plains
States, one of which is seldom blockaded, while the
other is sometimes closed by snow for months at a
time. In the former case the cuts are parallel to
the wind, while in the latter the wind blows directly
across the cuts. In operating railroads a knowledge
of the climate is essential. This is particularly true
in the shipment of perishable products, which may
require icing or ventilation as a protection against268
high temperature, or insulation against cold. Not
only is a knowledge of climatic conditions essential
in taking precaution against loss in transportation,
but weather records are playing an increasingly
large part in the settlement of claims for products
and property damaged in transit. The claim agents of
the leading transportation companies and the traffic
managers of the commission houses and producers’
associations keep complete files of climatological
data, and a large percentage of claims for damaged
goods, whether they be for a trainload of chilled
bananas or for a traveling man’s samples ruined by
rain, are now settled out of court on the basis of the
weather records. Claims for car demurrage are
often settled on the basis of the weather reports.”
Detailed information concerning the effects of
temperature on all sorts of food products, both in
transportation and in storage, was collected by the
Weather Bureau some years ago and published as
the Bureau’s Bulletin No. 13.
While the domestic shipper can easily obtain from
the Weather Bureau detailed climatic statistics for
all parts of the United States, as well as the current
weather reports for this country, and can profit
greatly by regulating his operations in accordance
therewith, it is not quite so easy for the shipper to
foreign markets to obtain the corresponding data of
foreign countries. With the expansion of our foreign
trade, the demand for such data has grown to
large proportions. The Weather Bureau, which has
an unrivaled meteorological and climatological library
in Washington, is naturally the place where
such data are most frequently sought, but the labor
entailed in extracting and digesting the information
in response to individual requests is often too great269
to be undertaken by a Government office, where the
time of the employees is absorbed in routine duties.
There is, therefore, a promising field here for the
private commercial meteorologist. Unofficial work
in this line is already carried on to some extent.
Thus a great steel company in New York has a
salaried “consulting geographer” on its staff, who
advises on meteorological questions. One of the
problems he has been called upon to solve was to
determine the proper dates for shipping steel from
Atlantic and Pacific ports of the United States to
various places in India, so that it would never arrive
during the monsoon rains. Records of current and
very recent weather in distant countries are, in a
great majority of cases, unobtainable anywhere in
the United States. The interchange of detailed
weather reports between the different meteorological
services of the world involves in the first place, with
few exceptions, a painfully slow process of publication,
and then distribution by mail; so that, for
example, records of observations at some places in
South Africa or Australia, or even many parts of
Europe, do not reach the Weather Bureau Library,
in Washington, until two or three years after the
observations are made. Undoubtedly the time will
come—and probably in the near future—when there
will be a world-wide exchange of weather news by
wireless telegraphy.
One kind of business wholly dependent upon the
weather, which we have not yet mentioned, is
weather insurance. There are several kinds, but
hail insurance and tornado insurance are those extensively
practiced; the former much more widely
and systematically in the Old World than in the
New, while the latter is confined to America. Insurance270
against frost is said to have been practiced
in Germany, and there appears to be an excellent
field for it in the United States. The insurance of
outdoor events, such as games, shows, and al fresco
parties, against rain has been carried on for a good
many years by speculative underwriters at Lloyd’s,
in England, and has more recently been undertaken
in this country. Of course the weather element enters
to a considerable degree into other kinds of insurance.
Ordinary marine insurance is, to a large
extent, insurance against storms; fire insurance is
partly insurance against lightning; window and
plate glass insurance involves the risk of breakage
by wind and hail; and even life insurance is greatly
concerned with the effects of weather and climate.
271
CHAPTER XVII
MARINE METEOROLOGY
That it behooves a sailor to be weather-wise has
always been admitted, but there was a time,
almost within the memory of men now living, when
neither seamen nor landsmen had the remotest conception
of the benefits that a systematic study of the
meteorology of the sea was capable of conferring
upon the maritime world. The man who first
grasped the importance of such a study and translated
his ideas into facts was the American naval
officer, Lieutenant Matthew Fontaine Maury.
During his brief career at sea Maury became impressed
with the meagerness of the information then
available concerning the winds and currents that
aid or hinder the voyages of sailing ships. When,
in consequence of an accident that incapacitated him
for shipboard duties, he was assigned to service in
Washington, he began to explore the old logs of
naval vessels, filed in the Navy Department, for
notes on meteorological conditions, and eventually
developed a plan of securing regular observations
from both the Navy and the merchant marine. The
result of this undertaking was the publication of the
famous Wind and Current Charts, which revolutionized
navigation throughout the world.
The practical value of these charts, of which 200,000
copies were distributed to the masters of merchant
vessels of all nationalities, was promptly272
recognized. By taking advantage of the favorable
winds and currents shown on the charts, and avoiding
those that were unfavorable, mariners were able
to reduce the average time of a sailing voyage between
the Atlantic and Pacific ports of the United
States by forty days. The money value of the charts
to vessels sailing from the United States to South
America and the Far East was estimated at $2,250,000
per annum. British shipping on all seas is
said to have benefited to the extent of $10,000,000
per annum. Neither was the utility of the charts
limited to the saving of money. The following
episode is cited in Maury’s biography:
“When the San Francisco, with hundreds of
United States troops on board, foundered in an
Atlantic hurricane, and the rumor reached port
that she was in need of help, everyone looked to
Maury as the only man in the country who could
tell where to find the drifting wreck. To him the
Secretary of the Navy sent for information. He at
once set to work and showed how the wind and currents
acting upon a helpless wreck would combine
to drift her ‘just here’, pointing to a spot on the
chart, and making a cross mark with the blue pencil
he had in his hand. Just there the relief was sent,
and just there the survivors of the wreck were
picked up. This was an incidental result of his
study of winds and currents.”
A further outcome of Maury’s enterprise was the
holding, at his suggestion, and by invitation of the
United States Government, of an International Maritime
Conference, which met in Brussels in 1853,
and worked out a world-wide plan for meteorological
observations at sea. The work thus begun has since
been carried on by the leading maritime nations of273
the world. In the United States the duty of gathering
weather reports on a uniform plan from vessel
masters has been intrusted, at different times, to
the Hydrographic Office, the Signal Service, and
the Weather Bureau. It is now performed by the
last-named institution, through its Marine Division,
but the Pilot Charts and books of sailing directions
(“Pilots”) in which the compiled information is
published, are issued by the Hydrographic Office of
the Navy.
The modern successors of Maury’s Wind and Current
Charts are, especially, the Pilot Charts for the
different oceans issued monthly in Washington, and
the monthly charts of similar character published
by the British and German governments. Apart
from these periodical publications, valuable collections
of meteorological charts for oceans or
smaller marine areas have been published by the
British, German, Dutch, Indian, Japanese and other
authorities.
The value of such publications has not been
lessened by the gradual substitution of steam for
sails on ocean-going vessels. While wind is no
longer all-important, it is a factor in determining
the speed, and hence the earning capacity, of all
classes of ocean shipping, and the same is true of
marine currents. Fog and drifting ice are, in general,
more serious obstacles to steamers than to sailing
ships. A glance at one of the Hydrographic
Office Pilot Charts will suffice to show that these
publications are indispensable to the mariner. On
these charts we find, first of all, in the center of each
five-degree square of latitude and longitude a “wind
rose” showing the frequency of the winds that have
been observed in that region from each of the cardinal274
points, and their average force from each direction.
On the charts will also be found the
routes recommended for full-power and low-power
steamers and sailing vessels, lines of magnetic variation,
tracks of storms in past years for the month in
question, location and force of currents, average
limits and prevalence of fog for the month, recent
information about drifting ice and derelicts, descriptions
of storm signals, and an abundance of
other information of vital importance to the seaman.
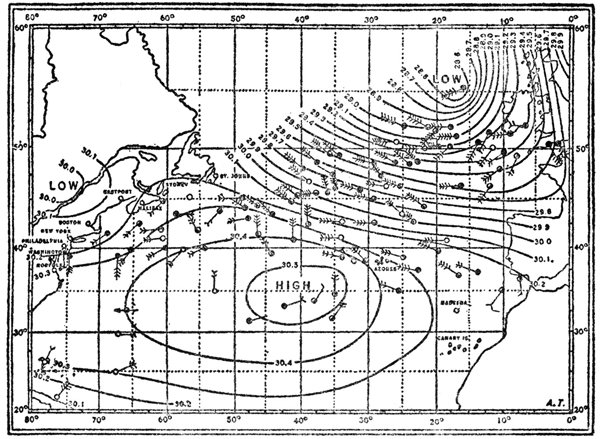
OCEAN WEATHER MAP PREPARED FROM VESSEL REPORTS
JAN. 11, 1913, GREENWICH MEAN NOON
U. S. Weather Bureau
Solid black lines are isobars. Arrows fly with the wind, the center of
the arrowhead marking the position of the vessel, and the number of
feathers denoting the force of the wind on the Beaufort scale. Shading
of the head shows degree of cloudiness.
Most of the material used in the preparation of
the charts above described is obtained from a great
corps of volunteer marine observers, who enter their275
observations at stated hours in forms provided for
the purpose and send these records to the establishment
in charge of the work at the end of each voyage.
The forms furnished by the United States
Weather Bureau prescribe only one regular observation
a day, to be taken at Greenwich mean noon.
Each observation shows the position of the ship, the
direction of the wind, the force of the wind on the
Beaufort scale, the height of the barometer, the
readings of the dry-bulb and wet-bulb thermometers,
the temperature of the water at the surface, the state
of the weather, and the kind, amount, and movement
of clouds. In order to check the accuracy of
the barometric readings, the observer is instructed
to read his barometer at prescribed hours on three
successive days when in port and send the readings
to the Weather Bureau. On receipt of these readings
the Bureau compares them with those of the
nearest meteorological station, and then mails the
observer a “barometer tag,” showing the results of
the comparison and the error of his instrument.
Besides keeping up these routine observations, the
observer keeps a record of fog encountered at any
hour of the day and makes detailed reports on
storms. Many marine observers also report observations
at stated hours by wireless telegraphy.
The enormous fund of information thus collected
over the ocean is applied to several purposes besides
the construction of Pilot Charts. Our Weather
Bureau and certain foreign meteorological institutions
prepare daily charts, showing approximately
the instantaneous conditions over great oceanic
areas, especially the North Atlantic. These maps
are analogous to the daily weather maps published
for land areas, but the drawing of each map is, necessarily,276
delayed for several months after the date
to which it refers, in order to allow time for the receipt
of as many reports as possible from ships at
sea. As a rule such charts are prepared in manuscript
only, but, though they cannot be distributed
after the manner of ordinary weather maps, they are
valuable for studies in the institution itself on the
movements of storms and other atmospheric processes.
They also enable the meteorological officials
to answer inquiries concerning the winds and
weather that have prevailed over a particular part
of the ocean on any specified date. Such inquiries
come from vessel owners, underwriters, and others,
and the replies are frequently used as evidence in
admiralty suits.
In the case of one series of such maps—viz., the
daily synoptic charts of the North Atlantic, begun by
Niels Hoffmeyer, of Copenhagen, and now prepared
jointly by the Danish Meteorological Institute and
the Deutsche Seewarte, in Hamburg—the charts
have actually been published and sold, though they
are so costly that the number of sets in libraries
throughout the world is probably small. These remarkable
charts present daily pictures of the winds
and barometric pressure over the North Atlantic
Ocean and the adjacent continents from 1873 to
1876, and from 1880 down to a recent date.
From what we have already said it will be seen
that the marine observers cooperating with the
United States Weather Bureau and kindred institutions
abroad are all contributing toward the great
task of recording the history of the weather over the
oceans from day to day and assembling data that
can be digested in the form of marine climatic
statistics and used as the basis for many scientific277
investigations. This concerted undertaking does not,
however, constitute the whole scope of marine
meteorology. Every intelligent mariner finds it
necessary to acquaint himself with the laws of the
winds, indications of coming storms, means of determining
the proximity of icebergs, the systems of
storm signals used in different countries, the method
of constructing weather maps from wireless bulletins,
etc. He ought, in short, to become an accomplished
meteorologist.
One of the classic problems of the navigator is
that of handling his ship in a violent cyclonic storm,
especially a tropical hurricane. The reader will recall
that a cyclone, besides traveling as a whole at
a rate of several hundred miles a day, consists of
a system of winds rotating around the center. The
result of this double motion is that the winds on
one side of the center are not only more violent than
those on the other, but they are also so directed as
to drive a vessel running before the wind, across the
storm track ahead of the advancing center, while
those on the other side tend to drive a vessel to the
rear of the storm. The two halves of the storm area
are accordingly known as the “dangerous” and
“navigable” semicircles, respectively. While this
simple statement sets forth the fundamental facts
involved, the actual problem is complicated by many
features, such as the fact that the winds do not
blow in circles, but more or less spirally, that the
area of the storm cannot be readily determined, that
two storms may occur in close proximity to each
other, etc.
The accompanying diagram, published by the
United States Hydrographic Office, represents a
cyclonic storm in the northern hemisphere, the278
circles being isobars, or lines passing through places
at which the same barometric pressure prevails
(indicated in inches), and the arrows indicating the
direction of the winds. The diagram is thus explained:
“For simplicity the area of low barometer is made
perfectly circular and the center is assumed to be
ten points to the right of the direction of the wind
at all points within the disturbed area. Let us assume
that the center is advancing about north-northeast,
in the direction of the long arrow, shown
in the heavy full line. The ship a has the wind at
east-northeast; she is to the left of the storm track,
or technically in the navigable semicircle. The ship
b has the wind at east-southeast and is in the dangerous
semicircle.***A vessel hove to at the position
marked b, and being passed by the storm
center, will occupy successive positions in regard
to the center from b to b4, and will experience shifts
of the wind, as shown by the arrows, from east
through south to southwest. On the other hand, if
the storm center be stationary or moving slowly
and a vessel be overtaking it along the line from
b4 to b, the wind will back from southwest to east,
and is likely to convey an entirely wrong impression
as to the location and movement of the center.
Hence it is recommended that a vessel suspecting the
approach of proximity of a cyclonic storm should
stop for a while until the path of the center is
located by observing the shifts of the wind and the
behavior of the barometer.”
The movement of the winds around the storm
center shown in this diagram is that of cyclones
of the northern hemisphere; i. e., contrary to the
direction of the clock hands. In the southern hemisphere279
they blow in the opposite direction around the
center.

NAVIGATION OF A SHIP IN A CYCLONIC STORM
(U. S. Hydrographic Office.)
By observing the rise or fall of the barometer,
the shift of the winds, and the state of the sea and
sky, the experienced navigator is generally able to
lay down on a chart the approximate position of the
storm center and steer his vessel so as to avoid
danger. Various devices, known as “storm cards,”
“cyclonoscopes,” etc., have been used to aid in the
process of locating a storm from shipboard observations.
In the Far East mariners use for locating280
typhoons an ingenious combination of the storm
card and the aneroid barometer, called the “barocyclonometer,”
an invention of the Rev. J. Algué,
director of the Philippine Weather Bureau.
The most important development in marine
meteorology in recent years has been the rapidly increasing
use of radiotelegraphy, both by marine
observers in transmitting reports of observations
to shore and to other ships, and by meteorological
institutions in issuing weather bulletins and storm
warnings to vessels at sea. The first regular undertaking
in this line was carried out under the auspices
of the London Daily Telegraph in the year
1904. This newspaper arranged with some of the
leading transatlantic steamship lines to furnish
weather reports by wireless from their vessels, and
these reports were published in its columns for
several months. The following year the United
States Weather Bureau began, in a tentative way,
the collection of wireless weather reports from off-shore
vessels, and similar undertakings were soon
afterward launched in other parts of the world, but
for some years such reports were of little practical
value, owing to the limited range of wireless communication.
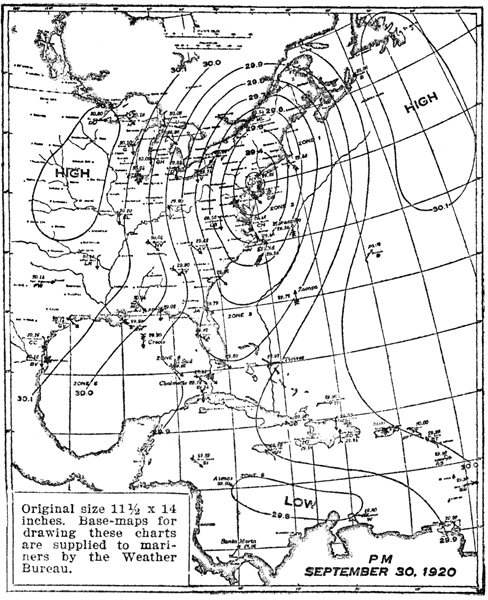
Vessels off the American coast can make their own weather maps every
night, using data supplied at fixed hours by high-power radio stations
(shown by stars on the map), together with radio reports from other vessels.
Letters near stations are the code letters used in wireless bulletins
to describe the stations. Vessel reports are indicated by names. Arrows
show direction of wind and the force on the Beaufort scale (shown by
the number of feathers). Besides data for constructing maps, the radio
stations issue forecasts and storm reports for each of the numbered zones
shown off the Atlantic coast and over the Gulf.
At the present time wireless reports from ships
on the Atlantic enable the forecasters on both sides
of that ocean to extend the areas of the weather
maps on which their predictions are based, and reports
from ships are also received to a limited extent
by forecasters on our Pacific coast as well as
in the Far East, India, and elsewhere. In this
country such reports have been especially valuable
in indicating the movements of West India hurricanes,
and thus have helped to solve the problem of282
protecting the vast tonnage that has been attracted
to Caribbean waters by the opening of the Panama
Canal. The reciprocal process of transmitting
weather intelligence to vessels by wireless bulletins,
broadcasted at certain hours every day by high-powered
radio stations, has made much more progress.
Such bulletins include information concerning
the current and prospective weather, winds and
storms over specified ocean areas, as well as reports
of observations made at a number of land stations,
from which it is possible for vessels at sea to construct
their own weather maps. They are thus enabled
to take advantage of favorable winds and to
avoid unfavorable winds and storms. Wireless
weather reports from other vessels help to piece
out these shipboard maps.
The meteorological services of all civilized countries
adjacent to the sea display signals along their
coasts to announce the coming of storms dangerous
to navigation. One of the earliest devices used for
this purpose was the “aeroclinoscope,” a form of
semaphore formerly employed by the meteorological
service of Holland. The position of the arm of the
semaphore indicated the region in which the barometer
was low; i. e., the storm center. In the British
Isles, in the middle of the last century, Admiral
FitzRoy introduced the use of canvas cones and
“drums” (i. e., cylinders), which, seen from any
direction, have the appearance of solid triangles and
squares against the background of the sky. The
British later abandoned the drum and used the cone
only, pointing up or down for northerly or southerly
gales, respectively. The American storm flag—red
with a square, black center—was adopted by the
United States Signal Service (the predecessor of the283
Weather Bureau) in 1871. This signal was subsequently
amplified by the addition of red and white
pennants to show the expected direction of the
wind at the beginning of the approaching storm.
Most countries use lanterns for night storm signals.
In the year 1909 a uniform system of signals, consisting
of cones by day and lanterns by night, was
recommended for use in all countries by an international
commission which met in London.
In spite of this recommendation some thirty or
forty different systems of daytime storm signals are
now in use in different parts of the world. On the
China coast an elaborate system of signals, consisting
of cones, balls, diamonds, and squares displayed
on a mast and yardarms, indicates the existence of
a typhoon anywhere in the neighboring seas, together
with its location and movement.
284
CHAPTER XVIII
AERONAUTICAL METEOROLOGY
During the great war the British Government
decided, in its wisdom, to establish a flying
field in Scotland, at which aviators were to be
trained in dropping bombs. The commission having
this matter in hand chose a site on the shores
of Loch Doon. In laying out the field a bog had to
be drained; then a railway was constructed, hangars
were erected, and other operations were carried
out, entailing altogether an expenditure of half a
million pounds. At a certain late stage in the proceedings
the disconcerting discovery was made that
the field could never be successfully used for the
purpose intended, on account of the gusts and eddies
produced by the surrounding hills. The undertaking
was therefore abandoned. The authorities had presumably
enlisted the skill of engineers from the outset
of the work—but they had failed to consult a
meteorologist!
A few such object lessons seem to be necessary to
demonstrate the fact—which ought to be obvious—that
meteorology is an indispensable and vital adjunct
of aeronautics. This fact is now pretty well
understood. Nearly all the activities of mankind
are more or less influenced by weather, but few, if
any, to such an extent as aeronautical enterprises.
Hence a definite branch of applied science—Aeronautical
Meteorology—is rapidly taking shape. Already285
it enters into the curriculum of aeronauts; it
has profoundly modified the methods of the ordinary
meteorological services of the world; and it is raising
a crop of specialists, some of whom are now
employed by the business firms that manufacture or
operate aircraft.
The statement has constantly been made since the
war that aeronauts are becoming “independent” of
the weather. This statement has a grain of truth
in it, but no more. It is a fact that, under war conditions,
aviators flew in every sort of weather, and
often with impunity. Even since the war commercial
aircraft have negotiated adverse atmospheric
conditions with remarkable success. A spectacular
feat of this sort was achieved on August 28, 1919,
when a passenger-carrying aeroplane on the Paris-London
route, piloted by Lieutenant Shaw, flew over
this route through a hurricane blowing in gusts of
from 40 to over 100 miles an hour, accompanied by
a torrential rainstorm and such poor visibility that
the pilot was frequently obliged to fly very low in
order to pick up his landmarks and make sure that
he was on his course. The flight was accomplished
in 1 hour and 50 minutes—about half an hour less
than schedule time. It is said that “the two passengers
in the cabin of the machine emerged without
any appearance at all of strain”—such as they
certainly would have experienced if they had made
the crossing by the Channel steamer on that boisterous
day. In fact the land and sea route was seriously
disorganized by the storm, and the Continental
trains were arriving in London hours late.
Lest hasty conclusions should be drawn from this
episode it should be stated at once that the company
operating the air route in question, far from considering286
itself independent of weather, is not content
with the detailed bulletins furnished to aeronauts
by the British Meteorological Office (which
specializes in aeronautical meteorology more extensively
than any other official weather service in
the world), but maintains an elaborate weather
service of its own, with an able meteorologist at the
head of it.
An accurate statement of the situation would be
that wind and weather are no longer the grave
dangers that they once were to the aeronaut; but
they are still, and will probably always be, factors
of the utmost importance in the successful and profitable
operation of aircraft. In order to make this
matter plain it will be necessary for us, first of all,
to devote a few words to some of the fundamental
principles involved in aerial navigation.
The layman who sees nothing mysterious in the
ascent of a balloon is, in general, somewhat puzzled
by the phenomenon of a heavier-than-air machine
rising from the ground. Yet, in both cases, the ascent
of the vehicle depends upon the fact that air is
not just empty space, but a material substance, possessing
density, weight, and other properties many
of which pertain also to solids. A balloon rises not
because it is light, but because the air about it is
heavy. In other words, gravity pushes the air under
the balloon more forcibly than it pulls the balloon
downward. The ability of an aeroplane to leave
the ground depends upon the fact that air offers
resistance to bodies moving through it.

THE EFFECT OF AIR RESISTANCE ON
AN AEROPLANE
Suppose a vertical plane (A)—such, for example,
as the wind shield of an automobile—is moving
horizontally through still air. The resistance of
the air impedes its motion, and a part of the motive287
power is employed in overcoming this resistance.
Now, suppose the plane (B) is nearly, but not quite,
horizontal, and is propelled by a force tending to
make it move in the direction indicated by the
arrow. This is approximately the case of an aeroplane
driven by a motor; the plane representing the
wings of the machine. Only a part of the air’s
resistance is now effective in impeding the forward
motion of the plane. The rest of it pushes the plane
upward. If you hold your hand at such an angle
and move it through water you will feel an analogous
upward push. Moreover, you will notice that
the faster you move your hand the greater is the
push. Not only does this upward pressure of a
fluid upon an inclined plane moving through it vary
with the speed of the latter (to be exact, as the
square of the speed), but it also varies with the288
angle which the plane presents to the fluid in its
path. If the wing of an aeroplane, for example, cuts
the air nearly edgewise, the upward pressure will
be slight. As it departs from an edgewise position,
(with the front edge higher than the rear), the
upward pressure increases, but not indefinitely;
beyond a certain rather small angle it begins to
diminish.
In an aeroplane the upward pressure, or “lift,”
is increased by giving the wings a slightly arched
shape, or “camber.” The air flows over the arched
wings in such a way as to produce a suction above
them which helps the push from below. The actual
amount of lift for a given speed has been determined
by experiments for wings of various shapes
and sizes and set at various angles to the line of
motion. If, when the machine is in the air, the lift
is just sufficient to counterbalance the weight of
the aeroplane, the latter flies horizontally. An increase
in lift causes the machine to rise; a decrease
in lift permits gravity to pull it down.
Now suppose the aviator is flying horizontally
and wishes to climb. At the rear of the machine
and forming part of its tail is a hinged horizontal
flap called the “elevator,” under the control of the
pilot. By giving this flap an upward tilt he causes
the air to exert a downward pressure on the tail
of the machine, and hence the nose of the machine
is carried upward. While the inertia of the aeroplane
tends to carry it along the original path, its
wings now present a greater angle to the air, the
lift is increased, and the machine rises. The reverse
of this operation will cause the machine to descend.
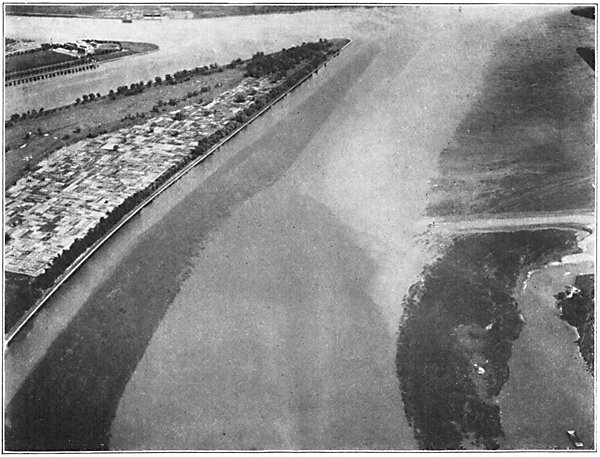
The Bed of Potomac River, at Washington. From an altitude of a few hundred or a
few thousand feet, submarine features are clearly revealed to great depths. Objects have
thus been photographed 45 feet under water. The shoals are submerged to a depth of from
2 to 5 feet. In favorable weather, aerial photographs are valuable in making hydrographic
surveys. (Photographed from the air by Dr. W. T. Lee, U. S. Geological Survey.)
A vertically hinged flap in the tail, acting on
exactly the same principle as the rudder of a ship,289
enables the pilot to turn horizontally. Two or more
small horizontal flaps, known as “ailerons,” attached
to the wings, are used to preserve the lateral balance
of the machine, and to give it the proper
“bank,” or inclination, when making a turn.
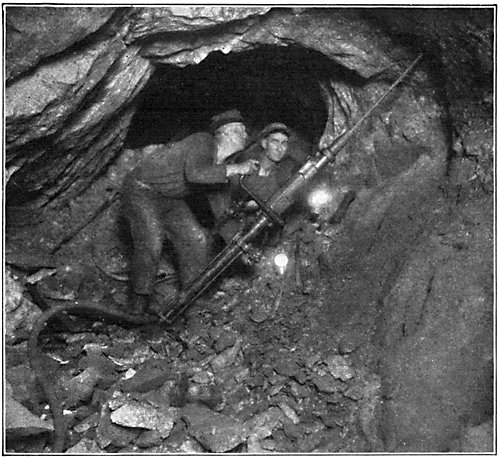
Drilling with Compressed Air in a Copper Mine. The drill also
forces a stream of water into the hole to lay the dangerous sulphur-bearing
dust. (Courtesy Sullivan Machinery Co.)
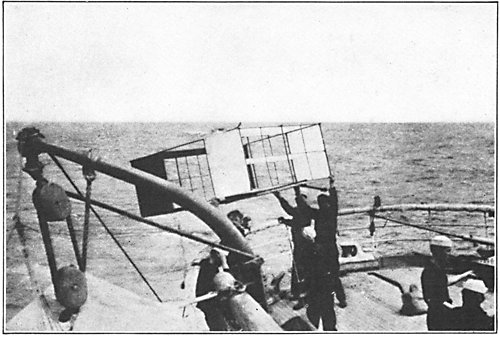
Launching a Weather Bureau Kite from the “Seneca” During the
International Ice Patrol, to Explore the Air Over the Ocean.
(Photograph, U. S. Weather Bureau.)
With these few details in mind, we shall be prepared
to consider, in a general way, how the behavior
of an aeroplane is affected by the wind and
other atmospheric phenomena.
With respect to wind there is an important
difference between aircraft and marine craft. Mere
strength of wind is not dangerous to an aeroplane,
except when starting or landing. An aviator flying
above the clouds, with no landmarks in sight by
which to gauge his movements, is no more conscious
of the actual wind at that level, provided it is
steady, than he is of the rotation of the earth on its
axis. He feels the wind produced by the motion of
his machine through the air—the so-called “relative
wind”—but no other. The true wind may be a
mere zephyr, or a hurricane blowing 150 miles an
hour; the effect is the same on his machine, so far
as he is able to observe. On the other hand, a strong
wind has a very different effect from a light one
upon the course of the aeroplane’s flight with respect
to the ground beneath. If a pilot, with no
landmarks to guide him, steers by compass for a
certain point, and if there is a strong cross-wind of
which he is unaware, he will be carried far out
of his course; a wind dead ahead or astern will
merely affect the speed of his flight, so that he
will arrive later or sooner at his destination than
he expected.
One of the important problems of aeronautics,
especially from the commercial point of view, is to290
prevent aircraft from being driven off their course
by the wind when flying with no visible landmarks;
i. e., over clouds, fog, the ocean, or an unmapped
country. When this problem is solved, pilots will
fly above the clouds much more commonly than they
do now. The winds at high levels are generally both
steadier and stronger than at low. The stronger
wind is an advantage or a disadvantage, according
to whether it is blowing in the direction of flight or
the reverse; but as the winds at different levels
generally blow in different directions, a pilot who is
independent of landmarks can choose whatever
level affords the winds most favorable for his intended
journey.
Over established air routes quite elaborate measures
are now adopted to keep pilots informed of the
direction and speed of the wind at different levels,
so that they can make due allowance for this factor
in shaping their course. In clear weather this information
is easily obtained by sighting the drift
of a pilot balloon with a theodolite, or by observing
in a specially designed graduated mirror or pair of
mirrors the drift of the smoke cloud from a shell
fired by an anti-aircraft gun and timed to burst
at any desired altitude. In cloudy weather the smoke
trails can often be successfully observed through
small breaks in the clouds. When the sky is completely
overcast, a succession of shells is fired at
definite short intervals of time and the distances
apart of the puffs of smoke and the direction of the
line in which they lie are determined from an aeroplane
flying above the spot. Another method, which
was devised by the French military meteorological
service during the war, is to send up small balloons
loaded with bombs which burst after a certain time,291
the position of each burst being determined by
sound-ranging from the ground.
These methods of providing information concerning
the winds at flying levels have, however, their
serious limitations, and aeronauts now look hopefully
to the perfection of the existing systems of
“directional wireless,” whereby the pilot will receive
whenever desired, or at regular intervals, a
wireless signal from the terminus of his route or
some other known point, the direction from which
the signal comes being indicated by suitable apparatus
on the aeroplane. Thus aided, he should never
deviate far from his course, unless he chooses to.
For long journeys, such as the crossing of the
Atlantic, the air pilot will naturally make use of all
available information concerning the great permanent
or semipermanent wind systems of the earth,
such as the trade winds of the lower atmosphere,
the antitrades above them, and the fairly constant
eastward drift of the atmosphere at high
levels in middle latitudes. The dividend-earning
capacity of commercial aircraft necessarily
depends upon taking advantage of favorable
winds, while adverse winds may mean not only a
loss of money but the danger of prolonging a journey
until the fuel supply is exhausted—a serious
predicament over the ocean and also over lands
remote from civilization. It is, however, a common
error on the part of current writers to overrate the
constancy and reliability of the winds in various
parts of the world, and to lay too much stress on
the value of permanent wind charts. What the
aeronaut needs especially to know is the typical behavior
of the winds with respect to the distribution
of barometric pressure, as shown by a weather map,292
including their variations with altitude. The time
will come when the information necessary for plotting
the winds at various levels will be flashed at
frequent intervals by high-powered radio stations to
aerial navigators in all parts of the world—a system
that is already in its initial stages, especially
in Europe. A pilot making a long journey will thus
be able to lay his course so as to utilize the winds
that will speed him on his way. Even violent storms,
such as the mariner seeks to avoid, will be turned
to advantage by the airman.
We have now to consider another aspect of wind
that is of much more interest to the airman than to
the seaman, and that is the question of “wind
structure.” The layman usually thinks of a wind as
a nearly steady horizontal flow of air. Such winds
exist, but they are exceptional, especially in the
lower levels of the atmosphere. A wind is generally
full of gusts and eddies, upcurrents and downcurrents,
and it is these eccentricities that gradually
develop in the aviator a sort of sixth sense—a “feel”
for atmospheric fluctuations, that enables him to
adjust his machine instinctively to the forces tending
to disturb its equilibrium. He also learns by
experience the conditions under which irregularities
of a pronounced character may be expected.
He becomes well acquainted with the great mound of
air that drives his machine upward when passing
over a hill or mountain; with the eddy that lurks in
the lee of such an obstacle; with the downward
tendency of the air over lakes, rivers, swamps and
forests.
“The air is so sensitive,” writes the late well-known
British flyer, Gustav Hamel, “that it is
affected even by the color of large patches of vegetation.293
Whether this be entirely due to the different
heat-radiating power of different colors it is impossible
to say, but invariably an aeroplane on passing
from grass land to a field covered with yellow flowers
experiences a certain amount of air disturbances
only less noticeable than the inevitable bump experienced
in passing from green fields to ploughed
land, or from ploughed land to meadow.”
When the wind is blowing, the air for at least
a few hundred feet above the ground is nearly always
in a state of turmoil. This is partly due to
the friction of the moving fluid against the irregular
surface of the earth, and partly to the ascending and
descending currents caused by differences in temperature.
The latter effect is illustrated in the rapid
rise of air over a bare sunlit plain and its fall over
an adjacent forest or body of water. Ascending
currents are often made visible by the formation of
detached cumulus clouds, each of which marks the
summit of a rising column of moist air, while in
the spaces between the clouds the air is generally
sinking. Measurements with balloons have shown
that vertical currents often attain speeds of 600
feet a minute or more, while the process of hail formation
appears to indicate that in thunderstorm
clouds there are violent uprushes amounting to
2,000 or 2,500 feet a minute, and possibly much
more. The descending air current between clouds
is sometimes so strong that an aeroplane cannot
force its way up through it.
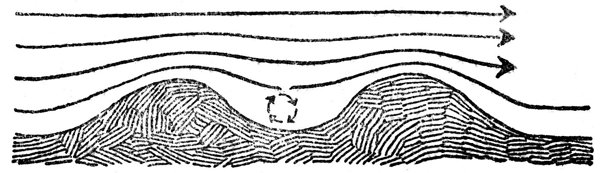
THE FLOW OF AIR OVER TWO RIDGES
(After Dr. Franz Linke.)
Notice the eddy in the valley to the leeward of the first ridge

A SHELTERED LANDING PLACE MAY BE DANGEROUS
(After Dr. Franz Linke.)
A landing place surrounded by trees is dangerous in windy weather on
account of the air waves formed between the moving air above and the
calm air below.

AIR WAVES NEAR THE EARTH’S SURFACE
The waves are made visible by smoke
The turbulence of the lower air—a phenomenon
that adds so much to the difficulties of starting and
landing—extends to various heights, depending
especially upon the strength of the wind. A rough
rule, evolved by the Zeppelin pilots before the war,294
was to expect turbulent conditions up to an altitude
equal to from ten to twenty times the force of the
wind in meters per second. Thus, for a wind of 10
meters per second, the turbulent layer would be
from 100 to 200 meters thick. A good picture of the
atmospheric ups and downs encountered by the airman295
when flying low is furnished by the behavior
of the smoke from a factory chimney with a moderate
wind blowing, forming smoke waves.
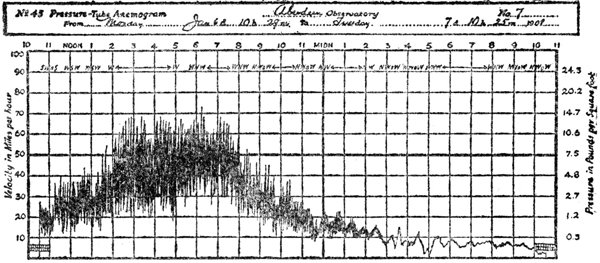
THE WIND’S AUTOGRAPH ON A GUSTY DAY, RECORDED
WITH A PRESSURE-TUBE ANEMOMETER
The vertical lines are hour lines and the horizontal lines show the force of
the wind in miles an hour and also in pounds a square foot.
These disturbances give rise to the very marked
fluctuations in the force of the wind known as gusts.
There are certain forms of anemometer especially designed
to record the gustiness of the wind. A record
of the wind’s force is traced by a pen on a moving
strip of paper, and the “anemogram” thus obtained
shows a continuous series of irregularities, the extent
of which increases with the strength of the
wind. The puffs and lulls often alternate at intervals
of a few seconds or less, and the actual force
of the wind at a given instant may be many times
greater than its average force for, say, five minutes.
An ordinary anemometer does not indicate these
rapid fluctuations, but merely shows the time required
for a mile of wind to flow past the instrument.
Thus when such an instrument tells us that
the wind is blowing at the rate of 40 miles an hour,296
it may actually be varying between 20 and 60 miles
an hour, or between even wider limits.
Since the matter became of practical importance
on account of the needs of aviation, many interesting
studies have been made of the effects of different
kinds of topography upon the overlying air
currents. A striking example of the eccentric winds
that sometimes prevail in mountain valleys has been
described by Mr. B. M. Varney, of the University
of California, in the “Monthly Weather Review.”
From the summit of a steep cliff about 1,100 feet
above the floor of Yosemite Valley the writer
launched broad sheets of tissue paper, and, with
the aid of powerful binoculars, followed their flight
as they were carried in huge spirals, thousands of
feet in diameter, finally disappearing beyond the
mountains on the opposite side of the valley. The
accompanying sketch shows the path of one of these
papers. From its starting point at A until it passed
behind the summit of Liberty Cap (B), more than
a mile distant, the paper was watched for 7 minutes.
The top of Liberty Cap is some 1,600 feet above the
point at which the flight began. This sketch visualizes
one of the ticklish problems that will some day
confront the pilot of a sight-seeing or mail-carrying
aeroplane in the Yosemite National Park.
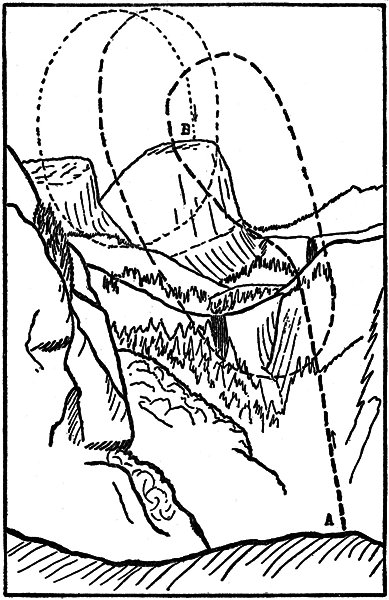
AIR CURRENTS IN YOSEMITE VALLEY
(Sketched by B. M. Varney.)
The flight of a sheet of paper across the valley.
Although, on an average, the air is much steadier
at high levels than near the ground, very unsteady
currents are sometimes found at all altitudes attainable
by aircraft. Thunderclouds, thousands of
feet above the earth, are always the seat of violent
turmoil, but such clouds can, as a rule, be avoided
by the airman. When a stratum of air glides over
another differing sharply from it in density—and
distinct strata of this sort are not uncommon in298
the atmosphere—friction between the strata sets
up waves like those produced in water by wind blowing
over it. If the two streams are moving in the
same direction, but at different speeds, the waves
are long and regular; when they are more or less
crossed, the waves are short and choppy. The moisture
at the crests of these waves may be cooled to
such an extent as to condense into visible clouds,
arranged in long continuous rolls or rows of detached
patches; forms frequently assumed by cirro-cumulus
and alto-cumulus. More often, however, the
waves of air remain invisible, because the conditions
of moisture and temperature are not right for the
production of cloud.
Recalling, now, what has been said above about
the way in which the lift of an aeroplane varies with
the angle at which the wings meet the air and also
with the speed of the machine relative to the air,
it will be easy to understand some of the difficulties
experienced in maintaining one’s equilibrium when
flying in a turbulent atmosphere. Waves, eddies,
vertical currents and other features of wind structure
cause abrupt changes in the attitude and the
speed of the machine with respect to the air stream.
The sudden increases and decreases of lift thus produced
have much the same effect upon the machine
as if it were running over a solid obstacle on the
one hand or plunging into a vacuous space in the
atmosphere on the other, and hence are aptly described
by aviators as “bumps” and “holes in the
air,” respectively. The latter term, which seems to
have become firmly rooted in all languages (French,
trou d’air; German, Luftloch; etc.), has had the unfortunate
effect of keeping alive in the public mind
the idea that the aviator occasionally runs into a299
vacuum or semivacuum, such as could not exist
in the atmosphere. (The nearest approach to such
a thing is the rarefaction in the core of a tornado
or waterspout, due to the enormous centrifugal
force of the vortex; something that no aviator has
yet encountered.)
To make matters worse, different parts of the sustaining
surface of the machine may receive different
impulses. One wing, for example, may graze a
violent uprush of air not encountered by the other,
giving the aeroplane a tilt to one side, or the tail
of the machine may be driven in one direction and
the nose in the other. Again, the whole machine
may suddenly enter an air current of quite different
speed and direction from the one in which it has
been flying. To take an extreme case, it may run
into a stream of air flowing just as fast, and in the
same direction, as the machine itself, with the result
that the relative wind becomes zero, and the machine,
deprived of all lift, drops like a stone until
it acquires a velocity with respect to its new environment.
When such conditions prevail, the pilot is kept
busy with his “controls”; now moving his elevator
to adjust his fore-and-aft balance, and now his
ailerons to set him on an even keel laterally, and
occasionally turning his rudder to offset the effects
of horizontal gusts. The elevator and the ailerons
are worked with a single lever, colloquially called the
“joy-stick,” and the rudder with a bar which the
pilot operates with his feet. Ordinary adjustments
of this kind are performed automatically by the
trained aviator, but violent disturbances call for the
exercise of skill and judgment. Generally speaking,
no amount of atmospheric turbulence causes any300
serious trouble to the trained pilot, except when
he is flying close to the ground, as in starting and
landing.
Before we leave the subject of wind it will be well
to emphasize once more the fact, which the average
layman has difficulty in grasping, that the only movements
of the air that affect the safety and comfort
of flight are the movements relative to the machine,
and not those relative to the ground. To the aviator,
when he is once clear of the ground, a steady wind
of any speed is merely a mass of calm air. Hence
an aviator will sometimes have perfectly smooth
flying when the wind, as measured on the earth, is
blowing 40 or 50 miles an hour; and again he will
describe the air as rough and bumpy when flags are
hanging limp from their staffs and dwellers on
terra firma declare that not a breath of air is stirring.
In the early days of flying aviators themselves
were afraid of a strong wind. Thus Wilbur
Wright, during his pioneer exhibition flights in
France, would never go up unless the smoke from
his cigarette rose in a straight line, and until about
the end of 1909 no aviator attempted to fly in a wind
of 20 miles an hour.
At the present time the only atmospheric condition
that seriously hampers flying is fog or low
cloud. An aviator flying in a fog or cloud is not
only liable to wander far from his course, on account
of the unknown leeway of his machine, but
he is often in great doubt as to his proximity to the
ground. One of the curious effects of such a situation
is that the airman loses his sense of the vertical.
On land our sense of up and down is determined
by the force of gravity, pulling us toward
the earth. When riding in a terrestrial vehicle, we301
are conscious of other pushes and pulls; such, for
example, as the jolt that pitches us forward when a
train stops suddenly, or the outward thrust that we
feel when swinging around a curve. Again, in descending
in a lift we seem to lose weight, as if
gravity had suddenly grown weaker. On earth all
such impressions are corrected by the sight of objects
around us; but the aviator enveloped in mist
has no such guides, and he often becomes quite confused
about the direction of the ground. A turn,
which involves banking, increases his confusion.
Eventually he may be flying almost upside down
without being aware of the fact. Professor Melville
Jones, who has been through such experiences,
says of the pilot’s confusion:
“His first indication that something is wrong is,
as a rule, either an increase or a decrease of speed
that is not counteracted by the accustomed movements
of the controls. A period of wild suspense
and utter bewilderment now follows, during which
the pilot makes violent efforts to recover control,
but without success. The next thing that he realizes,
if he realizes anything at all, is that he is either
on his back or spinning, and the next thing he
knows is that he is out of the clouds with the
earth standing up at a ridiculous angle and
spinning round like a drunken dinner plate. Happy
is he that has plenty of air room under these circumstances.”
Spirit-levels and similar instruments are affected
by the same disturbances that mislead the pilot in
his estimation of the vertical; but fortunately there
are certain other devices, due to the exigencies of
the war, during which cloud flying was a part of
the tactics of the military aviator, which have virtually302
solved this problem, though their use has not yet
become general.
The outstanding difficulty of a fog is the problem
of landing. In the case of a forced landing, at
a distance from a regular landing-ground, the pilot
must simply trust to luck. He may descend in the
water or the treetops, or on rough ground that will
wreck his machine, but he has no choice. The only
solution of this difficulty is the installation of a reserve
engine, or some other expedient that will
obviate the necessity of forced landings. The task
of finding a landing ground in a fog and descending
to it in safety will, in the near future, be comparatively
simple. Most fogs, though by no means all,
are so shallow that it is possible to tether a kite-balloon
so that it will float above the fog and indicate
the position of the aerial harbor. Several
such balloons, flying tandem, would afford sufficient
lift to support a series of electric lanterns along the
cable, for use at night. Searchlights and “star
shells” have been employed for the same purpose.
Directional wireless and the wireless telephone seem
likely, however, to be the chief dependence of the
future aeronaut seeking port in a fog. These devices
will also be the means of averting collisions in a fog
or cloud along crowded airways, and especially in
the congestion that will prevail in the vicinity of
important air ports. Last but not least, the artificial
dispersion of fog by means of electrical discharges,
although still in the experimental stage,
holds out possibilities of being the ultimate solution
of the fog problem, not only for the aeronaut,
but also for the mariner, the railway manager,
and everybody else who is incommoded by a misty
atmosphere.
303
Even when he is not flying in clouds or fog the
aviator by no means always enjoys a clear view of
distant objects. A slight haze impairs visibility,
while a heavy rainstorm or snowstorm may obstruct
the aeronaut’s view as badly as a fog.
Of the meteorological elements that affect aeronautics,
other than those we have mentioned, the
most important is the density of the atmosphere—generally
expressed in terms of barometric pressure.
The air diminishes in density upward, and the rarefied
atmosphere of high levels has several effects on
aircraft. Its decreased buoyancy imposes a limit
upon the ascent of balloons; its decreased resistance
makes it necessary for an aeroplane to fly at
greater speed in order to get the same lift; it diminishes
the power of gasoline engines, on account
of the reduced supply of air; and it has various
unpleasant and even dangerous effects on the aeronaut,
similar to “mountain sickness.” The level
that a given aeroplane cannot exceed owing to the
combined effect of reduced lift and reduced engine
power is known as its “ceiling.” Different types
of aeroplane have very different ceilings.
At great altitudes the air is always very cold,
summer and winter. The low temperature may interfere
with the efficient working of the engine, and
it is, of course, a source of discomfort to the pilot.
The formation of ice and heavy deposits of snow
lead to inconveniences in both aeroplanes and airships.
The pelting of hail is sometimes a painful
experience for aeronauts. Lastly, lightning has
hitherto left aviators unscathed, but has caused
numerous disasters among balloonists.
The recent rapid development of aeronautics has
laid a heavy burden of additional labor upon the meteorological304
services of the world, and is producing
something like a revolution in their methods. The
history of these changes is interesting. From the
beginning of the twentieth century until a few years
before the World War meteorologists were engaged
in a great campaign of upper-air research, utilizing
kites, captive balloons, pilot balloons, and sounding
balloons to measure the winds, temperature, humidity
and pressure at various levels in the atmosphere.
In other words, aeronautical methods were employed
in the service of meteorology, but the investigators
hardly entertained the idea of reversing the relation
and making meteorology the handmaiden of aeronautics.
The point of view prevailing in those days
is well indicated by the fact that the organization
that had charge of the upper-air explorations
throughout the world was known as the “International
Commission for Scientific Aeronautics,” a
name that it bore until the year 1919.
The plan for providing regular weather reports
for the benefit of aeronauts began with some small-scale
enterprises in Germany about 1909. In the
summer of that year Dr. Franz Linke organized a
storm-warning service in connection with the International
Aeronautical Exposition at Frankfort, and
at the beginning of the year 1911 an aeronautical
weather bureau for the whole of Germany was established,
with headquarters at the Observatory of
Lindenberg. Shortly before the war a similar undertaking
was launched in Italy, under Dr. Matteucci,
whose service was the first one in the world to publish
daily charts, based on telegraphic reports, of the
winds at various levels over an entire country.
During the war the regular meteorological services
of the belligerent countries and the meteorological305
units attached to the armies and navies maintained
an almost continuous service of weather information
for the great fleets of fighting aircraft.
Bulletins, distributed chiefly by wireless telegraphy,
supplied particulars of the current and prospective
winds at the flying levels, the prevalence of fog, the
degree of visibility, etc. New telegraphic weather
codes, far more elaborate than those in use before the
war, were devised for transmitting such information,
and the whole business of observing and reporting
weather became immensely more arduous than it had
been in the days when the only interests served by
practical meteorology were those of the land and the
water.
Since the close of hostilities great efforts have been
made to maintain these new operations of the meteorological
establishments at something like the level
attained during the war. The task is, however, beset
with difficulties, on account of the great expense
involved. It is being accomplished with different degrees
of success in different countries.
306
CHAPTER XIX
MILITARY METEOROLOGY
One of the most astonishing paradoxes connected
with the misapplication of human brains and
energy glorified with the name of the “art of war” is
this—that, while weather has always played an important
part, and often a decisive one, in military
operations, no attempt was ever made until a few
years ago to include meteorology in the purview of
military science or to utilize the services of meteorologists
at the battle front.
The most casual survey of the history of warfare
reveals the fact that atmospheric conditions
rank high among the “controls” of fighting. From
a military point of view, weather and climate bear
a certain analogy to topography. They are a part
of the physical environment with which a commander
has to reckon. Weather, however, differs
from topography in the fact that it is subject to
rapid changes, and is therefore doubly worthy of
attention on the part of an army, which must not
only take account of the weather as observed and
in progress, but must also, as far as possible, anticipate
that which is to follow.
Everybody will recall the ruin that overtook
the French army in Russia in 1812 on account
of untoward weather conditions, but it is less
well known that Napoleon, with his usual
sagacity, obtained from his scientific advisers a307
report on the Russian climate before he planned
his campaign; that the winter set in much earlier
than usual in that fatal year; and, most interesting
of all, that it was actually a brief period
of thawing weather, rather than the intense cold
that preceded and followed it, which, by turning the
roads into bogs and breaking up the ice in the
Beresina, brought about the culminating disaster.
Another fateful spell of weather ushered in the
battle of Waterloo. It is described in a well-known
passage of “Les Misérables,” which contains enough
truth mingled with hyperbole to be worth quoting:
“S’il n’avait pas plu dans la nuit du 17 au 18
janvier, 1815, l’avenir de l’Europe était changé.
Quelques gouttes de plus ou de moins out fait pencher
Napoléon. Pour que Waterloo fût la fin d’Austerlitz,
la Providence n’a eu besoin que d’un peu de
pluie, et un nuage traversant le ciel à contre-sens de
la saison a suffi pour l’écroulement d’un monde.”
The rains and floods that led to the annihilation
of the Roman legions under Varus in A. D. 9 and the
great tempests that helped English seamen defeat
the Spanish Armada furnish additional well-known
examples of the immense importance of weather as
a factor in warfare. We need not, however, look
farther back than to the recent world conflict to find
similar examples in profusion. Leaving out of consideration
the indirect effects of the weather upon
the progress of the war as exercised through its control
of crops, transportation, and other features in
the economic life of the belligerent and neutral nations,
we need only examine war-time newspapers
to see how the armies themselves were helped or
harassed by meteorological conditions at every turn.
The war was a great popular teacher of climatography,308
just as it was of geography. The drenching
misery of Flemish winters, as formidable to the
soldiers in the trenches as the bullets of the enemy,
became as familiar to the present generation of
Americans as did somewhat similar conditions in
Virginia to Americans of the Civil War period.
The British campaigns in Mesopotamia were as
much a conflict with climate as with human foes.
Marches were made when the temperature stood at
110 degrees Fahrenheit and over. The temperature
in the hospital tents is said to have reached 130 degrees.
The disaster at Kut-el-Amara was due to the
rains and floods that prevented reenforcements from
reaching the beleaguered garrison. The failure of
the Dardanelles expedition was partly due to the fact
that the extreme dryness of the country was not
realized—as it would have been if the War Office
had called climatologists into council—and totally
inadequate provision was made for the water supply.
The new engines of war brought forth by the
recent struggle were peculiarly susceptible to the
effects of weather. The larger guns and heavy motor
trucks were difficult to move over muddy roads.
The aircraft, though they managed to fly in all kinds
of weather, suffered innumerable disasters for which
atmospheric conditions—chiefly storms and fog—were
responsible, and their operations were conspicuously
affected by favorable and unfavorable
winds. Shells were fired to unprecedented heights,
and their trajectories were modified by unknown
conditions in the upper air. Last but not least, the
use of poisonous gases, especially in the period
before gas clouds were largely replaced by gas
shells, was dependent upon the occurrence of appropriate
winds; and a slight miscalculation in this309
respect sometimes brought disaster to the troops
using the gas.
It is not surprising that professional meteorologists
played a part in the World War, but it is difficult
to understand why meteorological units were
not attached to all armies, at least when on active
service, several decades before the year 1914. Meteorologists
did, indeed, take a hand in one earlier conflict,
but not as enrolled soldiers. During the Spanish-American
War a special service was organized
by the United States Weather Bureau to protect the
American fleet in southern waters from unpleasant
surprises in the shape of West India hurricanes. In
the summer of 1898 a chain of observation stations
was established by the Bureau around the Caribbean
Sea. The service then inaugurated in consequence
of the exigencies of war proved so valuable to shipping
in time of peace that it has continued to
operate, with some intermissions, down to the
present day.
When the World War broke out, the only country
that immediately put meteorologists, as such, into
the field was Germany. The Germans were fortunate
in having a far greater number of trained meteorologists
at their disposal than had their enemies.
There were chairs of meteorology in several German
universities and high schools, and the numerous
meteorological observatories and institutes of the
Empire had provided occupation for a large amount
of professional talent in this line. One of the first
acts of the army that invaded Belgium was to establish
an aerological service in that country.
The Entente countries were slow in adding meteorological
units to their armies, but their civilian
meteorological services were utilized to the utmost310
for military purposes from the beginning of the war.
They at first worked under difficulties arising from
the cessation of the customary weather reports from
central Europe, but, to offset this disadvantage, the
weather map was expanded in other directions, the
number of daily hours of observation was increased,
and eventually the forecasters in London and Paris
acquired much better facilities for making their predictions
than they had enjoyed in time of peace. The
supply of weather information to the public was
suspended, and great precautions were taken to prevent
the reports of the Allied services from being
utilized by the enemy. The German meteorologists
were seriously hampered by the lack of reports from
the westward. It has been asserted that such reports
were sometimes obtained by radio from submarines
stationed off the coast of Ireland, but such
a service, if it existed, must have been fragmentary
and unsatisfactory. That the Germans made many
mistakes in their attempts to infer the atmospheric
conditions over the British Isles from the limited
weather map at their disposal is proved by the fact
that their airships frequently crossed the Channel
when, with an ampler knowledge of impending
weather, they would certainly have remained at
home. Several Zeppelins came to grief in the course
of these ill-timed raids. One of the interesting
routine duties of the British Meteorological Office
during the war was to draw the weather map for a
given moment as the Germans would probably draw
it, with their curtailed set of telegraphic reports,
and then predict the German prediction!
In the spring of 1915 a small meteorological section
was organised in the British Army, and attached
to the Royal Engineers. This force was311
afterward enlarged, and provided units for service
on several battle fronts. The British also developed
a naval meteorological service, which had existed in
embryo before the war, and, eventually, a special
meteorological service for the Royal Air Force.
Analogous services were organized by the French
and the Italians.
The United States Army and the United States
Navy both established meteorological services not
long after this country entered the war. The former
was attached to the Signal Corps, and was partly
officered and recruited from the Weather Bureau.
A training school for army meteorologists was
opened at College Station, Texas. Upward of 300
men were given instruction in this school, and most
of them were sent overseas. The naval meteorological
service was headed by the director of Blue Hill
Observatory, and the junior officers received special
training at that institution.
The varied activities carried on by these war-time
units were so different from the traditional duties
of meteorologists that they may be said to mark the
advent of a new branch of applied science—Military
Meteorology. They were, moreover, as we shall
see, extremely fruitful of effects upon the science of
meteorology in general.
In the principal battle zones the military weather
men maintained a dense network of observation
stations, the reports from which, combined with
those received from the regular peace-time weather
stations of the Allied and neutral countries, enabled
the forecasters at headquarters to keep closely in
touch with atmospheric changes. Observations of
both surface and upper-air conditions were made at
frequent intervals, and radiotelegraphy was largely312
used to insure prompt transmission of the reports.
In general, weather maps were drawn four times a
day. Information was distributed locally to the
fighting units by telephone and otherwise.
The vast fleet of aircraft called into being by the
war would, of itself, have imposed upon the military
meteorologists the necessity of paying a great
amount of attention to the upper air. Pilot balloons
were sent up so frequently and at so many
points that the aviators generally knew just what
winds they would encounter aloft. Special arrangements
were made to follow the progress across the
country of the thundersqualls which constituted a
serious danger to the “sausages,” or observation
balloons, as well as to aeroplanes on the ground,
and to hangars.
There was, however, another urgent reason for
keeping a close watch of the winds and other atmospheric
conditions at various levels above the earth’s
surface. Experience acquired early in the war
proved that old-fashioned methods of correcting
the aim of artillery for meteorological disturbances
were extremely inadequate for modern guns, the
projectiles of which rise to altitudes of from 10,000
to 20,000 feet and encounter conditions quite different
from those prevailing at the surface. The
flight of a projectile is affected by the force and
direction of the wind, and the density of the air
through which it passes. Some modern projectiles
remain in the air as long as 70 seconds, and a moderate
wind blowing across the path of such a projectile
may easily cause it to fall half a mile away
from the point at which it would strike if fired in
still air. One of the routine duties of the army
weather service was to observe the winds and compute313
the air-densities at different heights wherever
such information was required by the artillery. In
order to facilitate the application of such data by
the gunners ingenious methods were developed for
computing what is known as the “ballistic wind.”
This is a fictitious wind which, if affecting the projectile
throughout its flight, would produce the same
total deflective effect and effect on range as the various
winds that the projectile actually encounters.
Meteorological observations were also of great
importance in connection with the new process of
locating distant guns known as “sound-ranging.”
This process consists, briefly, in determining the
exact instant of arrival at several points of the
sound waves propagated through the air from the
gun that is being located. If sound traveled at a
uniform speed, these observations would show the
exact distance of each of the observing points from
the gun, and a simple geometrical construction
would indicate the position of the latter. The speed
of sound waves in the air is, however, affected by
both wind and temperature. Accordingly, allowance
had to be made for these varying factors, and
the necessary data were supplied by the meteorological
units.
The observation and prediction of winds favoring
the use of poisonous gases by friend or foe was
one of the most delicate tasks allotted to the army
meteorologists. The flow of such gases is determined
by the winds close to the surface of the earth,
and these are greatly affected by topography. Local
air currents controlled by the slope of the ground
were especially utilized for gas attacks. Strong
winds were unfavorable, because they quickly dissipated
the gas cloud. The meteorologists not only314
advised their own troops when to use gas, but also
gave warning when the atmospheric conditions were
such that gas was likely to be used by the enemy.
The use of gas shells was less dependent for its
success upon the wind than the liberation of gas
clouds, but even when shells were used the
wind and weather at the objective point were factors
of importance.
The exigencies of warfare developed several new
features of meteorological practice, the utility of
which did not cease with the war. Thus it became
customary to measure the degree of “visibility” of
distant objects, for the benefit of aviators and gunners,
and this element was included in the routine
weather reports. Scales of visibility, ranging from
“very bad” to “excellent,” etc., were adopted, and
eventually certain forms of apparatus (“visibility
meters”) were devised for getting fairly precise
measurements of this weather factor.
Another novel practice that deserves to be perpetuated
was the plan adopted by the military forecasters
of adding to their predictions a statement as
to their probable accuracy; this was expressed on a
numerical scale of “odds,” instead of by use of the
vague terms “probably” and “possibly,” which have
generally served the purpose of the dubious forecaster.
The war brought about many improvements in
the instruments and methods used in sounding the
upper air; and the intensive campaign of pilot-balloon
observations carried out at the military stations
provided a body of data for study quite unparalleled
in the history of meteorology.
Lastly, the war revolutionized weather telegraphy
in Europe. Before the war the European forecasters315
were hampered by exasperating delays in
the collection of reports over the telegraph lines,
especially in the international exchange of observations.
Wireless telegraphy had been extensively
used for gathering reports from vessels and supplying
vessels with forecasts, but not for the interchange
of meteorological information on land. The
war changed all this. Radiotelegraphic weather
messages became the rule, and the advantages of the
new system were so obvious that the tendency has
been to retain it as far as possible since the war.
316
CHAPTER XX
MEDICAL AND PHYSIOLOGICAL
METEOROLOGY
The starting point in any study of the physiological
effects of weather and climate upon
humanity is the remarkable fact that, on the hottest
days of summer and the coldest of winter, in
tropical deserts and amid polar snows, the temperature
within the body of a healthy man remains constant
to a fraction of a degree. There are slight
temperature differences between different parts of
the body; there is a periodic daily variation of about
half a degree; and there are other slight changes,
due to eating and exercise; but an internal temperature
of about 98.6 degrees F. is maintained with
little or no regard to fluctuations in the temperature
of the air.
The body has often been compared to a building
in which the temperature is regulated by
a thermostat, but the comparison is not exact. The
thermostat controls the temperature merely by regulating
the combustion of fuel; and with the advent
of mild weather we let the fires go out altogether.
In the body the fires are always burning, the briskness
with which they burn—or, to drop the metaphor,
the rate at which bodily heat is generated—depending,
above all, upon muscular activity, but
also upon other causes. It is true that we possess
a nervous mechanism, analogous to the thermostat,317
which tends to adjust the production of animal
heat in such a manner as to offset the cooling effect
of our environment; but this mechanism appears
to be less important in maintaining our constant
temperature than another, which regulates the loss
of heat from the body. According to M. J. Rosenau:
“Heat is lost from the body chiefly in two ways;
(1) by heat transfer, or loss by radiation, conduction,
and convection; (2) by evaporation, chiefly by
the evaporation of the water of perspiration. Pettenkofer
and Voit estimated the loss of water by the
lungs at 286 grams, and from the skin at from 500
to 1,700 grams daily. This will give some idea of
the effects here concerned. The loss by heat transfer
diminishes as the temperature of the surrounding
air rises. The temperature of the body would
rise when the atmospheric temperature goes above
70 degrees F. were not perspiration then secreted.
So long as the perspiration can evaporate freely the
heat production and heat loss are balanced. With
a high humidity evaporation is lessened and the
balance is maintained by rushing blood to the skin,
which causes an elevation of the temperature of the
surface, and thus the loss of heat by radiation, conduction,
and convection is facilitated.”
Human sensations of temperature are paradoxical.
We talk of being “hot” and “cold,” as if we belonged
to the class of cold-blooded animals—the
fishes and the reptiles—that actually undergo great
variations of temperature, with variations in the
temperature of their environment. We hear people
say, for example, that they are most comfortable at
a temperature of 65; yet we know that their temperature
is always 98½, except just at the surface
of the body.
318
The human body is, in fact, a poor thermometer.
Our sensations do not register the temperature of
the air, but they do, in a way, register the cooling
power of the air, which depends upon temperature,
humidity, and air movement, and they register,
especially, changes in this cooling power, for within
certain limits the body soon adapts itself to a constant
rate of cooling, so as to lose any impression of
heat or cold. When a steady outflow of heat from
the body has been set up and the external cooling
power is suddenly increased, we become conscious
of a difference between the temperature at the surface
of the body and the “blood temperature” beneath.
The action of the nerves at the surface and
the nerves underneath, under these circumstances,
has been compared to that of a thermo-junction, in
which an electric current is produced by differences
of temperature. The rate of evaporation from the
skin, also, has a marked effect upon our sensations
of comfort and discomfort.
The common thermometer was long ago discredited
as a means of measuring atmospheric
comfort. Then, for a time, the wet-bulb thermometer
had its day, and its indications were once published
on a large scale in this country as representing
the “sensible temperature,” or temperature that
we actually feel. The wet-bulb thermometer is
cooled by evaporation below the air temperature,
except when the air is saturated with moisture, and
may therefore give a rough indication of the temperature
acquired by the skin when moistened with
perspiration. The temperature of the skin is not,
however, an accurate indication of our feelings of
heat or cold, nor is it a satisfactory guide to the
physiological effects of atmospheric conditions.
319
Several instruments have been devised for the
purpose of measuring the cooling power of the air,
to which the bodily mechanism must respond in
order to maintain a uniform temperature within.
One of these was invented nearly half a century
ago by J. W. Osborne. A porous cylinder was filled
with warm water, and an agitator, driven by clockwork,
kept the water in the cylinder at uniform
temperature at any given moment. The rate at
which heat was lost from the wet surface of the
cylinder was determined by a thermometer, having
its bulb immersed in the water, and a stop watch.
A different plan was adopted by A. Piche, in an instrument
which he called the deperditometer, and
which was supposed to imitate more closely the behavior
of the body. A porous vessel is filled with
water, the temperature of which is kept constantly
at “blood heat” (98.6 degrees F.) by a gas jet provided
with an automatic regulator. The amount of
gas burned in a given time is then supposed to
measure the cooling power of the atmosphere as it
affects humanity. J. R. Milne’s psuchrainometer is
constructed on the same principle, but heat is supplied
and measured electrically.
Among many other instruments of this class, one
that now enjoys special favor is the katathermometer,
devised by Prof. Leonard Hill, in England. This
consists of a pair of large-bulbed spirit thermometers,
one of which has its bulb covered with fine cotton
mesh. To use the instrument, the bulbs are
immersed in water at about 150 degrees F. until
the spirit rises to the top of the thermometer tubes.
The excess of water is then jerked off the wet bulb,
and the other bulb is dried. The instruments are
finally suspended in the air, and the rate of cooling320
from 110 to 100 degrees, or from 100 to 90 degrees,
is taken with a stop watch. The dry-bulb
measurements are supposed to show how fast the
human body loses heat at its surface by radiation
and convection, while the wet-bulb measurements
also take account of evaporation.
In order to connect the readings of this device
with human sensations, Hill and his collaborators
have used the instrument under a great variety of
atmospheric conditions, both indoors and out, and
compared the readings with independent estimates
of comfort and discomfort. On an ideal summer
day the “wet kata” fell from 110 to 100 in 25 seconds,
and the “dry kata” in 85 seconds. Indoors at
the seaside in summer, under comfortable conditions,
the readings were 50 seconds and 140 seconds,
respectively. A large number of other readings,
taken under different conditions in various parts of
the word, have been published. The katathermometer
is now used in both Great Britain and the
United States in the study of ventilation problems,
and has acquired a rather extensive literature.
According to its inventor, “the heating and ventilation
of rooms should be arranged so that the wet-bulb
falls from 100 to 90 degrees in about one
minute, and the dry-bulb in about three minutes.”
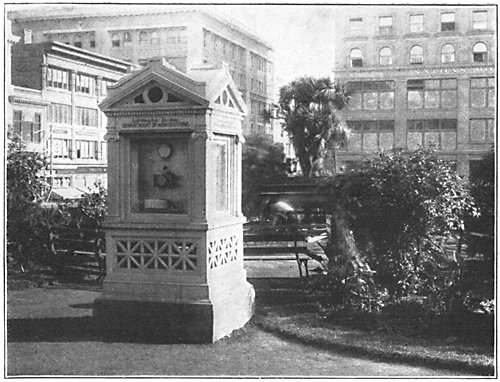
A Weather Bureau Kiosk, in Union Square, San Francisco.
(Photograph, U. S. Weather Bureau.)
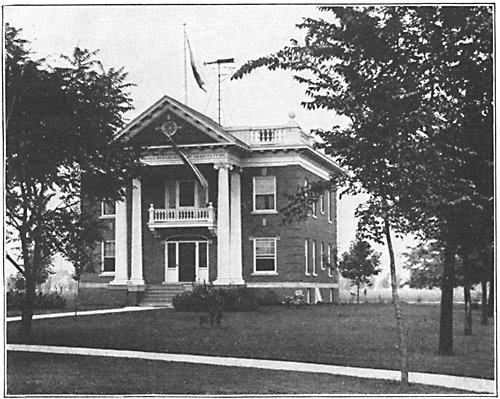
The United States Weather Bureau Station, Observatory Type,
at Peoria, Illinois. (Photograph, U. S. Weather Bureau.)
Regardless of the merits of these particular instruments,
it is certain that the cooling power of
the air—which is quite a different thing from the
temperature of the air—is a very important factor
in determining our comfort and our health. Within
certain limits the body can easily adjust itself to
changes in the cooling power of the air; within
wider limits the adjustment is effected with difficulty,
and we experience discomfort and possibly321
suffer in health; and finally there are extreme conditions,
in either direction, to which adjustment is
not possible; the internal temperature is then either
lowered or raised, as the case may be, and a comparatively
small change of this sort is fatal; i. e.,
death results by chilling or by heat stroke.

Photo U. S. Weather Bureau
THE CENTRAL OFFICE OF THE UNITED STATES WEATHER BUREAU IN WASHINGTON
One interesting result of recent inquiries on this
subject is the discovery that the bad effects of
crowded, “stuffy” rooms are not generally due to
impurities in the air, but to heat, humidity, and
especially lack of air movement. It seems to be
now demonstrated that there is no such thing as
“crowd-poisoning,” and that the bad smells of confined
places are no indication that the air is deleterious.
Professor Hill, who has done more than
anybody else to upset traditional ideas with regard
to ventilation, tells us that “the deaths in the Black
Hole of Calcutta, the depression, headache, etc., experienced
in close rooms are alike due to heat stagnation;
the victims of the Black Hole died of heat
stroke.” Most recent writers on physiology also
discredit the time-honored methods of testing the322
purity of the air by measuring the percentage of
carbon dioxide it contains. The amount of this gas
normally present in the free air is about three-hundredths
of one per cent, but experiments have
shown that thirty times this amount—a percentage
higher than is found in the worst ventilated rooms—may
be breathed for hours together without detrimental
effects. A further departure from old-fashioned
views is seen in the assertion of recent
authorities that a deficiency of oxygen, unless far
more pronounced than ever actually occurs in buildings,
mines, etc., where the supply of this gas has
been the subject of so much solicitude, has no physiological
significance whatever. In support of this
assertion it is pointed out that at mountain health
resorts the concentration of oxygen out-of-doors is
much less than that found in the worst ventilated
rooms at sea-level. In mines an ample supply of
oxygen may be positively dangerous, as favoring
the occurrence of explosions. These were rare before
the enactment of laws requiring a high percentage
of oxygen in mine air.
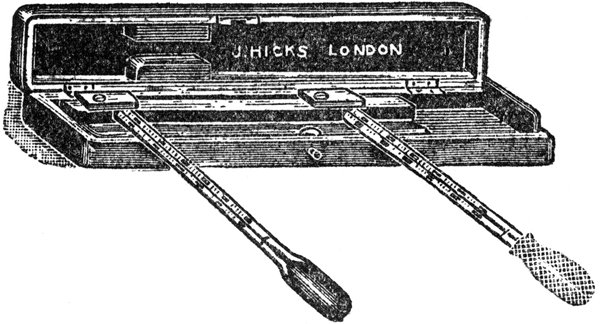
HILL’S KATATHERMOMETER
Excessive dryness of the skin, which is a common
cause of discomfort, is not very closely related
to the humidity of the air. “In winter,” says Hill,
“if there be a wind the rate of evaporation is so
accelerated that the skin feels dry, because in order
to check the loss of body heat the sweat glands are
inactive and the blood vessels of the chilled skin
are constricted.” There has been a great deal of
discussion about the dry air of American buildings
in winter, and startling figures have been adduced
to show that the air of such buildings is dryer than
that of deserts. So far as measurements of relative
humidity go, this is perfectly true; but, as Dr.323
G. T. Palmer, of the New York State Commission
on Ventilation, has pointed out, there is an important
difference between dryness and “dryingness.”
The latter depends upon the movement of the air,
as well as the relative humidity. The circulation of
the air in a desert is generally much more active
than that of the air in a building with the windows
shut, and therefore much more conducive to rapid
evaporation. There are systems of ventilation in
which the air is kept in steady and rapid motion,
and it is probably only in such cases that the air of
our heated houses can be compared to that of a
desert. From the European point of view American
buildings are notoriously overheated, but this is
probably due to the fact that our hot summers—much
hotter than those of Europe—have adapted
us to a tropical climate.
It is natural to inquire whether the atmospheric
conditions that affect the comfort of man do not also
exercise a marked influence upon his muscular
efficiency and his mental powers. This question has
been answered in the affirmative by a number of ingenious
writers, who have sought to establish
definite quantitative relations between certain states
of the atmosphere and the output of work in factories,
the grades attained by school children, etc.
Thus, Dr. Ellsworth Huntington, a well-known
worker in this field, declares that the most favorable
daily mean temperature for mental activity
(the temperature being measured out-of-doors) is
about 40 degrees F., and for physical activity about
60 degrees F. Contrary to the common opinion, he
holds that our general efficiency is at low ebb in
midwinter and fairly high in summer. Variability
in temperature, within certain limits, he finds to be324
stimulating; equable temperature the reverse. He
has drawn charts showing the distribution of what
he calls “climatic energy”—i. e., the combination
of certain weather factors supposed to control
human efficiency—throughout the world, and other
charts showing a more or less similar distribution
of “civilization.” He has also made an ambitious
attempt to interpret the history of mankind in terms
of weather and climate.
Another fruitful worker along similar lines is
Dr. Griffith Taylor, of Australia, who has made interesting
studies of the control of settlement in his
own country and elsewhere by temperature and
humidity, and has introduced some novel graphic
methods (“climographs”) for comparing climates
with respect to their effects on humanity.
There has, in short, arisen a new school of climatologists
whose aim is to develop exact mathematical
formulæ whereby we shall be able to adjust the
economic arrangements of mankind on an intelligent
basis as regards climate. The success of their
efforts is a question for the future to decide, but
there is no doubt that their work is profoundly suggestive.
These undertakings, it may be noted, bear
a striking analogy to those of the present generation
of agricultural meteorologists, who are applying
climatic statistics to the problem of selecting crops
and to the improvement of agricultural methods.
A certain number of specialists are engaged in
studying the physiological effects of sunlight and
other special kinds of solar radiation, the distribution
of which varies greatly from place to place and
from time to time, especially on account of differences
in the selective absorption of such rays by the
atmosphere. The chemical action of sunshine that325
causes sunburn—even at very low temperatures,
as, for example, on high mountains—may have far-reaching
effects on the human organism (as it certainly
has on plants), and there is great need of
collecting more data of “photochemical climate”
than we now possess, in order that this subject may
be thoroughly investigated. One of the few institutions
in the world at which a large amount of
work has been done in this line is the private observatory
of Dr. C. Dorno, at Davos, the well-known
health resort in the Alps. Dorno’s studies throw a
good deal of light upon the therapeutic effects of
sunshine in a mountain climate.
Many forms of dust in the atmosphere are capable
of producing pronounced physiological and
pathological effects. There is a long list of “dusty
trades” in which the production of excessive dust
has notoriously evil effects upon the health of workmen,
leading especially to pulmonary diseases;
sometimes to various kinds of poisoning. These
harmful dusts are by no means confined to factories,
mines, quarries, and the like. The air of the average
city street abounds in them. Dr. J. G. Ogden
states that 61 per cent of the dust found in the air
of the New York subways consists of jagged
splinters of steel, resulting from the wearing away
of brake shoes, wheels, and rails.
The amount of danger to human health incurred
through the presence of disease germs in the atmosphere
has been the subject of much controversy.
The present tendency is to regard this danger as
very slight, under ordinary conditions. Thus, Dr.
F. S. Lee writes:
“Evidence that disease germs pass through the
air from room to room of a house or from a hospital326
to its immediate surroundings always breaks
down when examined critically. It is indeed not
rare now to treat cases of different infectious diseases
in the same hospital ward. The one place of
possible danger is in the immediate vicinity of a
person suffering from a disease affecting the air
passages, the mouth, throat, or lungs, such as a
‘cold’ or tuberculosis. Such a person may give out
the characteristic microbe for a distance of a few
feet from his body, not in quiet expiration, for simple
expired air is sterile, but attached to droplets
that may be expelled in coughing, sneezing, or
forcible speaking. In this manner infection may,
and probably does, occur, the evidence being perhaps
strongest in the case of tuberculosis. But
apart from this source there appears to be little
danger of contracting an infectious disease from
germs that float in the air.”
In regard to sewer gas, which still inspires so
much dread in the popular mind, Dr. Lee says:
“Workmen in sewers are notoriously strong,
vigorous, healthy men, with a low death rate among
them. The specter of an invisible monster entering
our homes surreptitiously from our plumbing
pipes and sapping our lives and the lives of our
children must be laid aside; we need no longer leave
saucers of so-called ‘chlorides’ standing about our
floors to neutralize in an impossible manner mysterious
effluvia that do not exist; and when we return
to our town houses in the autumn we may
enter them with no fears that we are risking our
lives by coming into a toxic, germ-infected, sewer
gas-laden, deadly atmosphere.”
Present-day knowledge on the subject of infectious
diseases discredits many ideas that once prevailed327
with regard to the effects of tropical climates
on health. The remarkable results accomplished by
vigorous sanitary measures in such places as
Havana, the Isthmus of Panama and Guayaquil
have aroused hopes—perhaps too sanguine—that
eventually all parts of the tropics will be made
healthful for the white race. In the Canal Zone the
death rate of the large population of American
men, women, and children is not higher than prevails
in many cities of the United States; whereas,
a generation ago, when the French were at work on
the canal, the “climate” of this region was regarded
as one of the most unhealthful in the world. Some
authorities go so far as to assert that the deterioration
in the general health and efficiency of white
people in the tropics, so far as it actually occurs, is
due entirely to preventable diseases. It would seem
more rational, however, to assume that there are
climates both in and out of the tropics which, on
account of their heat, humidity, and other purely
physical factors, are not so suitable for habitation
for any race of humanity as others. How
far acclimatization can go toward offsetting
the effects of these atmospheric conditions is
problematical.
The changes in the barometer that occur from
day to day in regions where these changes are most
pronounced are, on an average, not greater than
those encountered in going from the bottom to the
top of a good-sized hill, and are probably not directly
of physiological importance. Certain European investigators,
however, ascribe pathological effects to
the minute and rapid barometric fluctuations—too
small to be detected with an ordinary barometer—that
occur, for example, when the foehn wind is328
blowing. Whether this is the cause, or a contributory
cause, of “foehn-sickness,” of which one
hears in Switzerland, is still uncertain.
The physiological effects of a rarefied atmosphere,
as experienced in mountain climbing, ballooning,
and aviation, are not yet well understood, despite
the large amount of study that has been devoted to
this subject. Recent views are thus summarized
by Rosenau:
“The symptoms produced by a marked diminution
in atmospheric pressure vary with circumstances.
The effects are increased by cold, active
muscular exertion, or improper clothing. The
noticeable symptoms are increased rapidity of respiration
and acceleration of the circulation, noises
in the head and dizziness, impairment of the senses
of sight, hearing, and touch, dullness of the intellectual
faculties, and a strong desire to sleep. Sudden
changes to a rarefied atmosphere cause syncope,
weakness, dyspnœa, dizziness, and nausea. These
threatening symptoms go by the name of ‘mountain
sickness,’ Bert and Journet believe this condition
is due to lack of oxygen, and the symptoms may,
in fact, be relieved by adding oxygen to the air
inspired. Kronecker concludes that mountain sickness
is caused by a congestion of the lungs, impeding
the flow of blood through them. Mosso and his
followers attribute the physical disturbances of a
reduced atmospheric pressure to the fact that the
blood loses carbon dioxide more quickly than it loses
oxygen, and they ascribe mountain sickness to this
decrease of carbon dioxide in the blood. Cohnheim
believes there is a concentration of the blood at high
altitudes; in fact, insignificant increases have been
found by competent observers.”
329
Divers and workers in caissons are subjected to
high barometric pressure, amounting, at the maximum,
to about 4½ atmospheres. According to
Rosenau:
“The physiological effects of an increased atmospheric
pressure are mainly due to an increase in the
amount of atmospheric gases (especially nitrogen)
which are taken up by the blood, and also to an increase
in the chemical absorption of oxygen by the
blood. The serious consequences usually result
from too rapid decompression. As the pressure is
released gas bubbles form. Gradual decompression
gives a chance for the gas to escape from the lungs
and be expelled without the production of bubbles.”
The health and comfort of many people seem to
be affected, in a rather striking way, by the passage
of the barometric depressions and areas of high
pressure that alternate at intervals of a few days
in the temperate zones. These effects should not be
ascribed to changes of pressure, but rather to the
accompanying changes in the other meteorological
conditions. The late Dr. Weir Mitchell, who was a
pioneer student of such phenomena, wrote of “a
neuralgic belt, within which, as it sweeps along in
advance of the storm, prevail in the hurt and
maimed limbs of men, in the tender nerves and
rheumatic joints, renewed torments called into existence
by the stir and perturbation of the elements.”
Victims of neuralgia and rheumatism are
probably quite justified in regarding themselves as
human barometers, capable of predicting with considerable
accuracy the advent of stormy and rainy
weather.
The fluctuations of temperature, humidity, and
wind that attend the passage of barometric highs330
and lows would seem, in virtue of their effects on
the heat-regulating mechanism of the body and consequent
reactions upon the nervous system in general,
to supply an ample explanation of the unpleasant
symptoms above noted in the case of sensitive
people; conditions to which the collective name of
“cyclonopathy” has been given by European investigators,
and which are extensively discussed in the
works of Hellpach, Frankenhäuser, and Berliner.
Some authorities have, however, invoked in this
connection the possible effects of atmospheric electricity,
and pointed to the extreme sensitiveness of
many persons to the approach of thunderstorms;
a condition which Dr. G. M. Beard named “astraphobia.”
It is stated that the passage of a low-pressure
area favors the emission of radioactive
emanations from the ground, that the ionization of
the atmosphere, and hence its electrical conductivity,
is thus increased, and that the electric charge
of the body is carried away more rapidly than
usual. Here we enter upon a debatable subject, but
one that thoroughly merits investigation. The
human organism is the seat of various electrical
phenomena, and these certainly cannot be independent
of changes in the electrical state of the
atmosphere.
Apart from possible direct effects of atmospheric
electricity upon the human system, it has been suggested
that electrical changes in the atmosphere
affect the rate of reproduction of bacteria, and may
therefore have some influence on the spread of infectious
diseases.
The weather has many subtle influences upon the
human mind, producing moods of cheerfulness and
depression, and manifesting themselves in the records331
of the behavior of school children, in statistics
of crime, insanity, suicide, drunkenness, etc. An
interesting account of these manifestations is given
by Dr. E. G. Dexter in his book “Weather Influences”
(New York, 1904).
Finally, the aspect of meteorology that has thus far
acquired the most definite shape in medical circles
and given rise to the most coherent body of literature
is Medical Climatology, which is designed to be
applied in the climatic treatment of disease (climatotherapy).
Thus many compilations have been
made of the climatic statistics of health resorts, and
these resorts have been classified with respect to
their supposed climatic effects upon various diseases.
From the point of view of the physical climatologist,
the statistics found in such books seem,
in general, both meager and ill adapted to bring out
important features of the climates discussed; to say
nothing of the fact that the whole subject of climatotherapy
is fraught with controversy—whereof
the history of the treatment of tuberculosis furnishes
a shining example!
332
CHAPTER XXI
WEATHER-MAKING
Meteorologists, in their candid moments,
have been heard to express disappointment over
the amount of progress made in the art of weather
forecasting during the past half-century. “Shall we
ever,” they ask, “be able to predict the weather with
mathematical certainty, as the astronomer predicts
an eclipse of the sun or moon?”
Perhaps even within the meteorological fold there
are unorthodox optimists who would answer such a
question thus: “Yes, because some day we shall control
the weather. It is inconceivable that man, who
is every day achieving new miracles in the conquest
of nature, should not eventually find a way of regulating
the rainfall and sunshine that are of such vital
importance to his crops, the winds that must be
reckoned with in his voyages by sea and air, and the
various other elements of weather that have so much
to do with his happiness and welfare. The attainment
of this object is so tremendously desirable that
it cannot forever baffle human ingenuity.”
In support of such a bold assertion it might be
pointed out that we already control the weather to a
certain limited extent. When the horticulturist
burns orchard heaters to protect his fruit from frost
he certainly alters the weather for a few hours over
a small area of the earth. If there were any practical
justification of the process, the temperature of333
the air over an entire State, for example, could be
raised throughout the winter, with appreciable
effects on agriculture. The difference between heating
a single orchard for a night and heating a State
for a season is one of degree, and not of principle.
The climate of a city is, through causes dependent
upon man, materially different from the natural
climate of the surrounding country. Every dwelling
provided with heating arrangements enjoys an
artificial summer amid the blasts of winter. Local
control of the winds is exemplified in the planting of
thousands of miles of trees as windbreaks in the
prairie regions of our Middle West. By moderating
the winds this process has a marked effect on temperature
and evaporation and is so beneficial to crops
that in the aggregate it furnishes a striking example
of successful “weather-making” by mankind. Analogous
methods, perfectly feasible with means already
at our disposal, would change the whole climatic aspect
of large areas of the earth’s surface.
The question “Can we make it rain?” may be
answered in the affirmative by those who are neither
impostors nor victims of self-delusion. The deposit
of spray from the spout of a teakettle might, without
much stretching of terms, be described as a miniature
artificial rainstorm; but much bigger showers,
in nowise different from those occurring in nature,
can also be produced artificially. Huge clouds have
often been observed to form over forest fires and
other great conflagrations. These clouds, composed
of water drops, tower far above the smoke cloud,
and are identical in character and mode of origin
with the cumulus and cumulo-nimbus clouds formed
by currents of moist air rising from the heated
ground on a summer day. There are several well-334authenticated
cases in which rain has been seen to
fall from such clouds, and these showers have sometimes
been so heavy as to extinguish the fires that
generated them. Hence, given favorable conditions
of humidity, temperature and wind, mankind can
certainly produce a rainstorm (and perhaps a thunderstorm
into the bargain) by the relatively simple
process of building a big fire.
Unfortunately the vast majority of methods
whereby man has attempted to regulate the weather
have no such rational foundation as those we have
just mentioned. Some are wholly superstitious,
others are purely empirical, and yet others are
based upon ideas that their promoters suppose or
pretend to be scientific, but that are actually fallacious.
In the history of superstitious practices weather-making
plays a prominent part. Sir J. G. Frazer,
in that great storehouse of myth and folklore,
“The Golden Bough,” says: “Of the things which
the public magician sets himself to do for the good
of the tribe, one of the chief is to control the weather
and especially to insure an adequate fall of rain. In
savage communities the rain-maker is a very important
personage; and often a special class of
magicians exists for the purpose of regulating the
heavenly water supply.” Frazer devotes ninety
pages of his work to a rapid survey of the superstitious
methods of controlling the weather that have
found credence among the various races of mankind.
These range all the way from the most complicated
ceremonies to the summary expedient of throwing
a passing stranger into a river to bring rain.
The sailor who whistles or scratches the mast to
raise a wind is merely keeping up a quaint custom,335
in the efficacy of which he may or may not put
some lingering faith, but which the world at large
long since ceased to take seriously. When, however,
a vessel master attempts to disperse a waterspout by
firing a cannon at it, he is doing what nine educated
persons out of ten would probably do under the circumstances.
Yet one process is no more futile than
the other, and both are based on superstition. Ages
ago sailors sought to frighten waterspouts away by
pointing knives at them, or by shouts and the clashing
of swords, and the use of cannon originally embodied
the same idea of terrifying the watery monster.
It is our purpose in the present chapter to describe
especially several processes of weather-making
which, while not obviously chimerical from the
point of view of the layman, have been more or less
positively discredited through the scrutiny of men
of science.
The efforts of modern weather-makers have been
directed especially to two objects; viz., the production
of rain and the prevention of hailstorms. In
the United States a certain amount of ingenuity has
also been devoted to the task of dispelling tornadoes.
Some years ago a device for the latter purpose was
patented, consisting of a box, containing explosives,
mounted on a pole and erected a mile or so to the
southwestward of the village to be protected from
these unwelcome visitors. The force of the wind
was expected to detonate the explosives by driving
a movable board against percussion caps. The inventor
believed that a violent explosion would disperse
the passing tornado funnel. Apart from the
fact that a single installation of this character, or
even several of them, would seldom happen to be at
exactly the right spot to explode close to the relatively336
small vortex of a tornado, the effect of the explosion,
even in the very heart of the storm, would
certainly be negligible. The energy that keeps the
tornado in action is supplied continuously from a
level far above the earth, while the disturbance due
to the explosion would be only momentary. Above
all, the energy developed in any discharge of explosives
that the community could afford to pay for
would be quite insignificant compared with that
which prodigal nature supplies to the tornado.
The same disproportion between the giant forces
at work in the atmosphere and the pygmy forces at
the disposal of mankind is a point that is overlooked
in most attempts at weather-making.
The widespread belief that rain can be produced
by explosions rises so far above the level of ordinary
popular delusions that it has sometimes led to large
expenditures of money on the part of drought-ridden
communities and even of national governments.
Perhaps the most remarkable example of official
confidence in the efficacy of this process was that
furnished some years ago by the Volksraad, or legislative
assembly, of the Transvaal, which passed a
law forbidding the bombardment of the clouds to
produce rain, on the ground that the rain-makers
were thwarting the will of the Almighty!
One manifestation of the belief in question is
found in the common assertion that rain is the usual
sequel of battles. This idea originated, however,
long before the invention of gunpowder. It is
mentioned by Plutarch and other writers of antiquity.
Whatever superstition or crude process of
reasoning may have first given support to this
notion in the popular mind, the explanation now
commonly advanced is that the condensation of337
moisture is promoted by the concussion due to cannonading,
or that the drops already condensed and
constituting the clouds are jostled together by the
same disturbance, with the result that they coalesce
and fall as rain. There is no ground for such assumptions.
As was once pointed out by the late
Professor Simon Newcomb, the effect of a violent
explosion upon a body of moist air a quarter of a
mile distant is about the same as that which the
clapping of one’s hands would produce upon the
moist air of the room in which the experiment is
performed. Again, if we stand in the steam escaping
from a teakettle and clap our hands we
shall not produce a shower, though we jostle the
water drops much more than the explosion does at a
distance of a quarter of a mile.
In recent years another explanation has been offered
for the alleged production of rain by explosions;
viz., that the smoke and gases arising from an
explosion increase condensation by increasing the
number of “nuclei” in the atmosphere. As we have
seen, however, in considering the natural formation
of rain, the number of condensation nuclei normally
present in the atmosphere is so great that it must be
diminished, rather than increased, before drops as
large as raindrops can be formed. Moreover, the
nuclei required for the condensation of water vapor,
including molecules of highly hygroscopic gases, are
given forth in abundance by great manufacturing
centers, yet these places do not have a heavier rainfall
than the surrounding country. Pittsburgh, for
example, is actually one of the driest places in Pennsylvania.
One obvious reason why rain often follows a battle
is that battles are frequently fought in regions338
where rain normally occurs every two or three days,
on an average, whether in peace or war. In northern
France, for example, where the battles of the World
War were plenteously interspersed with showers,
meteorological records show that the average number
of rainy days per annum is upward of 150. The
drenching rains that made “Virginia mud” a byword
during the American Civil War gave great currency
to the belief in “rain after battles,” Here, again,
we have accurate weather records to help us dispel
a fallacy. Thus at Richmond rain falls on 122
days in an average year, at Lynchburg on 124 days,
and at Petersburg on 105 days.
There is, however, a particular reason why rain
is rather more likely to occur soon after a battle than
shortly before one; viz., the fact that intervals of fair
weather, with consequent dry roads, are used by
commanders in carrying out the movement of troops
that precede an engagement. By the time such arrangements,
often occupying several days, are completed,
the “spell” of fine weather is likely to be over,
and a rainstorm is due in accordance with the normal
program of nature.
The most famous undertaking in the history of
rain-making—and one which has had an incalculable
effect in fostering the credulity of the public with
respect to similar enterprises—was that carried out
by General Robert Dyrenforth on behalf of the
United States Government in 1891. Congress voted
appropriations amounting to $9,000 for these experiments,
and Dyrenforth was appointed a “special
agent” of the Department of Agriculture to direct
them. After some preliminary trials in the suburbs
of Washington, the experimenters proceeded to a
ranch near Midland, Texas. Here a few balloons339
filled with a mixture of oxygen and hydrogen, as well
as several sticks of dynamite carried up by kites,
were exploded in the air, but the only explosions of
considerable magnitude were set off on the ground.
The experiments continued over a period of three
weeks and in some cases showers fell within a few
hours after an explosion, but, in spite of the somewhat
favorable tone of the official report, the consensus
of scientific opinion was that the undertaking
was a failure, while the views of the public at
large were divided. The attitude of the Government
is sufficiently indicated by the fact that it has never
since undertaken experiments in this line. The one
tangible outcome of this affair was that a crop of
private rain-makers sprang up all over the country,
and to this day the example set by the official
experimenters is cited in support of every sort of
harebrained scheme for juggling with the weather.
In 1911 and 1912 the late C. W. Post, of breakfast-food
fame, expended many thousand pounds of dynamite
in efforts to produce rain in Texas and Michigan.
Showers undoubtedly occurred in conjunction
with Post’s experiments, but conditions favoring
their occurrence were plainly indicated on the current
daily weather maps, and they had been duly
forecast by the Weather Bureau.
The professional rain-maker does not generally
resort to the expensive process of bombarding the
clouds. His methods most frequently involve the
use of chemicals, and the details are shrouded in
mystery. For example, about a quarter of a century
ago one Frank Melbourne, known as “the Australian
rain-maker,” enjoyed great celebrity and
coined money by his exploits in this field. His plan
was to shut himself up in a barn, freight car, or340
other structure, and manipulate his chemicals and
electric batteries for hours or days. Naturally rain
sometimes came after these operations, but as often
it did not.
Several of the methods that have been suggested
from time to time for producing rain are sufficiently
discredited by the fact that the expense of putting
them into execution would more than offset any
benefits derived from the rain, if the experiments
proved successful. Thus one genius, observing the
deposit of water on the outside of an ice pitcher in a
warm room, proposed to set up a barrier packed with
ice in the path of moisture-bearing winds. Another
plan occasionally suggested is to sprinkle the
atmosphere aloft with liquid air or liquid carbon
dioxide, in order to lower the temperature, by the
rapid evaporation of these substances, below the
point of condensation. A third proposal is to create
a local updraft of air by means of powerful fans or
blowers, thus imitating the convectional process by
which clouds and rain are formed in nature.
Lastly, various plans have been suggested for
altering the electrical condition of the upper atmosphere—for
example, by electrical discharges from
balloons—on the assumption that rainfall might thus
be promoted. This assumption, however, is not consistent
with known facts as to the relation between
atmospheric electricity and the condensation of
atmospheric water vapor.
While in America a vast amount of money has
been wasted on futile experiments in rain-making,
far more has been spent in Europe on schemes for
averting hailstorms. Methods of accomplishing this
purpose have varied from age to age. In antiquity
it was the custom to shoot arrows or hurl javelins341
toward the gathering clouds in the hope of frightening
them away. In the Middle Ages ecclesiastical or
occult agencies were invoked; “hail crosses” (such
as are still seen in the Tyrol) were erected; and the
ringing of church bells was considered efficacious
against both hail and lightning, as is shown by the
inscriptions found on many old bells.
The custom of firing cannon at the clouds to avert
hail began centuries ago in Styria and northern
Italy, and it was well established in France before
the Revolution. Toward the end of the eighteenth
century, however, another method of hail protection
was introduced in France, whence it spread over the
rest of Europe. This consisted in setting up tall,
metal-tipped poles, imitated from lightning rods. It
was supposed that these poles, which were known
as paragrêles, would draw the electric charge from
the clouds and thereby (though nobody could say
why) would prevent the formation of hailstones.
This device, though reported on unfavorably by the
French Academy of Sciences, gained great popularity.
One of its advocates, writing in 1827, states
that more than a million paragrêles were at that
time in use in France, Switzerland, Italy, Austria,
Bavaria, and the Rhine country. The vogue enjoyed
by these contrivances is said to have come to a
sudden end when a tremendous hailstorm not only
devastated the fields and vineyards they were supposed
to protect, but also knocked down a great
number of the rods themselves.
In recent times both the hail cannon and the
paragrêle have been revived. The new era of “hail-shooting,”
as the process of cannonading the hail
clouds is called, dates from the year 1896, when a
number of cannon of a new type were installed in342
the vine-growing district of Windisch-Feistritz, in
Styria. The success claimed for them in this region
led to their introduction on a vast scale over the
greater part of southern and central Europe. The
cannon employed were small mortars, to the muzzles
of which were attached sheet-iron funnels. No projectile
was used, but the explosion of the charge sent
aloft a curious whirling ring of smoke and gas,
powerful enough to splinter sticks and kill small
birds several hundred feet from the cannon. By the
year 1900 at least 10,000 hail cannon were in use
in Italy alone. Several modifications of the device
were introduced, such as the use of acetylene in
place of gunpowder; and eventually certain forms
of rocket and bomb were adopted, for concentrating
the effects of the explosion at as high a level as possible.
About the year 1899 a new form of hail rod was
introduced in France, and this has become the
favorite means of protection against hail in that
country. It is essentially a very large lightning rod
of pure copper, grounded by means of a broad copper
conductor. Such rods have been installed, in some
cases, on church steeples and other tall edifices, including
the Eiffel Tower, in Paris, and in other
cases on tall steel towers erected for this purpose.
This device is called fantastically an “electric Niagara,”
because, according to the claims of its promoters,
it draws down “torrents” of electricity from
the clouds. Hundreds of these “Niagaras” have
been constructed in France. Some of them are set
up in rows, or so-called barrages, across the habitual
paths of hailstorms. The French Government was
induced to appoint a “Comité de Défense contre la
Grêle” (Hail-protection Committee), which before343
the war had made elaborate plans for “protecting”
not only the whole of France, but also Algeria and
Tunis, with these devices. Similar rods have been
erected in Argentina, and plans for introducing
them in South Africa were near consummation at
the time the World War broke out.
In order to understand the extraordinary hold
that the various hail-protecting devices have taken
upon the minds of European cultivators it should be
remembered that the intensive cultivation of the soil
is the rule over the greater part of Europe, so that
a hailstorm of relatively small extent often does
enormous damage. Vineyards are especially subject
to injury from this cause, and many of the richest
vine-growing districts of the Old World are notoriously
afflicted with hailstorms.
Scientific commissions appointed by the Austrian
and Italian governments conducted long series of
tests of the methods of bombarding the clouds with
mortars, bombs, and rockets, and declared them to
be of no value. The erection of hail rods, though it
has received a certain amount of official encouragement
in France, is also strongly discountenanced by
the majority of scientific men, as well as by a large
proportion of intelligent agriculturists. Reports on
the actual operation of the rods support conflicting
opinions—as might be expected from the fact that
the hailstorm is a decidedly erratic phenomenon.
Thus, some observers claim that the storm clouds
change conspicuously in appearance as they approach
a “Niagara,” and if they shed hail upon the
spot it is in a soft and harmless form. Others deny
the accuracy of these observations, and point to the
stubborn fact that ordinary hail has fallen on several
of the rods themselves, including the one on the344
Eiffel Tower. In the suburbs of Clermont-Ferrand
a “Niagara” is installed on an iron tower, 100 feet
high. This rod was pelted with hail twice in 1912
and four times in 1913, and in one case the hailstones
attained the size of hen’s eggs! Nobody has
ever offered any plausible scientific hypothesis to
explain why these rods should have an effect upon
hail, even if they are able, as seems unlikely, to reduce
the electrical charge of the clouds; since the
formation of hail is due to movements of the air,
which, in turn, are the cause and not the result of
the charge in question.
Fortunately for the farmer and the horticulturist—especially
in Europe—a method of averting
the losses due to hailstorms is available in the shape
of insurance, and its cost is decidedly less than that
entailed in systematic hail-shooting or in the general
erection of hail rods. Hailstorm insurance has been
extensively practiced in the Old World since the end
of the eighteenth century. In some countries it has
been conducted or subsidized by the government.
Generally each country is divided into a number of
zones, according to the recorded frequency of hailstorms,
and the premiums vary proportionately.
Premiums also vary for different crops, since some
are better able to withstand the effects of hail than
others. The amount of insurance of this kind carried
in Germany, alone, shortly before the World War,
was more than $800,000,000.
Hailstorm insurance is fairly common in the
United States, especially in the Middle West, but
still lacks an adequate statistical basis in the shape
of detailed records of hail frequency. In 1919 growing
crops in this country were insured against hail
to the extent of $559,134,000. Much information345
on this subject will be found in V. N. Valgren’s “Hail
Insurance on Farm Crops in the United States”
(U. S. Dept. of Agriculture, Bulletin 912), published
in 1920.
Besides the weather-making schemes already noted,
mention should be made of certain more ambitious
projects of this character that have been bruited
from time to time, and that have found plenty of
credulous supporters. In the year 1845 an American
meteorologist of undoubted ability, but much
inclined to the riding of hobbies—viz., James P.
Espy—proposed the building of great fires in the
western part of the United States in order to regulate
the winds and rainfall to the eastward. The
fires were to extend in a line of six or seven hundred
miles from north to south, and were to be set off
once a week throughout the summer. Another
genius, of less celebrity, proposed to destroy blizzards
by means of a line of coal stoves along the
northern boundary of the country. A favorite idea
of those who aspire to produce wholesale changes
of climate is to alter the course of ocean currents
for this purpose. One early plan contemplated the
damming of the Strait of Belle Isle in order to improve
the climate of New England and the Canadian
provinces; while, a few years since, a proposal to
build an immense jetty eastward from Newfoundland
for the purpose of “protecting the warm north-flowing
Gulf Stream from the onslaughts of the
ice-cold, south-flowing Labrador Current” actually
received, serious attention from the Congress of
the United States.
346
CHAPTER XXII
ATMOSPHERIC BYWAYS
1. IGNIS FATUUS, OR WILL-O’-THE-WISP
Will-o’-the-wisp is proverbially elusive. It
has thus far escaped the fate of the rainbow,
deplored by Keats. We do not know its woof and
texture, and it is not given in the dull catalogue of
common things.
A strong argument in favor of the reality of this
phenomenon is found in the great number of names
that have been applied to it. There are forty or
fifty in the British dialects alone. A myth generally
carries its nomenclature with it, as it spreads
from one community to another, while a fact of
nature may give rise to a variety of local names.
It is certain, however, that a great many different
phenomena have been described as will-o’-the-wisp.
Some of these are: (1) The phosphorescence
of decaying wood (“fox fire”) and other
vegetable matter. This is due to luminous fungi.
According to H. Molisch there are some forty-five
species of fungi, including twenty species of bacteria,
that have the property of luminosity. Sometimes
the ground under a forest is illuminated on
all sides with a soft, white light from decaying
leaves. (2) Fireflies, including glowworms (the
wingless females of the firefly and the larvæ). (3)
Luminous birds and animals. Their luminosity is
supposed to be due to parasitic fungi. Certain347
species of skunk have been described as giving off
in the darkness a continuous flame, the head being
fiery red, which blends into a bright blue at the tail.
(4) Ball lightning. (5) St. Elmo’s fire. (6) Moving
lanterns, distant lights of houses, and other
lights due to human agency. (7) Burning gas ascending
from marshes, stagnant pools, and the like.
Marsh gas and other inflammable gases commonly
rise from such places, and are often ignited by man,
or by lightning, etc. Such fires are sometimes seen
by day as well as by night. (8) Burning naphtha
springs.
Excluding the numerous reported cases of will-o’-the-wisp
in which the phenomenon may be plausibly
identified with one of those mentioned above,
there remain several cases, some of them reported
by very careful observers, which appear to belong
to a different category. The reports in question
differ somewhat in details, but yield the following
composite description:
Small luminous bodies, “about as large as your
fist,” or “the size of a candle flame,” are seen hovering
a few feet above the ground; not only over
marshes and pools, but also over dry land.
Sometimes they are stationary; at other times
they appear to drift with the wind, or even
to move independently. They appear and disappear,
after the manner of fireflies. They do
not set fire to objects with which they come in
contact, and are believed to be without sensible
heat. Their color is most often described as bluish,
but may be yellow, purple, green, etc.; rarely pure
white. They are without odor and without smoke.
Traditionally they are associated with graveyards,
but in very few of the cases heretofore recorded348
were they actually seen in such places. The popular
idea that they flee from the traveler who tries
to approach them and follow him when he seeks to
avoid them is also unsupported by the evidence thus
far adduced.
One of the most circumstantial accounts of these
objects is that published in the Belgian journal
“Ciel et Terre” for July-August, 1920, by a retired
army surgeon, Jules Rossignol, who observed them
repeatedly in the autumn of 1908 in and about some
marshy woods near Grupont. They were generally
seen to rise from the ground, at first in the shape
of little white clouds, which changed to luminous
globes on attaining an altitude of a dozen yards,
and returned by a circular path toward the ground.
They lasted from one to several minutes before disappearing
in the air.
It is astonishing that the phenomenon of ignis
fatuus, though reported from so many parts of the
world, has not yet been made the subject of direct
scientific examination. Nobody has ever studied its
light with the spectroscope, for example. Chemists
have, indeed, attempted to reproduce the phenomenon,
yet the chemical explanations of it that have
appeared in reference books down to a recent date
are quite untenable. It has sometimes been attributed
to marsh gas (methane, CH4), and sometimes
to phosphureted hydrogen (phosphine, PH3).
But marsh gas, besides not being spontaneously
combustible, diffuses too rapidly in the air to produce
the effects described, while phosphureted
hydrogen, though it takes fire spontaneously in the
air, produces thick wreaths of smoke when burning
and has a powerful odor—features never reported
in connection with will-o’-the-wisp.
349
At least two more plausible explanations of ignis
fatuus have been offered in the last few years. Mr.
F. Sanford (“Scientific Monthly,” Oct., 1919) believes
that it is due to “swarms of luminous bacteria
which are carried up from the bottom of the marsh
by rising bubbles of gas.” A Belgian chemist, M.
Léon Dumas (“La Nature,” Dec. 11, 1909), claims to
have produced little luminous clouds, corresponding
to the traditional descriptions of will-o’-the-wisp, by
combining the two gases sulphureted hydrogen and
phosphine. Both these substances are produced in
the decay of animal matter, especially of the brain
and spinal cord. The body of an animal, buried in
some wet place, would accumulate the two gases
under pressure in the skull and spinal canal, and
their escape, simultaneously, would fulfill the conditions
of M. Dumas’ experiments.
(At the request of the present writer, these experiments
were repeated at the Bureau of Standards,
in Washington, with only partial success.
Further trials with these and other gases due to
putrefaction are desirable.)
2. THE RAIN TREE
From time to time the newspapers publish
accounts of a wonderful tree, said to grow wild in
Peru or elsewhere, from the leaves of which falls
a continuous shower of rain, even in the driest
weather. The writers generally urge the introduction
of this tree in regions where the rainfall is
deficient, and a so-called “rain tree” has actually
been sold for this purpose by nurserymen.
The story of this tree is very old. Early voyagers
reported finding it in the East Indies, Guinea,
Brazil, and especially the island of Ferro, in the350
Canaries. Nowadays the name “rain tree” is applied
especially to a magnificent tree of tropical
America generally known to botanists as Pithecolobium
(or Enterolobium) saman. One of its common
names is “guango.”

THE RAIN TREE
From “Voyageurs anciens et modernes”
(By E. T. Charton)
A legendary scene in the island of Ferro
That many plants spontaneously exude moisture
under suitable conditions is well known. The phenomenon
is called “guttation.” The moisture drawn
up from the roots is usually transpired from the
leaves in the form of invisible water vapor; i. e.,
it is evaporated on passing into the air. If, however,
the humidity of the surrounding air is sufficiently351
high, or its temperature sufficiently low, to
check evaporation, the water will collect on the surface
of the plant in liquid form, and may ultimately
trickle to the ground in considerable quantities.
Guttation occurs chiefly at night, or in cloudy or
foggy weather. In a very dry climate it does not
occur at all; and for this reason, even if the so-called
rain tree could be successfully introduced in
such a climate, it would not help solve the problem
of irrigation.
The dripping of moisture deposited on plants
by drifting fog is another common process that may
have contributed to the legend of the rain tree. A
classic example of this process—technically called
“fog drip”—is that described by Dr. R. Marloth,
who has made actual measurements of the abundant
moisture captured by the vegetation of Table Mountain,
South Africa, from the driving clouds of the
southeast trade winds during the nearly rainless
summer months. Mr. Madison Grant, writing of a
similar phenomenon witnessed in the redwood
forests of California, tells us that “these forests
are sometimes so wet that the dripping from
the high crowns is like a thin rain, and in summer
it is oftentimes hard to tell whether it is
raining or not, so saturated with moisture are the
foliage and the trunks when the fog darkens the
forest.”
A copious production of “honeydew” by plant
lice, scale insects, etc., may be at the bottom of
some of the rain-tree stories. F. E. Lutz, in his
“Field Book of Insects,” writes of “weeping trees,”
which drip fluid of insect origin, and he says of the
honeydew secreted by the pear psylla (Psylla
pyricola): “When the psyllas are numerous the352
leaves and fruit become coated with this sticky substance
and it even drops from them like rain and
runs down the trunk.”
The following account of the Peruvian rain tree,
quoted from the traveler Spruce, was published
in “Nature” of Feb. 28, 1878, by Prof. Thiselton
Dyer:
“The Tamia-caspi, or rain tree of the eastern
Peruvian Andes, is not a myth, but a fact, although
not exactly in the way popular rumor has presented
it. I first witnessed the phenomenon in September,
1855, when residing at Tarapoto. I had gone one
morning at daybreak, with two assistants, into the
adjacent wooded hills to botanize. A little after
seven o’clock we came under a lowish spreading
tree, from which with a perfectly clear sky over-head
a smart rain was falling. A glance upward
showed a multitude of cicadas, sucking the juices
of the tender young branches and leaves and squirting
forth slender streams of limpid fluid.”
3. DEW PONDS
The Down country of southern England is one of
the few places in the world where the people go
to the hilltops to seek water in dry weather. On the
summits of the Downs are found many artificial
shallow ponds, most of them very old. Some, indeed,
date back to prehistoric times. The bottom
of these ponds consists of a layer of puddled chalk
or clay and is impervious to water, so that there is
no loss by seepage. As the ponds are not fed by
springs or surface drainage, and as lack of rain
does not cause them to dry up, it is popularly believed
that their maintenance depends upon dew.
Hence they are called “dew ponds.”
353
Kipling mentions them in his poetical description
of Sussex:
We have no waters to delight
Our broad and brookless vales—
Only the dew pond on the height
Unfed, that never fails.
The leading authority on dew ponds is Mr. Edward
A. Martin, who has written a book about
them. Mr. Martin’s experiments have demonstrated
that dew can make no important contribution
to the water supply of these ponds. The
rainfall on the hilltops is somewhat higher than in
the valleys, and the greater part of the water in
the ponds is undoubtedly derived from this source.
The real key to the mystery, however, is found in
the wet fogs that drift in from the sea. The process
of “fog drip,” which we have mentioned in connection
with the rain tree, supplies the deficiencies
of the rainfall, and the name “mist ponds,” occasionally
applied to these bodies of water, is more
appropriate than “dew ponds.”
It remains, however, an interesting paradox that,
in time of drought, the farmers of the Downs drive
their cattle to the hilltops to be watered and send
their carts uphill to procure water for household
use in the valleys below. Was it, perhaps, in this
topsy-turvy region—where uplands are called
“downs”—that Jack and Jill went “up the hill” on
their ill-starred water quest?
4. BLOWING WELLS
Wells that predict weather changes are local
curiosities in many parts of the world. Such wells
are not uncommon in the United States. If the
well is open at the top, its manifestations consist354
of occasional disturbance of the water and the discharge
of numerous bubbles. If it is covered, a
strong current of air is, at times, emitted from any
small orifice in the cover. This may be strong
enough to lift and blow away light objects placed
over the aperture. Its emission is frequently accompanied
by a loud whistling or roaring sound.
Such occurrences are supposed to betoken an approaching
storm. These wells are called “blowing
wells”; sometimes “weather wells” or “barometer
wells.”
In certain cases an indraft of air is sometimes
observed; i. e., the well alternately “sucks” and
“blows.”
As a rule these phenomena correspond to fluctuations
in barometric pressure, and therefore are, in
a rough way, indicative of changes in weather. It
is obvious that a body of air inclosed in the earth
and communicating by one or a few small openings
with the air above will set up outdrafts and
indrafts in adjusting its tension to that of the
latter. The amount of air contained in the well
itself would not suffice to produce the violent effects
observed and it is therefore assumed that the typical
blowing well taps a subterranean reservoir of air,
probably filling the interstices of sand and gravel
beds. When the pressure of the external air is diminished,
some of the imprisoned air escapes. For a
given body of inclosed air, the smaller the channel
or channels by which it emerges, the stronger the
outdraft. When the barometric pressure outside increases,
the current of air flows in the reverse
direction. In winter the indraft of cold air in such
a well sometimes causes the water to freeze, even
at a depth of 100 feet or more below the surface of355
the ground, and is therefore a source of inconvenience
to the owner.
Various other circumstances may give rise to the
bubbling and blowing of wells. Carbon dioxide and
other gases dissolved in the well water account for
the bubbling of many wells, and this process is
more active at times of low barometric pressure,
because at a given temperature, the amount of gas
that the water can hold in solution varies with
the pressure.
Another cause of the blowing of a well is, in some
cases, a sudden rise in the water level (“water
table”) in the surrounding ground, as after a heavy
rainstorm. If the ground is overlain by an impervious
stratum, the air imprisoned between this
stratum and the surface of the ground water over
an extensive area will escape with violence through
any available channel, such as that supplied by the
well.
Lastly, cases have been described in which subterranean
air currents arise from the friction of
rapidly flowing underground streams, setting up
permanent indrafts or outdrafts through wells communicating
with such streams.
5. CURIOUS SHOWERS.
Showers of blood, sulphur, manna, frogs, fishes,
and what not figure in all the old chronicles, and
are still frequently reported. Many occurrences of
this kind are recorded in Camille Flammarion’s book
“The Atmosphere,” Dr. E. E. Free’s “Movement of
Soil Material by the Wind” (U. S. Bureau of Soils,
Bulletin 68), and Mr. W. L. McAtee’s article “Showers
of Organic Matter” in the “Monthly Weather
Review” for May, 1917.
356
The power of the wind to whirl objects aloft is
a matter of familiar observation. McAtee tells of
seeing a silk hat lifted from its owner’s head and
blown over a ten-story building in the city of Washington.
The vortex of a tornado or a waterspout
furnishes the most favorable skyward route for
things that belong on terra firma. Objects weighing
scores or even hundreds of pounds are lifted by
these whirls. Within a mile or so of a tornado a
shower of cart wheels or cook stoves would not
necessarily constitute a “prodigy.” A chicken coop
weighing 75 pounds has been carried four miles
and a church spire seventeen miles. Oersted tells
of a waterspout at Christiansö, on the Baltic, that
emptied the harbor to such an extent that the greater
part of the bottom was uncovered, while McAtee
says that “waterspouts have been observed to accomplish
the comparatively insignificant feat of emptying
fish ponds and scattering their occupants.”
There is, in fact, no mystery about the way in
which terrestrial objects of many sorts get into the
air; nor, considering the force of the winds and
their occasional strong vertical components, is it
strange that such objects sometimes travel a long
way from home before they return to earth.
There are, however, a great many cases of reported
showers in which the objects did not really
fall, as supposed. McAtee gives the following
account of these spurious showers in the “Monthly
Weather Review”:
“Insect larvæ.—The rains of insect larvæ that
have been investigated have proved to be merely
the appearance in large numbers on the surface of
the ground or upon snow of the larvæ of soldier
beetles (Telephorus), or sometimes caterpillars,357
which have been driven from their hibernating
quarters by the saturation of the soil by heavy
rains or melting snow.
“Ants.—Accounts of showers of ants have
usually been founded on incursions of large numbers
of winged ants, which of course needs no
assistance from the elements to follow out their
habit of swarming forth periodically in immense
numbers.
“Honey; sugar.—Showers of honey and of sugar
are popular names for what scientists know are
exudations of certain plants, or of plant lice which
feed on a great variety of plants and whose product
is often known also as honeydew.
“Grains.—Showers of grain, usually considered
miraculous, have in most cases been determined to
be merely the accumulation by washing during
heavy rains of either the seeds or root tubercles of
plants of the immediate neighborhood.
“Manna.—An account of manna ‘rains’ certainly
pertains to the discussion of showers of vegetable
matter, for the substance manna consists of
lichens of the genus Lecanora but in none of the
numerous recorded instances of manna ‘rains’ is
there any direct evidence that the substance really
fell from the sky. These lichens form small, round
bodies that are easily blown over the surface of the
ground and accumulate in depressions; they are
very buoyant also and hence easily drifted into
masses during the run-off of rain water. Manna
‘rains’ have not occurred except in countries where
these lichens are common, and as for statements of
their falling down upon roofs or upon people, or
for any other proofs that they really rained down,
I have seen none.
358
“Blood rains.—The most frequently reported
showers that are spurious, at least in name, are
the so-called blood rains. In all times the phenomena
going under this name have frightened the
people and have been taken as portents of terrific
calamities. One of the famous plagues of Egypt
was a bloody rain which prevailed throughout the
whole land, continuing three days and three nights.
Homer and Virgil both allude to blood rains, and,
in fact, the general subject of preternatural rains
was a favorite with the older writers.
“But scientific investigation has done away with
the element of mystery in these phenomena and has
explained, with the others, the rains of blood. Some
blood rains have been found to be the meconial
fluid ejected by large numbers of certain lepidoptera
simultaneously emerging from their chrysalides;
other red rains are due to the rapid multiplication
in rain pools of algæ and of rotifers containing
red coloring matter; “red snow” results
from the presence of similar organisms. But in no
case have they rained down, except in the sense
that their spores or eggs have at some time been
transported, probably by the wind. The precipitation
of moisture furnishes favorable conditions for
their rapid development and multiplication.”
Most of the reported showers of blood, however,
have probably been rainstorms in which the rain
was colored with reddish dust. The occurrence of
such dust in the atmosphere is very common in
some parts of the world, as we have stated in a
previous chapter. It has been asserted that rain
which fell at Oppido Mamertina, Italy, May 15,
1890, actually contained blood, believed to be from
birds.
359
Showers of supposed “sulphur” are due to pollen,
chiefly from pine trees. The air in the vicinity of
pine forests is sometimes filled with clouds of this
material and the wind carries it for many miles.
It is reported that a pollen shower at Pictou, Nova
Scotia, in June, 1841, was so heavy that bucketfuls
were swept up on a ship.
In the case of alleged showers of “paper” the
material has been found to be the crusts of dried
algæ, which form on the surface of the ground
exposed by the evaporation of the water of shallow
ponds.
6. THE YEAR WITHOUT A SUMMER
The Weather Bureau is a bureau of information,
and one of the ways in which it strives to give a
good account of itself is by answering endless questions
about “the year without a summer.” This title
has been given to the year 1816.
Blodget, in his “Climatology of the United States,”
tells us that all the summers from 1811 to 1817
were cold in this country, and that in every month
of the summers of both 1812 and 1816 snows and
frosts occurred in the Northern States. It is the
latter summer, however, that has lived in popular
tradition. The year 1816 is known further as
“poverty year,” or “eighteen hundred and froze
to death.” It acquired the name of “mackerel year”
in New Hampshire, where people ate mackerel as
a substitute for pork, little of which was fattened
on account of the extreme scarcity of corn. Western
Europe, also, had a cold summer in 1816, and the
year as a whole seems to have been a cold one over
a great part of the world.
Sources of information about the cold summer in
this country, besides Blodget’s book above mentioned,360
include Perley’s “Historic Storms of New
England,” which devotes a whole chapter to the subject,
and Charles Peirce’s “Weather in Philadelphia.”
Peirce tells us that at Philadelphia “there was ice
during every month of the year, not excepting
June, July, and August, There was scarcely a
vegetable came to perfection north and east of the
Potomac.” According to the “Monthly Weather Review,”
citing the recollections of James Winchester,
of Vermont: “It is said that in June of that year
snow fell to the depth of three inches in New York,
Pennsylvania, and New Jersey on the 17th; five
inches in all the New England States, except three
inches in Vermont. There was snow and ice in
every month of this year. The storm of June 17
was as severe as any that ever occurred in the
depth of winter; it began about noon, increasing
in fury until night, by which time the roads were
impassable by reason of snowdrifts; many were
bewildered in the blinding storm and frozen to
death.... There was a heavy snowstorm August
30th.... The year 1816 had neither spring, summer,
nor autumn. The only crop of corn raised in
that part of Vermont that summer was saved by
keeping bonfires burning around the cornfield night
and day.”
At the time of its occurrence the frigid weather
of the summer of 1816 was popularly attributed
to sun spots, which were big enough to be seen with
the naked eye in May and June. A present-day
hypothesis on the subject has been mentioned in
our chapter on atmospheric dust. The dust cloud
from the eruption of Tomboro, in 1815, was so vast
that for three days there was darkness at a distance
of 300 miles from the volcano.
361
A proximate cause of the cold summer is perhaps
to be sought in an unusual intensity and extent
of the area of low barometric pressure which
is more or less permanently located in the vicinity
of Iceland and, as one of the principal atmospheric
“centers of action,” has a great deal to say about
the weather of the countries adjacent to the North
Atlantic. Dr. C. F. Brooks has called attention to
the fact that the Arctic navigator, Scoresby, found
unusually mild and open weather that summer in
the seas east of Greenland. This would be explained
by strong southerly winds, forming part of the
“counter-clockwise” circulation around the Iceland
low; and if the same pressure system extended its
influence to our shores, persistent cold northwest
winds might be expected to result over the northeastern
United States.
7. INDIAN SUMMER AND THE ICE SAINTS
Indian summer weather is an undeniable fact.
Every inhabitant of the northern United States and
southern Canada is familiar with the mild, calm,
hazy state of the atmosphere that frequently occurs
in the autumn, sometimes following a brief period
of unseasonable cold known as “squaw winter.” It
is, however, one thing to recognize the existence of
a certain type of weather as characteristic of our
autumns, and quite another to admit that one definite
spell of such weather occurs more or less
regularly from year to year. One true summer, and
only one, comes to pass each year, and occupies an
approximately fixed place in the calendar. Even the
so-called “year without a summer,” which we have
just described, was merely a year in which the
regular annual rise of the temperature curve was362
less marked than usual. Indian summer, on the
contrary, has never been tied down to a particular
part of a particular month. In his notes on the
meteorological conditions at Concord, Massachusetts,
during the ten years, 1851–1860, Thoreau
records the occurrence of Indian summer weather
on dates all the way from September 27 to December
13; a range of 77 days.
The belief in the definite occurrence, year after
year, of what has sometimes been called the “after-summer”
is not peculiar to America. It prevails
also in Europe, where this supposed period of renewed
warmth has been assigned to certain dates,
owing in part to its association with the names of
particular saints in the calendar. These dates vary
widely, however, from one region to another, ranging
from August 15 (Julian calendar), the beginning
of the “young women’s summer” of Russia, to
November 15, St. Martin’s day, a date popularly
associated with after-summer in Germany, Holland,
France, Italy, and sometimes England.
The supposed tendency of particular types of
weather to occur at about the same period every
year, independently of and often in sharp contrast
to the regular march of the seasons, has been described
by R. Abercromby under the name of
“recurrence,” and there is a large literature on the
subject; especially in connection with periods of
unseasonable temperature. While Indian summer
is the most discussed example of recurrence in the
American weather calendar, in the Old World more
attention, both popular and scientific, has been
devoted to a frosty period supposed to recur in May.
With the elaboration of the ecclesiastical calendar,
the frosts in question became definitely associated363
with the days dedicated to Saints Mamertus, Pancras,
and Servatius (May 11, 12, 13), or, in south-central
Europe, Saints Pancras, Servatius, and Boniface
(May 12, 13, 14), hence known as the Ice
Saints. These saints and their days are called in
French saints de glace, and in German Eisheiligen,
Eismänner, or gestrenge Herren.
Yet other examples of the elusive phenomenon of
recurrence are the “January thaw” of New England,
the April “blackthorn winter” of England, and
the June “sheep-cold” (Schafkälte) of Germany,
dangerous to newly shorn sheep.
In the middle of the last century the cold weather
of the Ice Saints was variously ascribed to the melting
of the ice and snow of high latitudes, the passage
of periodic meteor showers between the earth
and the sun, and other far-reaching terrestrial or
cosmical causes. FitzRoy believed that the liberation
of latent heat in autumn during the formation
of ice in the circumpolar regions was accountable
for Indian summer. A review of the whole body
of literature concerning supposed recurrent irregularities
in the annual march of temperature will be
found in the “Monthly Weather Review” (Washington)
for August, 1919.
Whether recurrence, in Abercromby’s sense of
the term, is a real phenomenon is still an unsettled
question. Many periods of unseasonable weather
occur in the course of each year, and it is easy for
the uncritical observer to identify one of them with
the Ice Saints, another with Indian summer, and so
on. About the best that meteorologists can do at
present is to explain each particular instance of
such weather by reference to barometric and other
conditions shown on the daily weather map.
365
GLOSSARY
The vast vocabulary of meteorology is very inadequately
represented in ordinary dictionaries,
and has never been made the subject of a comprehensive
special glossary. The writer of this book
has been gathering material toward such a glossary
for some years, and from the material now in
hand it appears that an approximately complete
English meteorological dictionary, embracing both
scientific and nonscientific terms relating to the
atmosphere and its phenomena, would contain upward
of fifteen thousand definitions.
From this statement it will be evident that the
brief glossary herewith appended is of the most
fragmentary character. It includes only a selection
of the meteorological terms found in the present
book. It does not, in general, include terms pertaining
primarily to physics, chemistry, astronomy,
physiology, etc., even though they figure to some
extent in meteorology, as all such terms used in the
book are more or less satisfactorily defined in the
latest editions of the large American dictionaries.
Absolute Extremes.—The highest and lowest values of a
meteorological element (especially temperature) that have
ever been recorded at a station; known, respectively, as the
absolute maximum and the absolute minimum. (The term
is sometimes improperly applied to the highest and lowest
values for a specified year.)
Aeroclinoscope.—A semaphore formerly used in Holland
for displaying weather signals.
Aerology.—The branch of meteorology dealing with the
“free” atmosphere; i. e., all parts of the atmosphere not near
the earth’s surface. Aerological investigations are made with366
kites and balloons, and also include observations of clouds,
meteor trails, the aurora, etc.
Afterglow.—1. The glow in the western sky after sunset.
2. A renewal of rosy light on mountain peaks after the first
sunset illumination has faded; also called recoloration. This
is one stage of the Alpenglow.
After-summer.—A renewal of mild weather in the autumn;
called Indian summer in America, St. Martin’s summer, etc.,
in Europe.
Alpenglow.—Successive appearances and disappearances of
rosy light sometimes seen on mountain peaks in clear weather
after sunset or before sunrise.
Altimeter.—A barometer used for measuring altitude.
Alto-cumulus; Alto-stratus.—Forms of cloud. (See Chapter
VI.)
Anemogram.—The record traced by a self-registering
anemometer.
Anemometer.—An instrument for measuring the force or
speed of the wind.
Aneroid Barometer.—A barometer consisting of a thin-walled
metal vacuum-box, which changes its shape with
changes of atmospheric pressure. The movements of the box
are communicated, by levers, to an index or (in the barograph)
to a recording pen.
Anthelion.—A rare species of halo, consisting of a brilliant,
usually white image of the sun opposite the latter in azimuth.
(This term has also been applied to the glory, q. v.)
Anticrepuscular Rays.—The continuation of the crepuscular
rays converging toward a point in the sky opposite to the sun.
Anticyclone.—An area of high barometric pressure and its
attendant system of winds. (Cf. cyclone.)
Antitrades.—Term formerly applied to the prevailing
westerly winds of middle latitudes, but now more frequently
applied to the westerly return-currents lying over the trade
winds. Some writers prefer to call the former the antitrades
and the latter the countertrades.
Antitwilight Arch.—The pink or purplish zone of illumination
bordering the shadow of the earth (dark segment) in the
part of the sky opposite the sun after sunset and before sunrise.
Arcs of Lowitz.—A pair of rare halo phenomena. These arcs
are directed obliquely downward from the parhelia of 22 degrees
on either side of the sun toward the halo of 22 degrees.
Astraphobia.—A pathological condition experienced by certain
persons before and during thunderstorms.
Atmometer.—An instrument for measuring evaporation;
also called atmidometer, evaporimeter, etc.
367
Aureole.—(See corona. 1).
Aurora.—A luminous phenomenon due to electrical discharges
in the atmosphere; probably confined to the tenuous
air of high altitudes. It is most commonly seen in sub-Arctic
and sub-Antarctic latitudes. Called aurora borealis or aurora
australis, according to the hemisphere in which it occurs.
Observations with the spectroscope seem to indicate that a
faint “permanent aurora” is a normal feature of the sky in all
parts of the world.
“Backstays of the Sun.”—A sailor’s name for crepuscular
rays extending downward from the sun.
Baguio.—The name current in the Philippines for a tropical
cyclone.
Ballistic Wind.—A military term applied to a fictitious
wind which, if affecting a projectile throughout its flight,
would produce the same total effect in deflecting it from its
course and altering its range as do the various winds that it
actually encounters.
Ballon-sonde.—A sounding-balloon.
Bar.—A unit of pressure equal to 1,000,000 dynes per
square centimeter. A bar = 100 centibars = 1,000 millibars.
A barometric pressure of one bar is sometimes called a “C. G.
S. atmosphere,” and is equivalent to a pressure of 29.531
inches of mercury at 32 degree F. and in latitude 45 degrees.
Barisal Gun.—Same as brontide.
Barocyclonometer.—One of several instruments that have
been devised for locating tropical hurricanes without the aid
of a weather map.
Barograph.—A self-registering barometer.
Barometer.—An instrument for measuring the pressure of
the atmosphere. The two principal types are the mercurial
and the aneroid. The microbarometer is used to show minute
changes of pressure. Certain forms of hygroscope are popularly
miscalled “barometers.”
Barometer Well.—Same as blowing well.
Barometric Tendency.—The change of barometric pressure
within a specified time (usually three hours) before one of
the regular observations.
Beaufort Scale.—A scale of wind force, originally devised for
use at sea, but now used also on land. The scale runs from 0 =
calm to = hurricane. Many other scales are similarly employed
in the noninstrumental observation of wind force.
Bioclimatic Law.—A phenological law, announced by Dr.
A. D. Hopkins, according to which periodical events of plant
and animal life advance over the United States at the rate
of 1 degree of latitude, 5 degrees of longitude, and 400 feet
of altitude every four days—northward, eastward, and up-368ward
in spring, and southward, westward, and downward in
autumn.
Bishop’s Ring.—A large corona due to fine dust in the
atmosphere. It has been seen after certain great volcanic
eruptions, especially that of Krakatoa, in 1883.
Blizzard.—A violent, intensely cold wind, laden with snow.
Blowing Well.—A well which emits a strong current of air
from any small opening in its cover during a fall of barometric
pressure. During a rise of barometric pressure such wells are
sometimes observed to “suck.” Wells that are thus responsive
to barometric changes are sometimes called “barometer wells”
or “weather wells.”
Bora.—A cold wind of the northern Adriatic, blowing down
from the high plateaus to the northward. Also, a similar
wind on the northeastern coast of the Black Sea.
Brave West Winds.—The boisterous westerly winds blowing
over the ocean between latitudes 40 and 50 degrees S. This
region is known as the “roaring forties.”
Bright Segment.—The broad band of golden light that, in
clear weather, borders the western horizon just after sunset
and the eastern just before sunrise.
Brontide.—A sound resembling a distant muffled detonation,
usually indefinite as to direction. Brontides are rather common
in certain parts of the world. They are called mistpoeffers
on the Belgian coast, Barisal guns in the Ganges delta,
bulldag, desert sounds, or Hanley’s guns in parts of Australia,
gouffre in Haiti, Moodus noises at Moodus, Connecticut, Nebelzerteiler,
Seedonner, Seeschiessen, etc., in Germany, baturlio,
boniti, bombiti, etc., in Italy. These sounds are probably of
subterranean origin in most cases.
Bump.—An upward jolt experienced by an aviator, as if
running over an obstruction. A bump may be caused by any
condition that suddenly increases the lift of the machine, but
is perhaps most frequently due to rising air currents. Air in
which bumps are experienced is said to be “bumpy.” (Cf. hole
in the air.)
Callina.—A Spanish name for dry fog.
Calms of Cancer; Calms of Capricorn.—The belts of high
pressure lying north of the northeast trade winds and south
of the southeast trade winds, respectively.
Center of Action.—Any one of several large areas of high
and low barometric pressure, changing little in location, and
persisting through a season or through the whole year; e. g.,
the Iceland low, the Siberian winter high, etc. Changes in
the intensity and positions of these pressure systems are associated
with widespread weather changes.
Ceraunograph.—A self-registering thunderstorm recorder.
369
Chinook, or Chinook Wind.—A foehn blowing down the
eastern slopes of the Rocky Mountains over the adjacent
plains, in the United States and Canada. In winter, this
warm, dry wind causes snow to disappear with remarkable
rapidity, and hence it has been nicknamed the “snow-eater.”
(Cf. foehn.) The “wet chinook” is a wind of a different
character, blowing from the Pacific Ocean over the northwestern
United States.
Circumscribed Halo.—A halo formed by the junction of the
upper and lower tangent arcs of the halo of 22 degrees, when
the luminary is about 40 degrees or more above the horizon.
As the altitude of the luminary increases, the circumscribed
halo gradually assumes an elliptical form and finally merges
into the halo of 22 degrees.
Circumzenithal Arc.—A rainbow-tinted halo, often very
bright, convex to the luminary and 46 degrees or a little more
above it. It is sometimes called the upper quasi-tangent arc
of the halo of 46 degrees, but the circumzenithal arc and the
halo of 46 degrees are rarely seen at the same time.
Cirro-cumulus; Cirro-stratus; Cirrus.—Forms of cloud.
(See Chapter VI.)
Cistern.—The cup, containing mercury, at the base of a
mercurial barometer.
Climatography.—1. Descriptive and statistical climatology.
2. An account of the climate of a particular place
or region.
Climatology.—1. The science of climate. 2. A body of
knowledge concerning the climate of any place or region; as,
“the climatology of Panama.”
Climograph.—A diagram introduced by Dr. Griffith Taylor,
of Australia, for showing the mean monthly values of wet-bulb
temperature and relative humidity at any place, and for
comparing such data as recorded at different places throughout
the world; especially with reference to the effects of climate
on mankind. Other pairs of elements can be used in
constructing climographs: e. g., the dry-bulb temperature and
the relative humidity.
Cloud-banner.—A bannerlike cloud streaming off from a
mountain peak.
Cloud-burst.—A sudden and extremely heavy downpour of
rain; especially one in which the water falls in a continuous
stream rather than in drops. The term has been most commonly
applied to downpours in mountainous regions.
Cloud-cap.—A caplike cloud crowning (1) a mountain summit,
or (2) another cloud, especially a mass of cumulo-nimbus.
Col.—The neck of low pressure between two anticyclones;
also called a saddle.
370
Cold Wave.—A rapid and marked fall of temperature during
the cold season of the year. The United States Weather
Bureau applies this term to a fall of temperature in 24 hours
equaling or exceeding a specified number of degrees and
reaching a specified temperature or lower; the specifications
varying for different parts of the country and for different
periods of the year.
Collector.—A device used in measurements of atmospheric
electricity for determining the potential gradient.
Continental Climate.—The type of climate characteristic of
the interior of a continent. As compared with a marine
climate, a continental climate has a large annual and daily
range of temperature.
Corona.—1. A colored luminous circular area formed, by
diffraction; around the sun, moon, or other source of light
seen through clouds or dust haze. Coronas invariably show a
brownish-red inner ring, which, together with the bluish-white
inner field between the ring and the luminary, forms
the so-called aureole. Most frequently the aureole alone is
visible. Well developed coronas show one or more series of
spectral colors outside the aureole. 2. A luminous circle
formed by the apparent convergence of auroral beams about
the place in the sky toward which the dipping-needle points.
Corposant.—(See St. Elmo’s fire.)
Countertrades.—(See antitrades.)
Crepuscular Rays.—Beams of light radiating from the sun,
seen both before and after sunrise and sunset. The beams are
made visible by the presence of water-drops or dust in the atmosphere,
and the intervening dark spaces are the shadows
of clouds. The beams are actually parallel; their apparent
divergence is the result of perspective.
Critical Period.—A period in the growth of a plant when it is
especially susceptible to the effects of atmospheric conditions.
Cumulo-nimbus; Cumulus.—Forms of cloud. (See Chapter
VI.)
Cyclone.—An area of low barometric pressure with its
attendant system of winds. The cyclones of the region within
the tropics (tropical cyclones) are violent storms; those of
higher latitudes (extra-tropical cyclones) may be stormy or
otherwise. Tropical cyclones are also called hurricanes, typhoons
or baguios. Extra-tropical cyclones are commonly
known as lows or barometric depressions.
Cyclonopathy.—The abnormal sensitiveness of certain persons
to the weather changes attending the passage of barometric
depressions.
Cyclonoscope.—A pasteboard dial formerly used in the West
Indies for locating cyclones.
371
Dark Segment.—The shadow of the earth which, in clear
weather, rises from the eastern horizon at sunset and sinks
below the western horizon at sunrise.
Deperditometer.—An instrument devised by A. Piche for
measuring the cooling power of the atmosphere, with reference
to its physiological effects.
Depression.—A cyclonic area, or low.
Desert Sounds.—(See brontide.)
Devil.—The name applied to a dust whirlwind in India.
The term is also current in South Africa.
Dew.—Atmospheric moisture condensed, in liquid form,
upon objects cooler than the air, especially at night.
Dew-point.—The temperature at which, under ordinary
conditions, condensation of water vapor begins in a cooling
mass of air. It varies with the absolute humidity.
Dew Pond.—The name applied in southern England to certain
artificial ponds on the uplands. They contain water in the
driest weather, and are popularly supposed to be fed by dew.
“Doctor.”—A colloquial name for the sea breeze in tropical
climates. The name is sometimes applied to other cool, invigorating
breezes.
Doldrums.—The equatorial belt of calms or light, variable
winds, lying between the two trade-wind belts.
Drought.—A protracted period of dry weather. In the
United States a drought has been defined as a period of thirty
or more consecutive days during which precipitation to the
amount of 0.25 inch does not occur in twenty-four hours.
Other quantitative definitions have been used in other
countries.
Dry Fog.—A haze due to the presence of dust or smoke in
the air.
Dust-counter.—An instrument for determining approximately
the number of dust particles or condensation nuclei per
unit volume in a sample of air.
Dynamic Meteorology.—The branch of meteorology that
treats of the motions of the atmosphere and their relations to
other meteorological phenomena.
Earth-air Current.—The electrical current that passes between
the earth and the air on account of their difference of
potential.
Eddy.—A more or less fully developed vortex in the atmosphere,
constituting a local irregularity in a wind. All winds
near the earth’s surface contain eddies, which at any given
place, produce “gusts” and “lulls.” Air containing numerous
eddies is said to be “turbulent.”
Electric Niagara.—(See hail rod.)
Evaporimeter.—(See atmometer.)
372
Eye of the Storm.—A calm region at the center of a tropical
cyclone, or a break in the clouds marking its location.
Fall Wind.—A wind blowing down a mountain-side; or any
wind having a strong downward component. Fall Winds include
the foehn, mistral, bora, etc.
False Cirrus.—Cirruslike clouds at the summit of a thundercloud;
probably identical in structure with true cirrus,
or cirro-stratus. Sometimes more appropriately called “thunderstorm
cirrus.”
Fata Morgana.—A complex form of mirage, characterized
by marked distortion of images.
Festoon Cloud.—Mammato-cumulus.
Flashing Arcs.—Visible atmospheric sound waves, or explosion
waves.
Flat.—Featureless; said of weather maps.
Foehn.—A dry fall wind warm for the season, characteristic
of many mountainous regions. The air is cooled
dynamically in ascending the mountains, but this leads to
condensation, which checks the fall in temperature through
the liberation of latent heat. The wind deposits its moisture
as rain or snow. In descending the opposite slope it is
strongly heated dynamically and arrives in the valleys beyond
as a warm and very dry wind. Some writers apply this term
to any wind that is dynamically heated by descent; e. g., the
sinking air of an anticyclone.
Foehn-sickness.—Headache, lassitude, depression, etc.,
attributed, in the Alpine valleys, to the blowing of the foehn.
Foehn-wall (German: Föhnmauer).—A wall of cloud that
forms along the crest of a mountain ridge over which the
foehn is blowing.
Fog.—A cloud at or near the earth’s surface. A fog and a
cloud are identical in structure, though the former is due to
thermal conditions of the earth’s surface, while the latter is
most frequently clue to the dynamic cooling of ascending air.
In ordinary speech, the term “fog” generally implies an
obscurity of the atmosphere sufficiently great to interfere
with navigation or locomotion. (Cf. dry fog.)
Fogbow.—A rainbow, colorless or nearly so, formed in a
fog.
Fog-drip.—Moisture that is deposited on terrestrial objects
by fog, and drips from them to the ground.
Fracto-cumulus; Fracto-nimbus; Fracto-stratus.—Forms
of cloud. (See Chapter VI.)
Freeze.—1. Freezing of plants without deposit of hoarfrost.
2. Freezing temperatures prevailing generally over a region;
not exclusively nocturnal and not confined to the air close to
the earth’s surface. (Cf. frost.)
373
Frost.—1. The act or state of freezing. In America, a
“frost” generally means the occurrence, near the beginning or
end of the growing season, of nocturnal temperatures low
enough to be injurious to vegetation; distinguished from a
“freeze,” which is more general and severe. The Weather
Bureau classifies frosts, according to their effects, as “light,”
“heavy,” and “killing.” 2. Atmospheric moisture condensed
upon terrestrial objects in the form of ice; sometimes frozen
dew. Also called hoarfrost.
Frost-smoke.—Frozen fog rising from the water.
Fulgurite.—A glassy tube formed in sandy soil or in rock
by the passage of lightning.
Garúa.—A wet fog of the west coast of South America.
Geocoronium.—The name applied by Dr. A. Wegener to
a hypothetical atmospheric gas, supposed to be much lighter
than any gas now known to chemists.
Glaze.—Term applied by the U. S. Weather Bureau to a
smooth coating of ice on terrestrial objects due to the freezing
of rain; often popularly called “sleet.” In Great Britain
such a deposit is called glazed frost. A deposit of glaze on
an extensive scale constitutes an “ice storm.”
Glory.—A series of concentric colored rings seen around
the shadow of the observer, or of his head only, cast upon a
cloud or fog bank. It is due to the diffraction of reflected light.
Gouffre.—(See brontide.)
Gradient.—Change of value of a meteorological element
per unit of distance. The gradients commonly discussed in
meteorology are the horizontal gradient of barometric pressure,
the vertical gradient of temperature, and the vertical
gradient of electric potential. British meteorologists now
prefer the term lapse-rate to vertical gradient.
Graupel.—A kind of granular snow, sometimes called soft
hail.
Green Flash.—A bright green coloration of the upper
edge of the sun’s disk, sometimes seen when the rest of the
disk is below the horizon, at sunrise or sunset.
Growing Season.—In agricultural meteorology, the interval
between the last killing frost in spring and the first killing
frost in autumn.
Gust.—A sudden brief increase in the force of the wind.
Most winds near the earth’s surface are made up of alternate
gusts and lulls, the majority of which are too brief to
be registered by an ordinary anemometer.
Hail.—Balls or irregular lumps of ice, often of considerable
size, having a complex structure; large hailstones generally
have a snowlike center, surrounded by layers of ice,
which may be alternately clear and cloudy. Hail falls al-374most
exclusively in connection with thunderstorms. For so-called
“soft hail” see graupel. (Cf. sleet.)
Hail Rod.—A device analogous to a lightning rod, supposed
to have the property of averting the fall of hail. Hail
rods have been especially popular in France, where they are
called paragrêles. Large hail rods of recent construction
are known as “electric Niagaras.”
Hail-shooting.—Bombarding the clouds to prevent
the fall of hail.
Halo.—A generic name for a large group of optical phenomena
caused by ice crystals in the atmosphere. The commonest
of these phenomena is the halo of 22 degrees (i. e.,
of 22 degrees radius) surrounding the sun or moon. The
halo of 46 degrees and the rare halo of 90 degrees, or halo
of Hevelius, also surround the luminary. Other forms of
halo are the tangent arcs, parhelia (or paraselenæ), parhelic
(or paraselenic) circle, anthelion, etc.
Harmattan.—A dry, dusty wind of the west coast of Africa,
blowing from the deserts.
Haze.—A lack of transparency in the atmosphere; sometimes
due to irregularities in the density of the air (optical
haze), sometimes to dust (dust haze, which when dense constitutes
dry fog), sometimes to fine particles of water or
ice (grading into true fog).
Helm and Bar.—A pair of clouds seen when the “helm
wind” is blowing over Crossfell, an English mountain; the
“helm” capping the mountain and the “bar” lying to leeward
of it.
High.—An area of high barometric pressure; an anticyclone.
Hoarfrost.—(See frost.)
Hole in the Air.—A colloquial name for any condition in
the atmosphere that suddenly decreases the lift of an aeroplane.
(Cf. bump.)
Horse Latitudes.—The regions of calms and variable winds
coinciding with the subtropical high-pressure belts lying
on the poleward sides of the trade winds. (The term has
generally been applied only to the northern of these two
regions, in the North Atlantic Ocean, or to the portion of it
near Bermuda.)
Hot Wave.—A period of abnormally high temperatures.
It has sometimes been defined, in the United States, as a
period of three or more consecutive days during each of
which the maximum temperature is 90 degrees F. or over.
Hot Wind.—A hot, parching wind characteristic of certain
continental interiors; especially Australia, northern India
and the prairie region of the United States.
375
Humidity.—The degree to which the air is charged with
water vapor; viz., the actual amount of water vapor present
(absolute humidity, which may be expressed in terms
of weight per unit volume or as vapor pressure), or the
ratio which this amount bears to the maximum amount the
air can contain at the prevailing temperature (relative
humidity, expressed in percentage).
Hurricane.—A tropical cyclone; especially one of the West
Indies region. (A cyclone originating in this region and
passing northward into the temperate zone is still called a
“West India hurricane,” even after it has assumed the character
of an extratropical cyclone, and, if sufficiently severe,
justifies the display of “hurricane warnings” at ports of the
United States. “Hurricane” is also the designation of the
highest wind force on the Beaufort scale, and is thus applied
to any wind exceeding about seventy-five miles an hour.)
Hygrograph.—A self-registering hygrometer.
Hygrometer.—Any instrument for measuring the humidity
of the air.
Hygroscope.—A device that gives a rough indication of the
relative humidity of the air. Most hygroscopes are mere toys.
Ice Rain.—1. A rain that causes a deposit of glaze.
2. Falling pellets of clear ice (called sleet by the U. S.
Weather Bureau).
Ice Saints.—A period of cold weather popularly reputed in
Europe to occur yearly about May 11–13 (or, in south-central
Europe, May 12–14); also, the saints whose days in the ecclesiastical
calendar fall on these dates.
Ice Storm.—(See glaze.)
Ignis Fatuus.—Will-o’-the-wisp. (See Chapter XXII.)
Indian Summer.—A period of mild, calm, hazy weather
occurring in autumn or early winter, especially in the United
States and Canada; popularly regarded as a definite event in
the calendar, but weather of this type is really of irregular
and intermittent occurrence. (Cf. St. Martin’s Summer.)
Instrument-shelter.—The American name of the cage or
screen in which thermometers are exposed at meteorological
stations. Called thermometer-screen in Great Britain.
Inversion.—More fully temperature inversion; an increase
of air temperature with increase of altitude, instead of the
normal decrease.
Ion-counter.—An instrument for determining the number
of ions present, per unit volume, in a sample of air.
Isobar.—A line of equal barometric pressure. (Isobars
are generally drawn on maps to show the horizontal distribution
of pressure reduced to sea level, or the pressure
at some specified altitude; but in a broader sense any line376
on a chart or diagram drawn through places of equal pressure
is an isobar.)
Isohyet.—A line of equal rainfall.
Isotherm.—A line of equal temperature.
Isothermal Layer.—(See stratosphere.)
January Thaw.—A period of mild weather popularly supposed
to recur each January, especially in New England.
Katathermometer.—A device consisting of a dry-bulb and
a wet-bulb thermometer, designed for measuring the cooling
power of the atmosphere, with reference to its physiological
effects. It was invented by Leonard Hill.
Kiosk.—The name given by the U. S. Weather Bureau
to a small street pavilion in which are displayed meteorological
instruments, maps, tables, etc.
Land and Sea Breezes. Land and Lake Breezes.—The
breezes that, on certain coasts and under certain conditions,
blow from the land by night and from the water by day.
Lenticular Cloud.—A cloud having approximately the
form of a double-convex lens, marking the position of a
standing wave in the atmosphere. (See Chapter VI.)
Lightning.—A disruptive electrical discharge in the atmosphere,
or, generally, the luminous phenomena attending
such a discharge. The various forms of lightning are named
and described in Chapter IX.
Lightning Print.—A collection of marks, often treelike in
form, sometimes found on the body of a person or animal
that has been struck by lightning.
Lightning Rod.—A metallic rod, connected with a suitable
“ground,” in earth or water, set up for the purpose of protecting
some structure from lightning.
Light-pillar.—A form of halo, consisting of a column of light,
vertical or nearly so, extending from or through the sun or
moon. Called a sun-pillar, or a moon-pillar, as the case may be.
Line-squall.—A more or less continuous line of squalls
and thunderstorms traveling broadside over the country.
Looming.—An apparent elevation of distant objects by mirage.
Low.—An area of low barometric pressure, with its attendant
system of winds. Also called a barometric depression
or cyclone.
Mackerel Sky.—An area of sky covered with cirro-cumulus
clouds; especially when the clouds resemble the patterns
seen on the backs of mackerel.
Mammato-cumulus.—A form of cloud showing pendulous
sacklike protuberances. (See Chapter VI.)
March.—The variation of a meteorological element in the
course of a day, year, or other interval of time; e. g., the377
diurnal march of temperature; the annual march of barometric
pressure.
Mares’-tails.—Cirrus in long slender streaks.
Marine Climate.—A type of climate characteristic of the
ocean and oceanic islands. Its most prominent feature is
equability of temperature.
Meteorograph.—Autographic apparatus for recording
simultaneously two or more meteorological elements. Certain
types of meteorograph are connected, electrically or otherwise,
with some of the instruments at meteorological stations;
others are sent aloft attached to kites and balloons.
Meteorology.—The science of the atmosphere.
Millibar.—(See bar.)
Mirage.—An apparent displacement or distortion of distant
objects by abnormal atmospheric refraction. Sometimes
the images of objects are inverted, multiplied, etc.
Mist.—Generally, a wet fog or a very fine drizzle of rain;
hence the expression, “it is misting.” The “Scotch mist” of
mountainous or hilly regions is a combination of thick fog
and heavy drizzle; it has been suggested that this occurs
when the rain clouds actually rest on the earth.
Mistpoeffer.—(See brontide.)
Mistral.—Along the Mediterranean coast, from the mouth
of the Ebro to the Gulf of Genoa, a stormy, cold northerly
wind, blowing down from the mountains of the interior.
(The name is sometimes applied to northerly winds on the
Adriatic, in Greece, and in Algeria.)
Monsoon.—A wind that reverses its direction with the
season, blowing more or less steadily from the interior of a
continent toward the sea in winter, and in the opposite direction
in the summer.
Moon Dog.—A paraselene.
Mountain and Valley Breezes.—The breezes that, in
mountainous regions, normally blow up the slopes by day
(valley breeze) and down the slopes by night (mountain
breeze).
Nephoscope.—An instrument for measuring the movements
of clouds.
Nieve Penitente.—Fields of pinnacled snow found on certain
high mountains in tropical or subtropical regions.
Nimbus.—The rain cloud. (See Chapter VI.)
Noctilucent Clouds.—Luminous, cirruslike clouds sometimes
visible throughout the short nights of summer; supposed
to be clouds of dust at great altitudes shining with reflected
sunlight. Such clouds were observed during several
summers after the eruption of Krakatoa (1883) and are still
occasionally reported.
378
Normal.—The average value which, in the course of years,
any meteorological element is found to have on a specified
date or during a specified month or other portion of the year,
or during the year as a whole. Also used as an adjective in
such expressions as “normal temperature,” etc. Thus, for
any station at which records have been maintained for many
years, we may compute the normal temperature of January 1,
the normal pressure of February, the normal rainfall of the
year, etc. The normal serves as a standard with which values
occurring in a particular year may be compared in order to
determine the departure from the normal.
Nucleus.—A particle upon which condensation of water
vapor occurs in the free atmosphere in the form of a water
drop or an ice crystal.
Oblique Arcs of the Anthelion.—A rare form of halo, consisting
of intersecting arcs, usually white, passing through the anthelion
or the place where the anthelion would occur if visible.
Ozone.—An allotropic form of oxygen, which occurs transiently
in small quantities in the lower atmosphere, and is
supposed to be permanently present and relatively abundant
at high atmospheric levels.
Painter.—A dirty fog frequently experienced on the coast
of Peru. The brownish deposit from it is sometimes called
“Peruvian paint.”
Paragrêle.—A hail rod.
Paranthelion.—A halo phenomenon similar to a parhelion,
but occurring at a distance of 90 degrees or more in azimuth
from the sun. The solar distance of the ordinary paranthelia
is 120 degrees. (Analogous phenomena produced by the moon
as source of light are called parantiselenæ.)
Paraselene.—(Plu. paraselenæ.) (See parhelion.)
Paraselenic Circle.—(See parhelic circle.)
Parasitic Clouds.—The name formerly given to clouds capping
the summits of mountains.
Parhelic Circle.—A halo consisting of a white circle passing
through the sun and parallel to the horizon. A similar phenomenon
in connection with the moon is called a paraselenic
circle.
Parhelion.—A mock sun, or sun dog; a form of halo consisting
of a more or less distinctly colored image of the sun
at the same altitude as the latter above the horizon, and
hence lying on the parhelic circle, if present. The ordinary
parhelia are 22 degrees from the sun in azimuth, or a little
more, according to the altitude of the luminary. Parhelia
have occasionally been seen about 46 degrees from the sun.
Analogous phenomena seen in connection with the moon are
called paraselenæ, mock moons, or moon dogs.
379
Penetrating Radiation.—A form of radiation that has the
property of passing through a great extent of air without
being absorbed and of ionizing the air inside hermetically
sealed metal vessels. It is supposed to consist of a special
kind of Gamma rays and to come from the higher levels of
the atmosphere.
Phenology.—The study of the periodic phenomena of animal
and plant life and their relations to weather and climate.
Photochemical Climate.—The chemical activity of sunlight
characteristic of any place or region. The variations of this
feature of solar radiation are more or less strikingly different
from those of solar heat and the brightness of solar light.
Certain types of “chemical actinometer” are used in its
measurement.
Pilot Balloon.—A small free balloon the drift of which, as
observed from the ground, indicates the movements of the
air aloft.
Pocky Cloud.—Mammato-cumulus.
Pogonip.—A fog, composed of fine needles of ice, which
occurs in mountainous regions of the western United States
and is reputed to be very injurious to the lungs.
Pollution Gauge.—A gauge for measuring soot and other
impurities found in the atmosphere.
Pontias.—A wind that blows by night from a narrow valley
at Nyons, France.
Potential Gradient.—(See gradient.)
Precipitation.—The collective name for deposits of atmospheric
moisture in liquid and solid form, including rain, snow,
hail, dew, hoarfrost, etc.
Pressure.—An elliptical expression, current in meteorological
literature, for atmospheric pressure, or barometric
pressure.
Prevailing Westerlies.—The belts of winds lying on the
poleward sides of the subtropical high-pressure belts.
Psuchrainometer.—An instrument devised by J. R. Milne
for measuring the cooling power of the atmosphere with reference
to physiological effects.
Psychrometer.—An instrument for measuring atmospheric
humidity, consisting usually of a dry-bulb thermometer and
a wet-bulb thermometer. The former is an ordinary mercurial
thermometer. The latter has its bulb covered with
muslin or other fabric, which is either permanently wet or is
wetted before use. In some psychrometers there is only one
thermometer, readings being taken both before and after
moistening the bulb.
Purple Light.—The purple or rosy glow observed over a
large area of the western sky after sunset and the eastern380
sky before sunrise; it lies above the bright segment that
borders the horizon.
Pyrheliometer.—An instrument that measures solar radiation
by its heating effects.
Qobar.—A dry fog or heat haze of the upper Nile region.
(Also spelled kobar and gobar and occasionally applied to a
hazy condition of the atmosphere in other parts of the world.)
Rain Balls.—Mammato-cumulus.
Rainbow.—A luminous arc formed by the refraction and
reflection of light in drops of water. (See Chapter X.)
Rainfall.—A term sometimes synonymous with rain, but
most frequently used in reference to amounts of precipitation
(including snow, hail, etc.).
Rain Gauge.—An instrument for measuring rainfall.
Rain Tree.—A mythical tree which is alleged to exude
copious showers of water even in the driest weather. (“Rain
tree” is also the common name of an ornamental tree
variously known to botanists as Albizzia saman, Pithecolobium
saman, Enterolobium saman, and Samanea saman.)
Recoloration.—(See afterglow.)
Recurrence.—The alleged tendency of any particular type
of weather to occur at about the same period every year, independently
of and generally in contrast to the regular march
of the seasons.
Refraction.—Astronomical refraction. Change in the apparent
position of a heavenly body, due to atmospheric
refraction. Terrestrial refraction. Change in the apparent
position of distant terrestrial objects, due to the same
cause.
Relative Wind.—In aeronautics, the motion of the air with
reference to an aeroplane or airship moving through it.
Réseau.—A collection of meteorological stations operating
under a common direction, or in the same territory. An
international réseau is a group of stations in different countries
cooperating for any purpose. The Réseau mondial is a
world-wide system of selected stations, the observations of
which may be utilized in studies of the meteorology of the
globe.
Rime.—1. Hoarfrost. 2. A rough or feathery coating of ice
deposited on terrestrial objects by fog. (The second meaning
is the one now used in technical literature.)
Roaring Forties.—(See brave west winds.)
Saddle.—(See col.)
Saint Elmo’s Fire.—A luminous brush discharge of electricity
from elevated objects, such as the masts and yardarms
of ships, lightning rods, steeples, etc., occurring in stormy
weather. Also called corposant.
381
St. Martin’s Summer.—One of several names given in
Europe to a mild period in autumn, corresponding approximately
to the Indian summer of North America.
Scarf Cloud.—A thin cirruslike cloud which often drapes
the summits of tall cumulo-nimbus clouds.
Scotch Mist.—(See mist.)
Scud.—Shreds or small detached masses of cloud moving
rapidly below a rain cloud or other heavy clouds.
Sea Breeze.—(See land and sea breezes.)
Secondary.—A small cyclone developed, or tending to
develop, on the border of a large one.
Sensible Temperature.—The temperature felt at the surface
of the human body; formerly identified, by some authorities,
with the temperature indicated by the wet-bulb thermometer.
Silence, Areas, Zones, or Regions of.—Regions within which
a sound is not heard, though heard in regions more distant
from the source.
Silver Thaw.—A term variously applied to rime, glaze, and
a thin coating of ice deposited on cold objects by a damp wind.
Simoom.—An intensely hot and dry wind of Asian and
African deserts; often described as a sand storm or dust
storm, but certain authorities state that the typical simoom
is free from sand or dust.
Sirocco.—A name applied to various types of warm wind
in the Mediterranean region. Some of these siroccos are
foehns. The term is also used as the generic name for winds
blowing from a warm region toward an area of low pressure
in a normally colder region.
Sleet.—1. Frozen or partly frozen rain; frozen raindrops
in the form of particles of clear ice. 2. Snow and rain
falling together. (Other definitions have been proposed and
the proper technical application of this term is still a
subject of controversy. In popular and engineering use the
word is often applied to a coating of glaze on trees, wires,
rails, etc.)
Snow Bin.—A large receptacle for collecting the snowfall
of an entire winter, or other long period, for measurement at
one time.
Snow Garland.—An elongated mass of snow suspended at
the ends and sagging in the middle.
Snow Mushroom.—An overhanging cap of snow resting on
a tree stump, post, or the like.
Snow Roller.—A mass of snow rolled by the wind; generally
muff-shaped.
Snow Sampler.—A device for collecting a sample of snow,
cut vertically through a snowfield, for the purpose of determining
the depth and density of the snow.
382
Snow Survey.—A measurement of the total amount of snow
lying over a particular area, especially with a view to determining
the total amount of water it will yield, when melted,
for purposes of irrigation, etc.
Soft Hail.—Graupel.
Sounding Balloon.—A free, unmanned balloon carrying a
set of self-registering meteorological instruments.
Specter of the Brocken.—The shadow of an observer and of
objects in his immediate vicinity cast upon a cloud or fog
bank; sometimes attended by a series of colored rings, called
the glory or Brocken-bow.
Squall.—1. A sudden storm of brief duration; closely akin
to a thunderstorm but not necessarily attended by thunder
and lightning. 2. A sudden brief blast of wind, of longer
duration than a gust.
Squaw Winter.—In North America, a brief cold spell popularly
reputed to precede Indian summer.
Static.—(See stray.)
Storm Card.—A device intended for use on shipboard in
determining the direction of a storm center from the ship.
Storm Water.—The water resulting from a heavy and rapid
fall of rain; especially the portion that occurs as run-off.
(The term has been used mainly in connection with the subject
of sewers.)
Strato-cumulus.—A form of cloud. (See Chapter VI.)
Stratosphere.—The upper region of the atmosphere, formerly
called the isothermal layer, in which there is no marked
or systematic decrease of temperature with altitude. The
stratosphere is free from clouds (except occasional dust
clouds) and from strong vertical air currents, and its circulation
appears to be more or less independent of that of the
lower atmosphere. The height of its base, which varies with
latitude and otherwise, averages between 6 and 7 miles. (Cf.
troposphere.)
Stray.—A natural electromagnetic wave in the ether. The
term is used in reference to the effects of such waves in producing
erratic signals in radiotelegraphic receivers. Strays
are known collectively as static.
Summer Day.—A day in which the temperature reaches or
exceeds 77 degrees F.
Sun Dog.—A mock sun or parhelion.
“Sun Drawing Water.”—The sun popularly said to be
“drawing water” when crepuscular rays extend down from
it toward the horizon.
Sunshine Recorder.—An instrument for recording the
duration of sunshine; certain types also record the intensity
of sunshine.
383
Synchronous Chart.—A form of synoptic chart, such as the
ordinary weather map, which shows the meteorological conditions
prevailing over any area at a given moment of time.
Synoptic Chart.—A chart showing the distribution of
meteorological conditions over an area at a given moment or
the average conditions during a given period of time, such
as a month or a year.
Table-cloth.—A sheet of cloud that sometimes spreads over
the flat top of Table Mountain, near Cape Town.
Tangent Arc.—Any halo that occurs as an arc tangent to
one of the heliocentric halos.
Term Hours.—Prescribed hours for taking meteorological
observations.
Thermal Belt.—A well-defined zone, found on some mountain-sides,
in which vegetation is particularly exempt from
frosts in spring and autumn. Also called verdant zone.
Thermograph.—A self-registering thermometer.
Thermometer.—An instrument for measuring temperature;
in meteorology, generally the temperature of the air.
Maximum and minimum thermometers indicate, respectively,
the highest and lowest temperatures occurring between the
times of setting the instruments. A wet-bulb thermometer is
used in measuring humidity. (See psychrometer.)
Thermometer Screen.—A cage, or sometimes merely a roof,
for protecting thermometers from direct sunshine and other
radiation that would cause the readings to indicate a temperature
different from that of the air. In the United States
generally called an instrument shelter.
Thunder.—The sound produced by a lightning discharge.
Thunderstorm.—A storm attended by thunder and lightning.
Thunderstorms are local disturbances, often occurring as
episodes of cyclones, and, in common with squalls, are marked
by abrupt variations in pressure, temperature, and wind.
Thunderstorm Recorder.—Any device that furnishes a record
of thunderstorms, either near or distant. Most thunderstorm
recorders register, by radiotelegraphy, the strays set
up by lightning discharges.
Tornado.—1. A violent vortex in the atmosphere, usually
attended by a pendulous, more or less funnel-shaped cloud.
2. In West Africa: A violent thundersquall.
Totalizer.—A form of snow gauge used chiefly in the Alps,
designed to be read only once a year. (French, totalisateur.)
Trade Winds.—Two belts of winds, one on either side of the
equatorial doldrums, in which the winds blow almost constantly
from easterly quadrants.
Troposphere.—The part of the atmosphere lying below the
stratosphere.
384
Trough.—1. A line drawn at right angles to the path of a
cyclonic area through all points at which the pressure has
reached a minimum and is about to rise. 2. An elongated
area of low barometric pressure.
Twilight.—Astronomical twilight is the interval between sunrise
or sunset and the total darkness of night. Civil twilight is
the period of time before sunrise and after sunset during which
there is enough daylight for ordinary outdoor occupations.
“Twister.”—A tornado; also, a small whirling dust storm.
Typhoon.—The name applied in the Far East to a tropical
cyclone.
Ulloa’s Ring.—1. A glory. 2. A halo (also called Bouguer’s
halo) surrounding a point in the sky diametrically opposite
the sun; sometimes described as a “white rainbow.”
Vane.—A device that shows which way the wind blows;
also called weather vane or wind vane.
Variability.—Interdiurnal variability is the mean difference
between successive daily means of a meteorological element.
Verdant Zone.—(See thermal belt.)
Visibility.—The transparency and illumination of the
atmosphere as affecting the distance at which objects can be
seen. It is often expressed on a numerical scale. (This term
was formerly applied by British meteorologists to a state of
unusual clearness of the atmosphere, regarded as a weather
prognostic.)
V-shaped Depression.—A trough of low barometric pressure
bounded on the weather map by V-shaped isobars.
Waterspout.—A tornadolike vortex and cloud occurring
over a body of water.
Weather Well.—(See blowing well.)
Wedge.—A wedge-shaped area of high barometric pressure.
Wet-bulb thermometer.—(See psychrometer.)
Wind.—Moving air; especially a mass of air having a common
direction of motion. The term is generally limited to air
moving horizontally, or nearly so; vertical streams of air are
usually called “currents.”
Wind Aloft.—The wind blowing at high levels as distinguished
from that near the earth’s surface.
Wind Rose.—1. A diagram showing the relative frequency
and sometimes also the average strength of the winds blowing
from different directions in a specified region. 2. A diagram
showing the average relation between winds from different
directions and the occurrence of other meteorological phenomena.
Winter Day.—A day on which the temperature does not at
any time rise above the freezing point.
Wool-pack Cloud.—Cumulus.
Transcribers’ Notes
Punctuation, hyphenation, and spelling were made consistent when a predominant
preference was found in this book; otherwise they were not changed.
Simple typographical errors were corrected; occasional unbalanced
quotation marks retained.
Ambiguous hyphens at the ends of lines were retained.
In versions of this book that do not support accented letters,
“Canon” (with a tilde over the middle “n”) is spelled “Canyon”.
Page 103: For consistency with the preceding enumerated definitions,
the Transcriber added extra spacing after the last of them, just before
“We have given”.
Page 348: In some versions of this eBook, the chemical symbols for
methane and phosphine are represented as CH4 and PH3.
Page 367: “The scale runs from 0 = calm to = hurricane” is missing the
value for hurricane, which is “12”.
*** END OF THE PROJECT GUTENBERG EBOOK 47059 ***


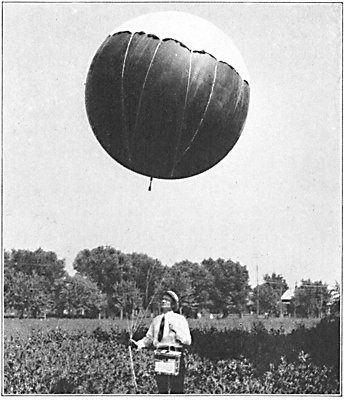
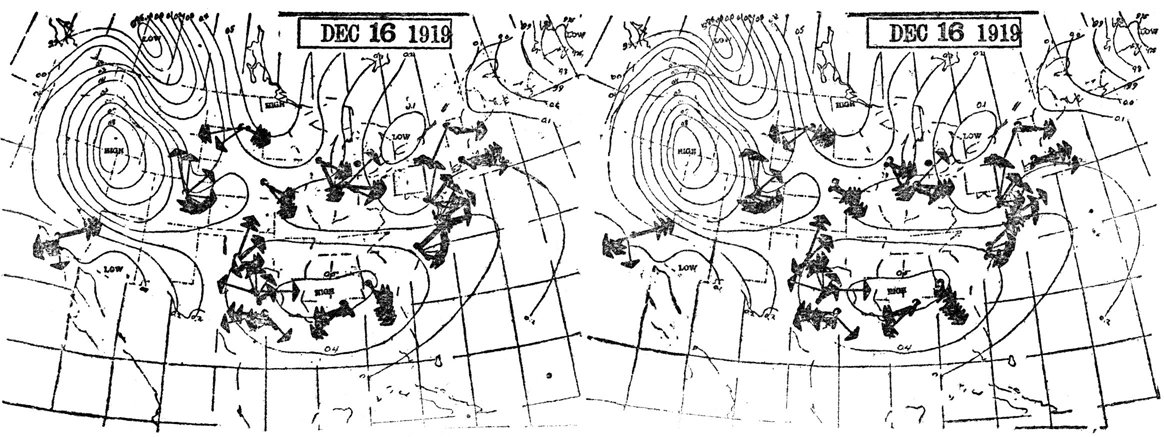