 Fig. 1.
This eBook is for the use of anyone anywhere at no cost and with
almost no restrictions whatsoever.  You may copy it, give it away or
re-use it under the terms of the Project Gutenberg License included
with this eBook or online at www.gutenberg.org
Title: The Phase Rule and Its Applications
Author: Alexander Findlay
Release Date: November 27, 2010 [eBook #34457]
Language: English
Character set encoding: ISO-8859-1
***START OF THE PROJECT GUTENBERG EBOOK THE PHASE RULE AND ITS APPLICATIONS***
| Transcriber's note: |
A few typographical errors have been corrected. They
appear in the text like this, and the
explanation will appear when the mouse pointer is moved over the marked
passage. |
Edited by SIR WILLIAM RAMSAY, K.C.B., F.R.S., D.Sc.
STOICHIOMETRY. By Sydney Young, D.Sc., F.R.S., Professor of Chemistry in the University of Dublin; together with an INTRODUCTION TO THE STUDY OF PHYSICAL CHEMISTRY by Sir William Ramsay, K.C.B., F.R.S., Editor of the Series. Crown 8vo. 7s. 6d.
AN INTRODUCTION TO THE STUDY OF PHYSICAL CHEMISTRY. Being a General Introduction to the Series by Sir William Ramsay, K.C.B., F.R.S., D.Sc. Crown 8vo. 1s. net.
CHEMICAL STATICS AND DYNAMICS, including The Theories of Chemical Change, Catalysis and Explosions. BY J. W. Mellor, D.Sc. (N.Z.), B.Sc. (Vict.) Crown 8vo. 7s. 6d.
THE PHASE RULE AND ITS APPLICATIONS. By Alex. Findlay, M.A., Ph.D., D.Sc., Lecturer and Demonstrator in Chemistry, University of Birmingham. With 134 Figures in the Text. Crown 8vo. 5s.
SPECTROSCOPY. By E. C. C. Baly, F.I.C., Lecturer on Spectroscopy and Assistant Professor of Chemistry, University College, London. With 163 Illustrations. Crown 8vo. 10s. 6d.
THERMOCHEMISTRY. By Julius Thomsen, Emeritus Professor of Chemistry in the University of Copenhagen. Translated by Katharine A. Burke, B.Sc. (Lond.), Assistant in the Department of Chemistry, University College, London. Crown 8vo. 9s.
ELECTRO-CHEMISTRY. Part I.—General Theory. By R. A. Lehfeldt, D.Sc., Professor of Physics at the East London Technical College. Including a Chapter on the Relation of Chemical Constitution to Conductivity, by T. S. Moore, B.A., B.Sc., Lecturer in the University of Birmingham. Crown 8vo. 5s.
Part II.—Applications to Electrolysis, Primary and Secondary Batteries, etc. By N. T. M. Wilsmore, D.Sc.
STEREOCHEMISTRY. By A. W. Stewart, D.Sc., Carnegie Research Fellow, Lecturer on Stereochemistry in University College, London. With 87 Illustrations. Crown 8vo. 10s. 6d.
RELATIONS BETWEEN CHEMICAL CONSTITUTION AND PHYSICAL PROPERTIES. By Samuel Smiles, D.Sc.
THERMODYNAMICS. By F. G. Donnan, M.A., Ph.D.
ACTINOCHEMISTRY. By C. E. K. Mees, D.Sc., and S. E. Sheppard, D.Sc.
PRACTICAL SPECTROGRAPHIC ANALYSIS. By J. H. Pollok, D.Sc.
LONGMANS, GREEN, AND CO.
39 PATERNOSTER ROW, LONDON
NEW YORK, BOMBAY, AND CALCUTTA
BY
LECTURER ON PHYSICAL CHEMISTRY, UNIVERSITY OF BIRMINGHAM
THIRD IMPRESSION
39 PATERNOSTER ROW, LONDON
NEW YORK, BOMBAY, AND CALCUTTA
1908
All rights reserved
DEDICATED
TO
PROFESSOR OF CHEMISTRY, UNIVERSITY OF ABERDEEN,
IN GRATITUDE FOR EARLY TRAINING
AND ADVICE
During the two years which have elapsed since the first edition of this book appeared, the study of chemical equilibria has been prosecuted with considerable activity, and valuable additions have been made to our knowledge in several departments of this subject. In view of the scope of the present work, it has been, of course, impossible to incorporate all that has been done; but several new sections have been inserted, notably those on the study of basic salts; the interpretation of cooling curves, and the determination of the composition of solid phases without analysis; the equilibria between iron, carbon monoxide, and carbon dioxide, which are of importance in connection with the processes occurring in the blast furnace; and the Phase Rule study of the ammonia-soda process. I have also incorporated a short section on the reciprocal salt-pair barium carbonate—potassium sulphate, which had been written for the German edition of this book by the late Professor W. Meyerhoffer. The section on the iron-carbon alloys, which in the first edition was somewhat unsatisfactory, has been rewritten.
September, 1906.
Although we are indebted to the late Professor Willard Gibbs for the first enunciation of the Phase Rule, it was not till 1887 that its practical applicability to the study of Chemical Equilibria was made apparent. In that year Roozeboom disclosed the great generalization, which for upwards of ten years had remained hidden and unknown save to a very few, by stripping from it the garb of abstract Mathematics in which it had been clothed by its first discoverer. The Phase Rule was thus made generally accessible; and its adoption by Roozeboom as the basis of classification of the different cases of chemical equilibrium then known established its value, not only as a means of co-ordinating the large number of isolated cases of equilibrium and of giving a deeper insight into the relationships existing between the different systems, but also as a guide in the investigation of unknown systems.
While the revelation of the principle embedded in the Phase Rule is primarily due to Roozeboom, it should not be forgotten that, some years previously, van't Hoff, in ignorance of the work of Willard Gibbs, had enunciated his "law of the incompatibility of condensed systems," which in some respects coincides with the Phase Rule; and it is only owing to the more general applicability of the latter that the very {ix}important generalization of van't Hoff has been somewhat lost sight of.
The exposition of the Phase Rule and its applications given in the following pages has been made entirely non-mathematical, the desire having been to explain as clearly as possible the principles underlying the Phase Rule, and to illustrate their application to the classification and investigation of equilibria, by means of a number of cases actually studied. While it has been sought to make the treatment sufficiently elementary to be understood by the student just commencing the study of chemical equilibria, an attempt has been made to advance his knowledge to such a stage as to enable him to study with profit the larger works on the subject, and to follow with intelligence the course of investigation in this department of Physical Chemistry. It is also hoped that the volume may be of use, not only to the student of Physical Chemistry, or of the other branches of that science, but also to the student of Metallurgy and of Geology, for whom an acquaintance with at least the principles of the Phase Rule is becoming increasingly important.
In writing the following account of the Phase Rule, it is scarcely necessary to say that I have been greatly indebted to the larger works on Chemical Equilibria by Ostwald ("Lehrbuch"), Roozeboom ("Die Heterogenen Gleichgewichte"), and Bancroft ("The Phase Rule"); and in the case of the first-named, to the inspiration also of personal teaching. My indebtedness to these and other authors I have indicated in the following pages.
In conclusion, I would express my thanks to Sir William Ramsay, whose guidance and counsel have been constantly {x}at my disposal; and to my colleagues, Dr. T. Slater Price and Dr. A. McKenzie, for their friendly criticism and advice. To Messrs. J. N. Friend, M.Sc., and W. E. S. Turner, B.Sc., I am also indebted for their assistance in reading the proof-sheets.
November, 1903.
| PAGE | |
| CHAPTER I | |
| Introduction | 1 |
| General, I. Homogeneous and heterogeneous equilibrium, 5. Real and apparent equilibrium, 5. | |
| CHAPTER II | |
| The Phase Rule | 7 |
| Phases, 8. Components, 10. Degree of freedom. Variability of a system, 14. The Phase Rule, 16. Classification of systems according to the Phase Rule, 17. Deduction of the Phase Rule, 18. | |
| CHAPTER III | |
| Typical Systems of One Component | 21 |
| A. Water. Equilibrium between liquid and vapour. Vaporization curve, 21. Upper limit of vaporization curve, 23. Sublimation curve of ice, 24. Equilibrium between ice and water. Curve of fusion, 25. Equilibrium between ice, water, and vapour. The triple point, 27. Bivariant systems of water, 29. Supercooled water. Metastable state, 30. Other systems of the substance water, 32. B. Sulphur, 33. Polymorphism, 33. Sulphur, 34. Triple point—Rhombic and monoclinic sulphur and vapour. Transition point, 34. Condensed systems, 36. Suspended transformation, 37. Transition curve—Rhombic and monoclinic sulphur, 37. Triple point—Monoclinic sulphur, liquid, and vapour. Melting point of monoclinic sulphur, 38. Triple point—Rhombic and monoclinic sulphur and liquid, 38. Triple point—Rhombic sulphur, liquid, and vapour. Metastable triple point, 38. Fusion curve of rhombic sulphur, 39. Bivariant systems, 39. C. Tin, 41. Transition point, 41. {xii} Enantiotropy and monotropy, 44. D. Phosphorus, 46. Enantiotropy combined with monotropy, 51. E. Liquid Crystals, 51. Phenomena observed, 51. Nature of liquid crystals, 52. Equilibrium relations in the case of liquid crystals, 53. | |
| CHAPTER IV | |
| General Summary | 55 |
| Triple point, 55. Theorems of van't Hoff and of Le Chatelier, 57. Changes at the triple point, 58. Triple point solid—solid—vapour, 62. Sublimation and vaporization curves, 63. Fusion curve—Transition curve, 66. Suspended transformation. Metastable equilibria, 69. Velocity of transformation, 70. Law of successive reactions, 73. | |
| CHAPTER V | |
| Systems of Two Components—Phenomena of Dissociation | 76 |
| Different systems of two components, 77. Phenomena of Dissociation. Bivariant systems, 79. Univariant systems, 80. Ammonia compounds of metal chlorides, 82. Salts with water of crystallization, 85. Efflorescence, 86. Indefiniteness of the vapour pressure of a hydrate, 87. Suspended transformation, 89. Range of existence of hydrates, 90. Constancy of vapour pressure and the formation of compounds, 90. Measurement of the vapour pressure of hydrates, 91. | |
| CHAPTER VI | |
| Solutions | 92 |
| Definition, 92. Solutions of Gases in Liquids, 93. Solutions of Liquids in Liquids, 95. Partial or limited miscibility, 96. Phenol and water, 97. Methylethylketone and water, 100. Triethylamine and water, 101. General form of concentration-temperature curve, 101. Pressure-concentration diagram, 102. Complete miscibility, 104. Pressure-concentration diagram, 104. | |
| CHAPTER VII | |
| Solutions of Solids in Liquids, only One of the Components being Volatile | 106 |
| General, 106. The saturated solution, 108. Form of the solubility curve, 108. A. Anhydrous Salt and Water. {xiii} The solubility curve, 111. Suspended transformation and supersaturation, 113. Solubility curve at higher temperatures, 114. (1) Complete miscibility of the fused components. Ice as solid phase, 116. Cryohydrates, 117. Changes at the quadruple point, 119. Freezing mixtures, 120. (2) Partial miscibility of the fused components. Supersaturation, 124. Pressure-temperature diagram, 126. Vapour pressure of solid—solution—vapour, 126. Other univariant systems, 127. Bivariant systems, 129. Deliquescence, 130. Separation of salt on evaporation, 130. General summary, 131. | |
| CHAPTER VIII | |
| Solutions of Solids in Liquids, only One of the Components being Volatile | 133 |
| B. Hydrated Salt and Water, (1) The compounds formed do not have a definite melting point. Concentration-temperature diagram, 133. Sodium sulphate and water, 134. Suspended transformation, 137. Dehydration by means of anhydrous sodium sulphate, 138. Pressure-temperature diagram, 138. (2) The compounds formed have a definite melting point. Solubility curve of calcium chloride hexahydrate, 145. Pressure-temperature diagram, 149. The indifferent point, 150. The hydrates of ferric chloride, 151. Suspended transformation, 155. Evaporation of solutions at constant temperature, 155. Inevaporable solutions, 157. Illustration, 158. | |
| CHAPTER IX | |
| Equilibria between Two Volatile Components | 161 |
| General, 161. Iodine and chlorine, 161. Concentration-temperature diagram, 162. Pressure-temperature diagram, 165. Bivariant systems, 167. Sulphur dioxide and water, 169. Pressure-temperature diagram, 170. Bivariant systems, 173. | |
| CHAPTER X | |
| Solid Solutions. Mixed Crystals | 175 |
| General, 175. Solution of gases in solids, 176. Palladium and hydrogen, 178. Solutions of solids in solids. Mixed crystals, 180. Formation of mixed crystals of isomorphous substances, 182. I. The two components can form an unbroken series of mixed crystals. (a) The freezing points of all mixtures lie between the freezing points of the pure components. Examples, 183. Melting-point curve, 183. (b) The freezing-point curve passes through a maximum. Example, 186. (c) The freezing-point curve passes through a minimum. Example, 188. Fractional {xiv} crystallization of mixed crystals, 188. II. The two components do not form a continuous series of mixed crystals. (a) The freezing-point curve exhibits a transition point, 190. Example, 190. (b) The freezing-point curve exhibits a eutectic point, 191. Examples, 192. Changes in mixed crystals with the temperature, 192. | |
| CHAPTER XI | |
| Equilibrium between Dynamic Isomerides | 195 |
| Temperature-concentration diagram, 196. Transformation of the unstable into the stable form, 201. Examples, 203. Benzaldoximes, 203. Acetaldehyde and paraldehyde, 204. | |
| CHAPTER XII | |
| Summary.—Application of the Phase Rule to the Study of Systems of Two Components | 207 |
| Summary of the different systems of two components, 208. (1) Organic compounds, 212. (2) Optically active substances, 213. Examples, 216. Transformations, 217. (3) Alloys, 220. Iron—carbon alloys, 223. Determination of the composition of compounds without analysis, 228. Formation of minerals, 232. | |
| CHAPTER XIII | |
| Systems of Three Components | 234 |
| General, 234. Graphic representation, 235. | |
| CHAPTER XIV | |
| Solutions of Liquids in Liquids | 240 |
| 1. The three components form only one pair of partially miscible liquids, 240. Retrograde solubility, 245. The influence of temperature, 247. 2. The three components can form two pairs of partially miscible liquids, 249. 3. The three components form three pairs of partially miscible liquids, 251. | |
| CHAPTER XV | |
| Presence of Solid Phases | 253 |
| A. The ternary eutectic point, 253. Formation of compounds, 255. B. Equilibria at higher temperatures. Formation of double salts, 258. Transition point, 258. Vapour pressure. {xv} Quintuple point, 261. Solubility curves at the transition point, 264. Decomposition of the double salt by water, 267. Transition interval, 270. Summary, 271. | |
| CHAPTER XVI | |
| Isothermal Curves and the Space Model | 272 |
| Non-formation of double salts, 272. Formation of double salt, 273. Transition interval, 277. Isothermal evaporation, 278. Crystallization of double salt from solutions containing excess of one component, 280. Formation of mixed crystals, 281. Application to the characterization of racemates, 282. Representation in space. Space model for carnallite, 284. Summary and numerical data, 287. Ferric chloride—hydrogen chloride—water, 290. Ternary systems, 291. The isothermal curves, 294. Basic Salts, 296. Bi2O3—N2O5—H2O, 298. Basic mercury salts, 301. Indirect determination of the composition of the solid phase, 302. | |
| CHAPTER XVII | |
| Absence of Liquid Phase | 305 |
| Iron, carbon monoxide, carbon dioxide, 305. | |
| CHAPTER XVIII | |
| Systems of Four Components | 312 |
| Reciprocal salt-pairs. Choice of components, 313. Transition point, 314. Formation of double salts, 315. Transition interval, 315. Graphic representation, 316. Example, 317. Ammonia-soda process, 320. Preparation of barium nitrite, 327. Barium carbonate and potassium sulphate, 328. | |
| APPENDIX | |
| Experimental Determination of the Transition Point | 331 |
| I. The dilatometric method, 331. II. Measurement of the vapour pressure, 334. III. Solubility measurements, 335. IV. Thermometric method, 337. V. Optical method, 338. VI. Electrical methods, 338. | |
| Name Index | 341 |
| Subject Index | 345 |
INTRODUCTION
General.—Before proceeding to the more systematic treatment of the Phase Rule, it may, perhaps, be not amiss to give first a brief forecast of the nature of the subject we are about to study, in order that we may gain some idea of what the Phase Rule is, of the kind of problem which it enables us to solve, and of the scope of its application.
It has long been known that if water is placed in a closed, exhausted space, vapour is given off and a certain pressure is created in the enclosing vessel. Thus, when water is placed in the Torricellian vacuum of the barometer, the mercury is depressed, and the amount of depression increases as the temperature is raised. But, although the pressure of the vapour increases as the temperature rises, its value at any given temperature is constant, no matter whether the amount of water present or the volume of the vapour is great or small; if the pressure on the vapour is altered while the temperature is maintained constant, either the water or the vapour will ultimately disappear; the former by evaporation, the latter by condensation. At any given temperature within certain limits, therefore, water and vapour can exist permanently in contact with one another—or, as it is said, be in equilibrium with one another—only when the pressure has a certain definite value. The same law of constancy of vapour pressure at a given {2}temperature, quite irrespective of the volumes of liquid and vapour,[1] holds good also in the case of alcohol, ether, benzene, and other pure liquids. It is, therefore, not unnatural to ask the question, Does it hold good for all liquids? Is it valid, for example, in the case of solutions?
We can find the answer to these questions by studying the behaviour of a solution—say, a solution of common salt in water—when placed in the Torricellian vacuum. In this case, also, it is observed that the pressure of the vapour increases as the temperature is raised, but the pressure is no longer independent of the volume; as the volume increases, the pressure slowly diminishes. If, however, solid salt is present in contact with the solution, then the pressure again becomes constant at constant temperature, even when the volume of the vapour is altered. As we see, therefore, solutions do not behave in the same way as pure liquids.
Moreover, on lowering the temperature of water, a point is reached at which ice begins to separate out; and if heat be now added to the system or withdrawn from it, no change will take place in the temperature or vapour pressure of the latter until either the ice or the water has disappeared.[2] Ice, water, and vapour, therefore, can be in equilibrium with one another only at one definite temperature and one definite pressure.
In the case of a solution of common salt, however, we may have ice in contact with the solution at different temperatures and pressures. Further, it is possible to have a solution in equilibrium not only with anhydrous salt (NaCl), but also with the hydrated salt (NaCl, 2H2O), as well as with ice, and the question, therefore, arises: Is it possible to state in a general manner the conditions under which such different systems can exist in equilibrium; or to obtain some insight {3}into the relations which exist between pure liquids and solutions? As we shall learn, the Phase Rule enables us to give an answer to this question.
The preceding examples belong to the class of so-called "physical" equilibria, or equilibria depending on changes in the physical state. More than a hundred years ago, however, it was shown by Wenzel and Berthollet that "chemical" equilibria can also exist; that chemical reactions do not always take place completely in one direction as indicated by the usual chemical equation, but that before the reacting substances are all used up the reaction ceases, and there is a condition of equilibrium between the reacting substances and the products of reaction. As an example of this, there may be taken the process of lime-burning, which depends on the fact that when calcium carbonate is heated, carbon dioxide is given off and quicklime is produced. If the carbonate is heated in a closed vessel it will be found, however, not to undergo entire decomposition. When the pressure of the carbon dioxide reaches a certain value (which is found to depend on the temperature), decomposition ceases, and calcium carbonate exists side by side with calcium oxide and carbon dioxide. Moreover, at any given temperature the pressure is constant and independent of the amount of carbonate or oxide present, or of the volume of the gas; nor does the addition of either of the products of dissociation, carbon dioxide or calcium oxide, cause any change in the equilibrium. Here, then, we see that, although there are three different substances present, and although the equilibrium is no longer due to physical, but to chemical change, it nevertheless obeys the same law as the vapour pressure of a pure volatile liquid, such as water.
It might be supposed, now, that this behaviour would be shown by other dissociating substances, e.g. ammonium chloride. When this substance is heated it dissociates into ammonia and hydrogen chloride, and at any given temperature the pressure of these gases is constant,[3] and is independent of the amounts of solid and gas present. So far, therefore, ammonium chloride behaves like calcium carbonate. If, however, one of the {4}products of dissociation be added to the system, it is found that the pressure is no longer constant at a given temperature, but varies with the amount of gas, ammonia or hydrogen chloride, which is added. In the case of certain dissociating substances, therefore, addition of one of the products of dissociation alters the equilibrium, while in other cases it does not. With the help of the Phase Rule, however, a general interpretation of this difference of behaviour can be given—an interpretation which can be applied not only to the two cases cited, but to all cases of dissociation.
Again, it is well known that sulphur exists in two different crystalline forms, octahedral and prismatic, each of which melts at a different temperature. The problem here is, therefore, more complicated than in the case of ice, for there is now a possibility not only of one solid form, but of two different forms of the same substance existing in contact with liquid. What are the conditions under which these two forms can exist in contact with liquid, either singly or together, and under what conditions can the two solid forms exist together without the presence of liquid sulphur? To these questions an answer can also be given with the help of the Phase Rule.
These cases are, however, comparatively simple; but when we come, for instance, to study the conditions under which solutions are formed, and especially when we inquire into the solubility relations of salts capable of forming, perhaps, a series of crystalline hydrates; and when we seek to determine the conditions under which these different forms can exist in contact with the solution, the problem becomes more complicated, and the necessity of some general guide to the elucidation of the behaviour of these different systems becomes more urgent.
It is, now, to the study of such physical and chemical equilibria as those above-mentioned that the Phase Rule finds application; to the study, also, of the conditions regulating, for example, the formation of alloys from mixtures of the fused metals, or of the various salts of the Stassfurt deposits; the behaviour of iron and carbon in the formation of steel and the {5}separation of different minerals from a fused rock-mass.[4] With the help of the Phase Rule we can group together into classes the large number of different isolated cases of systems in equilibrium; with its aid we are able to state, in a general manner at least, the conditions under which a system can be in equilibrium, and by its means we can gain some insight into the relations existing between different kinds of systems.
Homogeneous and Heterogeneous Equilibrium.—Before passing to the consideration of this generalization, it will be well to first make mention of certain restrictions which must be placed on its treatment, and also of the limitations to which it is subject. If a system is uniform throughout its whole extent, and possesses in every part identical physical properties and chemical composition, it is called homogeneous. Such is, for example, a solution of sodium chloride in water. An equilibrium occurring in such a homogeneous system (such as the equilibrium occurring in the formation of an ester in alcoholic solution) is called homogeneous equilibrium. If, however, the system consists of parts which have different physical properties, perhaps also different chemical properties, and which are marked off and separated from one another by bounding surfaces, the system is said to be heterogeneous. Such a system is formed by ice, water, and vapour, in which the three portions, each in itself homogeneous, can be mechanically separated from one another. When equilibrium exists between different, physically distinct parts, it is known as heterogeneous equilibrium. It is, now, with heterogeneous equilibria, with the conditions under which a heterogeneous system can exist, that we shall deal here.
Further, we shall not take into account changes of equilibrium due to the action of electrical, magnetic, or capillary forces, or of gravity; but shall discuss only those which are due to changes of pressure, temperature, and volume (or concentration).
Real and Apparent Equilibrium.—In discussing equilibria, also, a distinction must be drawn between real and {6}apparent equilibria. In the former case there is a state of rest which undergoes continuous change with change of the conditions (e.g. change of temperature or of pressure), and for which the chief criterion is that the same condition of equilibrium is reached from whichever side it is approached. Thus in the case of a solution, if the temperature is maintained constant, the same concentration will be obtained, no matter whether we start with an unsaturated solution to which we add more solid, or with a supersaturated solution from which we allow solid to crystallize out; or, in the case of water in contact with vapour, the same vapour pressure will be obtained, no matter whether we heat the water up to the given temperature or cool it down from a higher temperature. In this case, water and vapour are in real equilibrium. On the other hand, water in contact with hydrogen and oxygen at the ordinary temperature is a case only of apparent equilibrium; on changing the pressure and temperature continuously within certain limits there is no continuous change observed in the relative amounts of the two gases. On heating beyond these limits there is a sudden and not a continuous change, and the system no longer regains its former condition on being cooled to the ordinary temperature. In all such cases the system may be regarded as undergoing change and as tending towards a state of true or real equilibrium, but with such slowness that no change is observed.
Although the case of water in contact with hydrogen and oxygen is an extreme one, it must be borne in mind that the condition of true equilibrium may not be reached instantaneously or even with measurable velocity, and in all cases it is necessary to be on one's guard against mistaking apparent (or false) for real (or true) equilibrium. The importance of this will be fully illustrated in the sequel.
THE PHASE RULE
Although the fact that chemical reactions do not take place completely in one direction, but proceed only to a certain point and there make a halt, was known in the last quarter of the eighteenth century (Wenzel, 1777; Berthollet, 1799); and although the opening and subsequent decades of the following century brought many further examples of such equilibria to our knowledge, it was not until the last quarter of the nineteenth century that a theorem, general in its application and with foundations weakened by no hypothetical assumptions as to the nature or constitution of matter, was put forward by Willard Gibbs;[5] a generalization which serves at once as a golden rule by which the condition of equilibrium of a system can be tested, and as a guide to the similarities and dissimilarities existing in different systems.
Before that time, certainly, attempts had been made to bring the different known cases of equilibria—chemical and physical—under general laws. From the very first, both Wenzel[6] and Berthollet[7] recognized the influence exercised by the mass of the substances on the equilibrium of the system. It was reserved, however, for Guldberg and Waage, by their more general statement and mathematical treatment of the Law of Mass Action,[8] to inaugurate the period of quantitative study of equilibria. The law which these investigators enunciated {8}served satisfactorily to summarize the conditions of equilibrium in many cases both of homogeneous and, with the help of certain assumptions and additions, of heterogeneous equilibrium. By reason, however, of the fact that it was developed on the basis of the kinetic and molecular theories, and involved, therefore, certain hypothetical assumptions as to the nature and condition of the substances taking part in the equilibrium, the law of mass action failed, as it necessarily must, when applied to those systems in which neither the number of different molecular aggregates nor the degree of their molecular complexity was known.
Ten years after the law of mass action was propounded by Guldberg and Waage, Willard Gibbs,[9] Professor of Physics in Yale University, showed how, in a perfectly general manner, free from all hypothetical assumptions as to the molecular condition of the participating substances, all cases of equilibrium could be surveyed and grouped into classes, and how similarities in the behaviour of apparently different kinds of systems, and differences in apparently similar systems, could be explained.
As the basis of his theory of equilibria, Gibbs adopted the laws of thermodynamics,[10] a method of treatment which had first been employed by Horstmann.[11] In deducing the law of equilibrium, Gibbs regarded a system as possessing only three independently variable factors[12]—temperature, pressure, and the concentration of the components of the system—and he enunciated the general theorem now usually known as the Phase Rule, by which he defined the conditions of equilibrium as a relationship between the number of what are called the phases and the components of the system.
Phases.—Before proceeding farther we shall first consider what exactly is meant by the terms phase and component. We have already seen (p. 5) that a heterogeneous system is made {9}up of different portions, each in itself homogeneous, but marked off in space and separated from the other portions by bounding surfaces. These homogeneous, physically distinct and mechanically separable portions are called phases. Thus ice, water, and vapour, are three phases of the same chemical substance—water. A phase, however, whilst it must be physically and chemically homogeneous, need not necessarily be chemically simple. Thus, a gaseous mixture or a solution may form a phase; but a heterogeneous mixture of solid substances constitutes as many phases as there are substances present. Thus when calcium carbonate dissociates under the influence of heat, calcium oxide and carbon dioxide are formed. There are then two solid phases present, viz. calcium carbonate and oxide, and one gas phase, carbon dioxide.
The number of phases which can exist side by side may vary greatly in different systems. In all cases, however, there can be but one gas or vapour phase on the account of the fact that all gases are miscible with one another in all proportions. In the case of liquid and solid phases the number is indefinite, since the above property does not apply to them. The number of phases which can be formed by any given substance or group of substances also differs greatly, and in general increases with the number of participating substances. Even in the case of a single substance, however, the number may be considerable; in the case of sulphur, for example, at least eight different solid phases are known (v. Chap. III.).
It is of importance to bear in mind that equilibrium is independent of the amounts of the phases present.[13] Thus it is a familiar fact that the pressure of a vapour in contact with a {10}liquid (i.e. the pressure of the saturated vapour) is unaffected by the amounts, whether relative or absolute, of the liquid and vapour; also the amount of a substance dissolved by a liquid is independent of the amount of solid in contact with the solution. It is true that deviations from this general law occur when the amount of liquid or the size of the solid particles is reduced beyond a certain point,[14] owing to the influence of surface energy; but we have already (p. 5) excluded such cases from consideration.
Components.—Although the conception of phases is one which is readily understood, somewhat greater difficulty is experienced when we come to consider what is meant by the term component; for the components of a system are not synonymous with the chemical elements or compounds present, i.e. with the constituents of the system, although both elements and compounds may be components. By the latter term there are meant only those constituents the concentration of which can undergo independent variation in the different phases, and it is only with these that we are concerned here.[15]
To understand the meaning of this term we shall consider briefly some cases with which the reader will be familiar, and at the outset it must be emphasized that the Phase Rule is concerned merely with those constituents which take part in the state of real equilibrium (p. 5); for it is only to the final state, not to the processes by which that state is reached, that the Phase Rule applies.
Consider now the case of the system water—vapour or ice—water—vapour. The number of constituents taking part in the equilibrium here is only one, viz. the chemical substance, water. Hydrogen and oxygen, the constituents of water, are not to be regarded as components, because, in the first place, they are {11}not present in the system in a state of real equilibrium (p. 6); in the second place, they are combined in definite proportions to form water, and their amounts, therefore, cannot be varied independently. A variation in the amount of hydrogen necessitates a definite variation in the amount of oxygen.
In the case, already referred to, in which hydrogen and oxygen are present along with water at the ordinary temperature, we are not dealing with a condition of true equilibrium. If, however, the temperature is raised to a certain point, a state of true equilibrium between hydrogen, oxygen, and water-vapour will be possible. In this case hydrogen and oxygen will be components, because now they do take part in the equilibrium; also, they need no longer be present in definite proportions, but excess of one or the other may be added. Of course, if the restriction be arbitrarily made that the free hydrogen and oxygen shall be present always and only in the proportions in which they are combined to form water, there will be, as before, only one component, water. From this, then, we see that a change in the conditions of the experiment (in the present case a rise of temperature) may necessitate a change in the number of the components.
It is, however, only in the case of systems of more than one component that any difficulty will be found; for only in this case will a choice of components be possible. Take, for instance, the dissociation of calcium carbonate into calcium oxide and carbon dioxide. At each temperature, as we have seen, there is a definite state of equilibrium. When equilibrium has been established, there are three different substances present—calcium carbonate, calcium oxide, and carbon dioxide; and these are the constituents of the system between which equilibrium exists. Now, although these constituents take part in the equilibrium, they are not all to be regarded as components, for they are not mutually independent. On the contrary, the different phases are related to one another, and if two of these are taken, the composition of the third is defined by the equation
CaCO3 = CaO + CO2
Now, in deciding the number of components in any given system, not only must the constituents chosen be capable of independent variation, but a further restriction is imposed, and we obtain the following rule: As the components of a system there are to be chosen the smallest number of independently variable constituents by means of which the composition of each phase participating in the state of equilibrium can be expressed in the form of a chemical equation.
Applying this rule to the case under consideration, we see that of the three constituents present when the system is in a state of equilibrium, only two, as already stated, are independently variable. It will further be seen that in order to express the composition of each phase present, two of these constituents are necessary. The system is, therefore, one of two components, or a system of the second order.
When, now, we proceed to the actual choice of components, it is evident that any two of the constituents can be selected. Thus, if we choose as components CaCO3 and CaO, the composition of each phase can be expressed by the following equations:—
CaCO3 = CaCO3 + 0CaO
CaO = CaO + 0CaCO3
CO2 = CaCO3 - CaO
As we see, then, both zero and negative quantities of the components have been introduced; and similar expressions would be obtained if CaCO3 and CO2 were chosen as components. The matter can, however, be simplified and the use of negative quantities avoided if CaO and CO2 are chosen; and it is, therefore, customary to select these as the components.
While it is possible in the case of systems of the second order to choose the two components in such a way that the composition of each phase can be expressed by positive quantities of these, such a choice is not always possible when dealing with systems of a higher order (containing three or four components).
From the example which has just been discussed, it might {13}appear as if the choice of the components was rather arbitrary. On examining the point, however, it will be seen that the arbitrariness affects only the nature, not the number, of the components; a choice could be made with respect to which, not to how many, constituents were to be regarded as components. As we shall see presently, however, it is only the number, not the nature of the components that is of importance.
After the discussion of the conditions which the substances chosen as components must satisfy, another method may be given by which the number of components present in a system can be determined. Suppose a system consisting of several phases in equilibrium, and the composition of each phase determined by analysis. If each phase present, regarded as a whole, has the same composition, the system contains only one component, or is of the first order. If two phases must be mixed in suitable quantities in order that the composition of a third phase may be obtained, the system is one of two components or of the second order; and if three phases are necessary to give the composition of a fourth coexisting phase, the system is one of three components, or of the third order.[16]
Although the examples to be considered in the sequel will afford sufficient illustration of the application of the rules given above, one case may perhaps be discussed to show the application of the method just given for determining the number of components.
Consider the system consisting of Glauber's salt in equilibrium with solution and vapour. If these three phases are analyzed, the composition of the solid will be expressed by Na2SO4, 10H2O; that of the solution by Na2SO4 + xH2O, while the vapour phase will be H2O. The system evidently cannot be a one-component system, for the phases have not all the same composition. By varying the amounts of two phases, however (e.g. Na2SO4, 10H2O and H2O), the composition of the third phase—the solution—can be obtained. The system is, therefore, one of two components.
But sodium sulphate can also exist in the anhydrous form and as the hydrate Na2SO4, 7H2O. In these cases there may {14}be chosen as components Na2SO4 and H2O, and Na2SO4, 7H2O and H2O respectively. In both cases, therefore, there are two components. But the two systems (Na2SO4, 10H2O—H2O, and Na2SO4, 7H2O—H2O) can be regarded as special cases of the system Na2SO4—H2O, and these two components will apply to all systems made up of sodium sulphate and water, no matter whether the solid phase is anhydrous salt or one of the hydrates. In all three cases, of course, the number of components is the same; but by choosing Na2SO4 and H2O as components, the possible occurrence of negative quantities of components in expressing the composition of the phases is avoided; and, further, these components apply over a much larger range of experimental conditions. Again, therefore, we see that, although the number of the components of a system is definite, a certain amount of liberty is allowed in the choice of the substances; and we also see that the choice will be influenced by the conditions of experiment.
Summing up, now, we may say—
(1) The components are to be chosen from among the constituents which are present when the system is in a state of true equilibrium, and which take part in that equilibrium.
(2) As components are to be chosen the smallest number of such constituents necessary to express the composition of each phase participating in the equilibrium, zero and negative quantities of the components being permissible.
(3) In any given system the number of the components is definite, but may alter with alteration of the conditions of experiment. A certain freedom of choice, however, is allowed in the (qualitative, not quantitative) selection of the components, the choice being influenced by considerations of simplicity, suitability, or generality of application.[17]
Degree of Freedom. Variability of a System.—It is well known that in dealing with a certain mass of gas or vapour, e.g. water vapour, if only one of the independently variable factors—temperature, pressure, and concentration (or volume)—is fixed, the state of the gas or vapour is undefined; while occupying the same volume (the concentration, therefore, remaining {15}unchanged), the temperature and the pressure may be altered; at a given temperature, a gas can exist under different pressures and occupy different volumes, and under any given pressure the temperature and volume may vary. If, however, two of the factors are arbitrarily fixed, then the third factor can only have a certain definite value; at any given values of temperature and pressure a given mass of gas can occupy only a definite volume.
Suppose, however, that the system consists of water in contact with vapour. The condition of the system then becomes perfectly defined on arbitrarily giving one of the variables a certain value. If the temperature is fixed, the pressure under which water and water vapour can coexist is also determined; and conversely, if a definite pressure is chosen, the temperature is also defined. Water and vapour can coexist under a given pressure only at a definite temperature.
Finally, let the water and vapour be cooled down until ice begins to separate out. So soon as the third phase, ice, appears, the state of the system as regards temperature and pressure of the vapour is perfectly defined, and none of the variables can be arbitrarily changed without causing the disappearance of one of the phases, ice, water, or vapour.
We see, therefore, that in the case of some systems two, in other cases, only one of the independent variables (temperature, pressure, concentration) can be altered without destroying the nature of the system; while in other systems, again, these variables have all fixed and definite values. We shall therefore define the number of degrees of freedom[18] of a system as the number of the variable factors, temperature, pressure, and concentration of the components, which must be arbitrarily fixed in order that the condition of the system may be perfectly defined. From what has been said, therefore, we shall describe a gas or vapour as having two degrees of freedom; the system water—vapour as having only one; and the system ice—water—vapour as having no degrees of freedom. We may also speak of the {16}variability or variance of a system, and describe a system as being invariant, univariant, bivariant, multivariant,[19] according as the number of degrees of freedom is nought, one, two, or more than two.
A knowledge of its variability is, therefore, of essential importance in studying the condition and behaviour of a system, and it is the great merit of the Phase Rule that the state of a system is defined entirely by the relation existing between the number of the components and the phases present, no account being taken of the molecular complexity of the participating substances, nor any assumption made with regard to the constitution of matter. It is, further, as we see, quite immaterial whether we are dealing with "physical" or "chemical" equilibrium; in principle, indeed, no distinction need be drawn between the two classes, although it is nevertheless often convenient to make use of the terms, in spite of a certain amount of indefiniteness which attaches to them—an indefiniteness, indeed, which attaches equally to the terms "physical" and "chemical" process.[20]
The Phase Rule.—The Phase Rule of Gibbs, which defines the condition of equilibrium by the relation between the number of coexisting phases and the components, may be stated as follows: A system consisting of n components can exist in n + 2 phases only when the temperature, pressure, and concentration have fixed and definite values; if there are n components in n + 1 phases, equilibrium can exist while one of the factors varies, and if there are only n phases, two of the varying factors may be arbitrarily fixed. This rule, the application of which, it is hoped, will become clear in the sequel, may be very concisely and conveniently summarized in the form of the equation—
P + F = C + 2, or F = C + 2 - P
where P denotes the number of the phases, F the degrees of freedom, and C the number of components. From the second form of the equation it can be readily seen that the greater the number of the phases, the fewer are the degrees of freedom. With increase in the number of the phases, therefore, the {17}condition of the system becomes more and more defined, or less and less variable.
Classification of Systems according to the Phase Rule.—We have already learned in the introductory chapter that systems which are apparently quite different in character may behave in a very similar manner. Thus it was stated that the laws which govern the equilibrium between water and its vapour are quite analogous to those which are obeyed by the dissociation of calcium carbonate into carbon dioxide and calcium oxide; in each case a certain temperature is associated with a definite pressure, no matter what the relative or absolute amounts of the respective substances are. And other examples were given of systems which were apparently similar in character, but which nevertheless behaved in a different manner. The relations between the various systems, however, become perfectly clear and intelligible in the light of the Phase Rule. In the case first mentioned, that of water in equilibrium with its vapour, we have one component—water—present in two phases, i.e. in two physically distinct forms, viz. liquid and vapour. According to the Phase Rule, therefore, since C = 1, and P = 2, the degree of freedom F is equal to 1 + 2 - 2 = 1; the system possesses one degree of freedom, as has already been stated. But in the case of the second system mentioned above there are two components, viz. calcium oxide and carbon dioxide (p. 12), and three phases, viz. two solid phases, CaO and CaCO3, and the gaseous phase, CO2. The number of degrees of freedom of the system, therefore, is 2 + 2 - 3 = 1; this system, therefore, also possesses one degree of freedom. We can now understand why these two systems behave in a similar manner; both are univariant, or possess only one degree of freedom. We shall therefore expect a similar behaviour in the case of all univariant systems, no matter how dissimilar the systems may outwardly appear. Similarly, all bivariant systems will exhibit analogous behaviour; and generally, systems possessing the same degree of freedom will show a like behaviour. In accordance with the Phase Rule, therefore, we may classify the different systems which may be found into invariant, univariant, bivariant, multivariant, {18}according to the relation which obtains between the number of the components and the number of coexisting phases; and we shall expect that in each case the members of any particular group will exhibit a uniform behaviour. By this means we are enabled to obtain an insight into the general behaviour of any system, so soon as we have determined the number of the components and the number of the coexisting phases.
The adoption of the Phase Rule for the purposes of classification has been of great importance in studying changes in the equilibrium existing between different substances; for not only does it render possible the grouping together of a large number of isolated phenomena, but the guidance it affords has led to the discovery of new substances, has given the clue to the conditions under which these substances can exist, and has led to the recognition of otherwise unobserved resemblances existing between different systems.
Deduction of the Phase Rule.—In the preceding pages we have restricted ourselves to the statement of the Phase Rule, without giving any indication of how it has been deduced. At the close of this chapter, therefore, the mathematical deduction of the generalization will be given, but in brief outline only, the reader being referred to works on Thermodynamics for a fuller treatment of the subject.[21]
All forms of energy can be resolved into two factors, the capacity factor and the intensity factor; but for the production of equilibrium, only the intensity factor is of importance. Thus, if two bodies having the same temperature are brought in contact with each other, they will be in equilibrium as regards heat energy, no matter what may be the amounts of heat (capacity factor) contained in either, because the intensity factor—the temperature—is the same. But if the temperature of the two bodies is different, i.e. if the intensity factor of heat energy is different, the two bodies will no longer be in equilibrium; but heat will pass from the hotter to the colder until both have the same temperature.
As with heat energy, so with chemical energy. If we have a substance existing in two different states, or in two different {19}phases of a system, equilibrium can occur only when the intensity factor of chemical energy is the same. This intensity factor may be called the chemical potential; and we can therefore say that a system will be in equilibrium when the chemical potential of each component is the same in all the phases in which the component occurs. Thus, for example, ice, water, and vapour have, at the triple point, the same chemical potential.
The potential of a component in any phase depends not only on the composition of the phase, but also on the temperature and the pressure (or volume). If, therefore, we have a system of C components existing in P phases, then, in order to fix the composition of unit mass of each phase, it is necessary to know the masses of (C - 1) components in each of the phases. As regards the composition, therefore, each phase possesses (C - 1) variables. Since there are P phases, it follows that, as regards composition, the whole system possesses P(C - 1) variables. Besides these there are, however, two other variables, viz. temperature and pressure, so that altogether a system of C components in P phases possesses P(C - 1) + 2 variables.
In order to define the state of the system completely, it will be necessary to have as many equations as there are variables. If, therefore, there are fewer equations than there are variables, then, according to the deficiency in the number of the equations, one or more of the variables will have an undefined value; and values must be assigned to these variables before the system is entirely defined. The number of these undefined values gives us the variability or the degree of freedom of the system.
The equations by which the system is to be defined are obtained from the relationship between the potential of a component and the composition of the phase, the temperature and the pressure. Further, as has already been stated, equilibrium occurs when the potential of each component is the same in the different phases in which it is present. If, therefore, we choose as standard one of the phases in which all the components occur, then in any other phase in equilibrium with {20}it, the potential of each component must be the same as in the standard phase. For each phase in equilibrium with the standard phase, therefore, there will be a definite equation of state for each component in the phase; so that, if there are P phases, we obtain for each component (P - 1) equations; and for C components, therefore, we obtain C(P - 1) equations.
But we have seen above that there are P(C - 1) + 2 variables, and as we have only C(P - 1) equations, there must be P(C - 1) + 2 - C(P - 1) = C + 2 - P variables undefined. That is to say, the degree of freedom (F) of a system consisting of C components in P phases is—
F = C + 2 - P
TYPICAL SYSTEMS OF ONE COMPONENT
A. Water.
For the sake of rendering the Phase Rule more readily intelligible, and at the same time also for the purpose of obtaining examples by which we may illustrate the general behaviour of systems, we shall in this chapter examine in detail the behaviour of several well-known systems consisting of only one component.
The most familiar examples of equilibria in a one-component system are those furnished by the three phases of water, viz. ice, water, water vapour. The system consists of one component, because all three phases have the same chemical composition, represented by the formula H2O. As the criterion of equilibrium we shall choose a definite pressure, and shall study the variation of the pressure with the temperature; and for the purpose of representing the relationships which we obtain we shall employ a temperature-pressure diagram, in which the temperatures are measured as abscissæ and the pressures as ordinates. In such a diagram invariant systems will be represented by points; univariant systems by lines, and bivariant systems by areas.
Equilibrium between Liquid and Vapour. Vaporization Curve.—Consider in the first place the conditions for the coexistence of liquid and vapour. According to the Phase Rule (p. 16), a system consisting of one component in two phases has one degree of freedom, or is univariant. We should therefore expect that it will be possible for liquid water to coexist with water vapour at different values of temperature and {22}pressure, but that if we arbitrarily fix one of the variable factors, pressure, temperature, or volume (in the case of a given mass of substance), the state of the system will then be defined. If we fix, say, the temperature, then the pressure will have a definite value; or if we adopt a certain pressure, the liquid and vapour can coexist only at a certain definite temperature. Each temperature, therefore, will correspond to a definite pressure; and if in our diagram we join by a continuous line all the points indicating the values of the pressure corresponding to the different temperatures, we shall obtain a curve (Fig. 1) representing the variation of the pressure with the temperature. This is the curve of vapour pressure, or the vaporization curve of water.
Fig. 1.
Now, the results of experiment are quite in agreement with the requirements of the Phase Rule, and at any given temperature the system water—vapour can exist in equilibrium only under a definite pressure.
The vapour pressure of water at different temperatures has been subjected to careful measurement by Magnus,[22] Regnault,[23] Ramsay and Young,[24] Juhlin,[25] Thiesen and Scheel,[26] and others. In the following table the values of the vapour pressure from -10° to +100° are those calculated from the measurements of Regnault, corrected by the measurements of Wiebe and Thiesen and Scheel;[27] those from 120° to 270° were determined {23}by Ramsay and Young, while the values of the critical pressure and temperature are those determined by Battelli.[28]
Vapour Pressure of Water.
| Temperature. | Pressure in cm. mercury. | Temperature. | Pressure in cm. mercury. |
| -10° | 0.213 | 120° | 148.4 |
| 0° | 0.458[29] | 130° | 201.9 |
| +20° | 1.752 | 150° | 356.8 |
| 40° | 5.516 | 200° | 1162.5 |
| 60° | 14.932 | 250° | 2973.4 |
| 80° | 35.54 | 270° | 4110.1 |
| 100° | 76.00 | 364.3° (critical temperature) | 14790.4 (194.6 atm.) (critical pressure). |
The pressure is, of course, independent of the relative or absolute volumes of the liquid and vapour; on increasing the volume at constant temperature, a certain amount of the liquid will pass into vapour, and the pressure will regain its former value. If, however, the pressure be permanently maintained at a value different from that corresponding to the temperature employed, then either all the liquid will pass into vapour, or all the vapour will pass into liquid, and we shall have either vapour alone or liquid alone.
Upper Limit of Vaporization Curve.—On continuing to add heat to water contained in a closed vessel, the pressure of the vapour will gradually increase. Since with increase of pressure the density of the vapour must increase, and since with rise of temperature the density of the liquid must decrease, a point will be reached at which the density of liquid and vapour become identical; the system ceases to be heterogeneous, and passes into one homogeneous phase. The temperature at which this occurs is called the critical temperature. To this temperature there will, of course, correspond a certain definite pressure, called the critical pressure. The curve representing the {24}equilibrium between liquid and vapour must, therefore, end abruptly at the critical point. At temperatures above this point no pressure, however great, can cause the formation of the liquid phase; at temperatures above the critical point the vapour becomes a gas. In the case of water, the critical temperature is 364.3°, and the critical pressure 194.6 atm.; at the point representing these conditions the vapour-pressure curve of water must cease.
Sublimation Curve of Ice.—Vapour is given off not only by liquid water, but also by solid water, or ice. That this is so is familiar to every one through the fact that ice or snow, even at temperatures below the melting point, gradually disappears in the form of vapour. Even at temperatures considerably lower than 0°, the vapour pressure of ice, although small, is quite appreciable; and it is possible, therefore, to have ice and vapour coexisting in equilibrium. When we inquire into the conditions under which such a system can exist, we see again that we are dealing with a univariant system—one component existing in two phases—and that, therefore, just as in the case of the system water and vapour, there will be for each temperature a certain definite pressure of the vapour, and this pressure will be independent of the relative or absolute amounts of the solid or vapour present, and will depend solely on the temperature. Further, just as in the case of the vapour pressure of water, the condition of equilibrium between ice and water vapour will be represented by a line or curve showing the change of pressure with the temperature. Such a curve, representing the conditions of equilibrium between a solid and its vapour, is called a sublimation curve. At temperatures represented by any point on this curve, the solid (ice) will sublime or pass into vapour without previously fusing. Since ice melts at 0° (vide infra), the sublimation curve must end at that temperature.
The following are the values of the vapour pressure of ice between 0° and -50°.[30]
Vapour Pressure of Ice.
| Temperature. | Pressure in mm. mercury. | Temperature. | Pressure in mm. mercury. |
| -50° | 0.050 | -8° | 2.379 |
| -40° | 0.121 | -6° | 2.821 |
| -30° | 0.312 | -4° | 3.334 |
| -20° | 0.806 | -2° | 3.925 |
| -15° | 1.279 | 0° | 4.602 |
| -10° | 1.999 |
Equilibrium between Ice and Water. Curve of Fusion.—There is still another univariant system of the one component water, the existence of which, at definite values of temperature and pressure, the Phase Rule allows us to predict. This is the system solid—liquid. Ice on being heated to a certain temperature melts and passes into the liquid state; and since this system solid—liquid is univariant, there will be for each temperature a certain definite pressure at which ice and water can coexist or be in equilibrium, independently of the amounts of the two phases present. Since now the temperature at which the solid phase is in equilibrium with the liquid phase is known as the melting point or point of fusion of the solid, the curve representing the temperatures and pressures at which the solid and liquid are in equilibrium will represent the change of the melting point with the pressure. Such a curve is called the curve of fusion, or the melting-point curve.
It was not until the middle of the nineteenth century that this connection between the pressure and the melting point, or the change of the melting point with the pressure, was observed. The first to recognize the existence of such a relationship was James Thomson,[31] who in 1849 showed that from theoretical considerations such a relationship must exist, and predicted that in the case of ice the melting point would be lowered by pressure. This prediction was fully confirmed by his brother, W. Thomson[32] (Lord Kelvin), who found that under a pressure {26}of 8.1 atm. the melting point of ice was -0.059°; under a pressure of 16.8 atm. the melting point was -0.129°.
The experiments which were first made in this connection were more of a qualitative nature, but in recent years careful measurements of the influence of pressure on the melting point of ice have been made more especially by Tammann,[33] and the results obtained by him are given in the following table and represented graphically in Fig. 2.
Fusion Pressure of Ice.
| Temperature. | Pressure in kilogms. per sq. cm.[34] | Change of melting point for an increase of pressure of 1 kilogm. per sq. cm. |
| -0° -2.5° -5° -7.5° -10.0° -12.5° -15.0° -17.5° -20.0° -22.1° | 1 336 615 890 1155 1410 1625 1835 2042 2200 | 0.0074° 0.0090° 0.0091° 0.0094° 0.0100° 0.0116° 0.0119° 0.0121° 0.0133° |
From the numbers in the table and from the figure we see that as the pressure is increased the melting point of ice is lowered; but we also observe that a very large change of pressure is required in order to produce a very small change in the melting point. The curve, therefore, is very steep. Increase of pressure by one atmosphere lowers the melting point by only 0.0076°,[35] or an increase of pressure of 135 atm. is required to produce a lowering of the melting point of 1°. We see further that the fusion curve bends slightly as the pressure is increased, which signifies that the variation of {27}the melting point with the pressure changes; at -15°, when the pressure is 1625 kilogm. per sq. cm., increase of pressure by 1 kilogm. per sq. cm. lowers the melting point by 0.012°. This curvature of the fusion curve we shall later (Chap. IV.) see to be an almost universal phenomenon.
 Fig. 2.
 Fig. 3.
Equilibrium between Ice, Water, and Vapour. The Triple Point.—On examining the vapour-pressure curves of ice and water (Fig. 3), we see that at a temperature of about 0° and under a pressure of about 4.6 mm. mercury, the two curves cut. At this point liquid water and solid ice are each in equilibrium with vapour at the same pressure. Since this is so, they must, of course, be in equilibrium {28}with one another, as experiment also shows. At this point, therefore, ice, water, and vapour can be in equilibrium, and as there are three phases present, the point is called a triple point.[36]
The triple point, however, does not lie exactly at 0° C., for this temperature is defined as the melting point of ice under atmospheric pressure. At the triple point, however, the pressure is equal to the vapour pressure of ice and water, and this pressure, as we see from the tables on pp. 21 and 23, is very nearly 4.6 mm., or almost 1 atm. less than in the previous case. Now, we have just seen that a change of pressure of 1 atm. corresponds to a change of the melting point of 0.0076°; the melting point of ice, therefore, when under the pressure of its own vapour, will be very nearly +0.0076°, and the pressure of the vapour will be very slightly greater than 4.579 mm., which is the pressure at 0° (p. 21). The difference is, however, slight, and may be neglected here. At the temperature, then, of +0.0076°, and under a pressure of 4.6 mm. of mercury, ice, water, and vapour will be in equilibrium; the point in our diagram representing this particular temperature and pressure is, therefore, the triple point of the system ice—water—vapour.
Since at the triple point we have three phases of one component, the system at this point is invariant—it possesses no degrees of freedom. If the temperature is changed, the system will undergo alteration in such a way that one of the phases will disappear, and a univariant system will result; if heat be added, ice will melt, and we shall have left water and vapour; if heat be abstracted, water will freeze, and we shall have left ice and vapour; if, when the temperature is altered, the pressure is kept constant, then we shall ultimately obtain only one phase (see Chap. IV.).
The triple point is not only the point of intersection of the vaporization and sublimation curves, but it is also the end-point of the fusion curve. The fusion curve, as we have seen, is the curve of equilibrium between ice and water; and since at the triple point ice and water are each in equilibrium with {29}vapour of the same pressure, they must, of course, also be in equilibrium with one another.
 Fig. 4.
Bivariant Systems of Water.—If we examine Fig. 4, we see that the curves OA, OB, OC, which represent diagrammatically the conditions under which water and vapour, ice and vapour, and water and ice are in equilibrium, form the boundaries of three "fields," or areas, I., II., III. These areas, now, represent the conditions for the existence of the single phases, solid, liquid, and vapour respectively. At temperatures and pressures represented by any point in the field I., solid only can exist as a stable phase. Since we have here one component in only one phase, the system is bivariant, and at any given temperature, therefore, ice can exist under a series of pressures; and under any given pressure, at a series of temperatures, these pressures and temperatures being limited only by the curves OB, OC. Similarly also with the areas II. and III.
We see, further, that the different areas are the regions of stability of the phase common to the two curves by which the area is enclosed.[37] Thus, the phase common to the two systems {30}represented by BO (ice and vapour), and OA (water and vapour) is the vapour phase; and the area BOA is therefore the area of the vapour phase. Similarly, BOC is the area of the ice phase, and COA the area of the water phase.
Supercooled Water. Metastable State.—When heated under the ordinary atmospheric pressure, ice melts when the temperature reaches 0°, and it has so far not been found possible to raise the temperature of ice above this point without liquefaction taking place. On the other hand, it has long been known that water can be cooled below zero without solidification occurring. This was first discovered in 1724 by Fahrenheit,[38] who found that water could be exposed to a temperature of -9.4° without solidifying; so soon, however, as a small particle of ice was brought in contact with the water, crystallization commenced. Superfused or supercooled water—i.e. water cooled below 0°—is unstable only in respect of the solid phase; so long as the presence of the solid phase is carefully avoided, the water can be kept for any length of time without solidifying, and the system supercooled water and vapour behaves in every way like a stable system. A system, now, which in itself is stable, and which becomes instable only in contact with a particular phase, is said to be metastable, and the region throughout which this condition exists is called the metastable region. Supercooled water, therefore, is in a metastable condition. If the supercooling be carried below a certain temperature, solidification takes place spontaneously without the addition of the solid phase; the system then ceases to be metastable, and becomes instable.
Not only has water been cooled to temperatures considerably below the melting point of ice, but the vapour pressure of the supercooled water has been measured. It is of interest and importance, now, to see what relationship exists between the vapour pressure of ice and that of supercooled water at the same temperature. This relationship is clearly shown by the numbers in the following table,[39] and is represented in Fig. 3, {31}p. 27., and diagrammatically in Fig. 4, the vapour pressures of supercooled water being represented by the curve OA′, which is the unbroken continuation of AO.
Vapour Pressure of Ice and of Supercooled Water.
| Temperature. | Pressure in mm. mercury. | ||
| Water. | Ice. | Difference. | |
| 0° | 4.618 | 4.602 | 0.016[40] |
| -2° | 3.995 | 3.925 | 0.070 |
| -4° | 3.450 | 3.334 | 0.116 |
| -8° | 2.558 | 2.379 | 0.179 |
| -10° | 2.197 | 1.999 | 0.198 |
| -15° | 1.492 | 1.279 | 0.213 |
| -20° | 1.005 | 0.806 | 0.199 |
At all temperatures below 0° (more correctly +0.0076°), at which temperature water and ice have the same vapour pressure, the vapour pressure of supercooled water is greater than that of ice at the same temperature.
From the relative positions of the curves OB and OA (Fig. 4) we see that at all temperatures above 0°, the (metastable) sublimation curve of ice, if it could be obtained, would be higher than the vaporization curve of water. This shows, therefore, that at 0° a "break" must occur in the curve of states, and that in the neighbourhood of this break the curve above that point must ascend less rapidly than the curve below the break. Since, however, the differences in the vapour pressures of supercooled water and of ice are very small, the change in the direction of the vapour-pressure curve on passing from ice to water was at first not observed, and Regnault regarded the sublimation curve as passing continuously into {32}the vaporization curve. The existence of a break was, however, shown by James Thomson[41] and by Kirchhoff[42] to be demanded by thermo-dynamical considerations, and the prediction of theory was afterwards realized experimentally by Ramsay and Young in their determinations of the vapour pressure of water and ice, as well as in the case of other substances.[43]
From what has just been said, we can readily understand why ice and water cannot exist in equilibrium below 0°. For, suppose we have ice and water in the same closed space, but not in contact with one another, then since the vapour pressure of the supercooled water is higher than that of ice, the vapour of the former must be supersaturated in contact with the latter; vapour must, therefore, condense on the ice; and in this way there will be a slow distillation from the water to the ice, until at last all the water will have disappeared, and only ice and vapour remain.[44]
Other Systems of the Substance Water.—We have thus far discussed only those systems which are constituted by the three phases—ice, water, and water vapour. It has, however, been recently found that at a low temperature and under a high pressure ordinary ice can pass into two other crystalline varieties, called by Tammann[45] ice II. and ice III., ordinary ice being ice I. According to the Phase Rule, now, since each of these solid forms constitutes a separate phase (p. 9), it will be possible to have the following (and more) systems of water, in addition to those already studied, viz. water, ice I., ice II.; water, ice I., ice III.; water, ice II., ice III., forming invariant systems and existing in equilibrium only at a definite triple point; further, water, ice II.; water, ice III.; ice I., ice II.; ice I., ice III.; ice II., ice III., forming univariant systems, existing, therefore, at definite corresponding values of {33}temperature and pressure; and lastly, the bivariant systems, ice II. and ice III. Several of these systems have been investigated by Tammann. The triple point for water, ice I., ice III., lies at -22°, and a pressure of 2200 kilogms. per sq. cm. (2130 atm.), as indicated in Fig. 2, p. 27.[46] In contrast with the behaviour of ordinary ice, the temperature of equilibrium in the case of water—ice II., and water—ice III., is raised by increase of pressure.
B. Sulphur.
Polymorphism.—Reference has just been made to the fact that ice can exist not only in the ordinary form, but in at least two other crystalline varieties. This phenomenon, the existence of a substance in two or more different crystalline forms, is called polymorphism. Polymorphism was first observed by Mitscherlich[47] in the case of sodium phosphate, and later in the case of sulphur. To these two cases others were soon added, at first of inorganic, and later of organic substances, so that polymorphism is now recognized as of very frequent occurrence indeed.[48] These various forms of a substance differ not only in crystalline shape, but also in melting point, specific gravity, and other physical properties. In the liquid state, however, the differences do not exist.
According to our definition of phases (p. 9), each of these polymorphic forms constitutes a separate phase of the particular substance. As is readily apparent, the number of possible systems formed of one component may be considerably increased when that component is capable of existing in different crystalline forms. We have, therefore, to inquire what are the conditions under which different polymorphic forms can coexist, either alone or in presence of the liquid and vapour phase. For the purpose of illustrating the general behaviour of such systems, we shall study the systems formed by the different crystalline forms of sulphur, tin, and benzophenone.
Sulphur exists in two well-known crystalline forms—rhombic, or octahedral, and monoclinic, or prismatic sulphur. Of these, the former melts at 114.5°; the latter at 120°.[49] Further, at the ordinary temperature, rhombic sulphur can exist unchanged, whereas, on being heated to temperatures somewhat below the melting point, it passes into the prismatic variety. On the other hand, at temperatures above 96°, prismatic sulphur can remain unchanged, whereas at the ordinary temperature it passes slowly into the rhombic form.
If, now, we examine the case of sulphur with the help of the Phase Rule, we see that the following systems are theoretically possible:—
I. Bivariant Systems: One component in one phase.
(a) Rhombic sulphur.
(b) Monoclinic sulphur.
(c) Sulphur vapour.
(d) Liquid sulphur.
II. Univariant Systems: One component in two phases.
(a) Rhombic sulphur and vapour.
(b) Monoclinic sulphur and vapour.
(c) Rhombic sulphur and liquid.
(d) Monoclinic sulphur and liquid.
(e) Rhombic and monoclinic sulphur.
(f) Liquid and vapour.
III. Invariant Systems: One component in three phases.
(a) Rhombic and monoclinic sulphur and vapour.
(b) Rhombic sulphur, liquid and vapour.
(c) Monoclinic sulphur, liquid and vapour.
(d) Rhombic and monoclinic sulphur and liquid.
 Fig. 5.
Triple Point—Rhombic and Monoclinic Sulphur and Vapour. Transition Point.—In the case of ice, water and vapour, we saw that at the triple point the vapour pressures of ice and water are equal; below this point, ice is stable; above this point, water is stable. We saw, further, that below 0° the vapour pressure of the stable system is lower than that of the metastable, and therefore that at the triple point there is a break in the vapour pressure curve of such a kind that above {35}the triple point the vapour-pressure curve ascends more slowly than below it. Now, although the vapour pressure of solid sulphur has not been determined, we can nevertheless consider that it does possess a certain, even if very small, vapour pressure,[50] and that at the temperature at which the vapour pressures of rhombic and monoclinic sulphur become equal, we can have these two solid forms existing in equilibrium with the vapour. Below that point only one form, that with the lower vapour pressure, will be stable; above that point only the other form will be stable. On passing through the triple point, therefore, there will be a change of the one form into the other. This point is represented in our diagram (Fig. 5) by the point O, the two curves AO and OB representing diagrammatically the vapour pressures of rhombic and monoclinic sulphur respectively. If the vapour phase is absent and the system maintained under a constant pressure, e.g. {36}atmospheric pressure, there will also be a definite temperature at which the two solid forms are in equilibrium, and on passing through which complete and reversible transformation of one form into the other occurs. This temperature, which refers to equilibrium in absence of the vapour phase, is known as the transition temperature or inversion temperature.
Were we dependent on measurements of pressure and temperature, the determination of the transition point might be a matter of great difficulty. When we consider, however, that the other physical properties of the solid phases, e.g. the density, undergo an abrupt change on passing through the transition point, owing to the transformation of one form into the other, then any method by which this abrupt change in the physical properties can be detected may be employed for determining the transition point. A considerable number of such methods have been devised, and a description of the most important of these is given in the Appendix.
In the case of sulphur, the transition point of rhombic into monoclinic sulphur was found by Reicher[51] to lie at 95.5°. Below this temperature the octahedral, above it the monoclinic, is the stable form.
Condensed Systems.—We have already seen that in the change of the melting point of water with the pressure, a very great increase of the latter was necessary in order to produce a comparatively small change in the temperature of equilibrium. This is a characteristic of all systems from which the vapour phase is absent, and which are composed only of solid and liquid phases. Such systems are called condensed systems,[52] and in determining the temperature of equilibrium of such systems, practically the same point will be obtained whether the measurements are carried out under atmospheric pressure or under the pressure of the vapour of the solid or liquid phases. The transition point, therefore, as determined in open vessels at atmospheric pressure, will differ only by a very slight amount from the triple point, or point at which the two solid or liquid phases are in equilibrium under the pressure of their vapour. {37}The determination of the transition point is thereby greatly simplified.
Suspended Transformation.—In many respects the transition point of two solid phases is analogous to the melting point of a solid, or point at which the solid passes into a liquid. In both cases the change of phase is associated with a definite temperature and pressure in such a way that below the point the one phase, above the point the other phase, is stable. The transition point, however, differs in so far from a point of fusion, that while it is possible to supercool a liquid, no definite case is known where the solid has been heated above the triple point without passing into the liquid state. Transformation, therefore, is suspended only on one side of the melting point. In the case of two solid phases, however, the transition point can be overstepped in both directions, so that each phase can be obtained in the metastable condition. In the case of supercooled water, further, we saw that the introduction of the stable, solid phase caused the speedy transformation of the metastable to the stable condition of equilibrium; but in the case of two solid phases the change from the metastable to the stable modification may occur with great slowness, even in presence of the stable form. This tardiness with which the stable condition of equilibrium is reached greatly increases in many cases the difficulty of accurately determining the transition point. The phenomena of suspended transformation will, however, receive a fuller discussion later (p. 68).
Transition Curve—Rhombic and Monoclinic Sulphur.—Just as we found the melting point of ice to vary with the pressure, so also do we find that change of pressure causes an alteration in the transition point. In the case of the transition point of rhombic into monoclinic sulphur, increase of pressure by 1 atm. raises the transition point by 0.04°-0.05°.[53] The transition curve, or curve representing the change of the transition point with pressure, will therefore slope to the right away from the pressure axis. This is curve OC (Fig. 5).
Triple Point—Monoclinic Sulphur, Liquid, and Vapour. Melting Point of Monoclinic Sulphur.—Above 95.5°, monoclinic sulphur is, as we have seen, the stable form. On being heated to 120°, under atmospheric pressure, it melts. This temperature is, therefore, the point of equilibrium between monoclinic sulphur and liquid sulphur under atmospheric pressure. Since we are dealing with a condensed system, this temperature may be regarded as very nearly that at which the solid and liquid are in equilibrium with their vapour, i.e. the triple point, solid (monoclinic)—liquid—vapour. This point is represented in the diagram by B.
Triple Point—Rhombic and Monoclinic Sulphur and Liquid.—In contrast with that of ice, the fusion point of monoclinic sulphur is raised by increase of pressure, and the fusion curve, therefore, slopes to the right. The transition curve of rhombic and monoclinic sulphur, as we have seen, also slopes to the right, and more so than the fusion curve of monoclinic sulphur. There will, therefore, be a certain pressure and temperature at which the two curves will cut. This point lies at 151°, and a pressure of 1320 kilogm. per sq. cm., or about 1288 atm.[54] It, therefore, forms another triple point, the existence of which had been predicted by Roozeboom,[55] at which rhombic and monoclinic sulphur are in equilibrium with liquid sulphur. It is represented in our diagram by the point C. Beyond this point monoclinic sulphur ceases to exist in a stable condition. At temperatures and pressures above this triple point, rhombic sulphur will be the stable modification, and this fact is of mineralogical interest, because it explains the occurrence in nature of well-formed rhombic crystals. Under ordinary conditions, prismatic sulphur separates out on cooling fused sulphur, but at temperatures above 151° and under pressures greater than 1288 atm., the rhombic form would be produced.[56]
Triple Point—Rhombic Sulphur, Liquid, and Vapour. Metastable Triple Point.—On account of the slowness with {39}which transformation of one form into the other takes place on passing the transition point, it has been found possible to heat rhombic sulphur up to its melting point (114.5°). At this temperature, not only is rhombic sulphur in a metastable condition, but the liquid is also metastable, its vapour pressure being greater than that of solid monoclinic sulphur. This point is represented in our diagram by the point b.
From the relative positions of the metastable melting point of rhombic sulphur and the stable melting point of monoclinic sulphur at 120°, we see that, of the two forms, the metastable form has the lower melting point. This, of course, is valid only for the relative stability in the neighbourhood of the melting point; for we have already learned that at lower temperatures rhombic sulphur is the stable, monoclinic sulphur the metastable (or unstable) form.
Fusion Curve of Rhombic Sulphur.—Like any other melting point, that of rhombic sulphur will be displaced by increase of pressure; increase of pressure raises the melting point, and we can therefore obtain a metastable fusion curve representing the conditions under which rhombic sulphur is in equilibrium with liquid sulphur. This metastable fusion curve must pass through the triple point for rhombic sulphur—monoclinic sulphur—liquid sulphur, and on passing this point it becomes a stable fusion curve. The continuation of this curve, therefore, above 151° forms the stable fusion curve of rhombic sulphur (curve CD).
These curves have been investigated at high pressures by Tammann, and the results are represented according to scale in Fig. 6,[57] a being the curve for monoclinic sulphur and liquid; b, that for rhombic sulphur and liquid; and c, that for rhombic and monoclinic sulphur.
Bivariant Systems.—Just as in the case of the diagram of states of water, the areas in Fig. 5 represent the conditions for the stable existence of the single phases: rhombic sulphur in the area to the left of AOCD; monoclinic sulphur in the area OBC; liquid sulphur in the area EBCD; sulphur vapour below the curves AOBE. As can be seen from the diagram, {40}the existence of monoclinic sulphur is limited on all sides, its area being bounded by the curves OB, OC, BC. At any point outside this area, monoclinic sulphur can exist only in a metastable condition.
 Fig. 6.
Other crystalline forms of sulphur have been obtained,[58] so that the existence of other systems of the one-component sulphur besides those already described is possible. Reference will be made to these later (p. 51).
C. Tin.
Another substance capable of existing in more than one crystalline form, is the metal tin, and although the general behaviour, so far as studied, is analogous to that of sulphur, a short account of the two varieties of tin may be given here, not only on account of their metallurgical interest, but also on account of the importance which the phenomena possess for the employment of this metal in everyday life.
After a winter of extreme severity in Russia (1867-1868), the somewhat unpleasant discovery was made that a number of blocks of tin, which had been stored in the Customs House at St. Petersburg, had undergone disintegration and crumbled to a grey powder.[59] That tin undergoes change on exposure to extreme cold was known, however, before that time, even as far back as the time of Aristotle, who spoke of the tin as "melting."[60] Ludicrous as that term may now appear, Aristotle nevertheless unconsciously employed a strikingly accurate analogy, for the conditions under which ordinary white tin passes into the grey modification are, in many ways, quite analogous to those under which a substance passes from the solid to the liquid state. The knowledge of this was, however, beyond the wisdom of the Greek philosopher.
For many years there existed considerable confusion both as to the conditions under which the transformation of white tin into its allotropic modification occurs, and to the reason of the change. Under the guidance of the Phase Rule, however, the confusion which obtained has been cleared away, and the "mysterious" behaviour of tin brought into accord with other phenomena of transformation.[61]
Transition Point.—Just as in the case of sulphur, so also in the case of tin, there is a transition point above which the {42}one form, ordinary white tin, and below which the other form, grey tin, is the stable variety. In the case of this metal, the transition point was found by Cohen and van Eyk, who employed both the dilatometric and the electrical methods (Appendix) to be 20°. Below this temperature, grey tin is the stable form. But, as we have seen in the case of sulphur, the change of the metastable into the stable solid phase occurs with considerable slowness, and this behaviour is found also in the case of tin. Were it not so, we should not be able to use this metal for the many purposes to which it is applied in everyday life; for, with the exception of a comparatively small number of days in the year, the temperature of our climate is below 20°, and white tin is, therefore, at the ordinary temperature, in a metastable condition. The change, however, into the stable form at the ordinary temperature, although slow, nevertheless takes place, as is shown by the partial or entire conversion of articles of tin which have lain buried for several hundreds of years.
On lowering the temperature, the velocity with which the transformation of the tin occurs is increased, and Cohen and van Eyk found that the temperature of maximum velocity is about -50°. Contact with the stable form will, of course, facilitate the transformation.
The change of white tin into grey takes place also with increased velocity in presence of a solution of tin ammonium chloride (pink salt), which is able to dissolve small quantities of tin. In presence of such a solution also, it was found that the temperature at which the velocity of transformation was greatest was raised to 0°. At this temperature, white tin in contact with a solution of tin ammonium chloride, and the grey modification, undergoes transformation to an appreciable extent in the course of a few days.
Fig. 7 is a photograph of a piece of white tin undergoing transformation into the grey variety.[62] The bright surface of the tin becomes covered with a number of warty masses, formed of the less dense grey form, and the number and size of these continue to grow until the whole of the white tin has passed {43}into a grey powder. On account of the appearance which is here seen, this transformation of tin has been called by Cohen the "tin plague."
 Fig. 7.
Enantiotropy and Monotropy.—In the case of sulphur and tin, we have met with two substances existing in polymorphic forms, and we have also learned that these forms exhibit a definite transition point at which their relative stability is reversed. Each form, therefore, possesses a definite range of stable existence, and is capable of undergoing transformation into the other, at temperatures above or below that of the transition point.
Another class of dimorphous substances is, however, met with as, for instance, in the case of the well-known compounds iodine monochloride and benzophenone. Each crystalline form has its own melting point, the dimorphous forms of iodine monochloride melting at 13.9° and 27.2°,[63] and those of benzophenone at 26° and 48°.[64] This class of substance differs from that which we have already studied (e.g. sulphur and tin), in that at all temperatures up to the melting point, only one of the forms is stable, the other being metastable. There is, therefore, no transition point, and transformation of the crystalline forms can be observed only in one direction. These two classes of phenomena are distinguished by the names enantiotropy and monotropy; enantiotropic substances being such that the change of one form into the other is a reversible process (e.g. rhombic sulphur into monoclinic, and monoclinic sulphur into rhombic), and monotropic substances, those in which the transformation of the crystalline forms is irreversible.
 Fig. 9.
 Fig. 8.
These differences in the behaviour can be explained very well in many cases by supposing that in the case of enantiotropic substances the transition point lies below the melting point, while in the case of monotropic substances, it lies above the melting point.[65] These conditions would be represented by the Figs. 8 and 9.
In these two figures, O3 is the transition point, O1 and O2 the melting points of the metastable and stable forms {45}respectively. From Fig. 9 we see that the crystalline form I. at all temperatures up to its melting point is metastable with respect to the form II. In such cases the transition point could be reached only at higher pressures.
Although, as already stated, this explanation suffices for many cases, it does not prove that in all cases of monotropy the transition point is above the melting point of the two forms. It is also quite possible that the transition point may lie below the melting points;[66] in this case we have what is known as pseudomonotropy. It is possible that graphite and diamond,[67] perhaps also the two forms of phosphorus, stand in the relation of pseudomonotropy (v. p. 49).
The disposition of the curves in Figs. 8 and 9 also explains the phenomenon sometimes met with, especially in organic chemistry, that the substance first melts, then solidifies, and remelts at a higher temperature. On again determining the melting point after re-solidification, only the higher melting point is obtained.
The explanation of such a behaviour is, that if the determination of the melting point is carried out rapidly, the point O1, the melting point of the metastable solid form, may be realized. At this temperature, however, the liquid is metastable with respect to the stable solid form, and if the temperature is {46}not allowed to rise above the melting point of the latter, the liquid may solidify. The stable solid modification thus obtained will melt only at a higher temperature.
D. Phosphorus.
An interesting case of a monotropic dimorphous substance is found in phosphorus, which occurs in two crystalline forms; white phosphorus belonging to the regular system, and red phosphorus belonging to the hexagonal system. From determinations of the vapour pressures of liquid white phosphorus, and of solid red phosphorus,[68] it was found that the vapour pressure of red phosphorus was considerably lower than that of liquid white phosphorus at the same temperature, the values obtained being given in the following table.
Vapour Pressures of White and Red Phosphorus.
| Vapour pressure of liquid white phosphorus. | Vapour pressure of red phosphorus. | ||||
| Temperature. | Pressure in cm. | Temperature. | Pressure in atm. | Temperature. | Pressure in atm. |
| 165° | 12 | 360° | 3.2 | 360° | 0.1 |
| 180° | 20.4 | 440° | 7.5 | 440° | 1.75 |
| 200° | 26.6 | 494° | 18.0 | 487° | 6.8 |
| 219° | 35.9 | 503° | 21.9 | 510° | 10.8 |
| 230° | 51.4 | 511° | 26.2 | 531° | 16.0 |
| 290° | 76.0 | — | — | 550° | 31.0 |
| — | — | — | — | 577° | 56.0 |
These values are also represented graphically in Fig. 10.
 Fig. 10.
At all temperatures above about 260°, transformation of the white into the red modification takes place with appreciable velocity, and this velocity increases as the temperature is raised. Even at lower temperatures, e.g. at the ordinary temperature, the velocity of transformation is increased under the influence {47}of light,[69] or by the presence of certain substances, e.g. iodine,[70] just as the velocity of transformation of white tin into the grey modification was increased by the presence of a solution of tin ammonium chloride (p. 40). At the ordinary temperature, therefore, white phosphorus must be considered as the less stable (metastable) form, for although it can exist in contact with red phosphorus for a long period, its vapour pressure, as we have seen, is greater than that of the red modification, and also, its solubility in different solvents is greater[71] than that of the red modification; as we shall find later, the solubility of the metastable form is always greater than that of the stable.
The relationships which are met with in the case of phosphorus can be best represented by the diagram, Fig. 11.[72]
In this figure, BO1 represents the conditions of equilibrium of the univariant system red phosphorus and vapour, which ends at O1, the melting point of red phosphorus. By heating in capillary tubes of hard glass, Chapman[73] found that red phosphorus melts at the melting point of potassium iodide, i.e. about 630°,[74] but the pressure at this temperature is unknown.
At O1, then, we have the triple point, red phosphorus, liquid, and vapour, and starting from it, we should have the {48}vaporization curve of liquid phosphorus, O1A, and the fusion curve of red phosphorus, O1F. Although these have not been determined, the latter curve must, from theoretical considerations (v. p. 58), slope slightly to the right; i.e. increase of pressure raises the melting point of red phosphorus.
 Fig. 11.
When white phosphorus is heated to 44°, it melts. At this point, therefore, we shall have another triple point, white phosphorus—liquid—vapour; the pressure at this point has been calculated to be 3 mm.[75] This point is the intersection of three curves, viz. sublimation curve, vaporization curve, and the fusion curve of white phosphorus. The fusion curve, O2E, has been determined by Tammann[76] and by G. A. Hulett,[77] and it was found that increase of pressure by 1 atm. raises the melting point by 0.029°. The sublimation curve of white phosphorus has not yet been determined.
As can be seen from the table of vapour pressures (p. 46), the vapour pressure of white phosphorus has been determined up to 500°; at temperatures above this, however, the velocity with which transformation into red phosphorus takes place is so great as to render the determination of the vapour pressure {49}at higher temperatures impossible. Since, however, the difference between white phosphorus and red phosphorus disappears in the liquid state, the vapour pressure curve of white phosphorus must pass through the point O1, the melting point of red phosphorus, and must be continuous with the curve O1A, the vapour pressure curve of liquid phosphorus (vide infra). Since, as Fig. 10 shows, the vapour pressure curve of white phosphorus ascends very rapidly at higher temperatures, the "break" between BO1 and O1A must be very slight.
As compared with monotropic substances like benzophenone, phosphorus exhibits the peculiarity that transformation of the metastable into the stable modification takes place with great slowness; and further, the time required for the production of equilibrium between red phosphorus and phosphorus vapour is great compared with that required for establishing the same equilibrium in the case of white phosphorus. This behaviour can be best explained by the assumption that change in the molecular complexity (polymerization) occurs in the conversion of white into red phosphorus, and when red phosphorus passes into vapour (depolymerization).[78]
This is borne out by the fact that measurements of the vapour density of phosphorus vapour at temperatures of 500° and more, show it to have the molecular weight represented by P4,[79] and the same molecular weight has been found for phosphorus in solution.[80] On the other hand, it has recently been shown by R. Schenck,[81] that the molecular weight of red phosphorus is at least P8, and very possibly higher.
In the case of phosphorus, therefore, it is more than possible that we are dealing, not simply with two polymorphic {50}forms of the same substance, but with polymeric forms, and that there is no transition point at temperatures above the absolute zero, unless we assume the molecular complexity of the two forms to become the same. The curve for red phosphorus would therefore lie below that of white phosphorus, for the vapour pressure of the polymeric form, if produced from the simpler form with evolution of heat, must be lower than that of the latter. A transition point would, of course, become possible if the sign of the heat effect in the transformation of the one modification into the other should change. If, further, the liquid which is produced by the fusion of red phosphorus at 630° under high pressure also exists in a polymeric form, greater than P4, then the metastable vaporization curve of white phosphorus would not pass through the melting point of red phosphorus, as was assumed above.[82]
We have already seen in the case of water (p. 31) that the vapour pressure of supercooled water is greater than that of ice, and that therefore it is possible, theoretically at least, by a process of distillation, to transfer the water from one end of a closed tube to the other, and to there condense it as ice. On account of the very small difference between the vapour pressure of supercooled water and ice, this distillation process has not been experimentally realized. In the case of phosphorus, however, where the difference in the vapour pressures is comparatively great, it has been found possible to distil white phosphorus from one part of a closed tube to another, and to there condense it as red phosphorus; and since the vapour pressure of red phosphorus at 350° is less than the vapour pressure of white phosphorus at 200°, it is possible to carry out the distillation from a colder part of the tube to a hotter, by having white phosphorus at the former and red phosphorus at the latter. Such a process of distillation has been carried out by Troost and Hautefeuille between 324° and 350°.[83]
Relationships similar to those found in the case of phosphorus are also met with in the case of cyanogen and {51}paracyanogen, which have been studied by Chappuis,[84] Troost and Hautefeuille,[85] and Dewar,[86] and also in the case of other organic substances.
Enantiotropy combined with Monotropy.—Not only can polymorphic substances exhibit enantiotropy or monotropy, but, if the substance is capable of existing in more than two crystalline forms, both relationships may be found, so that some of the forms may be enantiotropic to one another, while the other forms exhibit only monotropy. This behaviour is seen in the case of sulphur, which can exist in as many as eight different crystalline varieties. Of these only monoclinic and rhombic sulphur exhibit the relationship of enantiotropy, i.e. they possess a definite transition point, while the other forms are all metastable with respect to rhombic and monoclinic sulphur, and remain so up to the melting point; that is to say, they are monotropic modifications.[87]
E. Liquid Crystals.
Phenomena observed.—In 1888 it was discovered by Reinitzer[88] that the two substances, cholesteryl acetate and cholesteryl benzoate, possess the peculiar property of melting sharply at a definite temperature to milky liquids; and that the latter, on being further heated, suddenly become clear, also at a definite temperature. Other substances, more especially p-azoxyanisole and p-azoxyphenetole, were, later, found to possess the same property of having apparently a double melting point.[89] On cooling the clear liquids, the reverse series of changes occurred.
The turbid liquids which were thus obtained were found to possess not only the usual properties of liquids (such as the {52}property of flowing and of assuming a perfectly spherical shape when suspended in a liquid of the same density), but also those properties which had hitherto been observed only in the case of solid crystalline substances, viz. the property of double refraction and of giving interference colours when examined by polarized light; the turbid liquids are anisotropic. To such liquids, the optical properties of which were discovered by O. Lehmann,[90] the name liquid crystals, or crystalline liquids, was given.
Nature of Liquid Crystals.—During the past ten years the question as to the nature of liquid crystals has been discussed by a number of investigators, several of whom have contended strongly against the idea of the term "liquid" being applied to the crystalline condition; and various attempts have been made to prove that the turbid liquids are in reality heterogeneous and are to be classed along with emulsions.[91] This view was no doubt largely suggested by the fact that the anisotropic liquids were turbid, whereas the "solid" crystals were clear. Lehmann found, however, that, when examined under the microscope, the "simple" liquid crystals were also clear,[92] the apparent turbidity being due to the aggregation of a number of differently oriented crystals, in the same way as a piece of marble does not appear transparent although composed of transparent crystals.[93]
Further, no proof of the heterogeneity of liquid crystals has yet been obtained, but rather all chemical and physical investigations indicate that they are homogeneous.[94] No separation {53}of a solid substance from the milky, anisotropic liquids has been effected; the anisotropic liquid is in some cases less viscous than the isotropic liquid formed at a higher temperature; and the temperature of liquefaction is constant, and is affected by pressure and admixture with foreign substances exactly as in the case of a pure substance.[95]
 Fig. 12.
Equilibrium Relations in the Case of Liquid Crystals.—Since, now, we have seen that we are dealing here with substances in two crystalline forms (which we may call the solid and liquid[96] crystalline form), which possess a definite transition point, at which, transformation of the one form into the other occurs in both directions, we can represent the conditions of equilibrium by a diagram in all respects similar to that employed in the case of other enantiotropic substances, e.g. sulphur (p. 35).
In Fig. 12 there is given a diagrammatic representation of the relationships found in the case of p-azoxyanisole.[97]
Although the vapour pressure of the substance in the solid, or liquid state, has not been determined, it will be understood from what we have already learned, that the curves AO, OB, BC, representing the vapour pressure of solid crystals, liquid crystals, isotropic liquid, must have the relative positions shown in the diagram. Point O, the transition point of the solid into the liquid crystals, lies at 118.27°, and the change of the transition point with the pressure is +0.032° pro 1 atm. The transition curve OE slopes, therefore, slightly to the right. The point B, the melting point of the liquid crystals, lies at 135.85°, and the melting point is raised 0.0485° pro 1 atm. The curve BD, therefore, also slopes to the right, and more so than the transition curve. In this respect azoxyanisole is different from sulphur.
The areas bounded by the curves represent the conditions for the stable existence of the four single phases, solid crystals, liquid crystals, isotropic liquid and vapour.
The most important substances hitherto found to form liquid crystals are[98]:—
| Substance. | Transition point. | Melting point. |
| Cholesteryl benzoate | 145.5° | 178.5° |
| Azoxyanisole | 118.3° | 135.9° |
| Azoxyphenetole | 134.5° | 168.1° |
| Condensation product from benzaldehyde and benzidine | 234° | 260° |
| Azine of p-oxyethylbenzaldehyde | 172° | 196° |
| Condensation product from p-tolylaldehyde and benzidine | 231° | — |
| p-Methoxycinnamic acid | 169° | 185° |
GENERAL SUMMARY
In the preceding pages we have learned how the principles of the Phase Rule can be applied to the elucidation of various systems consisting of one component. In the present chapter it is proposed to give a short summary of the relationships we have met with, and also to discuss more generally how the Phase Rule applies to other one-component systems. On account of the fact that beginners are sometimes inclined to expect too much of the Phase Rule; to expect, for example, that it will inform them as to the exact behaviour of a substance, it may here be emphasized that the Phase Rule is a general rule; it informs us only as to the general conditions of equilibrium, and leaves the determination of the definite, numerical data to experiment.
Triple Point.—We have already (p. 28) defined a triple point in a one-component system, as being that pressure and temperature at which three phases coexist in equilibrium; it represents, therefore, an invariant system (p. 16). At the triple point also, three curves cut, viz. the curves representing the conditions of equilibrium of the three univariant systems formed by the combination of the three phases in pairs. The most common triple point of a one-component system is, of course, the triple point, solid, liquid, vapour (S-L-V), but other triple points[99] are also possible when, as in the case of {56}sulphur or benzophenone, polymorphic forms occur. Whether or not all the triple points can be experimentally realized will, of course, depend on circumstances. We shall, in the first place, consider only the triple point S-L-V.
As to the general arrangement of the three univariant curves around the triple point, the following rules may be given. (1) The prolongation of each of the curves beyond the triple point must lie between the other two curves. (2) The middle position at one and the same temperature in the neighbourhood of the triple point is taken by that curve (or its metastable prolongation) which represents the two phases of most widely differing specific volume.[100] That is to say, if a line of constant temperature is drawn immediately above or below the triple point so as to cut the three curves—two stable curves and the metastable prolongation of the third—the position of the curves at that temperature will be such that the middle position is occupied by that curve (or its metastable prolongation) which represents the two phases of most widely differing specific volume.
Now, although these rules admit of a considerable variety of possible arrangements of curves around the triple point,[101] only two of these have been experimentally obtained in the case of the triple point solid—liquid—vapour. At present, therefore, we shall consider only these two cases (Figs. 13 and 14).
 Fig. 14.
 Fig. 13.
An examination of these two figures shows that they satisfy the rules laid down. Each of the curves on being prolonged passes between the other two curves. In the case of substances of the first type (Fig. 13), the specific volume of the solid is greater than that of the liquid (the substance contracts on fusion); the difference of specific volume will, therefore, be greatest between liquid and vapour. The curve, therefore, for liquid and vapour (or its prolongation) must lie between the other two curves; this is seen from the figure to be the case. Similarly, the rule is satisfied by the arrangement of curves in Fig. 14, where the difference of specific volumes is {57}greatest between the solid and vapour. In this case the curve S-V occupies the intermediate position.
As we see, the two figures differ from one another only in that the fusion curve OC in one case slopes to the right away from the pressure axis, thus indicating that the melting point is raised by increase of pressure; in the other case, to the left, indicating a lowering of the melting point with the pressure. These conditions are found exemplified in the case of sulphur and ice (pp. 29 and 35). We see further from the two figures, that O in Fig. 13 gives the highest temperature at which the solid can exist, for the curve for solid—liquid slopes back to regions of lower temperature; in Fig. 14, O gives the lowest temperature at which the liquid phase can exist as stable phase.[102]
Theorems of van't Hoff and of Le Chatelier.—So far we have studied only the conditions under which various systems exist in equilibrium; and we now pass to a consideration of the changes which take place in a system when the external conditions of temperature and pressure are altered. For all such changes there exist two theorems, based on the laws of thermodynamics, by means of which the alterations in a system can be qualitatively predicted.[103] The first of these, usually {58}known as van't Hoff's law of movable equilibrium,[104] states: When the temperature of a system in equilibrium is raised, that reaction takes place which is accompanied by absorption of heat; and, conversely, when the temperature is lowered, that reaction occurs which is accompanied by an evolution of heat.
The second of the two theorems refers to the effect of change of pressure, and states:[105] When the pressure on a system in equilibrium is increased, that reaction takes place which is accompanied by a diminution of volume; and when the pressure is diminished, a reaction ensues which is accompanied by an increase of volume.
The demonstration of the universal applicability of these two theorems is due chiefly to Le Chatelier, who showed that they may be regarded as consequences of the general law of action and reaction. For this reason they are generally regarded as special cases of the more general law, known as the theorem of Le Chatelier, which may be stated in the words of Ostwald, as follows:[106] If a system in equilibrium is subjected to a constraint by which the equilibrium is shifted, a reaction takes place which opposes the constraint, i.e. one by which its effect is partially destroyed.
This theorem of Le Chatelier is of very great importance, for it applies to all systems and changes of the condition of equilibrium, whether physical or chemical; to vaporization and fusion; to solution and chemical action. In all cases, whenever changes in the external condition of a system in equilibrium are produced, processes also occur within the system which tend to counteract the effect of the external changes.
Changes at the Triple Point.—If now we apply this theorem to equilibria at the triple point S-L-V, and ask what changes will occur in such a system when the external conditions of pressure and temperature are altered, the general answer to the question will be: So long as the three phases are present, no {59}change in the temperature or pressure of the system can occur, but only changes in the relative amounts of the phases; that is to say, the effect on the system of change in the external conditions is opposed by the reactions or changes which take place within the system (according to the theorems of van't Hoff and Le Chatelier). We now proceed to discuss what these changes are, and shall consider first the effect of alteration of the temperature at constant volume and constant pressure, and then the effect of alteration of the pressure both when the temperature remains constant and when it varies.
When the volume is kept constant, the effect of the addition of heat
to a system at the triple point S-L-V differs somewhat according as there
is an increase or diminution of volume when the solid passes into the
liquid state. In the former and most general case (Fig. 14), addition of
heat will cause a certain amount of the solid phase to melt, whereby the
heat which is added becomes latent; the temperature of the system
therefore does not rise. Since, however, the melting of the solid is
accompanied by an increase of volume, whereby an increase of pressure
would result, a certain portion of the vapour must condense to liquid, in
order that the pressure may remain constant. The total effect of addition
of heat, therefore, is to cause both solid and vapour to pass into
liquid, i.e. there occurs the change S + V  L. It will,
therefore, depend on the relative quantities of solid and vapour, which
will disappear first. If the solid disappears first, then we shall pass
to the system L-V; if vapour disappears first, we shall obtain the system
S-L. Withdrawal of heat causes the reverse change, L S + V; at all
temperatures below the triple point the liquid is unstable or metastable
(p. 30).
L. It will,
therefore, depend on the relative quantities of solid and vapour, which
will disappear first. If the solid disappears first, then we shall pass
to the system L-V; if vapour disappears first, we shall obtain the system
S-L. Withdrawal of heat causes the reverse change, L S + V; at all
temperatures below the triple point the liquid is unstable or metastable
(p. 30).
When fusion is accompanied by a diminution of volume (e.g. ice,
Fig. 13), then, since the melting of the solid phase would decrease the
total volume, i.e. would lower the pressure, a certain quantity of
the solid must also pass into vapour in order that the pressure may be
maintained constant. On addition of heat, therefore, there occurs the
reaction S L + V; withdrawal of heat causes the reverse change L
+ V S. Above the
temperature of the triple point the {60}solid cannot exist; below
the triple point both systems, S-L and S-V, can exist, and it will
therefore depend on the relative amounts of liquid and vapour which of
these two systems is obtained on withdrawing heat from the system at
constant volume.
The same changes in the phases occur when heat is added or withdrawn at constant pressure, so long as the three phases are present. Continued addition of heat, however, at constant pressure will ultimately cause the formation of the bivariant system vapour alone; continued withdrawal of heat will ultimately cause the formation of solid alone. This will be readily understood from Fig. 15. The dotted line D′OD is a line of constant pressure; on adding heat, the system passes along the line OD into the region of vapour; on heat being withdrawn, the system passes along OD′ into the area of solid.
 Fig. 15.
Similar changes are produced when the volume of the system is altered.
Alteration of volume may take place either while transference of heat to
or from the system is cut off (adiabatic change), or while such
transference may occur (isothermal change). In the latter case, the
temperature of the system will remain constant; in the former case, since
at the triple point the pressure must be constant so long as the three
phases are present, increase of volume must be compensated by the
evaporation of liquid. This, however, would cause the temperature to fall
(since communication of heat from the outside is supposed to be cut off),
and a portion of the liquid must therefore freeze. In this way the latent
heat of evaporation is counterbalanced by the latent heat of fusion. As
the result of increase of volume, therefore, the process occurs L S + V. Diminution of
volume, without transference of heat, will bring about the opposite
change, S + V L. In the former case there is ultimately obtained the
univariant system S-V; in the latter case there will be {61}obtained either
S-L or L-V according as the vapour or solid phase disappears first.
This argument holds good for both types of triple point shown in Figs. 13 and 14 (p. 57). A glance at these figures will show that increase of volume (diminution of pressure) will lead ultimately to the system S-V, for at pressures lower than that of the triple point, the liquid phase cannot exist. Decrease of volume (increase of pressure), on the other hand, will lead either to the system S-L or L-V, because these systems can exist at pressures higher than that of the triple point. If the vapour phase disappears and we pass to the curve S-L, continued diminution of volume will be accompanied by a fall in temperature in the case of systems of the first type (Fig. 13), and by a rise in temperature in the case of systems of the second type (Fig. 14).
 Fig. 17.
 Fig. 16.
Lastly, if the temperature is maintained constant, i.e. if heat can pass into or out of the system, then on changing the volume the same changes in the phases will take place as described above until one of the phases has disappeared. Continued increase of volume (decrease of pressure) will then cause the disappearance of a second phase, the system passing along the dotted line OE′ (Figs. 16, 17), so that ultimately there remains only the vapour phase. Conversely, diminution of volume (increase of pressure) will ultimately lead either to solid (Fig. 16) or to liquid alone (Fig. 17), the system passing along the dotted line OE. {62}
In discussing the alterations which may take place at the triple point with change of temperature and pressure, we have considered only the triple point S-L-V. The same reasoning, however, applies, mutatis mutandis, to all other triple points, so that if the specific volumes of the phases are known, and the sign of the heat effects which accompany the transformation of one phase into the other, it is possible to predict (by means of the theorem of Le Chatelier) the changes which will be produced in the system by alteration of the pressure and temperature.
In all cases of transformation at the triple point, it should be noted that all three phases are involved in the change,[107] and not two only; the fact that in the case, say, of the transformation from solid to liquid, or liquid to solid, at the melting point with change of temperature, only these two phases appear to be affected, is due to there generally being a large excess of the vapour phase present and to the prior disappearance therefore of the solid or liquid phase.
In the case of triple points at which two solid phases are in equilibrium with liquid, other arrangements of the curves around the triple point are found. It is, however, unnecessary to give a general treatment of these here, since the principles which have been applied to the triple point S-L-V can also be applied to the other triple points.[108]
Triple Point Solid—Solid—Vapour.—The triple point solid—solid—vapour is one which is of considerable importance. Examples of such a triple point have already been given in sulphur and tin, and a list of other substances capable of yielding two solid phases is given below. The triple point S-S-V is not precisely the same as the transition point, but is very nearly so. The transition point is the temperature at which the relative stability of the two solid phases undergoes change, when the vapour phase is absent and the pressure is 1 atm.; whereas at the triple point the pressure is that of the system itself. The transition point, therefore, bears the same relation to the triple point S-S-V as the melting point to the triple point S-L-V.
In the following table is given a list of the most important polymorphous substances, and the temperatures of the transition point.[109]
| Substance. | Transition temperature. |
| Ammonium nitrate— | |
| β-rhombic α-rhombic | 35° |
| α-rhombic rhombohedral | 83° |
| Rhombohedral regular | 125° |
| Mercuric iodide | 126° |
| Potassium nitrate | 129° |
| Silver iodide | 145° |
| Silver nitrate | 160° |
| Sulphur | 95.5° |
| Tetrabrommethane | 46.8° |
| Thallium nitrate— | |
| Rhombic rhombohedral | 80° |
| Rhombohedral regular | 142.5° |
| Thallium picrate | 46° |
| Tin | 20° |
Sublimation and Vaporization Curves.—We have already seen, in the case of ice and liquid water, that the vapour pressure increases as the temperature rises, the increase of pressure per degree being greater the higher the temperature. The sublimation and vaporization curves, therefore, are not straight lines, but are bent, the convex side of the curve being towards the temperature axis in the ordinary pt-diagram.
In the case of sulphur and of tin, we assumed vapour to be given off by the solid substance, although the pressure of the vapour has not hitherto been measured. The assumption, however, is entirely justified, not only on theoretical grounds, but also because the existence of a vapour pressure has been observed in the case of many solid substances at temperatures much below the melting point,[110] and in some cases, e.g. camphor,[111] the vapour pressure is considerable.
As the result of a large number of determinations, it has been found that all vapour pressure curves have the same general form alluded to above. Attempts have also been made to obtain a general expression for the quantitative changes in the vapour pressure with change of temperature, but without success. Nevertheless, the qualitative changes, or the general direction of the curves, can be predicted by means of the theorem of Le Chatelier.
As we have already learned (p. 16), the Phase Rule takes no account of the molecular complexity of the substances participating in an equilibrium. A dissociating substance, therefore, in contact with its vaporous products of dissociation (e.g. ammonium chloride in contact with ammonia and hydrogen chloride), will likewise constitute a univariant system of one component, provided the composition of the vapour phase as a whole is the same as that of the solid or liquid phase (p. 13). For all such substances, therefore, the conditions of equilibrium will be represented by a curve of the same general form as the vapour pressure curve of a non-dissociating substance.[112] The same behaviour is also found in the case of substances which polymerize on passing into the solid or liquid state (e.g. red phosphorus). Where such changes in the molecular state occur, however, the time required for equilibrium to be established is, as a rule, greater than when the molecular state is the same in both phases.
From an examination of Figs. 13 and 14, it will be easy to predict the effect of change of pressure and temperature on the univariant systems S-V or L-V. If the volume is kept constant, addition of heat will cause an increase of pressure, the system S-V moving along the curve AO until at the triple point the liquid phase is formed, and the system L-V moving along the curve OB; so long as two phases are present, the condition of the system must be represented by these two curves. Conversely, withdrawal of heat will cause condensation of vapour, and therefore diminution of pressure; the system will therefore move along the vaporization or sublimation curve to lower temperatures and pressures, so long as the system remains univariant.
If transference of heat to or from the system is prevented, increase of volume (diminution of pressure) will cause the system L-V to pass along the curve BO; liquid will pass into vapour and the temperature will fall.[113] At O solid may appear, and the temperature of the system will then remain constant until the liquid phase has disappeared (p. 57); the system will then follow the curve OA until the solid phase disappears, and we are ultimately left with vapour. On the other hand, diminution of volume (increase of pressure) will cause condensation of vapour, and the system S-V will pass along the curve AO to higher temperatures and pressures; at O the solid will melt, and the system will ultimately pass to the curve OB or to OC (p. 57).
Addition or withdrawal of heat at constant pressure, and increase or diminution of the pressure at constant temperature, will cause the system to pass along lines parallel to the temperature and the pressure axis respectively; the working out of these changes may be left to the reader, guided by what has been said on pp. 60 and 61.
The sublimation curve of all substances, so far as yet found, has its upper limit at the melting point (triple point), although the possibility of the existence of a superheated solid is not excluded. The lower limit is, theoretically at least, at the absolute zero, provided no new phase, e.g. a different crystalline modification, is formed. If the sublimation pressure of a substance is greater than the atmospheric pressure at any temperature below the point of fusion, then the substance will sublime without melting when heated in an open vessel; and fusion will be possible only at a pressure higher than the atmospheric. This is found, for example, in the case of red phosphorus (p. 47). If, however, the sublimation pressure of a substance at its triple point S-L-V is less than one atmosphere, then the substance will melt when heated in an open vessel.
In the case of the vaporization curve, the upper limit lies at the critical point where the liquid ceases to exist;[114] the {66}lower limit is determined by the range of the metastable state of the supercooled liquid.
The interpolation and extrapolation of vapour-pressure curves is rendered very easy by means of a relationship which Ramsay and Young[115] found to exist between the vapour-pressure curves of different substances. It was observed that in the case of closely related substances, the ratio of the absolute temperatures corresponding to equal vapour pressures is constant, i.e. T1/T′1 = T2/T′2. When the two substances are not closely related, it was found that the relationship could be expressed by the equation T1/T′1 = T2/T′2 + c(t′ - t) where c is a constant having a small positive or negative value, and t′ and t are the temperatures at which one of the substances has the two values of the vapour pressure in question. By means of this equation, if the vapour-pressure curve of one substance is known, the vapour-pressure curve of any other substance can be calculated from the values at any two temperatures of the vapour pressure of that substance.
Fusion Curve—Transition Curve.—The fusion curve represents the conditions of equilibrium between the solid and liquid phase; it shows the change of the melting point of a substance with change of pressure.
As shown in Figs. 13 and 14, the fusion curve is inclined either towards the pressure axis or away from it; that is, increase of pressure can either lower or raise the melting point. It is easy to predict in a qualitative manner the different effect of pressure on the melting point in the two cases mentioned, if we consider the matter in the light of the theorem of Le Chatelier (p. 58). Water, on passing into ice, expands; therefore, if the pressure on the system ice—water be increased, a reaction will take place which is accompanied by a diminution in volume, i.e. the ice will melt. Consequently, a lower temperature will be required in order to counteract the effect of increase of pressure; or, in other words, the melting point will {67}be lowered by pressure.[116] In the second case, the passage of the liquid to the solid state is accompanied by a diminution of volume; the effect of increase of pressure will therefore be the reverse of that in the previous case.
If the value of the heat of fusion and the alteration of volume accompanying the change of state are known, it is possible to calculate quantitatively the effect of pressure.[117]
We have already seen (p. 25) that the effect of pressure on the melting point of a substance was predicted as the result of theoretical considerations, and was first proved experimentally in the case of ice. Soon after, Bunsen[118] showed that the melting point of other substances is also affected by pressure; and in more recent years, ample experimental proof of the change of the melting point with the pressure has been obtained. The change of the melting point is, however, small; as a rule, increase of pressure by 1 atm. changes the melting point by about 0.03°, but in the case of water the change is much less (0.0076°), and in the case of camphor much more (0.13°). In other words, if we take the mean case, an increase of pressure of more than 30 atm. is required to produce a change in the melting point of 1°.
Investigations which were made of the influence of pressure on the melting-point, showed that up to pressures of several hundred atmospheres the fusion curve is a straight line.[119] Tammann[120] has, however, found that on increasing the pressure the fusion curve no longer remains straight, but bends towards the pressure axis, so that, on sufficiently increasing the pressure, a maximum temperature might at length be reached. This maximum has, so far, however, not been attained, although the melting point curves of various substances have been studied up to pressures of 4500 atm. This is to be accounted for partly {68}by the fact that the probable maximum temperature in the case of most substances lies at very great pressures, and also by the fact that other solid phases make their appearance, as, for example, in the case of ice (p. 32).
As to the upper limit of the fusion curve, the view has been expressed[121] that just as in the case of liquid and vapour, so also in the case of solid and liquid, there exists a critical point at which the solid and the liquid phase become identical. Experimental evidence, however, does not appear to favour this view.[122]
The transition point, like the melting point, is also influenced by the pressure, and in this case also it is found that pressure may either raise or lower the transition point, so that the transition curve may be inclined either away from or towards the pressure axis. The direction of the transition curve can also be predicted if the change of volume accompanying the passage of one form into the other is known. In the case of sulphur, we saw that the transition point is raised by increase of pressure; in the case of the transition of rhombohedral into α-rhombic form of ammonium nitrate, however, the transition point is lowered by pressure, as shown by the following table.[123]
| Temperature. | Pressure. |
| 85.85° | 1 atm. |
| 84.38° | 100 " |
| 83.03° | 200 " |
| 82.29° | 250 " |
So far as investigations have been carried out, it appears that in most cases the transition curve is practically a straight line.
It has, however, been found in the case of Glauber's salt, that with increase of pressure the transition curve passes through a point of maximum temperature, and exhibits, therefore, a form similar to that assumed by Tammann for the fusion curve.[124]
Suspended Transformation. Metastable Equilibria.—Hitherto we have considered only systems in stable equilibrium. We have, however, already seen, in the case of water, that on cooling the liquid down to the triple point, solidification did not necessarily take place, although the conditions were such as to allow of its formation. Similarly, we saw that rhombic sulphur can be heated above the transition point, and monoclinic sulphur can be obtained at temperatures below the transition point, although in both cases transformation into a more stable form is possible; the system becomes metastable.
The same reluctance to form a new phase is observed also in the phenomena of superheating of liquids, and in the "hanging" of mercury in barometers, in which case the vapour phase is not formed. In general, then, we may say that a new phase will not necessarily be formed immediately the system passes into such a condition that the existence of that phase is possible; but rather, instead of the system undergoing transformation so as to pass into the most stable condition under the existing pressure and temperature, this transformation will be "suspended" or delayed, and the system will become metastable. Only in the case of the formation of the liquid from the solid phase, in a one-component system, has this reluctance to form a new phase not been observed.
To ensure the formation of the new phase, it is necessary to have that phase present. The presence of the solid phase will prevent the supercooling of the liquid; and the presence of the vapour phase will prevent the superheating of the liquid. However, even in the presence of the more stable phase, transformation of the metastable phase occurs with very varying velocity; in some cases so quickly as to appear almost instantaneous; while in other cases, the change takes place so slowly as to require hundreds of years for its achievement. It is this slow rate of transformation that renders the existence of metastable forms possible, when in contact with the more stable phase. Thus, for example, although calcite is the most stable form of calcium carbonate at the ordinary temperature,[125] the less stable {70}modification, aragonite, nevertheless exists under the ordinary conditions in an apparently very stable state.
As to the amount of the new phase required to bring about the transformation of the metastable phase, quantitative measurements have been carried out only in the case of the initiation of crystallization in a supercooled liquid.[126] As the result of these investigations, it was found that, in the case of superfused salol, the very small amount of 1 × 10⁻⁷ gm. of the solid phase was sufficient to induce crystallization. Crystallization of a supercooled liquid, however, can be initiated only by a "nucleus" of the same substance in the solid state, or, as has also been found, by a nucleus of an isomorphous solid phase; it is not brought about by the presence of any chance solid.
Velocity of Transformation.—Attention has already been drawn to the sluggishness with which reciprocal transformation of the polymorphic forms of a substance may occur. In the case of tin, for example, it was found that the white modification, although apparently possessing permanence, is in reality in a metastable state, under the ordinary conditions of temperature and pressure. This great degree of stability is due to the tardiness with which transformation into the grey form occurs.
What was found in the case of tin, is met with also in the case of all transformations in the solid state, but the velocity of the change is less in some cases than in others, and appears to decrease with increase of the valency of the element.[127] To this fact van't Hoff attributes the great permanence of many really unstable (or metastable) carbon compounds.
Reference has been made to the fact that the velocity of transformation can be accelerated by various means. One of the most important of these is the employment of a liquid which has a solvent action on the solid phases. Just as we have seen that at any given temperature the less stable form has the higher vapour pressure, but that at the transition point the vapour pressure of both forms becomes identical, so also it can be proved theoretically, and be shown experimentally, that {71}at a given temperature the solubility of the less stable form is greater than that of the more stable, but that at the transition point the solubility of the two forms becomes identical.[128]
If, then, the two solid phases are brought into contact with a solvent, the less stable phase will dissolve more abundantly than the more stable; the solution will therefore become supersaturated with respect to the latter, which will be deposited. A gradual change of the less stable form, therefore, takes place through the medium of the solvent. In this way the more rapid conversion of white tin into grey in presence of a solution of tin ammonium chloride (p. 42) is to be explained. Although, as a rule, solvents accelerate the transformation of one solid phase into the other, they may also have a retarding influence on the velocity of transformation, as was found by Reinders in the case of mercuric iodide.[129]
The velocity of inversion, also, is variously affected by different solvents, and in some cases, at least, it appears to be slower the more viscous the solvent;[130] indeed, Kastle and Reed state that yellow crystals of mercuric iodide, which, ordinarily, change with considerable velocity into the red modification, have been preserved for more than a year under vaseline.
Temperature, also, has a very considerable influence on the velocity of transformation. The higher the temperature, and the farther it is removed from the equilibrium point (transition point), the greater is the velocity of change. Above the transition point, these two factors act in the same direction, and the velocity of transformation will therefore go on increasing indefinitely the higher the temperature is raised. Below the transition point, however, the two factors act in opposite directions, and the more the temperature is lowered, the more is the effect of removal from the equilibrium point counteracted. A point will therefore be reached at which the velocity is a maximum. Reduction of the temperature {72}below this point causes a rapid falling off in the velocity of change. The point of maximum velocity, however, is not definite, but may be altered by various causes. Thus, Cohen found that in the case of tin, the point of maximum velocity was altered if the metal had already undergone transformation; and also by the presence of different liquids.[131]
Lastly, the presence of small quantities of different substances—catalytic agents or catalyzers—has a great influence on the velocity of transformation. Thus, e.g., the conversion of white to red phosphorus is accelerated by the presence of iodine (p. 47).
Greater attention, however, has been paid to the study of the velocity of crystallization of a supercooled liquid, the first experiments in this direction having been made by Gernez[132] on the velocity of crystallization of phosphorus and sulphur. Since that time, the velocity of crystallization of other supercooled liquids has been investigated; such as acetic acid and phenol by Moore;[133] supercooled water by Tumlirz;[134] and a number of organic substances by Tammann,[135] Friedländer and Tammann,[136] and by Bogojawlenski.[137]
In measuring the velocity of crystallization, the supercooled liquids were contained in narrow glass tubes, and the time required for the crystallization to advance along a certain length of the tube was determined, the velocity being expressed in millimetres per minute. The results which have so far been obtained may be summarized as follows. For any given degree of supercooling of a substance, the velocity of crystallization is constant. As the degree of supercooling increases, the velocity of crystallization also increases, until a certain point is reached at which the velocity is a maximum, which has a definite characteristic value for each substance. This maximum velocity remains constant over a certain range of {73}temperature; thereafter, the velocity diminishes fairly rapidly, and, with sufficient supercooling, may become zero. The liquid then passes into a glassy mass, which will remain (practically) permanent even in contact with the crystalline solid.
In ordinary glass we have a familiar example of a liquid which has been cooled to a temperature at which crystallization takes place with very great slowness. If, however, glass is heated, a temperature is reached, much below the melting point of the glass, at which crystallization occurs with appreciable velocity, and we observe the phenomenon of devitrification.[138]
When the velocity of crystallization is studied at temperatures above the maximum point, it is found that the velocity is diminished by the addition of foreign substances; and in many cases, indeed, it has been found that the diminution is the same for equimolecular quantities of different substances. It would hence appear possible to utilize this behaviour as a method for determining molecular weights.[139] The rule is, however, by no means a universal one. Thus it has been found by F. Dreyer,[140] in studying the velocity of crystallization of formanilide, that the diminution in the velocity produced by equivalent amounts of different substances is not the same, but that the foreign substances exercise a specific influence. Further, von Pickardt's rule does not hold when the foreign substance forms mixed crystals (Chap. X.) with the crystallizing substance.[141]
Law of Successive Reactions.—When sulphur vapour is cooled at the ordinary temperature, it first of all condenses to drops of liquid, which solidify in an amorphous form, and only after some time undergo crystallization; or, when phosphorus vapour is condensed, white phosphorus is first formed, and not the more stable form—red phosphorus. It has also been observed that even at the ordinary temperature (therefore much below the transition point) sulphur may crystallize out from solution in benzene, alcohol, carbon disulphide, and other {74}solvents, in the prismatic form, the less stable prismatic crystals then undergoing transformation into the rhombic form;[142] a similar behaviour has also been observed in the transformation of the monotropic crystalline forms of sulphur.[143]
Many other examples might be given. In organic chemistry, for instance, it is often found that when a substance is thrown out of solution, it is first deposited as a liquid, which passes later into the more stable crystalline form. In analysis, also, rapid precipitation from concentrated solution often causes the separation of a less stable and more soluble amorphous form.
On account of the great frequency with which the prior formation of the less stable form occurs, Ostwald[144] has put forward the law of successive reactions, which states that when a system passes from a less stable condition it does not pass directly into the most stable of the possible states; but into the next more stable, and so step by step into the most stable. This law explains the formation of the metastable forms of monotropic substances, which would otherwise not be obtainable. Although it is not always possible to observe the formation of the least stable form, it should be remembered that that may quite conceivably be due to the great velocity of transformation of the less stable into the more stable form. From what we have learned about the velocity of transformation of metastable phases, we can understand that rapid cooling to a low temperature will tend to preserve the less stable form; and, on account of the influence of temperature in increasing the velocity of change, it can be seen that the formation of the less stable form will be more difficult to observe in superheated than in supercooled systems. The factors, however, which affect the readiness with which {75}the less stable modification is produced, appear to be rather various.[145]
Although a number of at least apparent exceptions to Ostwald's law have been found, it may nevertheless be accepted as a very useful generalization which sums up very frequently observed phenomena.
SYSTEMS OF TWO COMPONENTS—PHENOMENA OF DISSOCIATION
In the preceding pages we have studied the behaviour of systems consisting of only one component, or systems in which all the phases, whether solid, liquid, or vapour, had the same chemical composition (p. 13). In some cases, as, for example, in the case of phosphorus and sulphur, the component was an elementary substance; in other cases, however, e.g. water, the component was a compound. The systems which we now proceed to study are characterized by the fact that the different phases have no longer all the same chemical composition, and cannot, therefore, according to definition, be considered as one-component systems.
In most cases, little or no difficulty will be experienced in deciding as to the number of the components, if the rules given on pp. 12 and 13 are borne in mind. If the composition of all the phases, each regarded as a whole, is the same, the system is to be regarded as of the first order, or a one-component system; if the composition of the different phases varies, the system must contain more than one component. If, in order to express the composition of all the phases present when the system is in equilibrium, two of the constituents participating in the equilibrium are necessary and sufficient, the system is one of two components. Which two of the possible substances are to be regarded as components will, however, be to a certain extent a matter of arbitrary choice.
The principles affecting the choice of components will best be learned by a study of the examples to be discussed in the sequel. {77}
Different Systems of Two Components.—Applying the Phase Rule
P + F = C + 2
to systems of two components, we see that in order that the system may be invariant, there must be four phases in equilibrium together; two components in three phases constitute a univariant, two components in two phases a bivariant system. In the case of systems of one component, the highest degree of variability found was two (one component in one phase); but, as is evident from the formula, there is a higher degree of freedom possible in the case of two-component systems. Two components existing in only one phase constitute a tervariant system, or a system with three degrees of freedom. In addition to the pressure and temperature, therefore, a third variable factor must be chosen, and as such there is taken the concentration of the components. In systems of two components, therefore, not only may there be change of pressure and temperature, as in the case of one-component systems, but the concentration of the components in the different phases may also alter; a variation which did not require to be considered in the case of one-component systems.
 Fig. 18.
Since a two-component system may undergo three possible {78}independent variations, we should require for the graphic representation of all the possible conditions of equilibrium a system of three co-ordinates in space, three axes being chosen, say, at right angles to one another, and representing the three variables—pressure, temperature, and concentration of components (Fig. 18). A curve (e.g. AB) in the plane containing the pressure and temperature axes would then represent the change of pressure with the temperature, the concentration remaining unaltered (pt-diagram); one in the plane containing the pressure and concentration axes (e.g. AF or DF), the change of pressure with the concentration, the temperature remaining constant (pc-diagram), while in the plane containing the concentration and the temperature axes, the simultaneous change of these two factors at constant pressure would be represented (tc-diagram). If the points on these three curves are joined together, a surface, ABDE, will be formed, and any line on that surface (e.g. FG, or GH, or GI) would represent the simultaneous variation of the three factors—pressure, temperature, concentration. Although we shall at a later point make some use of these solid figures, we shall for the present employ the more readily intelligible plane diagram.
The number of different systems which can be formed from two components, as well as the number of the different phenomena which can there be observed, is much greater than in the case of one component. In the case of no two substances, however, have all the possible relationships been studied; so that for the purpose of gaining an insight into the very varied behaviour of two-component systems, a number of different examples will be discussed, each of which will serve to give a picture of some of the relationships.
Although the strict classification of the different systems according to the Phase Rule would be based on the variability of the systems, the study of the many different phenomena, and the correlation of the comparatively large number of different systems, will probably be rendered easiest by grouping these different phenomena into classes, each of these classes being studied with the help of one or more typical examples. The order of treatment adopted here is, of course, quite arbitrary; {79}but has been selected from considerations of simplicity and clearness.
Phenomena of Dissociation.
Bivariant Systems.—As the first examples of the equilibria between a substance and its products of dissociation, we shall consider very briefly those cases in which there is one solid phase in equilibrium with vapour. Reference has already been made to such systems in the case of ammonium chloride. On being heated, ammonium chloride dissociates into ammonia and hydrogen chloride. Since, however, in that case the vapour phase has the same total composition as the solid phase, viz. NH3 + HCl = NH4Cl, the system consists of only one component existing in two phases; it is therefore univariant, and to each temperature there will correspond a definite vapour pressure (dissociation pressure).[146]
If, however, excess of one of the products of dissociation be added, the system becomes one of two components.
In the first place, analysis of each of the two phases yields as the composition of each, solid: NH4Cl (= NH3 + HCl); vapour: mNH3 + nHCl. Obviously the smallest number of substances by which the composition of the two phases can be expressed is two; that is, the number of components is two. What, then, are the components? The choice lies between NH3 + HCl, NH4Cl + NH3, and NH4Cl + HCl; for the three substances, ammonium chloride, ammonia, hydrogen chloride, are the only ones taking part in the equilibrium of the system.
Of these three pairs of components, we should obviously choose as the most simple NH3 and HCl, for we can then represent the composition of the two phases as the sum of the two components. If one of the other two possible pairs of components be chosen, we should have to introduce negative quantities of one of the components, in order to represent the composition of the vapour phase. Although it must be allowed that the introduction of negative quantities of a component in such cases is quite permissible, still it will be {80}better to adopt the simpler and more direct choice, whereby the composition of each of the phases is represented as a sum of two components in varying proportions (p. 12).
If, therefore, we have a solid substance, such as ammonium chloride, which dissociates on volatilization, and if the products of dissociation are added in varying amounts to the system, we shall have, in the sense of the Phase Rule, a two-component system existing in two phases. Such a system will possess two degrees of freedom. At any given temperature, not only the pressure, but also the composition, of the vapour-phase, i.e. the concentration of the components, can vary. Only after one of these independent variables, pressure or composition, has been arbitrarily fixed does the system become univariant, and exhibit a definite, constant pressure at a given temperature.
Now, although the Phase Rule informs us that at a given temperature change of composition of the vapour phase will be accompanied by change of pressure, it does not cast any light on the relation between these two variables. This relationship, however, can be calculated theoretically by means of the Law of Mass Action.[147] From this we learn that in the case of a substance which dissociates into equivalent quantities of two gases, the product of the partial pressures of the gases is constant at a given temperature.
This has been proved experimentally in the case of ammonium hydrosulphide, ammonium cyanide, phosphonium bromide, and other substances.[148]
Univariant Systems.—In order that a system of two components shall possess only one degree of freedom, three phases must be present. Of such systems, there are seven possible, viz. S-S-S, S-S-L, S-S-V, L-L-L, S-L-L, L-L-V, S-L-V; S denoting solid, L liquid, and V vapour. In the present chapter we shall consider only the systems S-S-V, i.e. those systems in which there are two solid phases and a vapour phase present.
As an example of this, we may first consider the well-known case of
the dissociation of calcium carbonate. This substance on being heated
dissociates into calcium oxide, or quick-lime, and carbon dioxide, as
shown by the equation CaCO3  CaO +
CO2. In accordance with our definition (p. 9), we have here two solid phases, the carbonate and
the quick-lime, and one vapour phase; the system is therefore univariant.
To each temperature, therefore, there will correspond a certain, definite
maximum pressure of carbon dioxide (dissociation pressure), and this will
follow the same law as the vapour pressure of a pure liquid (p. 21). More particularly, it will be independent of the
relative or absolute amounts of the two solid phases, and of the volume
of the vapour phase. If the temperature is maintained constant, increase
of volume will cause the dissociation of a further amount of the
carbonate until the pressure again reaches its maximum value
corresponding to the given temperature. Diminution of volume, on the
other hand, will bring about the combination of a certain quantity of the
carbon dioxide with the calcium oxide until the pressure again reaches
its original value.
CaO +
CO2. In accordance with our definition (p. 9), we have here two solid phases, the carbonate and
the quick-lime, and one vapour phase; the system is therefore univariant.
To each temperature, therefore, there will correspond a certain, definite
maximum pressure of carbon dioxide (dissociation pressure), and this will
follow the same law as the vapour pressure of a pure liquid (p. 21). More particularly, it will be independent of the
relative or absolute amounts of the two solid phases, and of the volume
of the vapour phase. If the temperature is maintained constant, increase
of volume will cause the dissociation of a further amount of the
carbonate until the pressure again reaches its maximum value
corresponding to the given temperature. Diminution of volume, on the
other hand, will bring about the combination of a certain quantity of the
carbon dioxide with the calcium oxide until the pressure again reaches
its original value.
The dissociation pressure of calcium carbonate was first studied by Debray,[149] but more exact measurements have been made by Le Chatelier,[150] who found the following corresponding values of temperature and pressure:—
| Temperature. | Pressure in cm. mercury. |
| 547° | 2.7 |
| 610° | 4.6 |
| 625° | 5.6 |
| 740° | 25.5 |
| 745° | 28.9 |
| 810° | 67.8 |
| 812° | 76.3 |
| 865° | 133.3 |
From this table we see that it is only at a temperature of about 812° that the pressure of the carbon dioxide becomes equal to atmospheric pressure. In a vessel open to {82}the air, therefore, the complete decomposition of the calcium carbonate would not take place below this temperature by the mere heating of the carbonate. If, however, the carbon dioxide is removed as quickly as it is formed, say by a current of air, then the entire decomposition can be made to take place at a much lower temperature. For the dissociation equilibrium of the carbonate depends only on the partial pressure of the carbon dioxide, and if this is kept small, then the decomposition can proceed, even at a temperature below that at which the pressure of the carbon dioxide is less than atmospheric pressure.
Ammonia Compounds of Metal Chlorides.—Ammonia possesses the property of combining with various substances, chiefly the halides of metals, to form compounds which again yield up the ammonia on being heated. Thus, for example, on passing ammonia over silver chloride, absorption of the gas takes place with formation of the substances AgCl,3NH3 and 2AgCl,3NH3, according to the conditions of the experiment. These were the first known substances belonging to this class, and were employed by Faraday in his experiments on the liquefaction of ammonia. Similar compounds have also been obtained by the action of ammonia on silver bromide, iodide, cyanide, and nitrate; and with the halogen compounds of calcium, zinc, and magnesium, as well as with other salts. The behaviour of the ammonia compounds of silver chloride is typical for the compounds of this class, and may be briefly considered here.
It was found by Isambert[151] that at temperatures below 15°, silver chloride combined with ammonia to form the compound AgCl,3NH3, while at temperatures above 20° the compound 2AgCl,3NH3 was produced. On heating these substances, ammonia was evolved, and the pressure of this gas was found in the case of both compounds to be constant at a given temperature, but was greater in the case of the former than in the case of the latter substance; the pressure, further, was independent of the amount decomposed. The behaviour of these two substances is, therefore, exactly analogous to that shown by calcium carbonate, and the explanation is also similar.
Regarded from the point of view of the Phase Rule, we see that we are here dealing with two components, AgCl and NH3. On being heated, the compounds decompose according to the equations:—
2(AgCl,3NH3) 2AgCl,3NH3 + 3NH3.
2AgCl,3NH3 2AgCl + 3NH3.
There are, therefore, three phases, viz. AgCl,3NH3; 2AgCl,3NH3, and NH3, in the one case; and 2AgCl,3NH3; AgCl, and NH3 in the other. These two systems are therefore univariant, and to each temperature there must correspond a definite pressure of dissociation, quite irrespective of the amounts of the phases present. Similarly, if, at constant temperature, the volume is increased (or if the ammonia which is evolved is pumped off), the pressure will remain constant so long as two solid phases, AgCl,3NH3 and 2AgCl,3NH3, are present, i.e. until the compound richer in ammonia is completely decomposed, when there will be a sudden fall in the pressure to the value corresponding to the system 2AgCl,3NH3—AgCl—NH3. The pressure will again remain constant at constant temperature, until all the ammonia has been pumped off, when there will again be a sudden fall in the pressure to that of the system formed by solid silver chloride in contact with its vapour.
The reverse changes take place when the pressure of the ammonia is gradually increased. If the volume is continuously diminished, the pressure will first increase until it has reached a certain value; the compound 2AgCl,3NH3 can then be formed, and the pressure will now remain constant until all the silver chloride has disappeared. The pressure will again rise, until it has reached the value at which the compound AgCl,3NH3 can be formed, when it will again remain constant until the complete disappearance of the lower compound. There is no gradual change of pressure on passing from one system to another; but the changes are abrupt, as is demanded by the Phase Rule, and as experiment has conclusively proved.[152]
The dissociation pressures of the two compounds of silver {84}chloride and ammonia, as determined by Isambert,[153] are given in the following table:—
| AgCl,3NH3. | 2AgCl,3NH3. | ||
| Temperature. | Pressure. | Temperature. | Pressure. |
| 0° | 29.3 cm. | 20.0° | 9.3 cm. |
| 10.6° | 50.5 ,, | 31.0° | 12.5 ,, |
| 17.5° | 65.5 ,, | 47.0° | 26.8 ,, |
| 24.0° | 93.7 ,, | 58.5° | 52.8 ,, |
| 28.0° | 135.5 ,, | 69.0° | 78.6 ,, |
| 34.2° | 171.3 ,, | 71.5° | 94.6 ,, |
| 48.5° | 241.4 ,, | 77.5° | 119.8 ,, |
| 51.5° | 413.2 ,, | 83.5° | 159.3 ,, |
| 54.0° | 464.1 ,, | 86.1° | 181.3 ,, |
| 88.5° | 201.3 ,, | ||
The conditions for the formation of these two compounds, by passing ammonia over silver chloride, to which reference has already been made, will be readily understood from the above tables. In the case of the triammonia mono-chloride, the dissociation pressure becomes equal to atmospheric pressure at a temperature of about 20°; above this temperature, therefore, it cannot be formed by the action of ammonia at atmospheric pressure on silver chloride. The triammonia dichloride can, however, be formed, for its dissociation pressure at this temperature amounts to only 9 cm., and becomes equal to the atmospheric pressure only at a temperature of about 68°; and this temperature, therefore, constitutes the limit above which no combination can take place between silver chloride and ammonia under atmospheric pressure.
Attention may be here drawn to the fact, to which reference will also be made later, that two solid phases are necessary in order that the dissociation pressure at a given temperature shall be definite; and for the exact definition of this pressure it is necessary to know, not merely what is the substance undergoing dissociation, but also what is the solid product of dissociation formed. For the definition of the equilibrium, the latter is as important as the former. We shall presently find proof of this in the case {85}of an analogous class of phenomena, viz. the dissociation of salt hydrates.
Salts with Water of Crystallization.—In the case of the dehydration of crystalline salts containing water of crystallization, we meet with phenomena which are in all respects similar to those just studied. A salt hydrate on being heated dissociates into a lower hydrate (or anhydrous salt) and water vapour. Since we are dealing with two components—salt and water[154]—in three phases, viz. hydrate a, hydrate b (or anhydrous salt), and vapour, the system is univariant, and to each temperature there will correspond a certain, definite vapour pressure (the dissociation pressure), which will be independent of the relative or absolute amounts of the phases, i.e. of the amount of hydrate which has already undergone dissociation or dehydration.
 Fig. 19.
The constancy of the dissociation pressure had been proved experimentally by several investigators[155] a number of years before the theoretical basis for its necessity had been given. In the case of salts capable of forming more than one hydrate, we should obtain a series of dissociation curves (pt-curves), as in the case of the different hydrates of copper sulphate. In Fig. 19 there are represented diagrammatically the vapour-pressure curves of the following univariant systems of copper sulphate and water:—
Curve OA: CuSO4,5H2O CuSO4,3H2O + 2H2O.
Curve OB: CuSO4,3H2O CuSO4,H2O + 2H2O.
Curve OC: CuSO4,H2O CuSO4 + H2O.
Let us now follow the changes which take place on {86}increasing the pressure of the aqueous vapour in contact with anhydrous copper sulphate, the temperature being meanwhile maintained constant. If, starting from the point D, we slowly add water vapour to the system, the pressure will gradually rise, without formation of hydrate taking place; for at pressures below the curve OC only the anhydrous salt can exist. At E, however, the hydrate CuSO4,H2O will be formed, and as there are now three phases present, viz. CuSO4, CuSO4,H2O, and vapour, the system becomes univariant; and since the temperature is constant, the pressure must also be constant. Continued addition of vapour will result merely in an increase in the amount of the hydrate, and a decrease in the amount of the anhydrous salt. When the latter has entirely disappeared, i.e. has passed into hydrated salt, the system again becomes bivariant, and passes along the line EF; the pressure gradually increases, therefore, until at F the hydrate 3H2O is formed, and the system again becomes univariant; the three phases present are CuSO4,H2O, CuSO4,3H2O, vapour. The pressure will remain constant, therefore, until the hydrate 1H2O has disappeared, when it will again increase till G is reached; here the hydrate 5H2O is formed, and the pressure once more remains constant until the complete disappearance of the hydrate 3H2O has taken place.
Conversely, on dehydrating CuSO4,5H2O at constant temperature, we should find that the pressure would maintain the value corresponding to the dissociation pressure of the system CuSO4,5H2O—CuSO4,3H2O—vapour, until all the hydrate 5H2O had disappeared; further removal of water would then cause the pressure to fall abruptly to the pressure of the system CuSO4,3H2O—CuSO4,H2O—vapour, at which value it would again remain constant until the tri-hydrate had passed into the monohydrate, when a further sudden diminution of the pressure would occur. This behaviour is represented diagrammatically in Fig. 20, the values of the pressure being those at 50°.
Efflorescence.—From Fig. 19 we are enabled to predict the conditions under which a given hydrated salt will effloresce when exposed to the air. We have just learned that copper {87}sulphate pentahydrate, for example, will not be formed unless the pressure of the aqueous vapour reaches a certain value; and that conversely, if the vapour pressure falls below the dissociation pressure of the pentahydrate, this salt will undergo dehydration. From this, then, it is evident that a crystalline salt hydrate will effloresce when exposed to the air, if the partial pressure of the water vapour in the air is lower than the dissociation pressure of the hydrate. At the ordinary temperature the dissociation pressure of copper sulphate is less than the pressure of water vapour in the air, and therefore copper sulphate does not effloresce. In the case of sodium sulphate decahydrate, however, the dissociation pressure is greater than the normal vapour pressure in a room, and this salt therefore effloresces.
 Fig. 20.
Indefiniteness of the Vapour Pressure of a Hydrate.—Reference has already been made (p. 84), in the case of the ammonia compounds of the metal chlorides, to the importance of the solid product of dissociation for the definition of the dissociation pressure. Similarly also in the case of a hydrated salt. A salt hydrate in contact with vapour constitutes only a bivariant system, and can exist therefore at different values of temperature and pressure of vapour, as is seen from the diagram, Fig. 19. Anhydrous copper sulphate can exist in contact with water vapour at all values of temperature and pressure lying in the field below the curve OC; and the hydrate CuSO4,H2O can exist in contact with vapour at all values of temperature and pressure in the field BOC. Similarly, each of the other hydrates can exist in contact with vapour at different values of temperature and pressure.
From the Phase Rule, however, we learn that, in order that at a given temperature the pressure of a two-component system {88}may be constant, there must be three phases present. Strictly, therefore, we can speak only of the vapour pressure of a system; and since, in the cases under discussion, the hydrates dissociate into a solid and a vapour, any statement as to the vapour pressure of a hydrate has a definite meaning only when the second solid phase produced by the dissociation is given. The everyday custom of speaking of the vapour pressure of a hydrated salt acquires a meaning only through the assumption, tacitly made, that the second solid phase, or the solid produced by the dehydration of the hydrate, is the next lower hydrate, where more hydrates than one exist. That a hydrate always dissociates in such a way that the next lower hydrate is formed is, however, by no means certain; indeed, cases have been met with where apparently the anhydrous salt, and not the lower hydrate (the existence of which was possible), was produced by the dissociation of the higher hydrate.[156]
That a salt hydrate can exhibit different vapour pressures according to the solid product of dissociation, can not only be proved theoretically, but it has also been shown experimentally to be a fact. Thus CaCl2,6H2O can dissociate into water vapour and either of two lower hydrates, each containing four molecules of water of crystallization, and designated respectively as CaCl2,4H2Oα, and CaCl2,4H2Oβ. Roozeboom[157] has shown that the vapour pressure which is obtained differs according to which of these two hydrates is formed, as can be seen from the following figures:—
| Temperature. | Pressure of System. | |
| CaCl2,6H2O; CaCl2, 4H2Oα; vapour. | CaCl2,6H2O; CaCl2, 4H2Oβ; vapour. | |
| -15° | 0.027 cm. | 0.022 cm. |
| 0 | 0.092 ,, | 0.076 ,, |
| +10 | 0.192 ,, | 0.162 ,, |
| 20 | 0.378 ,, | 0.315 ,, |
| 25 | 0.508 ,, | 0.432 ,, |
| 29.2 | — | 0.567 ,, |
| 29.8 | 0.680 ,, | — |
By reason of the non-recognition of the importance of the solid dissociation product for the definition of the dissociation pressure of a salt hydrate, many of the older determinations lose much of their value.
Suspended Transformation.—Just as in systems of one component we found that a new phase was not necessarily formed when the conditions for its existence were established, so also we find that even when the vapour pressure is lowered below the dissociation pressure of a system, dissociation does not necessarily occur. This is well known in the case of Glauber's salt, first observed by Faraday. Undamaged crystals of Na2SO4,10H2O could be kept unchanged in the open air, although the vapour pressure of the system Na2SO4,10H2O—Na2SO4—vapour is greater than the ordinary pressure of aqueous vapour in the air. That is to say, the possibility of the formation of the new phase Na2SO4 was given; nevertheless this new phase did not appear, and the system therefore became metastable, or unstable with respect to the anhydrous salt. When, however, a trace of the new phase—the anhydrous salt—was brought in contact with the hydrate, transformation occurred; the hydrate effloresced.
The possibility of suspended transformation or the non-formation of the new phases must also be granted in the case where the vapour pressure is raised above that corresponding to the system hydrate—anhydrous salt (or lower hydrate)—vapour; in this case the formation of the higher hydrate becomes a possibility, but not a certainty. Although there is no example of this known in the case of hydrated salts, the suspension of the transformation has been observed in the case of the compounds of ammonia with the metal chlorides (p. 82). Horstmann,[158] for example, found that the pressure of ammonia in contact with 2AgCl,3NH3 could be raised to a value higher than the dissociation pressure of AgCl,3NH3 without this compound being formed. We see, therefore, that even when the existence of the higher compound in contact with the lower became possible, the higher compound was not immediately formed.
Range of Existence of Hydrates.—In Fig. 19 the vapour {90}pressure curves of the different hydrates of copper sulphate are represented as maintaining their relative positions throughout the whole range of temperatures. But this is not necessarily the case. It is possible that at some temperature the vapour pressure curve of a lower hydrate may cut that of a higher hydrate. At temperatures above the point of intersection, the lower hydrate would have a higher vapour pressure than the higher hydrate, and would therefore be metastable with respect to the latter. The range of stable existence of the lower hydrate would therefore end at the point of intersection. This appears to be the case with the two hydrates of sodium sulphate, to which reference will be made later.[159]
Constancy of Vapour Pressure and the Formation of Compounds.—We have seen in the case of the salt hydrates that the continued addition of the vapour phase to the system caused an increase in the pressure until at a definite value of the pressure a hydrate is formed; the pressure then becomes constant, and remains so, until one of the solid phases has disappeared. Conversely, on withdrawing the vapour phase, the pressure remained constant so long as any of the dissociating compound was present, independently of the degree of the decomposition (p. 86). This behaviour, now, has been employed for the purpose of determining whether or not definite chemical compounds are formed. Should compounds be formed between the vapour phase and the solid, then, on continued addition or withdrawal of the vapour phase, it will be found that the vapour pressure remains constant for a certain time, and will then suddenly assume a new value, at which it will again remain constant. By this method, Ramsay[160] found that no definite hydrates were formed in the case of ferric and aluminium oxides, but that two are formed in the case of lead oxide, viz. 2PbO,H2O and 3PbO,H2O.
The method has also been applied to the investigation of the so-called palladium hydride,[161] and the results obtained appear to show that no compound is formed. Reference will, however, be made to this case later (Chap. X.).
Measurement of the Vapour Pressure of Hydrates.—For the purpose of measuring the small pressures exerted by the vapour of salt hydrates, use is very generally made of a differential manometer called the Bremer-Frowein tensimeter.[162]
This apparatus has the form shown in Fig. 21. It consists of a U-tube, the limbs of which are bent close together, and placed in front of a millimetre scale. The bend of the tube is filled with oil or other suitable liquid, e.g. bromonaphthalene. If it is desired to measure the dissociation pressure of, say, a salt hydrate, concentrated sulphuric acid is placed in the flask e, and a quantity of the hydrate, well dried and powdered,[163] in the bulb d. The necks of the bulbs d and e are then sealed off. Since, as we have learned, suspended transformation may occur, it is advisable to first partially dehydrate the salt, in order to ensure the presence of the second solid product of dissociation; the value of the dissociation pressure being independent of the degree of dissociation of the hydrate (p. 86). The small bulbs d and e having been filled, the apparatus is placed on its side, so as to allow the liquid to run from the bend of the tube into the bulbs a and b; it is then exhausted through f by means of a mercury pump, and sealed off. The apparatus is now placed in a perpendicular position in a thermostat, and kept at constant temperature until equilibrium is established. Since the vapour pressure on the side containing the sulphuric acid may be regarded as zero, the difference in level of the two surfaces of liquid in the U-tube gives directly the dissociation pressure of the hydrate in terms of the particular liquid employed; if the density of the latter is known, the pressure can then be calculated to cm. of mercury.
 Fig. 21.
SOLUTIONS
Definition.—In all the cases which have been considered in the preceding pages, the different phases—with the exception of the vapour phase—consisted of a single substance of definite composition, or were definite chemical individuals.[164] But this invariability of the composition is by no means imposed by the Phase Rule; on the contrary, we shall find in the examples which we now proceed to study, that the participation of phases of variable composition in the equilibrium of a system is in no way excluded. To such phases of variable composition there is applied the term solution. A solution, therefore, is to be defined as a homogeneous mixture, the composition of which can undergo continuous variation within certain limits; the limits, namely, of its existence.[165]
From this definition we see that the term solution is not restricted to any particular physical state of substances, but includes within its range not only the liquid, but also the gaseous and solid states. We may therefore have solutions of gases in liquids, and of gases in solids; of liquids in liquids or in solids; of solids in liquids, or of solids in solids. Solutions of gases in gases are, of course, also possible; since, however, gas solutions never give rise to more than one phase, their {93}treatment does not come within the scope of the Phase Rule, which deals with heterogeneous equilibria.
It should also be emphasized that the definition of solution given above, neither creates nor recognizes any distinction between solvent and dissolved substance (solute); and, indeed, a too persistent use of these terms and the attempt to permanently label the one or other of two components as the solvent or the solute, can only obscure the true relationships and aggravate the difficulty of their interpretation. In all cases it should be remembered that we are dealing with equilibria between two components (we confine our attention in the first instance to such), the solution being constituted of these components in variable and varying amounts. The change from the case where the one component is in great excess (ordinarily called the solvent) to that in which the other component predominates, may be quite gradual, so that it is difficult or impossible to say at what point the one component ceases to be the solvent and becomes the solute. The adoption of this standpoint need not, however, preclude one from employing the conventional terms solvent and solute in ordinary language, especially when reference is made only to some particular condition of equilibrium of the system, when the concentration of the two components in the solution is widely different.
Solutions of Gases in Liquids.
As the first class of solutions to which we shall turn our attention, there may be chosen the solutions of gases in liquids, or the equilibria between a liquid and a gas. These equilibria really constitute a part of the equilibria to be studied more fully in Chapter VIII.; but since the two-phase systems formed by the solutions of gases in liquids are among the best-known of the two-component systems, a short section may be here allotted to their treatment.
When a gas is passed into a liquid, absorption takes place to a greater or less extent, and a point is at length reached when the liquid absorbs no more of the gas; a condition of equilibrium is attained, and the liquid is said to be saturated {94}with the gas. In the light of the Phase Rule, now, such a system is bivariant (two components in two phases); and two of the variable factors, pressure, temperature, and concentration of the components, must therefore be chosen in order that the condition of the system may be defined. If the concentration and the temperature are fixed, then the pressure is also defined; or under given conditions of temperature and pressure, the concentration of the gas in the solution must have a definite value. If, however, the temperature alone is fixed, the concentration and the pressure can alter; a fact so well known that it does not require to be further insisted on.
As to the way in which the solubility of a gas in a liquid varies with the pressure, the Phase Rule of course does not state; but guidance on this point is again yielded by the theorem of van't Hoff and Le Chatelier. Since the absorption of a gas is in all cases accompanied by a diminution of the total volume, this process must take place with increase of pressure. This, indeed, is stated in a quantitative manner in the law of Henry, according to which the amount of a gas absorbed is proportional to the pressure. But this law must be modified in the case of gases which are very readily absorbed; the direction of change of concentration with the pressure will, however, still be in accordance with the theorem of Le Chatelier.
If, on the other hand, the pressure is fixed, then the concentration will vary with the temperature; and since the absorption of gases is in all cases accompanied by the evolution of heat, the solubility is found, in accordance with the theorem of Le Chatelier, to diminish with rise of temperature.
In considering the changes of pressure accompanying changes of concentration and temperature, a distinction must be drawn between the total pressure and the partial pressure of the dissolved gas, in cases where the solvent is volatile. In these cases, the law of Henry applies not to the total pressure of the vapour, but only to the partial pressure of the dissolved gas. {95}
Solutions of Liquids in Liquids.
When mercury and water are brought together, the two liquids remain side by side without mixing. Strictly speaking, mercury undoubtedly dissolves to a certain extent in the water, and water no doubt dissolves, although to a less extent, in the mercury; the amount of substance passing into solution is, however, so minute, that it may, for all practical purposes, be left out of account, so long as the temperature does not rise much above the ordinary.[166] On the other hand, if alcohol and water be brought together, complete miscibility takes place, and one homogeneous solution is obtained. Whether water be added in increasing quantities to pure alcohol, or pure alcohol be added in increasing amount to water, at no point, at no degree of concentration, is a system obtained containing more than one liquid phase. At the ordinary temperature, water and alcohol can form only two phases, liquid and vapour. If, however, water be added to ether, or if ether be added to water, solution will not occur to an indefinite extent; but a point will be reached when the water or the ether will no longer dissolve more of the other component, and a further addition of water on the one hand, or ether on the other, will cause the formation of two liquid layers, one containing excess of water, the other excess of ether. We shall, therefore, expect to find all grades of miscibility, from almost perfect immiscibility to perfect miscibility, or miscibility in all proportions. In cases of perfect immiscibility, the components do not affect one another, and the system therefore remains unchanged. Such cases do not call for treatment here. We have to concern ourselves here only with the second and third cases, viz. with cases of complete and of partial miscibility. There is no essential difference between the two classes, for, as we shall see, {96}the one passes into the other with change of temperature. The formal separation into two groups is based on the miscibility relations at ordinary temperatures.
Partial or Limited Miscibility.—In accordance with the Phase Rule, a pure liquid in contact with its vapour constitutes a univariant system. If, however, a small quantity of a second substance is added, which is capable of dissolving in the first, a bivariant system will be obtained; for there are now two components and, as before, only two phases—the homogeneous liquid solution and the vapour. At constant temperature, therefore, both the composition of the solution and the pressure of the vapour can undergo change; or, if the composition of the solution remains unchanged, the pressure and the temperature can alter. If the second (liquid) component is added in increasing amount, the liquid will at first remain homogeneous, and its composition and pressure will undergo a continuous change; when, however, the concentration has reached a definite value, solution no longer takes place; two liquid phases are produced. Since there are now three phases present, two liquids and vapour, the system is univariant; at a given temperature, therefore, the concentration of the components in the two liquid phases, as well as the vapour pressure, must have definite values. Addition of one of the components, therefore, cannot alter the concentrations or the pressure, but can only cause a change in the relative amounts of the phases.
The two liquid phases can be regarded, the one as a solution of the component I. in component II., the other as a solution of component II. in component I. If the pressure is maintained constant, then to each temperature there will correspond a definite concentration of the components in the two liquid phases; and addition of excess of one will merely alter the relative amounts of the two solutions. As the temperature changes, the composition of the two solutions will change, and there will therefore be obtained two solubility curves, one showing the solubility of component I. in component II., the other showing the solubility of component II. in component I. Since heat may be either evolved or absorbed when one liquid dissolves in another, the solubility may diminish or increase {97}with rise of temperature. The two solutions which at a given temperature correspond to one another are known as conjugate solutions.
The solubility relations of partially miscible liquids have been studied by Guthrie,[167] and more especially by Alexejeff[168] and by Rothmund.[169] A considerable variety of curves have been obtained, and we shall therefore discuss only a few of the different cases which may be taken as typical of the rest.
Phenol and Water.—When phenol is added to water at the ordinary temperature, solution takes place, and a homogeneous liquid is produced. When, however, the concentration of the phenol in the solution has risen to about 8 per cent., phenol ceases to be dissolved; and a further addition of it causes the formation of a second liquid phase, which consists of excess of phenol and a small quantity of water. In ordinary language it may be called a solution of water in phenol. If now the temperature is raised, this second liquid phase will disappear, and a further amount of phenol must be added in order to produce a separation of the liquid into two layers. In this way, by increasing the amount of phenol and noting the temperature at which the two layers disappear, the so-called solubility curve of phenol in water can be obtained. By noting the change of the solubility with the temperature in this manner, it is found that at all temperatures below 68.4°, the addition of more than a certain amount of phenol causes the formation of two layers; at temperatures above this, however, two layers cannot be formed, no matter how much phenol is added. At temperatures above 68.4°, therefore, water and phenol are miscible in all proportions.
On the other hand, if water is added to phenol at the ordinary temperature, a liquid is produced which consists chiefly of phenol, and on increasing the amount of water beyond a certain point, two layers are formed. On raising the temperature these two layers disappear, and a homogeneous solution is again obtained. The phenomena are exactly analogous to those already described. Since, now, in the second {98}case the concentration of the phenol in the solution gradually decreases, while in the former case it gradually increases, a point must at length be reached at which the composition of the two solutions becomes the same. On mixing the two solutions, therefore, one homogeneous liquid will be obtained. But the point at which two phases become identical is called a critical point, so that, in accordance with this definition, the temperature at which the two solutions of phenol and water become identical may be called the critical solution temperature, and the concentration at this point may be called the critical concentration.
 Fig. 22.
From what has been said above, it will be seen that at any temperature below the critical solution temperature, two conjugate solutions containing water and phenol in different concentration can exist together, one containing excess of water, the other excess of phenol. The following table gives the composition of the two layers, and the values are represented graphically in Fig. 22.[170]
Phenol and Water.
C1 is the percentage amount of phenol in the first layer.
C2 ,, ,, ,, second layer.
| Temperature. | C1. | C2. |
| 20° | 8.5 | 72.2 |
| 30° | 8.7 | 69.9 |
| 40° | 9.7 | 66.8 |
| 50° | 12.0 | 62.7 |
| 55° | 14.2 | 60.0 |
| 60° | 17.5 | 56.2 |
| 65° | 22.7 | 49.7 |
| 68.4° | 36.1 | 36.1 |
The critical solution temperature for phenol and water is 68.4°, the critical concentration 36.1 per cent. of phenol. At all temperatures above 68.4°, only homogeneous solutions of phenol and water can be obtained; water and phenol are then miscible in all proportions.
At the critical solution point the system exists in only two phases—liquid and vapour. It ought, therefore, to possess two degrees of freedom. The restriction is, however, imposed that the composition of the two liquid phases, coexisting at a point infinitely near to the critical point, becomes the same, and this disposes of one of the degrees of freedom. The system is therefore univariant; and at a given temperature the pressure will have a definite value. Conversely, if the pressure is fixed (as is the case when the system is under the pressure of its own vapour), then the temperature will also be fixed; that is, the critical solution temperature has a definite value depending only on the substances. If the vapour phase is omitted, the temperature will alter with the pressure; in this case, however, as in the case of other condensed systems, the effect of pressure is slight.
From Fig. 22 it is easy to predict the effect of bringing together water and phenol in any given quantities at any temperature. Start with a solution of phenol and water having the composition represented by the point x. If to this solution phenol is added at constant temperature, it will dissolve, and the composition of the solution will gradually change, as shown by the dotted line xy. When, however, the concentration has reached the value represented by the point y, two liquid layers will be formed, the one solution having the composition represented by y, the other that represented by y′. The system is now univariant, and on further addition of phenol, the composition of the two liquid phases will remain unchanged, but their relative amounts will alter. The phase richer in phenol will increase in amount; that richer in water will decrease, and ultimately disappear, and there will remain the solution y′. Continued addition of phenol will then lead to the point x′, there being now only one liquid phase present.
Since the critical solution point represents the highest temperature at which two liquid phases consisting of phenol and {100}water can exist together, these two substances can be brought together in any amount whatever at temperatures higher than 68.4°, without the formation of two layers. It will therefore be possible to pass from a system represented by x to one represented by x′, without at any time two liquid phases appearing. Starting with x, the temperature is first raised above the critical solution temperature; phenol is then added until the concentration reaches the point x2. On allowing the temperature to fall, the system will then pass into the condition represented by x′.
 Fig. 23.
Methylethylketone and Water.—In the case just described, the solubility of each component in the other increased continuously with the temperature. There are, however, cases where a maximum or minimum of solubility is found, e.g. methylethylketone and water. The curve which represents the equilibria between these two substances is given in Fig. 23, the concentration values being contained in the following table:[171]—
Methylethylketone and Water.
| Temperature. | C1 per cent. | C2 per cent. |
| -10° | 34.5 | 89.7 |
| +10° | 26.1 | 90.0 |
| 30° | 21.9 | 89.9 |
| 50° | 17.5 | 89.0 |
| 70° | 16.2 | 85.7 |
| 90° | 16.1 | 84.8 |
| 110° | 17.7 | 80.0 |
| 130° | 21.8 | 71.9 |
| 140° | 26.0 | 64.0 |
| 151.8° | 44.2 | 44.2 |
These numbers and Fig. 23 show clearly the occurrence of a minimum in the solubility of the ketone in water, and also a minimum (at about 10°) in the solubility of water in methylethylketone. Minima of solubility have also been found in other cases.
 Fig. 24.
Triethylamine and Water.—Although in most of the cases studied the solubility of one liquid in another increases with rise of temperature, this is not so in all cases. Thus, at temperatures below 18°, triethylamine and water mix together in all proportions; but, on raising the temperature, the homogeneous solution becomes turbid and separates into two layers. In this case, therefore, the critical solution temperature is found in the direction of lower temperature, not in the direction of higher.[172] This behaviour is clearly shown by the graphic representation in Fig. 24, and also by the numbers in the following table:—
Triethylamine and Water.
| Temperature. | C1 per cent. | C2 per cent. |
| 70° | 1.6 | — |
| 50° | 2.9 | — |
| 30° | 5.6 | 96 |
| 25° | 7.3 | 95.5 |
| 20° | 15.5 | 73 |
| ±18.5° | ±30 | ±30 |
General Form of Concentration-Temperature Curve.—From the preceding figures it will be seen that the general {102}form of the solubility curve is somewhat parabolic in shape; in the case of triethylamine and water, the closed end of the curve is very flat. Since for all liquids there is a point (critical point) at which the liquid and gaseous states become identical, and since all gases are miscible in all proportions, it follows that there must be some temperature at which the liquids become perfectly miscible. In the case of triethylamine and water, which has just been considered, there must therefore be an upper critical solution temperature, so that the complete solubility relations would be represented by a closed curve of an ellipsoidal aspect. An example of such a curve is furnished by nicotine and water. At temperatures below 60° and above 210°, nicotine and water mix in all proportions.[173] Although it is possible that this is the general form of the curve for all pairs of liquids, there are as yet insufficient data to prove it.
With regard to the closed end of the curve it may be said that it is continuous; the critical solution point is not the intersection of two curves, for such a break in the continuity of the curve could occur only if there were some discontinuity in one of the phases. No such discontinuity exists. The curve is, therefore, not to be considered as two solubility curves cutting at a point; it is a curve of equilibrium between two components, and so long as the phases undergo continuous change, the curve representing the equilibrium must also be continuous. As has already been emphasized, a distinction between solvent and solute is merely conventional (p. 93).
Pressure-Concentration Diagram.—In considering the pressure-concentration diagram of a system of two liquid components, a distinction must be drawn between the total pressure of the system and the partial pressures of the components. On studying the total pressure of a system, it is found that two cases can be obtained.[174]
So long as there is only one liquid phase, the system is bivariant. The pressure therefore can change with the concentration and the temperature. If the temperature is maintained {103}constant, the pressure will vary only with the concentration, and this variation can therefore be represented by a curve. If, however, two liquid phases are formed, the system becomes univariant: and if one of the variables, say the temperature, is arbitrarily fixed, the system no longer possesses any degree of freedom. When two liquid phases are formed, therefore, the concentrations and the vapour pressure have definite values, which are maintained so long as the two liquid phases are present; the temperature being supposed constant.
In Fig. 25 is given a diagrammatic representation of the two kinds of pressure-concentration curves which have so far been obtained. In the one case, the vapour pressure of the invariant system (at constant temperature) lies higher than the vapour pressure of either of the pure components; a phenomenon which is very generally found in the case of partially miscible liquids, e.g. ether and water.[175] Accordingly, by the addition of water to ether, or of ether to water, there is an increase in the total vapour pressure of the system.
 Fig. 25.
With regard to the second type, the vapour pressure of the systems with two liquid phases lies between that of the two single components. An example of this is found in sulphur dioxide and water.[176] On adding sulphur dioxide to water there is an increase of the total vapour pressure; but on adding water to liquid sulphur dioxide, the total vapour pressure is diminished.
The case that the vapour pressure of the system with two {104}liquid phases is less than that of each of the components is not possible.
With regard to the partial pressure of the components, the behaviour is more uniform. The partial pressure of one component is in all cases lowered by the addition of the other component, the diminution being approximately proportional to the amount added. If two liquid phases are present, the partial pressure of the components, as well as the total pressure, is constant, and is the same for both phases. That is to say, in the case of the two liquids, saturated solution of water in ether, and of ether in water, the partial pressure of the ether in the vapour in contact with the one solution is the same as that in the vapour over the other solution.[177]
Complete Miscibility.—Although the phenomena of complete miscibility are here treated under a separate heading, it must not be thought that there is any essential difference between those cases where the liquids exhibit limited miscibility and those in which only one homogeneous solution is formed. As has been already pointed out, the solubility relations alter with the temperature; and liquids which at one temperature can dissolve in one another only to a limited extent, are found at some other temperature to possess the property of complete miscibility. Conversely, we may expect that liquids which at one temperature, say at the ordinary temperature, are miscible in all proportions, will be found at some other temperature to be only partially miscible. Thus, for example, it was found by Guthrie that ethyl alcohol and carbon disulphide, which are miscible in all proportions at the ordinary temperature, possess only limited miscibility at temperatures below -14.4°.[178] Nevertheless, it is doubtful if the critical solution temperature is in all cases experimentally realizable.
Pressure-Concentration Diagram.—Since, in the cases of complete miscibility of two liquid components, there are never more than two phases present, the system must always be bivariant; and two of the variables pressure, temperature or concentration of the components, must be arbitrarily chosen {105}before the system becomes defined. For this reason the Phase Rule affords only a slight guidance in the study of such equilibria; and we shall therefore not enter in detail into the behaviour of these homogeneous mixtures. All that the Phase Rule can tell us in connection with these solutions, is that at constant temperature the vapour pressure of the solution varies with the composition of the liquid phase; and if the composition of the liquid phase remains unchanged, the pressure also must remain unchanged. This constancy of composition is exhibited not only by pure liquids, but also by liquid solutions in all cases where the vapour pressure of the solution reaches a maximum or minimum value. This is the case, for example, with mixtures of constant boiling point.[179]
SOLUTIONS OF SOLIDS IN LIQUIDS, ONLY ONE OF THE COMPONENTS BEING VOLATILE
General.—When a solid is brought into contact with a liquid in which it can dissolve, a certain amount of it passes into solution; and the process continues until the concentration reaches a definite value independent of the amount of solid present. A condition of equilibrium is established between the solid and the solution; the solution becomes saturated. Since the number of components is two, and the number of phases three, viz. solid, liquid solution, vapour, the system is univariant. If, therefore, one of the factors, pressure, temperature, or concentration of the components (in the solution[180]), is arbitrarily fixed, the state of the system becomes perfectly defined. Thus, at any given temperature, the vapour pressure of the system and the concentration of the components have a definite value. If the temperature is altered, the vapour pressure and also, in general, the concentration will undergo change. Likewise, if the pressure varies, while the system is isolated so that no heat can pass between it and its surroundings, the concentration and the temperature must also undergo variation until they attain values corresponding to the particular pressure.
That the temperature has an influence, sometimes a very considerable influence, on the amount of substance passing into solution, is sufficiently well known; the effect of pressure, although less apparent, is no less certain. If at any given temperature the volume of the vapour phase is diminished, {107}vapour will condense to liquid, in order that the pressure may remain constant, and so much of the solid will pass into solution that the concentration may remain unchanged; for, so long as the three phases are present, the state of the system cannot alter. If, however, one of the phases, e.g. the vapour phase, disappears, the system becomes bivariant; at any given temperature, therefore, there may be different values of concentration and pressure.
The direction in which change of concentration will occur with change of pressure can be predicted by means of the theorem of Le Chatelier, if it is known whether solution is accompanied by increase or diminution of the total volume. If diminution of the total volume of the system occurs on solution, increase of pressure will increase the solubility; in the reverse case, increase of pressure will diminish the solubility.
This conclusion has also been verified by experiment, as is shown by the following figures.[181]
| Salt. | Change of volume by dissolving 1 gm. of salt in the saturated solution. | Solubility (at 18°) (grams salt in 1 gram of solution). | |
| Pressure = 1 atm. | Pressure = 500 atm. | ||
| Sodium chloride | -0.07 | 0.264 | 0.270 |
| Ammonium chloride | +0.10 | 0.272 | 0.258 |
| Alum | -0.067 | 0.115 | 0.142 |
| (p = 400 atm.) | |||
As can be seen, a large increase of the pressure brings about a no more than appreciable alteration of the solubility; a result which is due, as in the case of the alteration of the fusion point with the pressure, to the small change in volume accompanying solution or increase of pressure. For all practical purposes, therefore, the solubility as determined under atmospheric pressure may be taken as equal to the true {108}solubility, that is, the solubility when the system is under the pressure of its own vapour.
The Saturated Solution.—From what has been said above, it will be seen that the condition of saturation of a solution can be defined only with respect to a certain solid phase; if no solid is present, the system is undefined, for it then consists of only two phases, and is therefore bivariant. Under such circumstances not only can there be at one given temperature solutions of different concentration, all containing less of one of the components than when that component is present in the solid form, but there can also exist solutions containing more of that component than corresponds to the equilibrium when the solid is present. In the former case the solutions are unsaturated, in the latter case they are supersaturated with respect to a certain solid phase; in themselves, the solutions are stable, and are neither unsaturated nor supersaturated. Further, if the solid substance can exist in different allotropic modifications, the particular form of the substance which is in equilibrium with the solution must be known, in order that the statement of the solubility may be definite; for each form has its own solubility, and, as we shall see presently, the less stable form has the greater solubility (cf. p. 47). In all determinations of the solubility, therefore, not only must the concentration of the components in the solution be determined, but equal importance should be attached to the characterisation of the solid phase present.
In this connection, also, one other point may be emphasised. For the production of the equilibrium between a solid and a liquid, time is necessary, and this time not only varies with the state of division of the solid and the efficiency of the stirring, but is also dependent on the nature of the substance.[182] Considerable care must therefore be taken that sufficient time is allowed for equilibrium to be established. Such care is more especially needful when changes may occur in the solid phase, and neglect of it has greatly diminished the value of many of the older determinations of solubility.
Form of the Solubility Curve.—The solubility curve—that {109}is, the curve representing the change of concentration of the components in the solution with the temperature—differs markedly from the curve of vapour pressure (p. 63), in that it possesses no general form, but may vary in the most diverse manner. Not only may the curve have an almost straight and horizontal course, or slope or curve upwards at varying angles; but it may even slope downwards, corresponding to a decrease in the solubility with rise of temperature; may exhibit maxima or minima of solubility, or may, as in the case of some hydrated salts, pass through a point of maximum temperature. In the latter case the salt may possess two values of solubility at the same temperature. We shall consider these cases in the following chapter.
 Fig. 26.
The great variety of form shown by solubility curves is at once apparent from Fig. 26, in which the solubility curves of various substances (not, however, drawn to scale) are reproduced.[183]
Varied as is the form of the solubility curve, its direction, nevertheless, can be predicted by means of the theorem of van't Hoff and Le Chatelier; for in accordance with that theorem (p. 57) increase of solubility with the temperature must occur in those cases where the process of solution is accompanied by an absorption of heat; and a decrease in the solubility with rise of temperature will be found in cases where solution occurs with evolution of heat. Where there is no heat effect accompanying solution, {110}change of temperature will be without influence on the solubility; and if the sign of the heat of solution changes, the direction of the solubility curve must also change, i.e. must show a maximum or minimum point. This has in all cases been verified by experiment.[184]
In applying the theorem of Le Chatelier to the course of the solubility curve, it should be noted that by heat of solution there is meant, not the heat effect produced on dissolving the salt in a large amount of solvent (which is the usual signification of the expression), but the heat which is absorbed or evolved when the salt is dissolved in the almost saturated solution (the so-called last heat of solution). Not only does the heat effect in the two cases have a different value, but it may even have a different sign. A striking example of this is afforded by cupric chloride, as the following figures show:[185]—
| Number of gram-molecules of CuCl2, 2H2O dissolved in 198 gram-molecules of water. | Heat effect. |
| 1 | +37 K |
| 2.02 | +66 ,, |
| 4.15 | +105 ,, |
| 7.07 | +117 ,, |
| 9.95 | +117 ,, |
| 11 | +91 ,, |
| 18.8 | -10 ,, |
| 19.6 | -31 ,, |
| 24.75 | -198 ,, |
In the above table the positive sign indicates evolution of heat, the negative sign, absorption of heat; and the values of the heat effect are expressed in centuple calories. Judging from the heat effect produced on dissolving cupric chloride in a large bulk of water, we should predict that the solubility of that salt would diminish with rise of temperature; as a matter of fact, it increases. This is in accordance with the fact that {111}the last heat of solution is negative (as expressed above), i.e. solution of the salt in the almost saturated solution is accompanied by absorption of heat. We are led to expect this from the fact that the heat of solution changes sign from positive to negative as the concentration increases; experiment also showed it to be the case.
Despite its many forms, it should be particularly noted that the solubility curve of any substance is continuous, so long as the solid phase, or solid substance in contact with the solution, remains unchanged. If any "break" or discontinuous change in the direction of the curve occurs, it is a sign that the solid phase has undergone alteration. Conversely, if it is known that a change takes place in the solid phase, a break in the solubility curve can be predicted. We shall presently meet with examples of this.[186]
A.—Anhydrous Salt and Water.
The Solubility Curve.—In studying the equilibria in those systems of two components in which the liquid phase is a solution or phase of varying composition, we shall in the present chapter limit the discussion to those cases where no compounds are formed, but where the components crystallise out in the pure state. Since some of the best-known examples of such systems are yielded by the solutions of anhydrous salts in water, we shall first of all briefly consider some of the results which have been obtained with them.
For the most part the solubility curves have been studied only at temperatures lying between 0° and 100°, the solid phase in contact with the solution being the anhydrous salt. For the representation of these equilibria, the concentration-temperature {112}diagram is employed, the concentration being expressed as the number of grams of the salt dissolved in 100 grams of water, or as the number of gram-molecules of salt in 100 gram-molecules of water. The curves thus obtained exhibit the different forms to which reference has already been made. So long as the salt remains unchanged the curve will be continuous, but if the salt alters its form, then the solubility curve will show a break.
 Fig. 27.
Now, we have already seen in Chapter III. that certain substances are capable of existing in various crystalline forms, and these forms are so related to one another that at a given temperature the relative stability of each pair of polymorphic forms undergoes change. Since each crystalline variety of a substance must have its own solubility, there must be a break in the solubility curve at the temperature of transition of the two enantiotropic forms. At this point the two solubility curves must cut, for since the two forms are in equilibrium with respect to their vapour, they must also be in equilibrium with respect to their solutions. From the table on p. 63 it is seen that potassium nitrate, ammonium nitrate, silver nitrate, thallium nitrate, thallium picrate, are capable of existing in two or more different enantiotropic crystalline forms, the range of stability of these forms being limited by definite temperatures (transition temperature). Since the transition point is not altered by a solvent (provided the latter is not absorbed by the solid phase), we should find on studying the solubility of these substances in water that the solubility curve would exhibit a change in direction at the temperature of transition. As a matter of fact this has been verified, more especially in the case of ammonium nitrate[187] {113}and thallium picrate.[188] The following table contains the values of the solubility of ammonium nitrate obtained by Müller and Kaufmann, the solubility being expressed in gram-molecules NH4NO3 in 100 gram-molecules of water. In Fig. 27 these results are represented graphically. The equilibrium point was approached both from the side of unsaturation and of supersaturation, and the condition of equilibrium was controlled by determinations of the density of the solution.
Solubility of Ammonium Nitrate.
| Temperature. | Solubility. | Temperature. | Solubility. |
| 12.2° | 34.50 | 32.7° | 57.90 |
| 20.2° | 43.30 | 34.0° | 58.89 |
| 25.05° | 48.19 | 35.0° | 59.80 |
| 28.0° | 51.86 | 36.0° | 61.00 |
| 30.0° | 54.40 | 37.5° | 62.90 |
| 30.2° | 54.61 | 38.0° | 63.60 |
| 31.9° | 57.20 | 39.0° | 65.09 |
| 32.1° | 57.60 | 40.0° | 66.80 |
From the graphic representation of the solubility given in Fig. 27, there is seen to be a distinct change in the direction of the curve at a temperature of 32°; and this break in the curve corresponds to the transition of the β-rhombic into the α-rhombic form of ammonium nitrate (p. 63).
Suspended Transformation and Supersaturation.—As has already been learned, the transformation of the one crystalline form into the other does not necessarily take place immediately the transition point has been passed; and it has therefore been found possible in a number of cases to follow the solubility curve of a given crystalline form beyond the point at which it ceases to be the most stable modification. Now, it will be readily seen from Fig. 27 that if the two solubility curves be prolonged beyond the point of intersection, the solubility of the less stable form is greater than that of the more stable. A solution, therefore, which is saturated with respect to the less stable form, i.e. which is in equilibrium with that form, is supersaturated with respect to the more stable modification. If, {114}therefore, a small quantity of the more stable form is introduced into the solution, the latter must deposit such an amount of the more stable form that the concentration of the solution corresponds to the solubility of the stable form at the particular temperature. Since, however, the solution is now unsaturated with respect to the less stable variety, the latter, if present, must pass into solution; and the two processes, deposition of the stable and solution of the metastable form, must go on until the latter form has entirely disappeared and a saturated solution of the stable form is obtained. There will thus be a conversion, through the medium of the solvent, of the less stable into the more stable modification. This behaviour is of practical importance in the determination of transition points (v. Appendix).
From the above discussion it will be seen how important is the statement of the solid phase for the definition of saturation and supersaturation.[189]
Solubility Curve at Higher Temperatures.—On passing to the consideration of the solubility curves at higher temperatures, two chief cases must be distinguished.
(1) The two components in the fused state can mix in all proportions.
(2) The two components in the fused state cannot mix in all proportions.
1. Complete Miscibility of the Fused Components.
 Fig. 28.
The best example of this which has been studied, so far as anhydrous salts and water are concerned, is that of silver nitrate and water. The solubility of this salt at temperatures {115}above 100° has been studied chiefly by Etard[190] and by Tilden and Shenstone.[191] The values obtained by Etard are given in the following table, and represented graphically in Fig. 28.
Solubility of Silver Nitrate.
| Temperature. | Parts of dry salt in 100 parts of solution. |
| -7° | 46.2 |
| -1° | 52.1 |
| +5° | 56.3 |
| 10° | 61.2 |
| 20° | 67.8 |
| 40.5° | 76.8 |
| 73° | 84.0 |
| 135° | 92.8 |
| 182° | 96.9 |
In this figure the composition of the solution is expressed in parts of silver nitrate in 100 parts by weight of the solution, so that 100 per cent. represents pure silver nitrate. As can be seen, the solubility increases with the temperature. At a temperature of about 160° there should be a break in the curve due to change of crystalline form (p. 63). Such a change in the direction of the solubility curve, however, does not in any way alter the essential nature of the relationships discussed here, and may for the present be left out of account. On following the solubility curve of silver nitrate to higher temperatures, therefore, the concentration of silver nitrate in the solution gradually increases, until at last, at a temperature of 208°,[192] the melting point of pure silver nitrate is reached, and the concentration of the water has become zero. The curve throughout its whole extent represents the equilibrium between silver nitrate, solution, and vapour. Conversely, starting with pure silver nitrate in contact with the fused salt, addition of water will lower the melting point, i.e. will lower the temperature at which the solid salt can exist in contact with the liquid; {116}and the depression will be all the greater the larger the amount of water added. As the concentration of the water in the liquid phase is increased, therefore, the system will pass back along the curve from higher to lower temperatures, and from greater to smaller concentrations of silver nitrate in the liquid phase. The curve in Fig. 28 may, therefore, be regarded either as the solubility curve of silver nitrate in water, or as the freezing point curve for silver nitrate in contact with a solution consisting of that salt and water.
As the temperature of the saturated solution falls, silver nitrate is deposited, and on lowering the temperature sufficiently a point will at last be reached at which ice also begins to separate out. Since there are now four phases co-existing, viz. silver nitrate, ice, solution, vapour, the system is invariant, and the point is a quadruple point. This quadruple point, therefore, forms the lower limit of the solubility curve of silver nitrate. Below this point the solution becomes metastable.
Ice as Solid Phase.—Ice melts or is in equilibrium with water at a temperature of 0°. The melting point, will, however, be lowered by the solution of silver nitrate in the water; and the greater the concentration of the salt in the solution the greater will be the depression of the temperature of equilibrium. On continuing the addition of silver nitrate, a point will at length be reached at which the salt is no longer dissolved, but remains in the solid form along with the ice. We again obtain, therefore, the invariant system ice—salt—solution—vapour. The temperature at which this invariant system can exist has been found by Middelberg[193] to be -7.3°, the solution at this point containing 47.1 per cent. of silver nitrate.
The same general behaviour will be found in the case of all other systems of two components belonging to this class; that is, in the case of systems from which the components crystallise out in the pure state, and in which the fused components are miscible in all proportions. In all such cases, therefore, the solubility curves (curves of equilibrium) can be represented diagrammatically as in Fig. 29. In this figure OA represents the solubility curve of the salt, and OB the freezing {117}point curve of ice. O is the quadruple point at which the invariant system exists, and may be regarded as the point of intersection of the solubility curve with the freezing-point curve. Since this point is fixed, the condition of the system as regards temperature, vapour pressure, and concentration of the components (or composition of the solution), is perfectly definite. From the way, also, in which the condition is attained, it is evident that the quadruple point is the lowest temperature that can be obtained with mixtures of the two components in presence of vapour. It is known as the cryohydric point, or, generally, the eutectic point.[194]
 Fig. 29.
Cryohydrates.[195]—On cooling a solution of common salt in water to a temperature of -3°, Guthrie observed that the hydrate NaCl,2H2O separated out. This salt continued to be deposited until at a temperature of -22° opaque crystals made their appearance, and the liquid passed into the solid state without change of temperature. A similar behaviour was found by Guthrie in the case of a large number of other salts, a temperature below that of the melting point of ice being reached at which on continued withdrawal of heat, the solution solidified at a constant temperature. When the system had attained this minimum temperature, it was found that the composition of the solid and the liquid phases was the same, and remained unchanged throughout the period of solidification. This is shown by the following figures, which give the composition of different samples of the solid phase deposited from the solution at constant temperature.[196]
| No. | Temperature of solidification. | NaCl. Per cent. |
| 1 | -21° to -22° | 23.72 |
| 2 | -22° | 23.66 |
| 3 | -22° | 23.73 |
| 4 | -23° | 23.82 |
| 5 | -23° | 23.34 |
| 6 | -23° | 23.35 |
| Mean | 23.6 | |
Conversely, a mixture of ice and salt containing 23.6 per cent. of sodium chloride will melt at a definite and constant temperature, and exhibit, therefore, a behaviour supposed to be characteristic of a pure chemical compound. This, then, combined with the fact that the solid which was deposited was crystalline, and that the same constant temperature was attained, no matter with what proportions of water and salt one started, led Guthrie to the belief that the solids which thus separated at constant temperature were definite chemical compounds, to which he gave the general name cryohydrate. A large number of such cryohydrates were prepared and analysed by Guthrie, and a few of these are given in the following table, together with the temperature of the cryohydric point:[197]—
Cryohydrates.
| Salt. | Cryohydric point. | Percentage of anhydrous salt in the cryohydrate. |
| Sodium bromide | -24° | 41.33 |
| Sodium chloride | -22° | 23.60 |
| Potassium iodide | -22° | 52.07 |
| Sodium nitrate | -17.5° | 40.80 |
| Ammonium sulphate | -17° | 41.70 |
| Ammonium chloride | -15° | 19.27 |
| Sodium iodide | -15° | 59.45 |
| Potassium bromide | -13° | 32.15 |
| Potassium chloride | -11.4° | 20.03 |
| Magnesium sulphate | - 5° | 21.86 |
| Potassium nitrate | -2.6° | 11.20 |
| Sodium sulphate | -0.7° | 4.55 |
The chemical individuality of these cryohydrates was, however, called in question by Pfaundler,[198] and disproved by Offer,[199] who showed that in spite of the constancy of the melting point, the cryohydrates had the properties, not of definite chemical compounds, but of mixtures; the arguments given being that the heat of solution and the specific volume are the same for the cryohydrate as for a mixture of ice and salt of the same composition; and it was further shown that the cryohydrate had not a definite crystalline form, but separated out as an opaque mass containing the two components in close juxtaposition. The heterogeneous nature of cryohydrates can also be shown by a microscopical examination.
At the cryohydric point, therefore, we are not dealing with a single solid phase, but with two solid phases, ice and salt; the cryohydric point, therefore, as already stated, is a quadruple point and represents an invariant system.
Although on cooling a solution to the cryohydric point, separation of ice may occur, it will not necessarily take place; the system may become metastable. Similarly, separation of salt may not take place immediately the cryohydric point is reached. It will, therefore, be possible to follow the curves BO and AO beyond the quadruple point,[200] which is thereby clearly seen to be the point of intersection of the solubility curve of the salt and the freezing-point curve of ice. At this point, also, the curves of the univariant systems ice—salt—vapour and ice—salt—solution intersect.
Changes at the Quadruple Point.—Since the invariant system ice—salt—solution—vapour can exist only at a definite temperature, addition or withdrawal of heat must cause the disappearance of one of the phases, whereby the system will become univariant. So long as all four phases are present the temperature, pressure, and concentration of the components in the solution must remain constant. When, therefore, heat is added to or withdrawn from the system, mutually compensatory changes will take place within the system whereby the {120}condition of the latter is preserved. These changes can in all cases be foreseen with the help of the theorem of van't Hoff and Le Chatelier; and, after what was said in Chap. IV., need only be briefly referred to here. In the first place, addition of heat will cause ice to melt, and the concentration of the solution will be thereby altered; salt must therefore dissolve until the original concentration is reached, and the heat of fusion of ice will be counteracted by the heat of solution of the salt. Changes of volume of the solid and liquid phases must also be taken into account; an alteration in the volume of these phases being compensated by condensation or evaporation. All four phases will therefore be involved in the change, and the final state of the system will be dependent on the amounts of the different phases present; the ultimate result of addition or withdrawal of heat or of change of pressure at the quadruple point will be one of the four univariant systems: ice—solution—vapour; salt—solution—vapour; ice—salt—vapour; ice—salt—solution. If the vapour phase disappear, there will be left the univariant system ice—salt—solution, and the temperature at which this system can exist will alter with the pressure. Since in this case the influence of pressure is comparatively slight, the temperature of the quadruple point will differ only slightly from that of the cryohydric point as determined under atmospheric pressure.
Freezing Mixtures.—Not only will the composition of a univariant system undergo change when the temperature is varied, but, conversely, if the composition of the system is caused to change, corresponding changes of temperature must ensue. Thus, if ice is added to the univariant system salt—solution—vapour, the ice must melt and the temperature fall; and if sufficient ice is added, the temperature of the cryohydric point must be at length reached, for it is only at this temperature that the four phases ice—salt—solution—vapour can coexist. Or, on the other hand, if salt is added to the system ice—solution—vapour, the concentration of the solution will increase, ice must melt, and the temperature must thereby fall; and this process also will go on until the cryohydric point is reached. In both cases ice melts and there is a change in the {121}composition of the solution; in the former case, salt will be deposited[201] because the solubility diminishes as the temperature falls; in the latter, salt will pass into solution. This process may be accompanied either by an evolution or, more generally, by absorption of heat; in the former case the effect of the addition of ice will be partially counteracted; in the latter case it will be augmented.
These principles are made use of in the preparation of freezing mixtures. The lowest temperature which can be reached by means of these (under atmospheric pressure) is the cryohydric point. This temperature-minimum is, however, not always attained in the preparation of a freezing mixture, and that for various reasons. The chief of these are radiation and the heat absorbed in cooling the solution produced. The lower the temperature falls, the more rapid does the radiation become; and the rate at which the temperature sinks decreases as the amount of solution increases. Both these factors counteract the effect of the latent heat of fusion and the heat of solution, so that a point is reached (which may lie considerably above the cryohydric point) at which the two opposing influences balance. The absorption of heat by the solution can be diminished by allowing the solution to drain off as fast as it is produced; and the effect of radiation can be partially annulled by increasing the rate of cooling. This can be done by the more intimate mixing of the components. Since, under atmospheric pressure, the temperature of the cryohydric point is constant, the cryohydrates are very valuable for the production of baths of constant low temperature.
2. Partial Miscibility of the Fused Components.
On passing to the study of the second class of systems of two components belonging to this group, namely, those in which the fused components are not miscible in all proportions, we find that the relationships are not quite so simple as {122}in the case of silver nitrate and water. In the latter case, only one liquid phase was possible; in the cases now to be studied, two liquid phases can be formed, and there is a marked discontinuity in the solubility curve on passing from the cryohydric point to the melting point of the second (non-volatile) component.
Paratoluidine dissolves in water, and the solubility increases as the temperature rises.[202] At 44.2°, however, paratoluidine in contact with water melts, and two liquid phases are formed, viz. a solution of water in fused paratoluidine and a solution of fused paratoluidine in water. We have, therefore, the phenomenon of melting under the solvent. This melting point will, of course, be lower than the melting point of the pure substance, because the solid is now in contact with a solution, and, as we have already seen, addition of a foreign substance lowers the melting point. Such cases of melting under the solvent are by no means rare, and a review of the relationships met with may, therefore, be undertaken here. As an example, there may be chosen the equilibrium between succinic nitrile, C2H4(CN)2 and water, which has been fully studied by Schreinemakers.[203]
 Fig. 30.
If to the system ice—water at 0° succinic nitrile is added, the temperature will fall; and continued addition of the nitrile will lead at last to the cryohydric point b (Fig. 30), at which solid nitrile, ice, solution, and vapour can coexist. The temperature of the cryohydric point is -1.2°, and the composition of the solution is 1.29 mol. of nitrile in 100 mol. of solution. From a to b the solid phase in contact with the solution is ice. {123}If the temperature be now raised so as to cause the disappearance of the ice, and the addition of nitrile be continued, the concentration of the nitrile in the solution will increase as represented by the curve bc. At the point c (18.5°), when the concentration of the nitrile in the solution has increased to 2.5 molecules per cent., the nitrile melts and two liquid phases are formed; the concentration of the nitrile in these two phases is given by the points c and c′. As there are now four phases present, viz. solid nitrile, solution of fused nitrile in water, solution of water in fused nitrile, and vapour, the system is invariant. Since at this point the concentration, temperature, and pressure are completely defined, addition or withdrawal of heat can only cause a change in the relative amounts of the phases, but no variation of the concentrations of the respective phases. As a matter of fact, continued addition of nitrile and addition of heat will cause an increase in the amount of the liquid phase containing excess of nitrile (i.e. the solution of water in fused nitrile), whereas the other liquid phase, the solution of fused nitrile in water, will gradually disappear. When it has completely disappeared, the system will be represented by the point c′, where the molecular concentration of nitrile is now 75 per cent., and again becomes univariant, the three phases being solid nitrile, liquid phase containing excess of nitrile, and vapour; and as the amount of the water is diminished the temperature of equilibrium rises, until at 54° the melting point of the pure nitrile is reached.
Return now to the point c. At this point there exists the invariant system solid nitrile, two liquid phases, vapour. If heat be added, the solid nitrile will disappear, and there will be left the univariant system, consisting of two liquid phases and vapour.[204] Such a system will exhibit relationships similar to those already studied in the previous chapter. As the temperature rises, the mutual solubility of the two fused components becomes greater, until at d (55.5°) the critical solution temperature is reached, and the fused components become miscible in all proportions.
At all temperatures and concentrations lying to the right {124}of the curve abcdc′e there can be only one liquid phase; in the field cdc′ there are two liquid phases.
From the figure it will be easy to see what will be the result of bringing together succinic nitrile and water at different temperatures and in different amounts. Since b is the lowest temperature at which liquid can exist in stable equilibrium with solid, ice and succinic nitrile can be mixed in any proportions at temperatures below b without undergoing change. Between b and c succinic nitrile will be dissolved until the concentration reaches the value on the curve bc, corresponding to the given temperature. On adding the nitrile to water at temperatures between c and d, it will dissolve until a concentration lying on the curve cd is attained; at this point two liquid phases will be formed, and further addition of nitrile will cause the one liquid phase (that containing excess of nitrile) to increase, while the other liquid phase will decrease, until it finally disappears and there is only one liquid phase left, that containing excess of nitrile. This can dissolve further quantities of the nitrile, and the concentration will increase until the curve c′e is reached, when the concentration will remain unchanged, and addition of solid will merely increase the amount of the solid phase.
If a solution represented by any point in the field lying below the curve bcd is heated to a temperature above d, the critical solution temperature, then the concentration of the nitrile can be increased to any desired amount without at any time two liquid phases making their appearance; the system can then be cooled down to a temperature represented by any point between the curves dc′e. In this way it is possible to pass continuously from a solution containing excess of one component to solutions containing excess of the other, as represented by the dotted line xxxx (v. p. 100). At no point is there formation of two liquid phases.
Supersaturation.—Just as suspended transformation is rarely met with in the passage from the solid to the liquid state, so also it is found in the case of the melting of substances under the solvent that suspended fusion does not occur; but that when the temperature of the invariant point is reached at which, therefore, the formation of two liquid layers is possible, {125}these two liquid layers, as a matter of fact, make their appearance. Suspended transformation can, however, take place from the side of the liquid phase, just as water or other liquid can be cooled below the normal freezing point without solidification occurring. The question, therefore, arises as to the relative solubilities of the solid and the supercooled liquid at the same temperature.
 Fig. 31.
The answer to this question can at once be given from what we have already learned (p. 113), if we recollect that at temperatures below the point of fusion under the solvent, the solid form, at temperatures above that point, the liquid form, is the more stable; at this temperature, therefore, the relative stability of the solid and liquid forms changes. Since, as we have already seen, the less stable form has the greater solubility, it follows that the supercooled liquid, being the less stable form, must have the greater solubility. This was first proved experimentally by Alexejeff[205] in the case of benzoic acid and water, the solubility curves for which are given in Fig. 31. As can be seen from the figure, the prolongation of the curve for liquid—liquid, which represents the solubility of the supercooled liquid benzoic acid, lies above that for the solubility of the {126}solid benzoic acid in water; the solution saturated with respect to the supercooled liquid is therefore supersaturated with respect to the solid form. A similar behaviour has been found in the case of other substances.[206]
Pressure-Temperature Diagram.—Having considered the changes which occur in the concentration of the components in a solution with the temperature, we may conclude the discussion of the equilibrium between a salt and water by studying the variation of the vapour pressure.
Since in systems of two components the two phases, solution and vapour, constitute a bivariant system, the vapour pressure is undefined, and may have different values at the same temperature, depending on the concentration. In order that there may be for each temperature a definite corresponding pressure of the vapour, a third phase must be present. This condition is satisfied by the system solid—liquid (solution)—vapour; that is, by the saturated solution (p. 108). In the case of a saturated solution, therefore, the pressure of the vapour at any given temperature is constant.
Vapour Pressure of Solid—Solution—Vapour.—It has long been known that the addition of a non-volatile solid to a liquid in which it is soluble lowers the vapour pressure of the solvent; and the diminution of the pressure is approximately proportional to the amount of substance dissolved (Law of Babo). The vapour-pressure curve, therefore, of a solution of a salt in water must lie below that for pure water. Further, in the case of a pure liquid, the vaporization curve is a function only of the temperature (p. 63), whereas, in the case of a solution, the pressure varies both with the temperature and the concentration. These two factors, however, act in opposite directions; for although the vapour pressure in all cases increases as the temperature rises, increase of concentration, as we have seen, lowers the vapour pressure. Again, since the concentration itself varies with the temperature, two cases have to be considered, viz. where the concentration increases with rise of {127}temperature, and where the concentration diminishes with rise of temperature.
The relations which are found here will be best understood with the help of Fig. 32.[207] In this figure, OB represents the sublimation curve of ice, and BC the vaporization curve of water; the curve for the solution must lie below this, and must cut the sublimation curve of ice at some temperature below the melting point. The point of intersection A is the cryohydric point. If the solubility increases with rise of temperature, the increase of the vapour pressure due to the latter will be partially annulled. Since at first the effect of increase of temperature more than counteracts the depressing action of increase of concentration, the vapour pressure will increase on raising the temperature above the cryohydric point. If the elevation of temperature is continued, however, to the melting point of the salt, the effect of increasing concentration makes itself more and more felt, so that the vapour-pressure curve of the solution falls more and more below that of the pure liquid, and the pressure will ultimately become equal to that of the pure salt; that is to say, practically equal to zero. The curve will therefore be of the general form AMF shown in Fig. 32. If the solubility should diminish with rise of temperature, the two factors, temperature and concentration, will act in the same direction, and the vapour-pressure curve will rise relatively more rapid than that of the pure liquid; since, however, the pure salt is ultimately obtained, the vapour-pressure curve must in this case also finally approach the value zero.
 Fig. 32.
Other Univariant Systems.—Besides the univariant system {128}salt—solution—vapour already considered, three others are possible, viz. ice—solution—vapour, ice—salt—solution, and ice—salt—vapour.
The fusion point of a substance is lowered, as we have seen, by the addition of a foreign substance, and the depression is all the greater the larger the quantity of substance added. The vapour pressure of the water, also, is lowered by the solution in it of other substances, so that the vapour pressure of the system ice—solution—vapour must decrease as the temperature falls from the fusion point of ice to the cryohydric point. This curve is represented by BA (Fig. 32), and is coincident with the sublimation curve of ice.
This, at first sight, strange fact will be readily understood when we consider that since ice and solution are together in equilibrium with the same vapour, they must have the same vapour pressure. For suppose at any given temperature equilibrium to have been established in the system ice—solution—vapour, removal of the ice will not alter this equilibrium. Suppose, now, the ice and the solution placed under a bell-jar so that they have a common vapour, but are not themselves in contact; then, if they do not have the same vapour pressure, distillation must take place and the solution will become more dilute or more concentrated. Since, at the completion of this process, the ice and solution are now in equilibrium when they are not in contact, they must also be in equilibrium when they are in contact (p. 32). But if distillation has taken place the concentration of the solution must have altered, so that the ice will now be in equilibrium with a solution of a different concentration from before. But according to the Phase Rule ice cannot at one and the same temperature be in equilibrium with two solutions of different concentration, for the system ice—solution—vapour is univariant, and at any given temperature, therefore, not only the pressure but also the concentration of the components in the solution must be constant. Distillation could not, therefore, take place from the ice to the solution or vice versâ; that is to say, the solution and the ice must have the same vapour pressure—the sublimation pressure of ice. The reason of the coincidence is the non-volatility of the salt: had {129}the salt a measurable vapour pressure itself, the sublimation curve of ice and the curve for ice—solution—vapour would no longer fall together.
The curve AO represents the pressures of the system ice—salt—vapour. This curve will also be coincident with the sublimation curve of ice, on account of the non-volatility of the salt.
The equilibria of the fourth univariant system ice—salt—solution are represented by AE. Since this is a condensed system, the effect of a small change of temperature will be to cause a large change of pressure, as in the case of the fusion point of a pure substance. The direction of this curve will depend on whether there is an increase or diminution of volume on solidification; but the effect in any given case can be predicted with the help of the theorem of Le Chatelier.
Since the cryohydric point is a quadruple point in a two-component system, it represents an invariant system. The condition of the system is, therefore, completely defined; the four phases, ice, salt, solution, vapour, can co-exist only when the temperature, pressure, and concentration of the solution have constant and definite values. Addition or withdrawal of heat, therefore, can cause no alteration of the condition of the system except a variation of the relative amounts of the phases. Addition of heat at constant volume will ultimately lead to the system salt—solution—vapour or the system ice—solution—vapour, according as ice or salt disappears first. This is readily apparent from the diagram (Fig. 32), for the systems ice—salt—solution and ice—salt—vapour can exist only at temperatures below the cryohydric point (provided the curve for ice—salt—solution slopes towards the pressure axis).
Bivariant Systems.—Besides the univariant systems already discussed, various bivariant systems are possible, the conditions for the existence of which are represented by the different areas of Fig. 32. They are as follows:—
| Area. | System. |
| OAMF | Salt—vapour. |
| CBAMF | Solution—vapour; salt—solution. |
| EABD | Salt—solution; ice—solution. |
| EAO | Ice—salt. |
Deliquescence.—As is evident from Fig. 32, salt can exist in contact with water vapour at pressures under those represented by OAMF. If, however, the pressure of the vapour is increased until it reaches a value lying on this curve at temperatures above the cryohydric point, solution will be formed; for the curve AMF represents the equilibria between salt—solution—vapour. From this, therefore, it is clear that if the pressure of the aqueous vapour in the atmosphere is greater than that of the saturated solution of a salt, that salt will, on being placed in the air, form a solution; it will deliquesce.
Separation of Salt on Evaporation.—With the help of Fig. 32 it is possible to state in a general manner whether or not salt will be deposited when a solution is evaporated under a constant pressure.[208]
The curve AMF (Fig. 32) is the vapour-pressure curve of the saturated solutions of the salt, i.e. it represents, as we have seen, the maximum vapour pressure at which salt can exist in contact with solution and vapour. The dotted line aa represents atmospheric pressure. If, now, an unsaturated solution, the composition of which is represented by the point x, is heated in an open vessel, the temperature will rise, and the vapour pressure of the solution will increase. The system will, therefore, pass along a line represented diagrammatically by xx′. At the point x′ the vapour pressure of the system becomes equal to 1 atm.; and as the vessel is open to the air, the pressure cannot further rise; the solution boils. If the heating is continued, water passes off, the concentration increases, and the boiling point rises. The system will therefore pass along the line x′m, until at the point m solid salt separates out (provided supersaturation is excluded). The system is now univariant, and continued heating will no longer cause an alteration of the concentration; as water passes off, solid salt will be deposited, and the solution will evaporate to dryness.
If, however, the atmospheric pressure is represented not by aa but by bb, then, as Fig. 32 shows, the maximum vapour {131}pressure of the system salt—solution—vapour never reaches the pressure of 1 atm. Further, since the curve bb lies in the area of the bivariant system solution—vapour there can at no point be a separation of the solid form; for the system solid—solution—vapour can exist only along the curve AMF.
On evaporating the solution of a salt in an open vessel, therefore, salt can be deposited only if at some temperature the pressure of the saturated solution is equal to the atmospheric pressure. This is found to be the case with most salts. In the case of aqueous solutions of sodium and potassium hydroxide, however, the vapour pressure of the saturated solution never reaches the value of 1 atm., and on evaporating these solutions, therefore, in an open vessel, there is no separation of the solid. Only a homogeneous fused mass is obtained. If, however, the evaporation be carried out under a pressure which is lower than the maximum pressure of the saturated solution, separation of the solid substance will be possible.
General Summary.—The systems which have been discussed in the present chapter contained water as one of their components, and an anhydrous salt as the other. It will, however, be clear that the relationships which were found in the case of these will be found also in other cases where it is a question of the equilibria between two components, which crystallize out in the pure state, and only one of which possesses a measurable vapour pressure. A similar behaviour will, for example, be found in the case of many pairs of organic substances; and in all cases the equilibria will be represented by a diagram of the general appearance of Fig. 29 or Fig. 30. That is to say: Starting from the fusion point of component I., the system will pass, by progressive addition of component II., to regions of lower temperature, until at last the cryohydric or eutectic point is reached. On further addition of component II., the system will pass to regions of higher temperature, the solid phase now being component II. If the fused components are miscible with one another in all proportions a continuous curve will be obtained leading up to the point of fusion of component II. Slight changes of direction, it is true, due to changes in the crystalline form, may be found along this curve, {132}but throughout its whole course there will be but one liquid phase. If, on the other hand, the fused components are not miscible in all proportions, then the second curve will exhibit a marked discontinuity, and two liquid phases will make their appearance.
SOLUTIONS OF SOLIDS IN LIQUIDS, ONLY ONE OF THE COMPONENTS BEING VOLATILE
B.—Hydrated Salt and Water.
In the preceding chapter we discussed the behaviour of systems formed of two components, only one of which was volatile, in those cases where the two components separated from solution in the pure state. In the present chapter we shall consider those systems in which combination between the components can occur with the formation of definite compounds; such as are found in the case of crystalline salt hydrates. Since a not inconsiderable amount of study has been devoted to the systems formed by hydrated salts and water, systems which are of great chemical interest and importance, the behaviour of these will first call for discussion in some detail, and it will be found later that the relationships which exist in such systems appear also in a large number of other two-component systems.
The systems belonging to this group may be divided into two classes according as the compounds formed possess a definite melting point, i.e. form a liquid phase of the same composition, or do not do so. We shall consider the latter first.
1. The Compounds formed do not have a Definite Melting Point.
Concentration-Temperature Diagram.—In the case of salts which can form crystalline hydrates, the temperature-concentration diagram, representing the equilibria of the {134}different possible systems, must necessarily be somewhat more complicated than where no such combination of the components occurs. For, as has already been pointed out, each substance has its own solubility curve; and there will therefore be as many solubility curves as there are solid phases possible, the curve for each particular solid phase being continuous so long as it remains unchanged in contact with the solution. As an example of the relationships met with in such cases, we shall first of all consider the systems formed of sodium sulphate and water.
 Fig. 33.
Sodium Sulphate and Water.—At the ordinary temperatures, sodium sulphate crystallises from water with ten molecules of water of crystallisation, forming Glauber's salt. On determining the solubility of this salt in water, it is found that the solubility increases as the temperature rises, the values of the solubility, represented graphically by the curve AC (Fig. 33), being given in the following table.[209] The numbers denote grams of sodium sulphate, calculated as anhydrous salt, dissolved by 100 grams of water.
Solubility of Na2SO4,10H2O.
| Temperature. | Solubility. |
| 0° | 5.02 |
| 10° | 9.00 |
| 15° | 13.20 |
| 18° | 16.80 |
| 20° | 19.40 |
| 25° | 28.00 |
| 30° | 40.00 |
| 33° | 50.76 |
| 34° | 55.00 |
On continuing the investigation at higher temperatures, it was found that the solubility no longer increased, but decreased with rise of temperature. At the same time, it was observed that the solid phase was now different from that in contact with the solution at temperatures below 33°; for whereas in the latter case the solid phase was sodium sulphate decahydrate, at temperatures above 33° the solid phase was the anhydrous salt. The course of the solubility curve of anhydrous sodium sulphate is shown by BD, and the values of the solubility are given in the following table:—[210]
Solubility of Anhydrous Sodium Sulphate.
| Temperature. | Solubility. |
| 18° | 53.25 |
| 20° | 52.76 |
| 25° | 51.53 |
| 30° | 50.37 |
| 33° | 49.71 |
| 34° | 49.53 |
| 36° | 49.27 |
| 40.15° | 48.78 |
| 50.40° | 46.82 |
As is evident from the figure, the solubility curve which is obtained when anhydrous sodium sulphate is present as the solid phase, cuts the curve representing the solubility of the decahydrate, at a temperature of about 33°.
If a solution of sodium sulphate which has been saturated at a temperature of about 34° be cooled down to a temperature below 17°, while care is taken that the solution is protected against access of particles of Glauber's salt, crystals of a second hydrate of sodium sulphate, having the composition Na2SO4,7H2O, separate out. On determining the composition of the solutions in equilibrium with this hydrate at different temperatures, the following values were obtained, these values being represented by the curve FE (Fig. 33):—
Solubility of Na2SO4,7H2O.
| Temperature. | Solubility. |
| 0° | 19.62 |
| 10° | 30.49 |
| 15° | 37.43 |
| 18° | 41.63 |
| 20° | 44.73 |
| 25° | 52.94 |
| 26° | 54.97 |
Since, as has already been stated, each solid substance has its own solubility curve, there are three separate curves to be considered in the case of sodium sulphate and water. Where two curves cut, the solution must be saturated with respect to two solid phases; at the point B, therefore, the point of intersection of the solubility curve of anhydrous sodium sulphate with that of the decahydrate, the solution must be saturated with respect to these two solid substances. But a system of two components existing in four phases, anhydrous salt—hydrated salt—solution—vapour, is invariant; and this invariability will remain even if only three phases are present, provided that one of the factors, pressure, temperature, or concentration of components retains a constant value. This is the case when solubilities are determined in open vessels; the pressure is then equal to atmospheric pressure. Under these circumstances, then, the system, anhydrous sodium sulphate—decahydrate—solution, will possess no degree of freedom, and can exist, therefore, only at one definite temperature and when the solution has a certain definite composition. The temperature of this point is 32.482° on a mercury thermometer, or 32.379° on the hydrogen thermometer.[211]
Suspended Transformation.—Although it is possible for the anhydrous salt to make its appearance at the temperature of the quadruple point, it will not necessarily do so; and it is therefore possible to follow the solubility curve of sodium sulphate decahydrate to a higher temperature. Since, however, the solubility of the decahydrate at temperatures above the quadruple point is greater than that of the anhydrous salt, the solution which is saturated with respect to the former will be supersaturated with respect to the latter. On bringing a small quantity of the anhydrous salt in contact with the solution, therefore, anhydrous salt will be deposited; and all the hydrated salt present will ultimately undergo conversion into the anhydrous salt, through the medium of the solution. In this case, as in all cases, the solid phase, which is the most stable at the temperature of the experiment, has at that temperature the least solubility.
Similarly, the solubility curve of anhydrous sodium sulphate has been followed to temperatures below 32.5°. Below this temperature, however, the solubility of this salt is greater than that of the decahydrate, and the saturated solution of the anhydrous salt will therefore be supersaturated for the decahydrate, and will deposit this salt if a "nucleus" is added to the solution. From this we see that at temperatures above 32.5° the anhydrous salt is the stable form, while the decahydrate is unstable (or metastable); at temperatures below 32.5° the decahydrate is stable. This temperature, therefore, is the transition temperature for decahydrate and anhydrous salt.
From Fig. 33 we see further that the solubility curve of the anhydrous salt (which at all temperatures below 32.5° is metastable) is cut by the solubility curve of the heptahydrate; and this point of intersection (at a temperature of 24.2°) must be the transition point for heptahydrate and anhydrous salt. Since at all temperatures the solubility of the heptahydrate is greater than that of the decahydrate, the former hydrate must be metastable with respect to the latter; so that throughout its whole course the solubility curve of the heptahydrate {138}represents only metastable equilibria. Sodium sulphate, therefore, forms only one stable hydrate, the decahydrate.
The solubility relations of sodium sulphate illustrate very clearly the importance of the solid phase for the definition of saturation and supersaturation. Since the solubility curve of the anhydrous salt has been followed backwards to a temperature of about 18°, it is readily seen, from Fig. 33, that at a temperature of, say, 20° three different saturated solutions of sodium sulphate are possible, according as the anhydrous salt, the heptahydrate or the decahydrate, is present as the solid phase. Two of these solutions, however, would be metastable and supersaturated with respect to the decahydrate.
Further, the behaviour of sodium sulphate and water furnishes a very good example of the fact that a "break" in the solubility curve occurs when, and only when, the solid phase undergoes change. So long as the decahydrate, for example, remained unaltered in contact with the solution, the solubility curve was continuous; but when the anhydrous salt appeared in the solid phase, a distinct change in the direction of the solubility curve was observed.
Dehydration by Means of Anhydrous Sodium Sulphate.—The change in the relative stability of sodium sulphate decahydrate and anhydrous salt in presence of water at a temperature of 32.5° explains why the latter salt cannot be employed for dehydration purposes at temperatures above the transition point. The dehydrating action of the anhydrous salt depends on the formation of the decahydrate; but since at temperatures above 33° the latter is unstable, and cannot be formed in presence of the anhydrous salt, this salt cannot, of course, effect a dehydration above that temperature.
Pressure-Temperature Diagram.—The consideration of the pressure-temperature relations of the two components, sodium sulphate and water, must include not only the vapour pressure of the saturated solutions, but also that of the crystalline hydrates. The vapour pressures of salt hydrates have already been treated in a general manner (Chap. V.), so that it is only necessary here to point out the connection between the two classes of systems. {139}
In most cases the vapour pressure of a salt hydrate, i.e. the vapour pressure of the system hydrate—anhydrous salt (or lower hydrate)—vapour, is at all temperatures lower than that of the system anhydrous salt (or lower hydrate)—solution—vapour. This, however, is not a necessity; and cases are known where the vapour pressure of the former system is, under certain circumstances, equal to or higher than that of the latter. An example of this is found in sodium sulphate decahydrate.
On heating Na2SO4,10H2O, a point is reached at which the dissociation pressure into anhydrous salt and water vapour becomes equal to the vapour pressure of the saturated solution of the anhydrous salt, as is apparent from the following measurements;[212] the differences in pressure being expressed in millimetres of a particular oil.
| Temperature: | 29.0° | 30.83° | 31.79° | 32.09° | 32.35° | 32.6° |
| Difference of pressure: | 23.8 | 10.8 | 5.6 | 3.6 | 1.6 | 0 |
At 32.6°, therefore, the vapour pressures of the two systems
Na2SO4,10H2O—Na2SO4—vapour
Na2SO4—solution—vapour
are equal; at this temperature the four phases,
Na2SO4,10H2O;
Na2SO4; solution; vapour, can coexist. From this it
is evident that when sodium sulphate decahydrate is heated to 32.6°, the
two new phases anhydrous salt and solution will be formed (suspended
transformation being supposed excluded), and the hydrate will appear to
undergo partial fusion; and during the process of "melting" the
vapour pressure and temperature will remain constant.[213] This is, however, not a true but a
so-called incongruent melting point; for the composition of the
liquid phase is not the same as that of the solid. As has already been
pointed out (p. 137), we are dealing here with the
transition point of the decahydrate and anhydrous salt,
i.e. with the reaction
Na2SO4,10H2O
Na2SO4 + 10H2O.
Since at the point of partial fusion of the decahydrate four {140}phases can coexist, the point is a quadruple point in a two-component system, and the system at this point is therefore invariant. The temperature of this point is therefore perfectly definite, and on this account the proposal has been made to adopt this as a fixed point in thermometry.[214] The temperature is, of course, practically the same as that at which the two solubility curves intersect (p. 112). If, however, the vapour phase disappears, the system becomes univariant, and the equilibrium temperature undergoes change with change of pressure. The transition curve has been determined by Tammann,[215] and shown to pass through a point of maximum temperature.
 Fig. 34.
The vapour pressure of the different systems of sodium sulphate and water can best be studied with the help of the diagram in Fig. 34.[216] The curve ABCD represents the vapour-pressure curve of the saturated solution of anhydrous sodium sulphate. GC is the pressure curve of decahydrate + anhydrous salt, which, as we have seen, cuts the curve ABCD at the transition temperature, 32.6°. Since at this point the solution is saturated with respect to both the anhydrous salt and the decahydrate, the vapour-pressure curve of the saturated solution of the latter must also pass through the point C.[217] As at temperatures below this point the solubility of the decahydrate is less than that of the anhydrous salt, the vapour pressure of the solution will, in accordance with Babo's law (p. 126), be higher than that of the solution of the anhydrous salt; which was also found experimentally to be the case (curve HC).
In connection with the vapour pressure of the saturated solutions of the anhydrous salt and the decahydrate, attention must be drawn to a conspicuous deviation from what was found to hold in the case of one-component systems in which a vapour phase was present (p. 31). There, it was seen that the vapour pressure of the more stable system was always lower than that of the less stable; in the present case, however, we find that this is no longer so. We have already learned that at temperatures below 32.5° the system decahydrate—solution—vapour is more stable than the system anhydrous salt—solution—vapour; but the vapour pressure of the latter system is, as has just been stated, lower than that of the former. At temperatures above the transition point the vapour pressure of the saturated solution of the decahydrate will be lower than that of the saturated solution of the anhydrous salt.
This behaviour depends on the fact that the less stable form is the more soluble, and that the diminution of the vapour pressure increases with the amount of salt dissolved.
With regard to sodium sulphate heptahydrate the same considerations will hold as in the case of the decahydrate. Since at 24° the four phases heptahydrate, anhydrous salt, solution, vapour can coexist, the vapour-pressure curves of the systems hydrate—anhydrous salt—vapour (curve EB) and hydrate—solution—vapour (curve FB) must cut the pressure curve of the saturated solution of the anhydrous salt at the above temperature, as represented in Fig. 34 by the point B. This constitutes, therefore, a second quadruple point, which is, however, metastable.
From the diagram it is also evident that the dissociation pressure of the heptahydrate is higher than that of the decahydrate, although it contains less water of crystallization. The system heptahydrate—anhydrous salt—vapour must be metastable with respect to the system decahydrate—anhydrous salt—vapour, and will pass into the latter.[218] Whether or not there is a temperature at which the vapour-pressure curves of the two systems intersect, and below which the heptahydrate becomes the more stable form, is not known.
In the case of sodium sulphate there is only one stable hydrate. Other salts are known which exhibit a similar behaviour; and we shall therefore expect that the solubility relationships will be represented by a diagram similar to that for sodium sulphate. A considerable number of such cases have, indeed, been found,[219] and in some cases there is more than one metastable hydrate. This is found, for example, in the case of nickel iodate,[220] the solubility curves for which are given in Fig. 35. As can be seen from the figure, suspended transformation occurs, the solubility curves having in some cases been followed to a considerable distance beyond the transition point. One of the most brilliant examples, however, of suspended transformation in the case of salt hydrates, and the sluggish transition from the less stable to the more stable form, is found in the case of the hydrates of calcium chromate.[221]
 Fig. 35.
In the preceding cases, the dissociation-pressure curve of the hydrated salt cuts the vapour-pressure curve of the saturated {143}solution of the anhydrous salt. It can, however, happen that the dissociation-pressure curve of one hydrate cuts the solubility curve, not of the anhydrous salt, but of a lower hydrate; in this case there will be more than one stable hydrate, each having a stable solubility curve; and these curves will intersect at the temperature of the transition point. Various examples of this behaviour are known, and we choose for illustration the solubility relationships of barium acetate and its hydrates[222] (Fig. 36).
 Fig. 36.
At temperatures above 0°, barium acetate can form two stable hydrates, a trihydrate and a monohydrate. The solubility of the trihydrate increases very rapidly with rise of temperature, and has been determined up to 26.1°. At temperatures above 24.7°, however, the trihydrate is metastable with respect to the monohydrate; for at this temperature the solubility curve of the latter hydrate cuts that of the former. This is, therefore, the transition temperature for the trihydrate and monohydrate. The solubility curve of the monohydrate succeeds that of the trihydrate, and exhibits a conspicuous point of minimum solubility at about 30°. Below 24.7° the {144}monohydrate is the less stable hydrate, but its solubility has been determined to a temperature of 22°. At 41° the solubility curve of the monohydrate intersects that of the anhydrous salt, and this is therefore the transition temperature for the monohydrate and anhydrous salt. Above this temperature the anhydrous salt is the stable solid phase. Its solubility curve also passes through a minimum.
The diagram of solubilities of barium acetate not only illustrates the way in which the solubility curves of the different stable hydrates of a salt succeed one another, but it has also an interest and importance from another point of view. In Fig. 36 there is also shown a faintly drawn curve which is continuous throughout its whole course. This curve represents the solubility of barium acetate as determined by Krasnicki.[223] Since, however, three different solid phases can exist under the conditions of experiment, it is evident, from what has already been stated (p. 111), that the different equilibria between barium acetate and water could not be represented by one continuous curve.
Another point which these experiments illustrate and which it is of the highest importance to bear in mind is, that in making determinations of the solubility of salts which are capable of forming hydrates, it is not only necessary to determine the composition of the solution, but it is of equal importance to determine the composition of the solid phase in contact with it. In view of the fact, also, that the solution equilibrium is in many cases established with comparative slowness, it is necessary to confirm the point of equilibrium, either by approaching it from higher as well as from lower temperatures, or by actually determining the rate with which the condition of equilibrium is attained. This can be accomplished by actual weighing of the dissolved salt or by determinations of the density of the solution, as well as by other methods.
2. The Compounds formed have a Definite Melting Point.
In the cases which have just been considered we saw that the salt hydrates on being heated did not undergo complete fusion, but that a solid was deposited consisting of a lower hydrate or of the anhydrous salt. It has, however, been long known that certain crystalline salt hydrates (e.g. sodium thiosulphate, Na2S2O3,5H2O, sodium acetate, NaC2H3O2,3H2O) melt completely in their water of crystallization, and yield a liquid of the same composition as the crystalline salt. In the case of sodium thiosulphate pentahydrate the temperature of liquefaction is 56°; in the case of sodium acetate trihydrate, 58°. These two salts, therefore, have a definite melting point. For the purpose of studying the behaviour of such salt hydrates, we shall choose not the cases which have just been mentioned, but two others which have been more fully studied, viz. the hydrates of calcium chloride and of ferric chloride.
Solubility Curve of Calcium Chloride Hexahydrate.[224]—Although calcium chloride forms several hydrates, each of which possesses its own solubility, it is nevertheless the solubility curve of the hexahydrate which will chiefly interest us at present, and we shall therefore first discuss that curve by itself.
 Fig. 37.
The solubility of this salt has been determined from the cryohydric point, which lies at about -55°, up to the melting point of the salt.[225] The solubility increases with rise of temperature, as is shown by the figures in the following table, and by the (diagrammatic) curve AB in Fig. 37. In the table, the numbers under the heading "solubility" denote the number of grams of CaCl2 dissolved in 100 grams {146}of water; those under the heading "composition," the number of gram-molecules of water in the solution to one gram-molecule of CaCl2.
Solubility of Calcium Chloride Hexahydrate.
| Temperature. | Solubility. | Composition. |
| -55° | 42.5 | 14.5 |
| -25° | 50.0 | 12.3 |
| -10° | 55.0 | 11.2 |
| 0° | 59.5 | 10.37 |
| 10° | 65.0 | 9.49 |
| 20° | 74.5 | 8.28 |
| 25° | 82.0 | 7.52 |
| 28.5° | 90.5 | 6.81 |
| 29.5° | 95.5 | 6.46 |
| 30.2° | 102.7 | 6.00 |
| 29.6° | 109.0 | 5.70 |
| 29.2° | 112.8 | 5.41 |
So far as the first portion of the curve is concerned, it resembles the most general type of solubility curve. In the present case the solubility is so great and increases so rapidly with rise of temperature, that a point is reached at which the water of crystallization of the salt is sufficient for its complete solution. This temperature is 30.2°; and since the composition of the solution is the same as that of the solid salt, viz. 1 mol. of CaCl2 to 6 mols. of water, this temperature must be the melting point of the hexahydrate. At this point the hydrate will fuse or the solution will solidify without change of temperature and without change of composition. Such a melting point is called a congruent melting point.
But the solubility curve of calcium chloride hexahydrate differs markedly from the other solubility curves hitherto considered in that it possesses a retroflex portion, represented in the figure by BC. As is evident from the figure, therefore, calcium chloride hexahydrate exhibits the peculiar and, as it was at first thought, impossible behaviour that it can be in equilibrium at one and the same temperature with two different solutions, one of which contains more, the other less, water than the solid hydrate; for it must be remembered that {147}throughout the whole course of the curve ABC the solid phase present in equilibrium with the solution is the hexahydrate.
Such a behaviour, however, on the part of calcium chloride hexahydrate will appear less strange if one reflects that the melting point of the hydrate will, like the melting point of other substances, be lowered by the addition of a second substance. If, therefore, water is added to the hydrate at its melting point, the temperature at which the solid hydrate will be in equilibrium with the liquid phase (solution) will be lowered; or if, on the other hand, anhydrous calcium chloride is added to the hydrate at its melting point (or what is the same thing, if water is removed from the solution), the temperature at which the hydrate will be in equilibrium with the liquid will also be lowered; i.e. the hydrate will melt at a lower temperature. In the former case we have the hydrate in equilibrium with a solution containing more water, in the latter case with a solution containing less water than is contained in the hydrate itself.
It has already been stated (p. 109) that the solubility curve (in general, the equilibrium curve) is continuous so long as the solid phase remains unchanged; and we shall therefore expect that the curve ABC will be continuous. Formerly, however, it was considered by some that the curve was not continuous, but that the melting point is the point of intersection of two curves, a solubility curve and a fusion curve. Although the earlier solubility determinations were insufficient to decide this point conclusively, more recent investigation has proved beyond doubt that the curve is continuous and exhibits no break.[226]
Although in taking up the discussion of the equilibria between calcium chloride and water, it was desired especially to call attention to the form of the solubility curve in the case of salt hydrates possessing a definite melting point, nevertheless, for the sake of completeness, brief mention may be made of the other systems which these two components can form.
 Fig. 38.
Besides the hexahydrate, the solubility curve of which has already been described, calcium chloride can also crystallize in two different forms, each of which contains four molecules {149}of water of crystallization; these are distinguished as α-tetrahydrate, and β-tetrahydrate. Two other hydrates are also known, viz. a dihydrate and a monohydrate. The solubility curves of these different hydrates are given in Fig. 38.
On following the solubility curve of the hexahydrate from the ordinary temperature upwards, it is seen that at a temperature of 29.8° represented by the point H, it cuts the solubility curve of the α-tetrahydrate. This point is therefore a quadruple point at which the four phases hexahydrate, α-tetrahydrate, solution, and vapour can coexist. It is also the transition point for these two hydrates. Since, at temperatures above 29.8°, the α-tetrahydrate is the stable form, it is evident from the data given before (p. 146), as also from Fig. 38, that the portion of the solubility curve of the hexahydrate lying above this temperature represents metastable equilibria. The realization of the metastable melting point of the hexahydrate is, therefore, due to suspended transformation. At the transition point, 29.8°, the solubility of the hexahydrate and α-tetrahydrate is 100.6 parts of CaCl2 in 100 parts of water.
The retroflex portion of the solubility curve of the hexahydrate extends to only 1° below the melting point of the hydrate. At 29.2° crystals of a new hydrate, β-tetrahydrate, separate out, and the solution, which now contains 112.8 parts of CaCl2 to 100 parts of water, is saturated with respect to the two hydrates. Throughout its whole extent the solubility curve EDF of the β-tetrahydrate represents metastable equilibria. The upper limit of the solubility curve of β-tetrahydrate is reached at 38.4° (F), the point of intersection with the curve for the dihydrate.
Above 29.8° the stable hydrate is the α-tetrahydrate; and its solubility curve extends to 45.3° (K), at which temperature it cuts the solubility curve of the dihydrate. The curve of the latter hydrate extends to 175.5° (L), and is then succeeded by the curve for the monohydrate. The solubility curve of the anhydrous salt does not begin until a temperature of about 260°. The whole diagram, therefore, shows a succession of stable hydrates, a metastable hydrate, a metastable melting point and retroflex solubility curve. {150}
Pressure-Temperature Diagram.—The complete study of the equilibria between the two components calcium chloride and water would require the discussion of the vapour pressure of the different systems, and its variation with the temperature. For our present purpose, however, such a discussion would not be of great value, and will therefore be omitted here; in general, the same relationships would be found as in the case of sodium sulphate (p. 138), except that the rounded portion of the solubility curve of the hexahydrate would be represented by a similar rounded portion in the pressure curve.[227] As in the case of sodium sulphate, the transition points of the different hydrates would be indicated by breaks in the curve of pressures. Finally, mention may again be made of the difference of the pressure of dissociation of the hexahydrate according as it becomes dehydrated to the α- or the β-tetrahydrate (p. 88).
The Indifferent Point.—We have already seen that at 30.2° calcium chloride hexahydrate melts congruently, and that, provided the pressure is maintained constant, addition or withdrawal of heat will cause the complete liquefaction or solidification, without the temperature of the system undergoing change. This behaviour, therefore, is similar to, but is not quite the same as the fusion of a simple substance such as ice; and the difference is due to the fact that in the case of the hexahydrate the emission of vapour by the liquid phase causes an alteration in the composition of the latter, owing to the non-volatility of the calcium chloride; whereas in the case of ice this is, of course, not so.
Consider, however, for the present that the vapour phase is absent, and that we are dealing with the two-phase system solid—solution. Then, since there are two components, the system is bivariant. For any given value of the pressure, therefore, we should expect that the system could exist at different temperatures; which, indeed, is the case. It has, however, already been noted that when the composition of the liquid phase becomes the same as that of the solid, the system then behaves as a univariant system; for, at a given pressure, the system solid—solution can exist only at one temperature, change of temperature producing complete transformation in {151}one or other direction. The variability of the system has therefore been diminished.
This behaviour will perhaps be more clearly understood when one
reflects that since the composition of the two phases is the same, the
system may be regarded as being formed of one component, just as
the system NH4Cl NH3 + HCl was regarded as being
composed of one component when the vapour had the same total composition
as the solid (p. 13). One component in two phases,
however, constitutes a univariant system, and we can therefore see that
calcium chloride hexahydrate in contact with solution of the same
composition will constitute a univariant system. The temperature of
equilibrium will, however, vary with the pressure;[228] if the latter is constant, the
temperature will also be constant.
A point such as has just been referred to, which represents the special behaviour of a system of two (or more) components, in which the composition of two phases becomes identical, is known as an indifferent point,[229] and it has been shown[230] that at a given pressure the temperature in the indifferent point is the maximum or minimum temperature possible at the particular pressure[231] (cf. critical solution temperature). At such a point a system loses one degree of freedom, or behaves like a system of the next lower order.
The Hydrates of Ferric Chloride.—A better illustration of the formation of compounds possessing a definite melting point, and of the existence of retroflex solubility curves, is afforded by the hydrates of ferric chloride, which not only possess definite points of fusion, but these melting points are stable. A very brief description of the relations met with will suffice.[232]
Ferric chloride can form no less than four stable hydrates, viz. Fe2Cl6,12H2O, Fe2Cl6,7H2O, Fe2Cl6,5H2O, and Fe2Cl6,4H2O, and each of these hydrates possesses a definite, stable melting point. On analogy with the behaviour of calcium chloride, therefore, we shall expect that the solubility curves of these different hydrates will exhibit a series of temperature maxima; the points of maximum temperature representing systems in which the composition of the solid and liquid phases is the same. A graphical representation of the solubility relations is given in Fig. 39, and the composition of the different saturated solutions which can be formed is given in the following tables, the composition being expressed in molecules of Fe2Cl6 to 100 molecules of water. The figures printed in thick type refer to transition and melting points.
 Fig. 39.
Composition of the Saturated Solutions of Ferric Chloride and its Hydrates.
(The name placed at the head of each table is the solid phase.)
| Ice. | |
| Temperature. | Composition. |
| ±-55° | ±2.75 |
| -40° | 2.37 |
| -27.5° | 1.90 |
| -20.5° | 1.64 |
| -10° | 1.00 |
| 0° | 0 |
| Fe2Cl6,12H2O. | |
| Temperature. | Composition. |
| -55° | ±2.75 |
| -41° | 2.81 |
| -27° | 2.98 |
| 0° | 4.13 |
| 10° | 4.54 |
| 20° | 5.10 |
| 30° | 5.93 |
| 35° | 6.78 |
| 36.5° | 7.93 |
| 37° | 8.33 |
| 36° | 9.29 |
| 33° | 10.45 |
| 30° | 11.20 |
| 27·4° | 12.15 |
| 20° | 12.83 |
| 10° | 13.20 |
| 8° | 13.70 |
| Fe2Cl6,7H2O. | |
| Temperature. | Composition. |
| 20° | 11.35 |
| 27·4° | 12.15 |
| 32° | 13.55 |
| 32.5° | 14.29 |
| 30° | 15.12 |
| 25° | 15.54 |
| Fe2Cl6,5H2O. | |
| Temperature. | Composition. |
| 12° | 12.87 |
| 20° | 13.95 |
| 27° | 14.85 |
| 30° | 15.12 |
| 35° | 15.64 |
| 50° | 17.50 |
| 55° | 19.15 |
| 56° | 20.00 |
| 55° | 20.32 |
| Fe2Cl6,4H2O | |
| Temperature. | Composition. |
| 50° | 19.96 |
| 55° | 20.32 |
| 60° | 20.70 |
| 69° | 21.53 |
| 72.5° | 23.35 |
| 73.5° | 25.00 |
| 72.5° | 26.15 |
| 70° | 27.90 |
| 66° | 29.20 |
| Fe2Cl6 (ANHYDROUS). | |
| Temperature. | Composition. |
| 66° | 29.20 |
| 70° | 29.42 |
| 75° | 28.92 |
| 80° | 29.20 |
| 100° | 29.75 |
The lowest portion of the curve, AB, represents the equilibria between ice and solutions containing ferric chloride. It represents, in other words, the lowering of the fusion point of ice by addition of ferric chloride. At the point B (-55°), the cryohydric point (p. 117) is reached, at which the solution is in equilibrium with ice and ferric chloride dodecahydrate. As {154}has already been shown, such a point represents an invariant system; and the liquid phase will, therefore, solidify to a mixture of ice and hydrate without change of temperature. If heat is added, ice will melt and the system will pass to the curve BCDN, which is the solubility curve of the dodecahydrate. At C (37°), the point of maximum temperature, the hydrate melts completely. The retroflex portion of this curve can be followed backwards to a temperature of 8°, but below 27.4° (D), the solutions are supersaturated with respect to the heptahydrate; point D is the eutectic point for dodecahydrate and heptahydrate. The curve DEF is the solubility curve of the heptahydrate, E being the melting point, 32.5°. On further increasing the quantity of ferric chloride, the temperature of equilibrium is lowered until at F (30°) another eutectic point is reached, at which the heptahydrate and pentahydrate can co-exist with solution. Then follow the solubility curves for the pentahydrate, the tetrahydrate, and the anhydrous salt; G (56°) is the melting point of the former hydrate, J (73.5°) the melting point of the latter. H and K, the points at which the curves intersect, represent eutectic points; the temperature of the former is 55°, that of the latter 66°. The dotted portions of the curves represent metastable equilibria.
As is seen from the diagram, a remarkable series of solubility curves is obtained, each passing through a point of maximum temperature, the whole series of curves forming an undulating "festoon." To the right of the series of curves the diagram represents unsaturated solutions; to the left, supersaturated.
If an unsaturated solution, the composition of which is represented by a point in the field to the right of the solubility curves, is cooled down, the result obtained will differ according as the composition of the solution is the same as that of a cryohydric point, or of a melting point, or has an intermediate value. Thus, if a solution represented by x1 is cooled down, the composition will remain unchanged as indicated by the horizontal dotted line, until the point D is reached. At this point, dodecahydrate and heptahydrate will separate out, and the liquid will ultimately solidify completely to a mixture or "conglomerate" of these two hydrates; the temperature of {155}the system remaining constant until complete solidification has taken place. If, on the other hand, a solution of the composition x3 is cooled down, ferric chloride dodecahydrate will be formed when the temperature has fallen to that represented by C, and the solution will completely solidify, without alteration of temperature, with formation of this hydrate. In both these cases, therefore, a point is reached at which complete solidification occurs without change of temperature.
Somewhat different, however, is the result when the solution has an intermediate composition, as represented by x2 or x4. In the former case the dodecahydrate will first of all separate out, but on further withdrawal of heat the temperature will fall, the solution will become relatively richer in ferric chloride, owing to separation of the hydrate, and ultimately the eutectic point D will be reached, at which complete solidification will occur. Similarly with the second solution. Ferric chloride dodecahydrate will first be formed, and the temperature will gradually fall, the composition of the solution following the curve CB until the cryohydric point B is reached, when the whole will solidify to a conglomerate of ice and dodecahydrate.
Suspended Transformation.—Not only can the upper branch of the solubility curve of the dodecahydrate be followed backwards to a temperature of 8°, or about 19° below the temperature of transition to the heptahydrate; but suspended transformation has also been observed in the case of the heptahydrate and the pentahydrate. To such an extent is this the case that the solubility curve of the latter hydrate has been followed downwards to its point of intersection with the curve for the dodecahydrate. This point of intersection, represented in Fig. 39 by M, lies at a temperature of about 15°; and at this temperature, therefore, it is possible for the two solid phases dodecahydrate and pentahydrate to coexist, so that M is a eutectic point for the dodecahydrate and the pentahydrate. It is, however, a metastable eutectic point, for it lies in the region of supersaturation with respect to the heptahydrate; and it can be realized only because of the fact that the latter hydrate is not readily formed.
Evaporation of Solutions at Constant Temperature.—On {156}evaporating dilute solutions of ferric chloride at constant temperature, a remarkable series of changes is observed, which, however, will be understood with the help of Fig. 40. Suppose an unsaturated solution, the composition of which is represented by the point x1, is evaporated at a temperature of about 17° - 18°. As water passes off, the composition of the solution will follow the dotted line of constant temperature, until at the point where it cuts the curve BC the solid hydrate Fe2Cl6,12H2O separates out. As water continues to be removed, the hydrate must be deposited (in order that the solution shall remain saturated), until finally the solution dries up to the hydrate. As dehydration proceeds, the heptahydrate can be formed, and the dodecahydrate will finally pass into the heptahydrate; and this, in turn, into the pentahydrate.
 Fig. 40.
But the heptahydrate is not always formed by the dehydration of the dodecahydrate, and the behaviour on evaporation is therefore somewhat perplexing at first sight. After the solution has dried to the dodecahydrate, as explained above, further removal of water causes liquefaction, and the system is now represented by the point of intersection at a; at this point the solid hydrate is in equilibrium with a solution containing relatively more ferric chloride. If, therefore, evaporation is continued, the solid hydrate must pass into solution in order that the composition of the latter may remain unchanged, so that ultimately a liquid will again be obtained. A very slight further dehydration will bring the solution into the state represented by b, at which the pentahydrate is formed, and the solution will at last disappear and leave this hydrate alone.
Without the information to be obtained from the curves in Figs. 39 and 40, the phenomena which would be observed on carrying out the evaporation at a temperature of about 31 - 32° {157}would be still more bewildering. The composition of the different solutions formed will be represented by the perpendicular line x212345. Evaporation will first cause the separation of the dodecahydrate, and then total disappearance of the liquid phase. Then liquefaction will occur, and the system will now be represented by the point 2, in which condition it will remain until the solid hydrate has disappeared. Following this there will be deposition of the heptahydrate (point 3), with subsequent disappearance of the liquid phase. Further dehydration will again cause liquefaction, when the concentration of the solution will be represented by the point 4; the heptahydrate will ultimately disappear, and then will ensue the deposition of the pentahydrate, and complete solidification will result. On evaporating a solution, therefore, of the composition x2, the following series of phenomena will be observed: solidification to dodecahydrate; liquefaction; solidification to heptahydrate; liquefaction; solidification to pentahydrate.[233]
Although ferric chloride and water form the largest and best-studied series of hydrates possessing definite melting points, examples of similar hydrates are not few in number; and more careful investigation is constantly adding to the list.[234] In all these cases the solubility curve will show a point of maximum temperature, at which the hydrate melts, and will end, above and below, in a cryohydric point. Conversely, if such a curve is found in a system of two components, we can argue that a definite compound of the components possessing a definite melting point is formed.
Inevaporable Solutions.—If a saturated solution in contact with two hydrates, or with a hydrate and anhydrous salt is heated, the temperature and composition of the solution will, of course, remain unchanged so long as the two solid phases are present, for such a system is invariant. In addition to this, however, the quantity of the solution will also remain unchanged, the water which evaporates being supplied by the higher hydrate. The same phenomenon is also observed in the case of cryohydric points when ice is a solid phase; so long as the latter is present, evaporation will be accompanied {158}by fusion of the ice, and the quantity of solution will remain constant. Such solutions are called inevaporable.[235]
 Fig. 41.
Illustration.—In order to illustrate the application of the principles of the Phase Rule to the study of systems formed by a volatile and a non-volatile component, a brief description may be given of the behaviour of sulphur dioxide and potassium iodide, which has formed the subject of a recent investigation. After it had been found[236] that liquid sulphur dioxide has the property of dissolving potassium iodide, and that the solutions thus obtained present certain peculiarities of behaviour, the question arose as to whether or not compounds are formed between the sulphur dioxide and the potassium iodide, and if so, what these compounds are. To find an answer to this question, Walden and Centnerszwer[237] made a complete investigation of the solubility curves (equilibrium curves) of these two components, the investigation extending from the freezing point to the critical point of sulphur dioxide. For convenience of reference, the results which they obtained are represented diagrammatically in Fig. 41. The freezing point (A) of pure sulphur dioxide was found to be -72.7°. Addition of potassium iodide lowered the freezing point, but the maximum depression obtained was very small, and was reached when the concentration of the potassium iodide in the solution was only 0.336 mols. per cent. Beyond this point, an increase in the concentration of the iodide was accompanied by an elevation of the freezing point, the change of the freezing point with the concentration being represented by the curve BC. The solid {159}which separated from the solutions represented by BC was a bright yellow crystalline substance. At the point C (-23.4°) a temperature-maximum was reached; and as the concentration of the potassium iodide was continuously increased, the temperature of equilibrium first fell and then slowly rose, until at +0.26° (E) a second temperature-maximum was registered. On passing the point D, the solid which was deposited from the solution was a red crystalline substance. On withdrawing sulphur dioxide from the system, the solution became turbid, and the temperature remained constant. The investigation was not pursued farther at this point, the attention being then directed to the equilibria at higher temperatures.
When a solution of potassium iodide in liquid sulphur dioxide containing 1.49 per cent. of potassium iodide was heated, solid (potassium iodide) was deposited at a temperature of 96.4°. Solutions containing more than about 3 per cent. of the iodide separated, on being heated, into two layers, and the temperature at which the liquid became heterogeneous fell as the concentration was increased; a temperature-minimum being obtained with solutions containing 12 per cent. of potassium iodide. On the other hand, solutions containing 30.9 per cent. of the iodide, on being heated, deposited potassium iodide; while a solution containing 24.5 per cent. of the salt first separated into two layers at 89.3°, and then, on cooling, solid was deposited and one of the liquid layers disappeared.
Such are, in brief, the results of experiment; their interpretation in the light of the Phase Rule is the following:—
The curve AB is the freezing-point curve of solid sulphur dioxide in contact with solutions of potassium iodide. BCD is the solubility curve of the yellow crystalline solid which is deposited from the solutions. C, the temperature-maximum, is the melting point of this yellow solid, and the composition of the latter must be the same as that of the solution at this point (p. 145), which was found to be that represented by the formula KI,14SO2. B is therefore the eutectic point, at which solid sulphur dioxide and the compound KI,14SO2 can exist together in equilibrium with solution and vapour. The curve DE is the solubility curve of the red crystalline solid, and the {160}point E, at which the composition of solution and solid is the same, is the melting point of the solid. The composition of this substance was found to be KI,4SO2.[238] D is, therefore, the eutectic point at which the compounds KI,14SO2 and KI,4SO2 can coexist in equilibrium with solution and vapour. The curve DE does not exhibit a retroflex portion; on the contrary, on attempting to obtain more concentrated solutions in equilibrium with the compound KI,4SO2, a new solid phase (probably potassium iodide) was formed. Since at this point there are four phases in equilibrium, viz. the compound KI,4SO2, potassium iodide, solution, and vapour, the system is invariant. E is, therefore, the transition point for KI,4SO2 and KI.
Passing to higher temperatures, FG is the solubility curve of potassium iodide in sulphur dioxide; at G two liquid phases are formed, and the system therefore becomes invariant (cf. p. 121). The curve GHK is the solubility curve for two partially miscible liquids; and since complete miscibility occurs on lowering the temperature, the curve is similar to that obtained with triethylamine and water (p. 101). K is also an invariant point at which potassium iodide is in equilibrium with two liquid phases and vapour.
The complete investigation of the equilibria between sulphur dioxide and potassium iodide, therefore, shows that these two components form the compounds KI,14SO2 and KI,4SO2; and that when solutions having a concentration between those represented by the points G and K are heated, separation into two layers occurs. The temperatures and concentrations of the different characteristic points are as follows:—
| Point. | Temperature. | Composition of the solution per cent. KI. |
| A (m.p. of SO2) | -72.7° | — |
| B (eutectic point) | — | 0.86 |
| C (m.p. of KI,14SO2) | -23.4° | 17.63 |
| E (m.p. of KI,4SO2) | +0.26° | 39.33 |
| G (KI + two liquid phases) | (about) 88° | 24.0 |
| H (critical solution point) | 77.3° | 12 |
| K (KI + two liquid phases) | (about) 88° | 2.7 |
EQUILIBRIA BETWEEN TWO VOLATILE COMPONENTS
General.—In the two preceding chapters certain restrictions were imposed on the discussion of the equilibria between two components; but in the present chapter the restriction that only one of the components is volatile will be allowed to fall, and the general behaviour of two volatile[239] components, each of which is capable of forming a liquid solution with the other, will be studied. As we shall see, however, the removal of the previous restriction produces no alteration in the general aspect of the equilibrium curves for concentration and temperature, but changes to some extent the appearance of the pressure-temperature diagram. The latter would become still more complicated if account were taken not only of the total pressure but also of the partial pressures of the two components in the vapour phase; this complication, however, will not be introduced in the present discussion.[240] In this chapter we shall consider the systems formed by the two components iodine and chlorine, and sulphur dioxide and water.
Iodine and Chlorine.—The different systems furnished by iodine and chlorine, rendered classical by the studies of Stortenbeker,[241] form a very complete example of equilibria in a two-component system. We shall first of all consider the {162}relations between concentration and temperature, with the help of the accompanying diagram, Fig. 42.
 Fig. 42.
Concentration-Temperature Diagram.—In this diagram the temperatures are taken as the abscissæ, and the composition of the solution, expressed in atoms of chlorine to one atom of iodine,[242] is represented by the ordinates. In the diagram, A represents the melting point of pure iodine, 114°. If chlorine is added to the system, a solution of chlorine in liquid iodine is obtained, and the temperature at which solid iodine is in equilibrium with the liquid solution will be all the lower the greater the concentration of the chlorine. We therefore obtain the curve ABF, which represents the composition of the solution {163}with which solid iodine is in equilibrium at different temperatures. This curve can be followed down to 0°, but at temperatures below 7.9° (B) it represents metastable equilibria. At B iodine monochloride can be formed, and if present the system becomes invariant; B is therefore a quadruple point at which the four phases, iodine, iodine monochloride, solution, and vapour, can coexist. Continued withdrawal of heat at this point will therefore lead to the complete solidification of the solution to a mixture or conglomerate of iodine and iodine monochloride, while the temperature remains constant during the process. B is the eutectic point for iodine and iodine monochloride.
Just as we found in the case of aqueous salt solutions that at temperatures above the cryohydric or eutectic point, two different solutions could exist, one in equilibrium with ice, the other in equilibrium with the salt (or salt hydrate), so in the case of iodine and chlorine there can be two solutions above the eutectic point B, one containing a lower proportion of chlorine in equilibrium with iodine, the other containing a higher proportion of chlorine in equilibrium with iodine monochloride. The composition of the latter solution is represented by the curve BCD. As the concentration of chlorine is increased, the temperature at which there is equilibrium between iodine monochloride and solution rises until a point is reached at which the composition of the solution is the same as that of the solid. At this point (C), iodine monochloride melts. Addition of one of the components will lower the temperature of fusion, and a continuous curve,[243] exhibiting a retroflex portion as in the case of CaCl2,6H2O, will be obtained. At temperatures below its melting point, therefore, iodine monochloride can be in equilibrium with two different solutions.
The upper portion of this curve, CD, can be followed downwards to a temperature of 22.7°. At this temperature iodine trichloride can separate out, and a second quadruple {164}point (D) is obtained. This is the eutectic point for iodine monochloride and iodine trichloride.
By addition of heat and increase in the amount of chlorine, the iodine monochloride disappears, and the system passes along the curve DE, which represents the composition of the solutions in equilibrium with solid iodine trichloride. The concentration of chlorine in the solution increases as the temperature is raised, until at the point E, where the solution has the same composition as the solid, the maximum temperature is reached; the iodine trichloride melts. On increasing still further the concentration of chlorine in the solution, the temperature of equilibrium falls, and a continuous curve, similar to that for the monochloride, is obtained. The upper branch of this curve has been followed down to a temperature of 30°, the solution at this point containing 99.6 per cent. of chlorine.[244] The very rounded form of the curve is due to the trichloride being largely dissociated in the liquid state.
One curve still remains to be considered. As has already been mentioned, iodine monochloride can exist in two crystalline forms, only one of which, however, is stable at temperatures below the melting point; the two forms are monotropic (p. 44). The stable form which melts at 27.2°, is called the α-form, while the less stable variety, melting at 13.9°, is known as the β-form. If, now, the presence of α-ICl is excluded, it is possible to obtain the β-form, and to study the conditions of equilibrium between it and solutions of iodine and chlorine, from the eutectic point F to the melting point G. As the β-ICl becomes less stable in presence of excess of chlorine, it has not been possible to study the retroflex portion of the curve represented by the dotted continuation of FG.
The following table gives some of the numerical data from which Fig. 42 was constructed.[245]
Iodine and Chlorine.
I. Invariant systems.
| Temperature. | Pressure. | Phases present. | ||
| Solid. | Liquid. | Vapour. | ||
| 7.9° | 11 mm. | I2,α-ICl | I Cl0.66 Cl0.66 | I + Cl0.92 |
| 0.9° | — | I2,β-ICl | ICl0.72 | — |
| 22.7° | 42 mm. | α-ICl,ICl3 | ICl1.19 | I + Cl1.75 |
| [-102° | <1 atm. | ICl3,Cl2 | IClm | I + Cln] |
II. Melting points.
A. Iodine,[246] 114.15° (pressure 89.8 mm.).
C. α-Iodine monochloride, 27.2° (pressure 37 mm.).
E. Iodine trichloride, 101° (pressure 16 atm.).
G. β-Iodine monochloride, 13.9°.
Since the vapour pressure at the melting point of iodine trichloride amounts to 16 atm., the experiments must of course be carried out in closed vessels. At 63.7° the vapour pressure of the system trichloride—solution—vapour is equal to 1 atm.
Pressure-Temperature Diagram.—In this diagram there are represented the values of the vapour pressure of the saturated solutions of chlorine and iodine. To give a complete picture of the relations between pressure, temperature, and concentration, a solid model would be required, with three axes at right angles to one another along which could be measured the values of pressure, temperature, and concentration of the components in the solution. Instead of this, however, there may be employed the accompanying projection figure[247] (Fig. 43), the lower portion of which shows the projection of the equilibrium curve on the surface containing the concentration and temperature axes, while the upper portion is the projection on the plane containing the pressure and temperature axes. The lower portion is therefore a concentration-temperature diagram; {166}the upper portion, a pressure-temperature diagram. The corresponding points of the two diagrams are joined by dotted lines.
 Fig. 43.
Corresponding to the point C, the melting point of pure iodine, there is the point C1, which represents the vapour pressure of iodine at its melting point. At this point three curves cut: 1, the sublimation curve of iodine; 2, the vaporization curve of fused iodine; 3, C1B1, the vapour-pressure curve of the saturated solutions in equilibrium with solid iodine. Starting, therefore, with the system solid iodine—liquid iodine, addition of chlorine will cause the temperature of equilibrium to fall continuously, while the vapour pressure will first increase, pass through a maximum and then fall continuously {167}until the eutectic point, B (B1), is reached.[248] At this point the system is invariant, and the pressure will therefore remain constant until all the iodine has disappeared. As the concentration of the chlorine increases in the manner represented by the curve BfH, the pressure of the vapour also increases as represented by the curve B1f1H1. At H1, the eutectic point for iodine monochloride and iodine trichloride, the pressure again remains constant until all the monochloride has disappeared. As the concentration of the solution passes along the curve HF, the pressure of the vapour increases as represented by the curve H1F1; F1 represents the pressure of the vapour at the melting point of iodine trichloride. If the concentration of the chlorine in the solution is continuously increased from this point, the vapour pressure first increases and then decreases, until the eutectic point for iodine trichloride and solid chlorine is reached (D1). Curves Cl2 solid and Cl2 liquid represent the sublimation and vaporization curves of chlorine, the melting point of chlorine being -102°.
Although complete measurements of the vapour pressure of the different systems of pure iodine to pure chlorine have not been made, the experimental data are nevertheless sufficient to allow of the general form of the curves being indicated with certainty.
Bivariant Systems.—To these, only a brief reference need be made. Since there are two components, two phases will form a bivariant system. The fields in which these systems can exist are shown in Fig. 43 and Fig. 44, which is a more diagrammatic representation of a portion of Fig. 43.
I. Iodine—vapour.
II. Solution—vapour.
III. Iodine trichloride—vapour.
IV. Iodine monochloride—vapour.
 Fig. 44.
The conditions for the existence of these systems will probably be best understood from Fig. 44. Since the curve B′A′ {168}represents the pressures under which the system iodine—solution—vapour can exist, increase of volume (diminution of pressure) will cause the volatilization of the solution, and the system iodine—vapour will remain. If, therefore, we start with a system represented by a, diminution of pressure at constant temperature will lead to the condition represented by x. On the other hand, increase of pressure at a will lead to the condensation of a portion of the vapour phase. Since, now, the concentration of chlorine in the vapour is greater than in the solution, condensation of vapour would increase the concentration of chlorine in the solution; a certain amount of iodine must therefore pass into solution in order that the composition of the latter shall remain unchanged.[249] If, therefore, the volume of vapour be sufficiently great, continued diminution of volume will ultimately lead to the disappearance of all the iodine, and there will remain only solution and vapour (field II.). As the diminution of volume is continued, the vapour pressure and the concentration of the chlorine in the solution will increase, until when the pressure has reached the value b, iodine monochloride can separate out. The system, therefore, again becomes univariant, and at constant temperature the pressure and composition of the phases must remain unchanged. Diminution of volume will therefore not effect an increase of pressure, but a condensation of the vapour; and since this is richer in chlorine than the {169}solution, solid iodine monochloride must separate out in order that the concentration of the solution remain unchanged.[250] As the result, therefore, we obtain the bivariant system iodine monochloride—vapour.
A detailed discussion of the effect of a continued increase of pressure will not be necessary. From what has already been said and with the help of Fig. 44, it will readily be understood that this will lead successively to the univariant system (c), iodine monochloride—solution—vapour; the bivariant system solution—vapour (field II.); the univariant system (d), iodine trichloride—solution—vapour; and the bivariant system x′, iodine trichloride—vapour. If the temperature of the experiment is above the melting point of the monochloride, then the systems in which this compound occurs will not be formed.
Sulphur Dioxide and Water.—In the case just studied we have seen that the components can combine to form definite compounds possessing stable melting points. The curves of equilibrium, therefore, resemble in their general aspect those of calcium chloride and water, or of ferric chloride and water. In the case of sulphur dioxide and water, however, the melting point of the compound formed cannot be realized, because transition to another system occurs; retroflex concentration-temperature curves are therefore not found here, but the curves exhibit breaks or sudden changes in direction at the transition points, as in the case of the systems formed by sodium sulphate and water. The case of sulphur dioxide and water is also of interest from the fact that two liquid phases can be formed.
The phases which occur are—Solid: ice, sulphur dioxide hydrate,
SO2,7H2O. Liquid: two solutions, the one containing
excess of sulphur dioxide, the other excess of water, and represented by
the symbols SO2 xH2O (solution I.), and H2O ySO2 (solution
II.). Vapour: a mixture of sulphur dioxide and water vapour in varying
proportions. Since there are two components, sulphur dioxide and water,
the number of {170}possible systems is considerable. Only the
following, however, have been studied:—
I. Invariant Systems: Four co-existing phases.
(a) Ice, hydrate, solution, vapour.
(b) Hydrate, solution I., solution II., vapour.
II. Univariant Systems: Three co-existing phases.
(a) Hydrate, solution I., vapour.
(b) Hydrate, solution II., vapour.
(c) Solution I., solution II., vapour.
(d) Hydrate, solution I., solution II.
(e) Hydrate, ice, vapour.
(f) Ice, solution II., vapour.
(g) Ice, hydrate, solution II.
III. Bivariant Systems: Two co-existing phases.
(a) Hydrate, solution I.
(b) Hydrate, solution II.
(c) Hydrate, vapour.
(d) Hydrate, ice.
(e) Solution I., solution II.
(f) Solution I., vapour.
(g) Solution I., ice.
(h) Solution II., vapour.
(i) Solution II., ice.
(j) Ice, vapour.
 Fig. 45.
Pressure-Temperature Diagram.[251]—If sulphur dioxide is passed into water at 0°, a solution will be formed and the temperature at which ice can exist in equilibrium with this solution will fall more and more as the concentration of the sulphur dioxide increases. At -2.6°, however, a cryohydric point is reached at which solid hydrate separates out, and the system becomes invariant. The curve AB (Fig. 45) therefore represents the pressure of the system ice—solution II.—vapour, and B represents the temperature and pressure at which the invariant system ice—hydrate—solution II.—vapour can exist. At this point the temperature is -2.6°, and the pressure 21.1 cm. If heat is withdrawn from this system, the solution will ultimately {171}solidify to a mixture of ice and hydrate, and there will be obtained the univariant system ice—hydrate—vapour. The vapour pressure of this system has been determined down to a temperature of -9.5°, at which temperature the pressure amounts to 15 cm. The pressures for this system are represented by the curve BC. If at the point B the volume is diminished, the pressure must remain constant, but the relative amounts of the different phases will undergo change. If suitable quantities of these are present, diminution of volume will ultimately lead to the total condensation of the vapour phase, and there will remain the univariant system ice—hydrate—solution. The temperature of equilibrium of this system will alter with the pressure, but, as in the case of the melting point of a simple substance, great differences of pressure will cause only comparatively small changes in the temperature of equilibrium. The change of the cryohydric point with the pressure is represented by the line BE; the actual values have not been determined, but the curve must slope towards the pressure axis because fusion is accompanied by diminution of volume, as in the case of pure ice. {172}
A fourth univariant system can be formed at B. This is the system hydrate—solution II.—vapour. The conditions for the existence of this system are represented by the curve BF, which may therefore be regarded as the vapour-pressure curve of the saturated solution of sulphur dioxide heptahydrate in water. Unlike the curve for iodine trichloride—solution—vapour, this curve cannot be followed to the melting point of the hydrate. Before this point is reached, a second liquid phase appears, and an invariant system consisting of hydrate—solution I.—solution II.—vapour is formed. We have here, therefore, the phenomenon of melting under the solution as in the case of succinic nitrile and water (p. 122). This point is represented in the diagram by F; the temperature at this point is 12.1°, and the pressure 177.3 cm. The range of stable existence of the hydrate is therefore from -2.6° to 12.1°; nevertheless, the curve FB has been followed down to a temperature of -6°, at which point ice formed spontaneously.
So long as the four phases hydrate, two liquid phases, and vapour are present, the condition of the system is perfectly defined. By altering the conditions, however, one of the phases can be made to disappear, and a univariant system will then be obtained. Thus, if the vapour phase is made to disappear, the univariant system solution I.—solution II.—hydrate, will be left, and the temperature at which this system is in equilibrium will vary with the pressure. This is represented by the curve FI; under a pressure of 225 atm. the temperature of equilibrium is 17.1°. Increase of pressure, therefore, raises the temperature at which the three phases can coexist.
Again, addition of heat to the invariant system at F will cause the disappearance of the solid phase, and there will be formed the univariant system solution I.—solution II.—vapour. In the case of this system the vapour pressure increases as the temperature rises, as represented by the curve FG. Such a system is analogous to the case of ether and water, or other two partially miscible liquids (p. 103). As the temperature changes, the composition of the two liquid phases will undergo change; but this system has not been studied fully.
The fourth curve, which ends at the quadruple point F, is {173}that representing the vapour pressure of the system hydrate—solution I.—vapour (FH). This curve has been followed to a temperature of 0°, the pressure at this point being 113 cm. The metastable prolongation of GF has also been determined. Although, theoretically, this curve must lie below FH, it was found that the difference in the pressure for the two curves was within the error of experiment.
Bivariant Systems.—The different bivariant systems, consisting of two phases, which can exist within the range of temperature and pressure included in Fig. 45, were given on p. 170. The conditions under which these systems can exist are represented by the areas in the diagram, and the fields of the different bivariant systems are indicated by letters, corresponding to the letters on p. 170. Just as in the case of one-component systems (p. 29), we found that the field lying between any two curves gave the conditions of existence of that phase which was common to the two curves, so also in the case of two-component systems, a bivariant two-phase system occurs in the field enclosed[252] by the two curves to which the two phases are common. As can be seen, the same bivariant system can occur in more than one field.
As is evident from Fig. 45, three different bivariant systems are capable of existing in the area HFI; which of these will be obtained will depend on the relative masses of the different phases in the univariant or invariant system. Thus, starting with a system represented by a point on the curve HF, diminution of volume at constant temperature will cause the condensation of a portion of the vapour, which is rich in sulphur dioxide; since this would increase the concentration of sulphur dioxide in the solution, it must be counteracted by the passage of a portion of the hydrate (which is relatively poor in sulphur dioxide) into the solution. If, therefore, the amount of hydrate present is relatively very small, the final result of the compression will be the production of the system f, solution I.—vapour. On the other hand, if the vapour is present in relatively small amount, it will be the first phase to disappear, {174}and the bivariant system a, hydrate—solution I., will be obtained. Finally, if we start with the invariant system at F, compression will cause the condensation of vapour, while the composition of the two solutions will remain unchanged. When all the vapour has disappeared, the univariant system hydrate—solution I.—solution II. will be left. If, now, the pressure is still further increased, while the temperature is kept below 12°, more and more hydrate must be formed at the expense of the two liquid phases (because 12° is the lower limit for the coexistence of the two liquid phases), and if the amount of the solution I. (containing excess of sulphur dioxide) is relatively small, it will disappear before solution II., and there will be obtained the bivariant system hydrate—solution II. (bivariant system b).
In a similar manner, account can be taken of the formation of the other bivariant systems.
A behaviour similar to that of sulphur dioxide and water is shown by chlorine and water and by bromine and water, although these have not been so fully studied.[253] In the case of hydrogen bromide and water, and of hydrogen chloride and water, a hydrate, viz. HBr,2H2O and HCl,2H2O, is formed which possesses a definite melting point, as in the case of iodine trichloride. In these cases, therefore, a retroflex curve is obtained. Further, just as in the case of the chlorides of iodine the upper branch of the retroflex curve ended in a eutectic point, so also in the case of the hydrate HBr,2H2O the upper branch of the curve ends in a eutectic point at which the system dihydrate—monohydrate—solution—vapour can exist. Before the melting point of the monohydrate is reached, two liquid phases are formed, as in the case of sulphur dioxide and water.
SOLID SOLUTIONS. MIXED CRYSTALS
General.—With the conception of gaseous and liquid solutions, every one is familiar. Gases can mix in all proportions to form homogeneous solutions. Gases can dissolve in or be "absorbed" by liquids; and solids, also, when brought in contact with liquids, "pass into solution" and yield a homogeneous liquid phase. On the other hand, the conception of a solid solution is one which in many cases is found more difficult to appreciate; and the existence and behaviour of solid solutions, in spite of their not uncommon occurrence and importance, are in general comparatively little known.
The reason of this is to be found, to some extent, no doubt, in the fact that the term "solid solution" was introduced at a comparatively recent date,[254] but it is probably also due in some measure to a somewhat hazy comprehension of the definition of the term "solution" itself. As has already been said (p. 92), a solution is a homogeneous phase, the composition of which can vary continuously within certain limits; the definition involves, therefore, no condition as to the physical state of the substances. Accordingly, solid solutions are homogeneous solid phases, the composition of which can undergo continuous variation within certain limits. Just as we saw that the range of variation of composition is more limited in the case of liquids than in the case of gases, so also we find that the limits of miscibility are in general still more restricted in the case of solids. Examples of complete miscibility are, however, not unknown even in the case of solid substances.
Solid solutions have long been known, although, of course, {176}they were not defined as such. Thus, the phenomena of "occlusion" of gases by metals and other substances (occlusion of hydrogen by palladium; occlusion of hydrogen by iron) are due to the formation of solid solutions. The same is probably also true of the phenomena of "adsorption," as in the removal of organic colouring matter by charcoal, although, in this case, surface tension no doubt plays a considerable part.[255]
As examples of the solution of gases in solids there may be cited (in addition to the phenomena of occlusion already mentioned), the hydrated silicates and the zeolites. During dehydration these crystalline substances remain clear and transparent, and the pressure of the water vapour which they emit varies with the degree of hydration or the concentration of water in the mineral.[256] As examples of the solution of solids in solids we have the cementation of iron by charcoal, the formation of glass, and the crystallization together of isomorphous substances.
Although we have here spoken of the glasses as "solid solutions," it should be mentioned that the term "solid" is used in its popular sense. Strictly speaking, the glasses are to be regarded as supercooled liquids (see also p. 53, footnote).
In discussing the equilibria in systems containing a solid solution, it is of essential importance to remember that a solid solution constitutes only one phase, a phase of varying composition, as in the case of liquid solutions.
Solution of Gases in Solids.—Comparatively little work has been done in this connection, the investigations being limited chiefly to the phenomena of occlusion or adsorption of gases by charcoal.[257] We shall, therefore, indicate only briefly {177}and in a general manner, the behaviour which the Phase Rule enables us to foresee.[258]
In dealing with the systems formed by the two phases gas—solid, three chief cases call for mention:—
I. The gas is not absorbed by the solid, but when the pressure reaches a certain value, combination of the two components can result.
 Fig. 46.
The graphic representation of such a system is shown in Fig. 46, the ordinates being the pressures of the gas, and the abscissæ the concentrations of the gaseous component in the solid phase. Since there is no formation of a solid solution, the concentration of gas in the solid phase remains zero until the pressure has increased to the point A. At this point combination can take place. There will now be three phases present, viz. solid component, compound, and vapour. The system is therefore univariant, and if the temperature is maintained constant, the vapour pressure will be constant, irrespective of the amount of compound formed, i.e. irrespective of the relative amounts of gas and solid. This is indicated by the line AB. When the solid component has entirely disappeared, the system ceases to be univariant, and if no absorption occurs, the pressure will increase again, as shown by BC. If a second compound can be formed, then a second pc-line will be obtained, similar to the preceding. To this group belong the salt hydrates (Chap. VII.).
II. The gas may be absorbed and may also form a compound.
If absorption of gas occurs with formation of a solid solution, then, as the system consists of two phases, solution—vapour, it is bivariant. At constant temperature, therefore, the pressure will still vary with the concentration of the gaseous component in the solid phase. This is represented by the curve AB in Fig. 47. When, however, the pressure has reached a certain value, combination can take place; and since there are now three phases present, the system is {178}univariant, and at constant temperature the pressure is constant, as shown by the line BC.
III. Absorption of gas occurs, but at a certain concentration the solid solution can separate into two immiscible solid solutions.
We have seen, in Chapter VI., that two liquids can form two immiscible solutions, and the same has also been found true of solid solutions, as we shall presently learn more fully. If, now, two immiscible solutions are formed, then the system will become univariant, and at constant temperature the pc-curve will be a straight line, as in the case of the formation of a compound (cf. p. 86). The behaviour of this system will, therefore, also be represented diagrammatically by Fig. 47.
 Fig. 47.
Palladium and Hydrogen.—The phenomenon of the absorption of hydrogen by palladium, to which Graham gave the name "occlusion," is one that has claimed the attention of several investigators. Although Graham was not of opinion that a compound is formed, but rather that the gas undergoes very great condensation, acts as a quasi-metal (to which he gave the name hydrogenium), and forms a homogeneous alloy with the palladium, later investigations, especially those of Troost and Hautefeuille,[259] pointed to the formation of a definite chemical compound, having the formula Pd2H. This conclusion has, however, not been confirmed by subsequent investigation.[260]
Roozeboom and Hoitsema[261] sought to arrive at a final decision as to the nature of the phenomenon by an investigation of the equilibrium between hydrogen and palladium on the basis of the Phase Rule classification given above. If a compound is formed, diminution of volume would cause no increase of pressure, but only an increase in the amount of the compound.
As this is the only case of gas absorption which has been {179}accurately studied from this point of view, a brief account of the results obtained will be given here, although these are not so clear and free from ambiguity as one would desire.
The scientists just mentioned investigated the variation of the pressure of hydrogen with the amount absorbed by the metal at different temperatures, and a few of their results, typical of all, are represented graphically in Fig. 48; the curves indicating the variation of the gas pressure with the concentration of the hydrogen in the palladium at the temperatures 120°, 170°, and 200°. As can be seen, the curve consists of three parts, an ascending portion which passes gradually and continuously into an almost horizontal but slightly ascending middle part, which in turn passes without break into a second rapidly ascending curve. This, as Fig. 48 indicates, is the general form of the curve; but the length of the middle portion varies with the temperature, being shorter at higher than at lower temperatures.
 Fig. 48.
What is the interpretation to be put on these curves? With regard to the two end portions, these represent bivariant, two-phase systems, consisting of a solid solution and gas. They correspond, therefore, to curve AB in Fig. 47. If the middle portion were horizontal, it would indicate either the formation of a compound or of two immiscible solid solutions. If a compound Pd2H were formed, then the middle portion would at all temperatures end at the same value of the concentration, viz. that corresponding to 0.5 atoms of hydrogen to 1 atom of palladium. As the figure shows, however, this is not the case; the higher the temperature, the lower is the concentration at which the middle passes into the terminal portion of the curve. {180}Such a behaviour would, however, agree with the assumption of the formation of two solid solutions, the "miscibility" of which increases with the temperature, as in the case of the liquid solutions of phenol and water (p. 97). Nevertheless, although the assumption of the formation of two solid solutions is more satisfactory than that of the formation of a compound, it does not entirely explain the facts. If two solid solutions are formed, the pressure curve should be horizontal, but this is not the case; and the deviation from the horizontal does not appear to be due to impurities either in the gas or in the metal, but is apparently a peculiarity of the system. Further, the gradual instead of abrupt passage of the three portions of the curve into one another remains unexplained. Hoitsema has expressed the opinion that the occlusion of hydrogen by palladium is a process of continuous absorption, the peculiar form of the curve—the flat middle portion—being possibly due to a condensation of the gas, even at temperatures far above the critical temperature of liquid hydrogen.
While, therefore, the occlusion of hydrogen by palladium still presents some unexplained phenomena, the behaviour found by Hoitsema would appear to disprove conclusively the formation of a definite chemical compound.[262]
Solution of Solids in Solids. Mixed Crystals.
The introduction by van't Hoff of the term "solid solution" resulted from the discovery of a number of deviations from the Raoult-van't Hoff law for the depression of the freezing point by dissolved substances. In all cases, the depression was too small; in some instances, indeed, the freezing point may be raised. To explain these irregularities, van't Hoff assumed that the dissolved substance crystallized out along with the solid solvent; and he showed how this would account for the {181}deviations from the law of the depression of the freezing point, which had been developed on the assumption that only the pure solvent crystallized out from the solution.[263]
The "mixed crystals" which were thus obtained, and which van't Hoff called dilute solid solutions, showed great resemblance in their behaviour to ordinary liquid solutions, and obeyed the laws applicable to these. These laws, however, can no longer be applied in the case of the concentrated solid solutions formed by the crystallization together of isomorphous substances, and known as isomorphous mixtures. Indeed, it has been contended[264] that these isomorphous mixtures should not be considered as solid solutions at all, although no sharp line of demarcation can be drawn between the two classes. The differences, however, in the behaviour of the two groups are of a quantitative rather than a qualitative nature; and since we are concerned at present only with the qualitative behaviour, we shall make no distinction between the crystalline solid solutions and the isomorphous mixtures, but shall study the behaviour of the two classes under the head of "mixed crystals."
Mixed crystals can be formed either by sublimation[265] or from a liquid phase; and in the latter case the mixed crystals can be deposited either from solution in a common solvent or from a mixture of the fused components. In this method of formation, which alone will be discussed in the present chapter, we are dealing with the fusion curves of two substances, where, however, the liquid solution is in equilibrium not with one of the pure components, but with a solid solution or mixed crystal. The simple scheme (Fig. 29, p. 117) which was obtained in the case of two components which crystallize out in the pure state, is no longer sufficient in the case of the formation of mixed crystals. With the help of the Phase Rule, however, the different possible systems can be classified; and examples of the different cases predicted by the Phase Rule have also been obtained by experiment.
We shall now consider briefly the formation of mixed crystals by isomorphous substances; the consideration of the formation of mixed crystals of isodimorphous substances will, on account of the complexity of the relationships, not be undertaken here.[266]
Formation of Mixed Crystals of Isomorphous Substances.
For the purpose of representing the relationships found here we shall employ a temperature-concentration diagram,[267] in which the ordinates represent the temperature and the abscissæ the concentration of the components. Since there are two solutions, the liquid and the solid, and since the concentration of the components in these two phases is not, in general, the same, two curves will be required for each system, one relating to the liquid phase, the other relating to the solid. The temperature at which solid begins to be deposited from the liquid solution will be called the freezing point of the mixture, and the temperature at which the solid solution just begins to liquefy will be called the melting point of the solid solution. The temperature-concentration curve for the liquid phase will therefore be the freezing-point curve; that for the solid solution, the melting-point curve. The latter will be represented by a dotted line.[268]
I.—The Two Components can form an Unbroken Series of Mixed Crystals.
Since, as has already been pointed out (p. 176), a mixed crystal (solid solution) constitutes only one phase, it is evident that if the two components are miscible with one another in all proportions in the solid state, there can never be more than one solid phase present, viz. the solid solution or mixed crystal. If the components are completely miscible in the solid state, they will also be completely miscible in the liquid state, and there can therefore be only one liquid phase. The system can at no point become invariant, because there can never be more than three phases present. When, therefore, the two components form a continuous series of mixed crystals, the equilibrium curve must also be continuous. Of these systems three types are found.
 Fig. 49.
(a) The freezing points of all mixtures lie between the freezing points of the pure components (Curve I., Fig. 49).
Examples.—This type of curve is represented by the mixed crystals of naphthalene and β-naphthol.[269] The addition of β-naphthol to naphthalene raises the freezing point of the latter, and the rise is directly proportional to the amount of naphthol added. The freezing point curve is therefore a straight line joining the melting points of the two components. This behaviour, however, is rather exceptional, the freezing-point curve lying generally above, sometimes also below, the straight line joining the melting points of the pure components. Thus the freezing-point curve of mixtures of α-monochlorocinnamic aldehyde and α-monobromocinnamic aldehyde[270] lies above the {184}straight line joining the melting points of the pure components (31.22° and 69.56°), as is evident from the following table:—
| Molecules of bromo- cinnamic aldehyde in 100 mols. of mixture. | Freezing point. | Deviation from straight line. |
| 0.00 | 31.22° | — |
| 10.48 | 37.28° | 2.04° |
| 21.91 | 43.12° | 3.50° |
| 30.07 | 46.80° | 4.05° |
| 45.04 | 52.94° | 4.45° |
| 62.16 | 58.82° | 3.77° |
| 82.98 | 65.07° | 2.03° |
| 93.50 | 67.91° | 0.84° |
| 100.00 | 69.56° | — |
Melting-point Curve.—This curve, like the freezing-point curve, must also be continuous, and the melting points of the different solid solutions will lie between the melting points of the pure components. This is represented by the dotted line in Fig. 49, I. The relative position of the two curves, which can be deduced with the help of thermodynamics and also by experimental determination, is found in all cases to be in accordance with the following rule: At any given temperature, the concentration of that component by the addition of which the freezing point is depressed, is greater in the liquid than in the solid phase; or, conversely, the concentration of that component by the addition of which the freezing point is raised, is greater in the solid than in the liquid phase. An illustration of this rule is afforded by the two substances chloro- and bromo-cinnamic aldehyde already mentioned. As can be seen from the above table, the addition of chlorocinnamic aldehyde lowers the melting point of the bromo-compound. In accordance with the rule, therefore, the concentration of the chloro-compound in the liquid phase must be greater than in the solid phase; and this was found experimentally. At a temperature of 49.44°, the liquid contained 58.52 per cent., the solid only 52.57 per cent. of the chlorocinnamic aldehyde.
From this it will also be clear that on cooling a fused mixture of two substances capable of forming mixed crystals, {185}the temperature of solidification will not remain constant during the separation of the solid; nor, on the other hand, will the temperature of liquefaction of the solid solution be constant. Thus, for example, if a liquid solution of two components, A and B, having the composition represented by the point x (Fig. 50), is allowed to cool, the system will pass along the line xx′. At the temperature of the point a, mixed crystals will be deposited, the composition of which will be that represented by b. As the temperature continues to fall, more and more solid will be deposited; and since the solid phase is relatively rich in the component B, the liquid will become relatively poorer in this. The composition of the liquid solution will therefore pass along the curve ad, the composition of the solid solution at the same time passing along the curve bc; at the point c the liquid will solidify completely.[271]
 Fig. 50.
Conversely, if mixed crystals of the composition and at the temperature x′ are heated, liquefaction will begin at the temperature c, yielding a liquid of the composition d. On continuing to add heat, the temperature of the mass will rise, more of the solid will melt, and the composition of the two phases will change as represented by the curves da and cb. When the temperature has risen to a, complete liquefaction will have occurred. The process of solidification or of liquefaction is therefore extended over a temperature interval ac.
Even when the freezing-point curve is a straight line joining {186}the melting points of the pure components, the melting-point curve will not necessarily coincide with the freezing-point curve, although it may approach very near to it; complete coincidence can take place only when the melting points of the two components are identical. An example of this will be given later (Chap. XII.).
(b) The freezing-point curve passes through a maximum (Curve II., Fig. 49).
 Fig. 51.
This curve exhibits the greatest degree of contrast to the freezing-point curve which is obtained when the pure components crystallize out. For, since the curve passes through a maximum, it is evident that the freezing point of each of the components must be raised by the addition of the other component.
Example.—Very few cases belonging to this type are known. The best example is found in the freezing-point curve of mixtures of d- and l-carvoxime[272] (C10H14N.OH). The freezing points and melting points of the different mixtures of d- and l-carvoxime are given in the following table, and represented graphically in Fig. 51:—
| Per cent. of d-carvoxime. | Per cent. of l-carvoxime. | Freezing point. | Melting point. |
| 100 | 0 | 72.0° | 72.0° |
| 99 | 1 | 72.4° | — |
| 98 | 2 | 73.0° | — |
| 95 | 5 | 75.4° | 73.0° |
| 90 | 10 | 79.0° | 75.0° |
| 80 | 20 | 84.6° | 80.0° |
| 70 | 30 | 88.2° | 85.0° |
| 60 | 40 | 90.4° | — |
| 50 | 50 | 91.4° | 91.4° |
| 25 | 75 | 86.4° | 82.0° |
| 8 | 92 | 77.4° | — |
| 1 | 99 | 72.4° | — |
| 0 | 100 | 72.0° | 72.0° |
In this figure, the melting-point curve, i.e. the temperature-concentration curve for the mixed crystals, is represented by the lower curve. Since the addition of the lævo-form to the dextro-form raises the melting point of the latter, the concentration of the lævo-form (on the right-hand branch of the curve) must, in accordance with the rule given, be greater in the solid phase than in the liquid. Similarly, since addition of the dextro-form raises the melting point of the lævo-form, the solid phase (on the left-hand branch of the curve) must be richer in dextro- than in lævo-carvoxime. At the maximum point, the melting-point and freezing-point curves touch; at this point, therefore, the composition of the solid and liquid phases must be identical. It is evident, therefore, that at the maximum point the liquid will solidify, or the solid will liquefy completely without change of temperature; and, accordingly, mixed crystals of the composition represented by the maximum point will exhibit a definite melting point, and will in this respect behave like a simple substance.
(c) The freezing-point curve passes through a minimum (Curve III., Fig. 49).
In this case, as in the case of those systems where the pure components are deposited, a minimum freezing point is obtained. In the latter case, however, there are two freezing-point curves which intersect at a eutectic point; in the case where mixed crystals are formed there is only one continuous curve. On one side of the minimum point the liquid phase contains relatively more, on the other side relatively less, of the one component than does the solid phase; while at the minimum point the composition of the two phases is the same. At this point, therefore, complete solidification or complete liquefaction will occur without change of temperature, and the mixed crystals will accordingly exhibit a definite melting point.
 Fig. 52.
Example.—As an example of this there may be taken the mixed crystals of mercuric bromide and iodide.[273] Mercuric bromide melts at 236.5°, and mercuric iodide at 255.4°. The mixed crystal of definite constant melting point (minimum point) contains 59 mols. per cent. of mercuric bromide, the melting point being 216.1°.
The numerical data are contained in the following table, and represented graphically in Fig. 52:—
| Mols. per cent. of HgBr2. | Freezing point. | Melting point. |
| 100 | 236.5° | 236° |
| 90 | 228.8° | 226° |
| 80 | 222.2° | 219° |
| 70 | 217.8° | 217° |
| 65 | 216.6° | 216° |
| 60 | 216.1° | 215.5° |
| 55 | 216.3° | 216° |
| 50 | 217.3° | 216° |
| 40 | 221.1° | 218° |
| 30 | 227.8° | 223° |
| 20 | 236.2° | 231° |
| 10 | 245.5° | 242° |
| 0 | 255.4° | 254° |
 Fig. 53.
Fractional Crystallization of Mixed Crystals.—With the help of the diagrams already given it will be possible to predict what will be the result of the fractional crystallization of a fused mixture of two substances which can form mixed crystals. Suppose, for example, a fused mixture of the composition x (Fig. 53) is cooled down; then, as we have already seen, when the temperature has fallen to a, mixed crystals of composition, b, are deposited. If the temperature is allowed to fall {189}to x′, and the solid then separated from the liquid, the mixed crystals so obtained will have the composition represented by e. If, now, the mixed crystals e are completely fused and the fused mass allowed to cool, separation of solid will occur when the temperature has fallen to the point f. The mixed crystals which are deposited have now the composition represented by g, i.e. they are richer in B than the original mixed crystals. By repeating this process, the composition of the successive crops of mixed crystals which are obtained approximates more and more to that of the pure component B, while, on the other hand, the composition of the liquid phase produced tends to that of pure A. By a systematic and methodical repetition of the process of fractional crystallization, therefore, a practically complete separation of the components can be effected; a perfect separation is theoretically impossible.
From this it will be readily understood that in the case of substances the freezing point of which passes through a maximum, fractional crystallization will ultimately lead to mixed crystals having the composition of the maximum point, while the liquid phase will more and more assume the composition of either pure A or pure B, according as the initial composition was on the A side or the B side of the maximum point. In those cases, however, where the curves exhibit a minimum, the solid phase which separates out will ultimately be one of the pure components, while a liquid phase will finally be obtained which has the composition of the minimum point.
II.—The Two Components do not form a Continuous Series of Mixed Crystals.
This case corresponds to that of the partial miscibility of liquids. The solid component A can "dissolve" the component B until the concentration of the latter in the mixed crystal has reached a certain value. Addition of a further amount of B will not alter the composition of the mixed crystal, but there will be formed a second solid phase consisting {190}of a solution of A in B. At this point the four phases, mixed crystals containing excess of A, mixed crystals containing excess of B, liquid solution, vapour, can coexist; this will therefore be an invariant point. The temperature-concentration curves will therefore no longer be continuous, but will exhibit a break or discontinuity at the point at which the invariant system is formed.
(a) The freezing-point curve exhibits a transition point (Curve I., Fig. 54).
As is evident from the figure, addition of B raises the melting point of A, and, in accordance with the rule previously given, the concentration of B in the mixed crystals will be greater than in the solution. This is represented in the figure by the dotted curve AD. On the other hand, addition of A lowers the melting point of B, and the two curves BC and BE are obtained for the liquid and solid phases respectively. At the temperature of the line CDE the liquid solution of the composition represented by C is in equilibrium with the two different mixed crystals represented by D and E. At this temperature, therefore, the tc-curve for the solid phase exhibits a discontinuity; and, since the solid phase undergoes change at this point, the freezing-point curve must show a break (p. 111).
 Fig. 54.
Example.—Curves of the form given in Fig. 54 I. have been found experimentally in the case of silver nitrate and sodium nitrate.[274] The following table contains the numerical data, which are also represented graphically in Fig. 55:—
| Molecules NaNO3 per cent. | Freezing point. | Melting point. |
| 0 | 208.6° | 208.6° |
| 8 | 211.4° | 210° |
| 15.06 | 215° | 212° |
| 19.46 | 217.2° | 214.8° |
| 21.9 | 222° | 215° |
| 26 | 228.4° | 216.5° |
| 29.7 | 234.8° | 217.5° |
| 36.2 | 244.4° | 217.5° |
| 47.3 | 259.4° | 237.6° |
| 58.9 | 272° | 257° |
| 72 | 284° | 274° |
| 100 | 308° | 308° |
The temperature of the transition point is 217.5°; at this point the liquid contains 19.5, and the two conjugate solid solutions 26 and 38 molecules of sodium nitrate per cent. respectively.
 Fig. 55.
 Fig. 56.
(b) The freezing-point curve exhibits a eutectic point (Curve II., Fig. 54). {192}
In this case the freezing point of each of the components is lowered by the addition of the other, until at last a point is reached at which the liquid solution solidifies to a mixture or conglomerate of two mixed crystals.
Examples.—Curves belonging to this class have been obtained in the case of potassium and thallium nitrates[275] and of naphthalene and monochloracetic acid.[276] The data for the latter are given in the following table and represented in Fig. 56:—
| Temperature. | Liquid solution. | Solid solution. | ||
| Per cent. naphthalene. | Per cent. acid. | Per cent. naphthalene. | Per cent. acid. | |
| 62° | — | 100 | — | 100 |
| 60° | 4.0 | 96.0 | 1.7 | 98.3 |
| 55° | 21.0 | 79.0 | 2.1 | 97.9 |
| 53.5° | 29.4 | 70.0 | — | — |
| 55° | 31.3 | 68.7 | 59.6 | 40.4 |
| 60° | 42.4 | 57.6 | 80.3 | 19.7 |
| 65° | 53.3 | 46.7 | 89.2 | 10.8 |
| 70° | 69.7 | 32.3 | 95.4 | 4.6 |
| 75° | 84.4 | 15.6 | 96.6 | 3.4 |
| 79.9° | 100 | — | 100 | — |
At the eutectic point the liquid solution is in equilibrium with two different mixed crystals the composition of which is represented by D and E respectively. If, therefore, a fused mixture containing the two components A and B in the proportions represented by C is cooled down, it will, when the temperature has reached the point C, solidify completely to a conglomerate of mixed crystals, D and E.
 Fig. 58.
 Fig. 57.
Changes in Mixed Crystals with the Temperature.—In the case of the different types of systems represented in Fig. 49, a homogeneous liquid solution of the two components will exist at temperatures above the freezing-point curve, a homogeneous mixed crystal at temperatures below the melting-point curve, while at any point between the freezing-point and melting-point {193}curves the mixture will separate into a solid phase and a liquid phase. In the case, however, of the two types shown in Fig. 54 the relationships are somewhat more complicated. As before, the area above the freezing-point curve gives the conditions under which homogeneous liquid solutions can exist; but below the melting-point curve two different mixed crystals can coexist. This will be best understood from Figs. 57 and 58. D and E represent, as we have seen, the composition of two mixed crystals which are in equilibrium with the liquid solution at the temperature of the point C. These two mixed crystals represent, in the one case, a saturated solution of B in A (point D), and the other a saturated solution of A in B (point E). Just as we saw that the mutual solubility of two liquids varied with the temperature, so also in the case of two solids; as the temperature alters, the solubility of the two solid components in one another will change. This alteration is indicated diagrammatically in Figs. 57 and 58 by the dotted curve similar to the solubility curves for two mutually soluble liquids (p. 101).
Suppose, now, that a mixed crystal of the composition x is cooled down, it will remain unchanged until, when the temperature has fallen to t′, the homogeneous mixed crystal breaks up into a conglomerate of two mixed crystals the composition of {194}which is represented by x′ and x″ respectively. From this, then, it can be seen that in the case of substances which form two solid solutions, the mixed crystals which are desposited from the liquid fused mass need not remain unchanged in the solid state, but may at some lower temperature lose their homogeneity. This fact is of considerable importance for the formation of alloys.[277]
A good example of this will soon be met with in the case of the iron and carbon alloys. The alloys of copper and tin also furnish examples of the great changes which may take place in the alloy between the temperature at which it separates out from the fused mass and the ordinary temperature. Thus, for example, one of the alloys of copper and tin which separates out from the liquid as a solid solution breaks up, on cooling, into the compound Cu3Sn and liquid:[278] a striking example of a solid substance partially liquefying on being cooled.
EQUILIBRIUM BETWEEN DYNAMIC ISOMERIDES
It has long been known that certain substances, e.g. acetoacetic ester, are capable when in solution or in the fused state, of reacting as if they possessed two different constitutions; and in order to explain this behaviour the view was advanced (by Laar) that in such cases a hydrogen atom oscillated between two positions in the molecule, being at one time attached to oxygen, at another time to carbon, as represented by the formula—

When the hydrogen is in one position, the substance will act as an hydroxy-compound; with hydrogen in the other position, as a ketone. Substances possessing this double function are called tautomeric.
Doubt, however, arose as to the validity of the above explanation, and this doubt was confirmed by the isolation of the two isomerides in the solid state, and also by the fact that the velocity of change of the one isomeride into the other could in some cases be quantitatively measured. These and other observations then led to the view, in harmony with the laws of chemical dynamics, that tautomeric substances in the dissolved or fused state represent a mixture of two isomeric forms, and that equilibrium is established not by intra- but by inter-molecular change, as expressed by the equation—
CH3.CO.CH2.CO2C2H5 CH3.C(OH):CH.CO2C2H5
In the solid state, the one or other of the isomerides represents the stable form; but in the liquid state (solution or fusion) the stable condition is an equilibrium between the two forms.
A similar behaviour is also found in the case of other isomeric
substances where the isomerism is due to difference of structure,
i.e. structure isomerism (e.g. in the case of the oximes 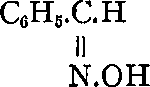 and
and 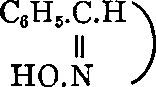 , or to difference in
configuration, i.e. stereoisomerism (e.g. optically active
substances), or to polymerism (e.g. acetaldehyde and paraldehyde).
In all such cases, although the different solid forms correspond to a
single definite constitution, in the liquid state a condition of
equilibrium between the two modifications is established. As a general
name for these different classes of substances, the term "dynamic
isomerides" has been introduced; and the different kinds of isomerism are
classed together under the title "dynamic isomerism."[279]
, or to difference in
configuration, i.e. stereoisomerism (e.g. optically active
substances), or to polymerism (e.g. acetaldehyde and paraldehyde).
In all such cases, although the different solid forms correspond to a
single definite constitution, in the liquid state a condition of
equilibrium between the two modifications is established. As a general
name for these different classes of substances, the term "dynamic
isomerides" has been introduced; and the different kinds of isomerism are
classed together under the title "dynamic isomerism."[279]
By reason of the importance of these phenomena in the study more especially of Organic Chemistry, a brief account of the equilibrium relations exhibited by systems composed of dynamic isomerides may be given here.[280]
In studying the fusion and solidification of those substances which exhibit the relationships of dynamic isomerism, the phenomena observed will vary somewhat according as the reversible transformation of the one form into the other takes place with measurable velocity at temperatures in the neighbourhood of the melting points, or only at some higher temperature. If the transformation is very rapid, the system will behave like a one-component system, but if the isomeric change is comparatively slow, the behaviour will be that of a two-component system.
Temperature-Concentration Diagram.—The relationships which are met with here will be most readily understood with {197}the help of Fig. 59. Suppose, in the first instance, that isomeric transformation does not take place at the temperature of the melting point, then the freezing point curve will have the simple form ACB; the formation of compounds being for the present excluded. This is the simplest type of curve, and gives the composition of the solutions in equilibrium with the one modification (α modification) at different temperatures (curve AC); and of the solutions in equilibrium with the other modification (β modification) at different temperatures (curve BC). C is the eutectic point at which the two solid isomerides can exist side by side in contact with the solution.
 Fig. 59.
Now, suppose that isomeric transformation takes place with measurable velocity. If the pure α-modification is heated to a temperature t′ above its melting point, and the liquid maintained at that temperature until equilibrium has been established, a certain amount of the β-form will be present in the liquid, the composition of which will be represented by the point x′. The same condition of equilibrium will also be reached by starting with pure β. Similarly, if the temperature of the liquid is maintained at the temperature t″, equilibrium will be reached, we shall suppose, when the solution has the composition x″. The curve DE, therefore, which passes through all the different values of x corresponding to different values of t, will represent the change of equilibrium with the temperature. It will slope to the right (as in the figure) if the transformation of α into β is accompanied by absorption of heat; to the left if the transformation is accompanied by evolution of heat, in accordance with van't Hoff's Law of movable equilibrium. If transformation occurs without heat effect, the equilibrium will be independent of the {198}temperature, and the equilibrium curve DE will therefore be perpendicular and parallel to the temperature axis.
We must now find the meaning of the point D. Suppose the pure α- or pure β-form heated to the temperature t′, and the temperature maintained constant until the liquid has the composition x′ corresponding to the equilibrium at that temperature. If the temperature is now allowed to fall sufficiently slowly so that the condition of equilibrium is continually readjusted as the temperature changes, the composition of the solution will gradually alter as represented by the curve x′D. Since D is on the freezing point curve of pure α, this form will be deposited on cooling; and since D is also on the equilibrium curve of the liquid, D is the only point at which solid can exist in stable equilibrium with the liquid phase. (The vapour phase may be omitted from consideration, as we shall suppose the experiments carried out in open vessels.) All systems consisting of the two hylotropic[281] isomeric substances α and β will, therefore, ultimately freeze at the point D, which is called the "natural" freezing point[282] of the system; provided, of course, that sufficient time is allowed for equilibrium to be established. From this it is apparent that the stable modification at temperatures in the neighbourhood of the melting point is that which is in equilibrium with the liquid phase at the natural freezing point.
From what has been said, it will be easy to predict what will be the behaviour of the system under different conditions. If pure α is heated, a temperature will be reached at which it will melt, but this melting point will be sharp only if the velocity of isomeric transformation is comparatively slow; i.e. slow in comparison with the determination of the melting point. If the substance be maintained in the fused condition for some time, a certain amount of the β modification will be formed, and on lowering the temperature the pure α form will be deposited, not at the temperature of the melting point, but at some lower temperature depending on the concentration of the β modification in the liquid phase. If isomeric transformation {199}takes place slowly in comparison with the rate at which deposition of the solid occurs, the liquid will become increasingly rich in the β modification, and the freezing point will, therefore, sink continuously. At the eutectic point, however, the β modification will also be deposited, and the temperature will remain constant until all has become solid. If, on the other hand, the velocity of transformation is sufficiently rapid, then as quickly as the α modification is deposited, the equilibrium between the two isomeric forms in the liquid phase will continuously readjust itself, and the end-point of solidification will be the natural freezing point.
Similarly, starting with the pure β modification, the freezing point after fusion will gradually fall owing to the formation of the α modification; and the composition of the liquid phase will pass along the curve BC. If, now, the rate of cooling is not too great, or if the velocity of isomeric transformation is sufficiently rapid, complete solidification will not occur at the eutectic point; for at this temperature solid and liquid are not in stable equilibrium with one another. On the contrary, a further quantity of the β modification will undergo isomeric change, the liquid phase will become richer in the α form, and the freezing point will rise; the solid phase in contact with the liquid being now the α modification. The freezing point will continue to rise until the point D is reached, at which complete solidification will take place without further change of temperature.
The diagram also allows us to predict what will be the result of rapidly cooling a fused mixture of the two isomerides. Suppose that either the α or the β modification has been maintained in the fused state at the temperature t′ sufficiently long for equilibrium to be established. The composition of the liquid phase will be represented by x′. If the liquid is now rapidly cooled, the composition will remain unchanged as represented by the dotted line x′G. At the temperature of the point G solid α modification will be deposited. If the cooling is not carried below the point G, so as to cause complete solidification, the freezing point will be found to rise with time, owing to the conversion of some of the β form into the α form {200}in the liquid phase; and this will continue until the composition of the liquid has reached the point D. From what has just been said, it can also be seen that if the freezing point curves can be obtained by actual determination of the freezing points of different synthetic mixtures of the two isomerides, it will be possible to determine the condition of equilibrium in the fused state at any given temperature without having recourse to analysis. All that is necessary is to rapidly cool the fused mass, after equilibrium has been established, and find the freezing point at which solid is deposited; that is, find the point at which the line of constant temperature cuts the freezing point curve. The composition corresponding to this temperature gives the composition of the equilibrium mixture at the given temperature.
It will be evident, from what has gone before, that the degree of completeness with which the different curves can be realised will depend on the velocity with which isomeric change takes place, and on the rapidity with which the determinations of the freezing point can be carried out. As the two extremes we have, on the one hand, practically instantaneous transformation, and on the other, practically infinite slowness of transformation. In the former case, only one melting and freezing point will be found, viz. the natural freezing point; in the latter case, the two isomerides will behave as two perfectly independent components, and the equilibrium curve DE will not be realised.
The diagram which is obtained when isomeric transformation does not occur within measurable time at the temperature of the melting point is somewhat different from that already given in Fig. 59. In this case, the two freezing point curves AC and BC (Fig. 60) can be readily realized, as no isomeric change occurs in the liquid phase. Suppose, however, that at a higher temperature, t′, reversible isomeric transformation can take place, the composition of the liquid phase will alter until at the point x′ a condition of equilibrium is reached; and the composition of the liquid at higher temperatures will be represented by the curve x′F. Below the temperature t′ the position of the equilibrium curve is hypothetical; but as the temperature {201}falls the velocity of transformation diminishes, and at last becomes practically zero. The equilibrium curve can therefore be regarded as dividing into two branches x′G and x′H. At temperatures between G and t′ the α modification can undergo isomeric change leading to a point on the curve Gx′; and the β modification can undergo change leading to a point on the curve Hx′. The same condition of equilibrium is therefore not reached from each side, and we are therefore dealing not with true but with false equilibrium (p. 5). Below the temperatures G and H, isomeric transformation does not occur in measurable time. We shall not, however, enter into a detailed discussion of the equilibria in such systems, more especially as they are not systems in true equilibrium, and as the temperature at which true equilibrium can be established with appreciable velocity alters under the influence of catalytic agents.[283] Examples of such systems will no doubt be found in the case of optically active substances, where both isomerides are apparently quite stable at the melting point. In the case of such substances, also, the action of catalytic agents in producing isomeric transformation (racemisation) is well known.
 Fig. 60.
Transformation of the Unstable into the Stable Form.—As has already been stated, the stable modification in the neighbourhood of the melting point is that one which is in equilibrium with the liquid phase at the natural freezing point. In the case of polymorphic substances, we have seen (p. 39) that that form which is stable in the neighbourhood of the melting point melts at the higher temperature. That was a {202}consequence of the fact that the two polymorphic forms on melting gave identical liquid phases. In the present case, however, the above rule does not apply, for the simple reason that the liquid phase obtained by the fusion of the one modification is not identical with that obtained by the fusion of the other. In the case of isomeric substances, therefore, the form of lower melting point may be the more stable; and where this behaviour is found it is a sign that the two forms are isomeric (or polymeric) and not polymorphic.[284] An example of this is found in the case of the isomeric benzaldoximes (p. 203).
Since in Fig. 59 the α modification has been represented as the stable form, the transformation of the β into the α form will be possible at all temperatures down to the transition point. At temperatures below the eutectic point, transformation will occur without formation of a liquid phase; but at temperatures above the eutectic point liquefaction can take place. This will be more readily understood by drawing a line of constant temperature, HK, at some point between C and B. Then if the β modification is maintained for a sufficiently long time at that temperature, a certain amount of the α modification will be formed; and when the composition of the mixture has reached the point H, fusion will occur. If the temperature is maintained constant, isomeric transformation will continue to take place in the liquid phase until the equilibrium point for that temperature is reached. If this temperature is higher than the natural melting point, the mixture will remain liquid all the time; but if it is below the natural melting point, then the α modification will be deposited when the system reaches the condition represented by the point on the curve AC corresponding to the particular temperature. As isomeric transformation continues, the freezing point of the system will rise until it reaches the natural freezing point D. Similarly, if the α modification is maintained at a temperature above that of the point D, liquefaction will ultimately occur, and the system will again reach the final state represented by D.[285]
Examples.—Benzaldoximes. The relationships which have just been discussed from the theoretical point of view will be rendered clearer by a brief description of cases which have been experimentally investigated. The first we shall consider is that of the two isomeric benzaldoximes:[286]—
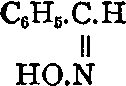 Benzantialdoxime (α-modification). |  Benzsynaldoxime (β-modification). |
Fig. 61 gives a graphic representation of the results obtained.
The melting point of the α modification is 34-35°; the melting point of the unstable β-modification being 130°. The freezing curves AC and BC were obtained by determining the freezing points of different mixtures of known composition, and the numbers so obtained are given in the following table.
| Grams of the α modification in 100 gm. of mixture. | Freezing point. |
| 26.2 | 101° |
| 49.2 | 79° |
| 73.7 | 46° |
| 91.7 | 26.2° |
| 95.0 | 28.6° |
| 96.0 | 30.0° |
 Fig. 61.
The eutectic point C was found to lie at 25-26°, and the natural freezing point D was found to be 27.7°. The equilibrium curve DE was determined by heating the liquid mixtures at different temperatures until equilibrium was attained, and then rapidly cooling the liquid. In all cases the freezing point was practically that of the point D. From this it is seen that the equilibrium curve must be a straight line parallel to the temperature axis; and, therefore, isomeric transformation in the case of the two benzaldoximes is not accompanied by any heat effect (p. 197). This behaviour has also been found in the case of acetaldoxime.[287]
The isomeric benzaldoximes are also of interest from the fact that the stable modification has the lower melting point (v. p. 202).
Acetaldehyde and Paraldehyde.—As a second example of the equilibria between two isomerides, we shall take the two isomeric (polymeric) forms of acetaldehyde, which have recently been exhaustively studied.[288]
In the case of these two substances the reaction
3CH3.CHO (CH3.CHO)3
takes place at the ordinary temperature with very great slowness. For this reason it is possible to determine the freezing point curves of acetaldehyde and paraldehyde. The three chief points on these curves, represented graphically in Fig. 62, are:—
| m.p. of acetaldehyde | - 118.45° |
| m.p. of paraldehyde | + 12.55° |
| eutectic point | - 119.9° |
 Fig. 62.
In order to determine the position of the natural melting point, it was necessary, on account of the slowness of transformation, to employ a catalytic agent in order to increase the velocity with which the equilibrium was established. A drop of concentrated sulphuric acid served the purpose. In presence of a trace of this substance, isomeric transformation very speedily occurs, and leads to the condition of equilibrium. Starting in the one case with fused paraldehyde, and in the other case with acetaldehyde, the same freezing point, viz. 6.75°, was obtained, the solid phase being paraldehyde. This temperature, 6.75°, is therefore the natural freezing point, and paraldehyde, the solid in equilibrium with the liquid phase at this point, is the stable form.
With regard to the change of equilibrium with the temperature, it was found that whereas the liquid phase contained 11.7 molecules per cent. of acetaldehyde at the natural freezing point, the liquid at the temperature of 41.6° contains 46.6 molecules per cent. of acetaldehyde. As the temperature {206}rises, therefore, there is increased formation of acetaldehyde, or a decreasing amount of polymerisation. This is in harmony with the fact that the polymerisation of acetaldehyde is accompanied by evolution of heat.
While speaking of these isomerides, it may be mentioned that at the temperature 41.6° the equilibrium mixture has a vapour pressure equal to the atmospheric pressure. At this temperature, therefore, the equilibrium mixture (obtained quickly with the help of a trace of sulphuric acid) boils.[289]
SUMMARY.—APPLICATION OF THE PHASE RULE TO THE STUDY OF SYSTEMS OF TWO COMPONENTS
In this concluding chapter on two-component systems, it is proposed to indicate briefly how the Phase Rule has been applied to the elucidation of a number of problems connected with the equilibria between two components, and how it has been employed for the interpretation of the data obtained by experiment. It is hoped that the practical value of the Phase Rule may thereby become more apparent, and its application to other cases be rendered easier.
The interest and importance of investigations into the conditions of equilibrium between two substances, lie in the determination not only of the conditions for the stable existence of the participating substances, but also of whether or not chemical action takes place between these two components; and if combination occurs, in the determination of the nature of the compounds formed and the range of their existence. In all such investigations, the Phase Rule becomes of conspicuous value on account of the fact that its principles afford, as it were, a touchstone by which the character of the system can be determined, and that from the form of the equilibrium curves obtained, conclusions can be drawn as to the nature of the interaction between the two substances. In order to exemplify the application of the principles of the Phase Rule more fully than has already been done, illustrations will be drawn from investigations on the interaction of organic compounds; on the equilibria between optically active compounds; and on alloys. {208}
Summary of the Different Systems of Two Components.—Before passing to the consideration of the application of the Phase Rule to the investigation of particular problems, it will be well to collect together the different types of equilibrium curves with which we are already acquainted; to compare them with one another, in order that we may then employ these characteristic curves for the interpretation of the curves obtained as the result of experiment.
In investigating the equilibria between two components, three chief classes of curves will be obtained according as—
I. No combination takes place between the two components.
II. The components can form definite compounds.
III. The components separate out in the form of mixed crystals.
The different types of curves which are obtained in these three cases are represented in Figs. 63, 64, 65. These different diagrams represent the whole series of equilibria, from the melting point of the one component (A) to that of the other component (B). The curves represent, in all cases, the composition of the solution, or phase of variable composition; the temperature being measured along one axis, and the composition along the other.
We shall now recapitulate very briefly the characteristics of the different curves.
 Fig. 63.
If no compound is formed between the two components, {209}the general form of the equilibrium curve will be that of curve I. or II., Fig. 63. Type I. is the simplest form of curve found, and consists, as the diagram shows, of only two branches, AC and BC, meeting at the point C, which lies below the melting point of either component. The solid phase which is in equilibrium with the solutions AC is pure A; that in equilibrium with BC, pure B. C is the eutectic point. Although at the eutectic point the solution solidifies entirely without change of temperature, the solid which is deposited is not a homogeneous solid phase, but a mixture, or conglomerate of the two components. The eutectic point, therefore, represents the melting or freezing point, not of a compound, but of a mixture (p. 119).
Curve II., Fig. 63, is obtained when two liquid phases are formed. C is an eutectic point, D and F are transition points at which there can co-exist the four phases—solid, two liquid phases, vapour. DEF represents the change in the composition of the two liquid phases with rise of temperature; the curve might also have the reversed form with the critical solution point below the transition points D and F.
 Fig. 64.
In the second class of systems (Fig. 64), that in which combination between the components occurs, there are again two types according as the compound formed has a definite melting point (i.e. can exist in equilibrium with a solution of the same composition), or undergoes only partial fusion; that is, exhibits a transition point.
If a compound possessing a definite melting point is formed, the equilibrium curve will have the general form shown by curve I., Fig. 64. A, B, and D are the melting points of pure A, pure B, and of the compound AxBy respectively. AC {210}is the freezing point curve of A in presence of B; BE that of B in presence of A; and DC and DE the freezing point curves of the compound in presence of a solution containing excess of one of the components. C and E are eutectic points at which mixtures of A and AxBy, or B and AxBy can co-exist in contact with solution. The curve CDE may be large or small, and the melting point of the compound, D, may lie above or below that of each of the components, or may have an intermediate position. If more than one compound can be formed, a series of curves similar to CDE will be obtained (cf. p. 152).
On the other hand, if the compound undergoes transition to another solid phase at a temperature below its melting point, a curve of the form II., Fig. 64, will be found. This corresponds to the case where a compound can exist only in contact with solutions containing excess of one of the components. The metastable continuation of the equilibrium curve for the compound is indicated by the dotted line, the summit of which would be the melting point of the compound. Before this temperature is reached, however, the solid compound ceases to be able to exist in contact with solution, and transition to a different solid phase occurs at the point E (cf. p. 134). This point, therefore, represents the limit of the existence of the compound AB. If a series of compounds can be formed none of which possess a definite melting point, then a series of curves will be obtained which do not exhibit a temperature-maximum, and there will be only one eutectic point. The limits of existence of each compound will be marked by a break in the curve (cf. p. 143).
 Fig. 65.
Turning, lastly, to the third class of systems, in which formation of mixed crystals can occur, five different types of curves can be obtained, as shown in Fig. 65. With regard to the first three types, curves I., II., and III., {211}these differ entirely from those of the previous classes, in that they are continuous; they exhibit no eutectic point, and no transition point. Curve II. bears some resemblance to the melting-point curve of a compound (e.g. CDE, Fig. 64, I.), but differs markedly from it in not ending in eutectic points.
Further, in the case of the formation of a compound, the composition of the solid phase remains unchanged throughout the whole curve between the eutectic points; whereas, when mixed crystals are produced, the composition of the solid phase varies with the composition of the liquid solution. On passing through the maximum, the relative proportions of A and B in the solid and the liquid phase undergo change; on the one side of the maximum, the solid phase contains relatively more A, and on the other side of the maximum, relatively more B than the liquid phase. Lastly, when mixed crystals are formed, the temperature at which complete solidification occurs changes as the composition of the solution changes, whereas in the case of the formation of compounds, the temperature of complete solidification for all solutions is a eutectic point.
The third type of curve, Fig. 65, can be distinguished in a similar manner from the ordinary eutectic curve, Fig. 63, I., to which it bears a certain resemblance. Whereas in the case of the latter, the eutectic point is the temperature of complete solidification of all solutions, the point of minimum temperature in the case of the formation of mixed crystals, is the solidification point only of solutions having one particular composition; that, namely, of the minimum point. For all other solutions, the temperature of complete solidification is different. Whereas, also, in the case of the simple eutectic curve, the solid which separates out from the solutions represented by either curve remains the same throughout the whole extent of that curve, the composition of the mixed crystal varies with variation of the composition of the liquid phase, and the relative proportions of the two components in the solid and the liquid phase are reversed on passing through the minimum.[290]
In a similar manner, type IV., Fig. 65, can be distinguished from type II., Fig. 64, by the fact that it does not exhibit a {212}eutectic point, and that the composition of the solid phase undergoes continuous variation with variation of the liquid phase on either side of the transition point. Lastly, type V., which does exhibit a eutectic point, differs from the eutectic curve of Fig. 63, in that the eutectic point does not constitute the point of complete solidification for all solutions, and that the composition of the solid phase varies with the composition of the liquid phase.
Such, then, are the chief general types of equilibrium curves for two-components; they are the pattern curves with which other curves, experimentally determined, can be compared; and from the comparison it will be possible to draw conclusions as to the nature of the equilibria between the two components under investigation.
1. Organic Compounds.
 Fig. 66.
The principles of the Phase Rule have been applied to the investigation of the equilibria between organic compounds, and Figs. 66-69 reproduce some of the results which have been obtained.[291]
Fig. 66, the freezing point curve (curve of equilibrium) for o-nitrophenol and p-toluidine, shows a curve of the simplest type[292] (type I., Fig. 63), in which two branches meet at an eutectic point. The solid phase in equilibrium with solutions represented by the left-hand branch of the curve was o-nitrophenol (m.p. 44.1°); that in equilibrium with the solutions represented by the right-hand branch, was p-toluidine (m.p. 43.3°). At the eutectic point (15.6°), these two solid phases could co-exist with the liquid phase. This equilibrium curve, therefore, shows that o-nitrophenol and p-toluidine do not combine with one another.
In connection with this curve, attention may be called to the interesting fact that although the solid produced by cooling the liquid phase at the eutectic point has a composition approximating to that of a compound of equimolecular proportions of the phenol and toluidine, and a constant melting point, it is nevertheless a mixture. Although, as a rule, the constituents of the eutectic mixture are not present in simple molecular proportions, there is no reason why they should not be so; and it is therefore necessary to beware of assuming the formation of compounds in such cases.[293]
Fig. 67, on the other hand, indicates with perfect certainty the formation of a compound between phenol and α-naphthylamine.[294] (Cf. curve I., Fig. 64.)
Phenol freezes at 40.4°, but the addition of α-naphthylamine lowers the freezing point as represented by the curve AC. At C (16.0°) the compound C6H5OH,C10H7NH2 is formed, and the system becomes invariant. On increasing the amount of the amine, the temperature of equilibrium rises, the solid phase now being the compound. At D, the curve passes through a maximum (28.8°), at which the solid and liquid phases have the same composition. This is the melting point of the compound. Further addition of the amine lowers the temperature of equilibrium, until at E solid α-naphthylamine separates out, and a second eutectic point (24.0°) is obtained. BE is the {214}freezing-point curve of α-naphthylamine in presence of phenol, the freezing point of the pure amine being 48.3°.
On account of the great sluggishness with which the compound of phenol and α-naphthylamine crystallizes, it was found possible to follow the freezing point curves of phenol and the amine to temperatures considerably below the eutectic points, as shown by the curves CF and EG.
 Fig. 67.
Phenol can also combine with p-toluidine in equimolecular proportions; and this compound is of interest, from the fact that it exists in two crystalline forms melting at 28.5° and 30°. Each of these forms now must have its own equilibrium curve, and it was found that the intermediate portion of the freezing point curve was duplicated, as shown in Fig. 68.[295]
 Fig. 68.
 Fig. 69.
Lastly, a curve is given, Fig. 69,[296] which corresponds with curve II., Fig. 64. Picric acid and benzene can form a compound, which, however, can exist only in contact with solutions containing excess of benzene. When the temperature is raised, a point (K) is reached at which the compound melts with separation of solid picric acid. The point, K, is, therefore, a transition point; analysis, however, showed that the composition of the solution at this point is very nearly that of the compound C6H2(NO2)3OH,C6H6, so that the melting point of the compound can almost be reached. The fusion of the compound of benzene and picric acid with separation of the latter is analogous to the (partial) fusion of Glauber's salt with separation of anhydrous sodium sulphate.
2. Optically Active Substances.
The question as to whether a resolvable inactive body is a mixture of the two oppositely active constituents (a dl-mixture), or a racemic compound, is one which has given rise to considerable discussion during the past decade; and several investigators have endeavoured to establish general rules by which the question could be decided. In the case of inactive liquids it is a matter of great difficulty to arrive at a certain conclusion as to whether one is dealing with a mixture or a compound, for in this case the usual physical methods give but a dubious answer; and although the existence of a racemate in the liquid state (in the case of conine) has been asserted,[297] most chemists incline to the belief that such a thing is improbable.
Even in the case of crystalline substances, where the differences between the various forms is greater, it was not always easy to discriminate between the dl-mixture and the racemic compound. The occurrence of hemihedral faces was considered by Pasteur to be a sufficient criterion for an optically active substance. It has, however, been found that hemihedry in crystals, although a frequent accompaniment of {217}optical activity, is by no means a necessary or constant expression of this property. Other rules, also, which were given, although in some cases reliable, were in other cases insufficient; and all were in so far unsatisfactory that they lacked a theoretical basis.
With the help of the Phase Rule, however, it is possible from a study of the solubility or fusion curves of the optically active and inactive substances, to decide the nature of the inactive substance, at least under certain conditions. On account of the interest and importance which these compounds possess, a brief description of the application of the Phase Rule to the study of such substances will be given here;[298] the two optical antipodes being regarded as the two components.
In the present chapter we shall consider only the fusion curves, the solubility curves being discussed in the next section on three-component systems. The rules which are hereby obtained, have reference only to the nature of the inactive substance in the neighbourhood of the melting points.
I. The inactive substance is a dl-mixture.
In this case the fusion curves will have the simple form shown in type I, Fig. 63. A and B are the melting points of the two optical isomerides, and C the eutectic point at which the inactive mixture consisting of equal amounts of d- and l-form melts. Owing to the similar effect of the one form on the freezing point of the other, the figure is symmetrical. No example of this simple case has been investigated.
II. The two components form a racemic compound.
In this case there will be three melting point curves as in Fig. 64, type I. In this case also the figure must be symmetrical.
Examples.—As examples of this, may be taken dimethyl tartrate and mandelic acid, the freezing point curves of which are given in Figs. 70 and 71.[299] As can be seen, the curve for the racemic tartrate occupies a large part of the diagram, {218}while that for racemic mandelic acid is much smaller. In the case of dimethyldiacetyl tartrate, this middle portion is still less.
 Fig. 70.
 Fig. 71.
 Fig. 72.
Active dimethyl tartrate melts at 43.3°; racemic dimethyl tartrate at 89.4°. Active mandelic acid melts at 132.8°; the racemic acid at 118.0°. In the one case, therefore, the racemic compound has a higher, in the other a lower melting point than the active forms. {219}
In the case of partially racemic compounds (i.e. the compound of a racemate with an optically active substance) the type of curve will be the same, but the figure will no longer be symmetrical. Such a curve has been found in the case of the l-menthyl esters of d- and l-mandelic acid (Fig. 72).[300] The freezing point of l-menthyl d-mandelate is 97.2°, of l-menthyl l-mandelate 77.6°, and of l-menthyl r-mandelate 83.7.° It will be observed that the summit of the curve for the partially racemic mandelate is very flat, indicating that the compound is largely dissociated into its components at the temperature of fusion.
III. The inactive substance is a pseudo-racemic mixed crystal.
In cases where the active components can form mixed crystals, the freezing-point curve will exhibit one of the forms given in Fig. 65. The inactive mixed crystal containing 50 per cent. of the dextro and laevo compound, is known as a pseudo-racemic mixed crystal.[301] So far, only curves of the types I. and II. have been obtained.
Examples.—The two active camphor oximes are of interest from the fact that they form a continuous series of mixed crystals, all of which have the same melting point. The curve which is obtained in this case is, therefore, a straight line joining the melting points of the pure active components; the melting point of the active isomerides and of the whole series of mixed crystals being 118.8°.
 Fig. 73.
In the case of the carvoximes mixed crystals are also formed, but the equilibrium curve in this case exhibits a maximum (Fig. 73). At this maximum point the composition of the solid and of the liquid solution is the same. Since the curve must be symmetrical, this maximum point must occur in the case of the solution containing 50 per cent. {220}of each component, which will therefore be inactive. Further, this inactive mixed crystal will melt and solidify at the same temperature, and behave, therefore, like a chemical compound (p. 187). The melting point of the active compounds is 72°; that of the inactive pseudo-racemic mixed crystal is 91.4°·
Transformations.—As has already been remarked, the conclusions which can be drawn from the fusion curves regarding the nature of the inactive substances formed hold only for temperatures in the neighbourhood of the melting points. At temperatures below the melting point transformation may occur; e.g. a racemate may break up into a dl-mixture, or a pseudo-racemic mixed crystal may form a racemic compound. We shall at a later point meet with examples of a racemic compound changing into a dl-mixture at a definite transition point; and the pseudo-racemic mixed crystal of camphoroxime is an example of the second transformation. Although at temperatures in the neighbourhood of the melting point the two active camphoroximes form only mixed crystals but no compound, a racemic compound is formed at temperatures below 103°. At this temperature the inactive pseudo-racemic mixed crystal changes into a racemic compound; and in the case of the other mixed crystals transformation to racemate and (excess of) active component also occurs, although at a lower temperature than in the case of the inactive mixed crystal. Although this behaviour is one of considerable importance, this brief reference to it must suffice here.[302]
3. Alloys.
One of the most important classes of substances in the study of which the Phase Rule has been of very considerable importance, is that formed by the mixtures or compounds of metals with one another known as alloys. Although in the investigation of the nature of these bodies various methods are employed, one of the most important is the determination of the character of the freezing-point curve; for from the form of this, valuable information can, as we have already learned, be {221}obtained regarding the nature of the solid substances which separate out from the molten mixture.
Although it is impossible here to discuss fully the experimental results and the oftentimes very complicated relationships which the study of the alloys has brought to light, a brief reference to these bodies will be advisable on account both of the scientific interest and of the industrial importance attaching to them.[303]
We have already seen that there are three chief types of freezing-point curves in systems of two components, viz. those obtained when (1) the pure components crystallize out from the molten mass; (2) the components form one or more compounds; (3) the components form mixed crystals. In the case of the metals, representatives of these three classes are also found.
1. The components separate out in the pure state.
In this case the freezing-point curve is of the simple type, Fig. 63, I. Such curves have been obtained in the case of a number of pairs of metals, e.g. zinc—cadmium, zinc—aluminium, copper—silver (Heycock and Neville), tin—zinc, bismuth—lead (Gautier), and in other cases. From molten mixtures represented by one branch of the freezing-point curve one of the metals will be deposited; while from mixtures represented by the other branch, the other metal will separate out. At the eutectic point the molten mass will solidify to a heterogeneous mixture of the two metals, forming what is known as the eutectic alloy. Such an alloy, therefore, will melt at a definite temperature lower than the melting point of either of the pure metals.
In the following table are given the temperature and the composition of the liquid at the eutectic point, for three pairs of metals:—
| Temperature. | Composition of liquid. | |
| Zinc—cadmium | 264.5° | 73.5 atoms per cent. of cadmium. |
| Zinc—aluminium | 380.5° | 11 ,, ,, aluminium. |
| Copper—silver | 778° | 40 ,, ,, copper. |
The melting points of the pure metals are, zinc, 419°; cadmium, 322°; silver, 960°; copper, 1081°; aluminium, 650°.
2. The two metals can form one or more compounds.
In this case there will be obtained not only the freezing-point curves of the pure metals, but each compound formed will have its own freezing-point curve, exhibiting a point of maximum temperature, and ending on either side in an eutectic point. The simplest curve of this type will be obtained when only one compound is formed, as is the case with mercury and thallium.[304] This curve is represented in Fig. 74, where the summit of the intermediate curve corresponds with a composition TlHg2. Similar curves are also given by nickel and tin, by aluminium and silver, and by other metals, the formation of definite compounds between these pairs of metals being thereby indicated.[305]
 Fig. 74.
A curve belonging to the same type, but more complicated, is obtained with gold and aluminium;[306] in this case, several compounds are formed, some of which have a definite melting point, while others exhibit only a transition point. The chief compound is AuAl2, which has practically the same melting point as pure gold.
3. The two metals form mixed crystals (solid solutions).
The simplest case in which the metals crystallize out together is found in silver and gold.[307] The freezing-point curve in this case is an almost straight line joining the freezing points of the pure metals (cf. curve I., Fig. 65, p. 210). These two metals, therefore, can form an unbroken series of mixed crystals.
In some cases, however, the two metals do not form an unbroken series of mixed crystals. In the case of zinc and silver,[308] for example, the addition of silver raises the freezing point of the mixture, until a transition point is reached. This corresponds with curve IV., Fig. 65. Silver and copper, and gold and copper, on the other hand, do not form unbroken series of mixed crystals, but the freezing-point curve exhibits an eutectic point, as in curve V., Fig. 65.
Not only may there be these three different types of curves, but there may also be combinations of these. Thus the two metals may not only form compounds, but one of the metals may not separate out in the pure state at all, but form mixed crystals. In this case the freezing point may rise (as in the case of silver and zinc), and one of the eutectic points will be absent.
Iron-Carbon Alloys.—Of all the different binary alloys, probably the most important are those formed by iron and carbon: alloys consisting not of two metals, but of a metal and a non-metal. On account of the importance of these alloys, an attempt will be made to describe in brief some of the most important relationships met with.
Before proceeding to discuss the applications of the Phase Rule to the study of the iron-carbon alloys, however, the main {224}facts with which we have to deal may be stated very briefly. With regard to the metal itself, it is known to exist in three different allotropic modifications, called α-, β-, and γ-ferrite respectively. Like the two modifications of sulphur and of tin, these different forms exhibit transition points at which the relative stability of the forms changes. Thus the transition point for α- and β-ferrite is about 780°; and below this temperature the α- form, above it the β- form is stable. For β- and γ-ferrite, the transition point is about 870°, the γ- form being the stable modification above this temperature.
The different modifications of iron also possess different properties. Thus, α-ferrite is magnetic, but does not possess the power of dissolving carbon; β-ferrite is non-magnetic, and likewise does not dissolve carbon; γ-ferrite is also non-magnetic, but possesses the power of dissolving carbon, and of thus giving rise to solid solutions of carbon in iron.
Various alloys of iron and carbon, also, have to be distinguished. First of all, there is hard steel, which contains varying amounts of carbon up to 2 per cent. Microscopic examination shows that these mixtures are all homogeneous; and they are therefore to be regarded as solid solutions of carbon in iron (γ-ferrite). To these solutions the name martensite has been given. Pearlite contains about 0.8 per cent. of carbon, and, on microscopic examination, is found to be a heterogeneous mixture. If heated above 670°, pearlite becomes homogeneous, and forms martensite. Lastly, there is a definite compound of iron and carbon, iron carbide or cementite, having the formula Fe3C.
A short description may now be given of the application of the Phase Rule to the two-component system iron—carbon; and of the diagram showing how the different systems are related, and with the help of which the behaviour of the different mixtures under given conditions can be predicted. Although, with regard to the main features of this diagram, the different areas to be mapped and the position of the frontier lines, there is general agreement; a final decision has not yet been reached with regard to the interpretation to be put on all the curves.
 Fig. 75.
The chief relationships met with in the case of the {225}iron-carbon alloys are represented graphically in Fig. 75.[309] The curve AC is the freezing-point curve for iron,[310] BC the unknown freezing-point curve for graphite. C is an eutectic point. Suppose, now, that we start with a mixture of iron and carbon, represented by the point x. On lowering the temperature, a point, y, will be reached at which solid begins to separate out. This solid phase, however, is not pure iron, but a solid solution of carbon in iron, having the composition represented by y′ (cf. p. 185). As the temperature continues to fall, the {226}composition of the liquid phase changes in the direction of yC, while the composition of the solid which separates out changes in the direction y′D; and, finally, when the composition of the molten mass is that of the point C (4.3 per cent. of carbon), the whole mass solidifies to a heterogeneous mixture of two solid solutions, one of which is represented by D (containing 2 per cent. of carbon), while the other will consist practically of pure graphite, and is not shown in the figure. The temperature of the eutectic point is 1130°.
Even below the solidification point, however, changes can take place. As has been said, the solid phase which finally separates out from the molten mass is a solid solution represented by the point D; and the curve DE represents the change in the composition of this solid solution with the temperature. As indicated in the figure, DE forms a part of a curve representing the mutual solubility of graphite in iron and iron in graphite; the latter solutions, however, not being shown, as they would lie far outside the diagram. As the temperature falls below 1130°, more and more graphite separates out, until at E, when the temperature is 1000°, the solid solution contains only 1.8 per cent. of carbon. At this temperature cementite also begins to be formed, so that as the temperature continues to fall, separation of cementite (represented by the line E′F′) occurs, and the composition of the solid solution undergoes alteration, as represented by the curve EF. Below the temperature of the point F (670°) the martensite becomes heterogeneous, and forms pearlite.
From the above description, therefore, it follows that if we start with a molten mixture of iron and carbon, the composition of which is represented by any point between D and C (from 2 to 4.3 per cent. of carbon), we shall obtain, on cooling the mass, first of all solid solutions, the composition of which will be represented by points on the line AD; that then, after the mass has completely solidified at 1130°, further cooling will lead to a separation of graphite and a change in the composition of the martensite (from 2 to 1.8 per cent. of carbon). On cooling below 1000°, however, the martensite and graphite will give rise to cementite and solid solutions {227}containing less carbon than before, until, at temperatures below 670°, we are left with a mixture of pearlite and cementite.
We have already said that iron consists in three allotropic modifications, the regions of stability of which are separated by definite transition points. The transition point for α- and β-ferrite (780°) is represented in Fig. 75 by the point H; and the transition point for β- and γ-ferrite (870°) by the point I. Since neither the α- nor the β-ferrite dissolves carbon, the transition point will be unaffected by addition of carbon, and we therefore obtain the horizontal transition curve HG. In the case of the β- and γ-ferrite, however, the latter dissolves carbon, and the transition point is consequently affected by the amount of carbon present. This is shown by the line IG.
If a martensite containing less carbon than that represented by the point G is cooled down from a temperature of, say, 900°, then when the temperature has fallen to that, represented by a point on the curve IG, β-ferrite will separate out, and, as the temperature falls, the composition of the solid solution will alter as represented by IG. On passing below the temperature of HG, the β-ferrite will be converted into α-ferrite, and, as the temperature falls, the latter will separate out more and more, while the composition of the solid solution alters in the direction GF. On passing to still lower temperatures, the solid solution at F (0.8 per cent. of carbon) breaks up into pearlite. If the percentage of carbon in the original solid solution was between that represented by the points G and F, then, on cooling down, no β-ferrite, but only α-ferrite would separate out.
We see, therefore, that when martensite is allowed to cool slowly, it yields a heterogeneous mixture either of ferrite and pearlite (when the original mixture contained up to 0.8 per cent. of carbon), or pearlite and cementite (when the original mixture contained between 0.8 and 2 per cent. of carbon). These heterogeneous mixtures constitute soft steels, or, when the carbon content is low, wrought iron.
The case, however, is different if the solid solution of carbon in iron is rapidly cooled (quenched) from a temperature above the curve IGFE to a temperature below this {228}curve. In this case, the rapid cooling does not allow time for the various changes which have been described to take place; so that the homogeneous solid solution, on being rapidly cooled, remains homogeneous. In this way hard steel is obtained. By varying the rapidity of cooling, as is done in the tempering of steel, varying degrees of hardness can be obtained.
The interpretation of the curves given above is that due essentially to Roozeboom, who concluded from the experimental data that at temperatures below 1000° the stable systems are martensite and cementite, or ferrite and cementite, graphite being labile. It has, however, been pointed out, more especially by E. Heyn,[311] that this is not in harmony with the facts of metallurgy, which show that graphite is undoubtedly formed on slow cooling, and more especially when small quantities of silicon are present in the iron.[312] While, therefore, the relationships represented by Fig. 75 are obtained under certain conditions (especially when manganese is present), Heyn considers that all the curves in that figure, except ACB, represent metastable systems—systems, therefore, akin to supercooled liquids. Rapid cooling will favour the production of the metastable systems containing cementite, and therefore give rise to relationships represented by Fig. 75; whereas slow cooling will lead to the stable system ferrite and graphite. Presence of silicon tends to prevent, presence of manganese tends to assist, the production of the metastable systems.
Although this view put forward by Heyn has not been conclusively proved, it must be said that there is much evidence in its favour. Further investigation is, however, required before a final decision as to the interpretation of the curves can be reached.
Determination of the Composition of Compounds, without Analysis.—Since the equilibrium between a solid and a liquid phase depends not only on the composition of the liquid (solution) but also on that of the solid, it is necessary {229}to determine the composition of the latter. In some cases this is easily effected by separating the solid from the liquid phase and analyzing it. In other cases, however, this method is inapplicable, or is accompanied by difficulties, due either to the fact that the solid phase undergoes decomposition (e.g. when it contains a volatile constituent), or to the difficulty of completely separating the mother liquor; as, for example, in the case of alloys. In all such cases, therefore, recourse must be had to other methods.
In the first place, synthetic methods may be employed.[313] In this case we start with a solution of the two components, to which a third substance is added, which, however, does not enter into the solid phase.[314] We will assume that the initial solution contains x gm. of A and y gm. of B to 1 gm. of C. After the solution has been cooled down to such a temperature that solid substance separates out, a portion of the liquid phase is removed with a pipette and analyzed. If, now, the composition of the solution is such that there are x′ gm. of A and y′ gm. of B to 1 gm. of C., then the composition of the solid phase is x - x′ gm. of A and y - y′ gm. of B. When x = x′, the solid phase is pure B; when y = y′, the solid phase is pure A.
We have assumed here that there is only one solid phase present, containing A and B. To make sure that the solid phase is not a solid solution in which A and B are present in the same ratio as in the liquid solution, a second determination of the composition must be made, with different initial and end concentrations. If the solid phase is a solid solution, the composition will now be found different from that found previously.
The composition of the solid phase can, however, be determined in another manner, viz. by studying the fusion curve and the curve of cooling. From the form of the fusion curve alone, it is possible to decide whether the two components {230}form a compound or not; and if the compounds which may be formed have a definite melting point, the position of the latter gives at once the composition of the compounds (cf. p. 231).
This method, however, cannot be applied when the compounds undergo decomposition before the melting point is reached. In such cases, however, the form of the cooling curve enables one to decide the composition of the solid phase.[315] If a solution is allowed to cool slowly, and the temperature noted at definite times, the graphic representation of the rate of cooling will give a continuous curve; e.g. ab in Fig. 76. So soon, however, as a solid phase begins to be formed, the rate of cooling alters abruptly, and the cooling curve then exhibits a break, or change in direction (point b). When the eutectic point is reached, the temperature remains constant, until all the liquid has solidified. This is represented by the line cd. When complete solidification has occurred, the fall of temperature again becomes uniform (de).
 Fig. 76.
 Fig. 78.
 Fig. 77.
The length of time during which the temperature remains constant at the point c, depends, of course, on the eutectic solution. If, therefore, we take equal amounts of solution having a different initial composition, the period of constant temperature in the cooling curve will evidently be greatest in the case of the solution having the composition of the eutectic point; and the period will become less and less as we increase the amount of one of the components. The relationship between initial composition of solution and the duration of constant temperature at the eutectic point is represented by the curve a′c′b′ (Fig. 77). When a compound possessing a definite melting point is formed, it behaves as a pure substance. If, therefore, the initial composition of the {231}solution is the same as that of the compound, no eutectic solution will be obtained; and therefore no line of constant temperature, such as cd (Fig. 76). In such a case, if we represent graphically the relation between the initial composition of the solution and the duration of constant temperature, a diagram is obtained such as shown in Fig. 78. The two maxima on the time-composition curve represent eutectic points, and the minima, a′, b′, e′, pure substances. The position of e′ gives the composition of the compound. When a series of compounds is formed, then for each compound a minimum is found on the time-composition curve.
 Fig. 79.
If the compound formed has no definite melting point, the diagram obtained is like that shown in Fig. 79. If we start with a solution, the composition of which is represented by a point between d and b, then, on cooling, b will separate out first, and the temperature will fall until the point d is reached. The temperature then remains constant until the component b, which has separated out, is converted into the compound. After this the temperature again falls, until it again remains constant at the eutectic point c. In the case of the first halt, the period of constant temperature is greatest when the initial composition of the solution is the same as that of the compound; and it becomes shorter and shorter with {232}increase in the amount of either component. In this way we obtain the time-composition curve b′e″d′, of which the maximum point e″ gives the composition of the compound.
On the other hand, the period of constant temperature for the eutectic point c is greatest in the case of solutions having the same initial composition as that corresponding with the eutectic point; and it decreases the more the initial composition approaches that of the pure component a or the component e. In this way we obtain the time-composition curve a′c′e′. Here also the point e′ represents the composition of the compound. We see, therefore, that from the graphic representation of the freezing-point curve, and from the duration of the temperature-arrests on the cooling curve, for solutions of different initial composition, it is possible, without having recourse to analysis, to decide what solid phases are formed, and what is their composition.
Formation of Minerals.—Important and interesting as is the application of the Phase Rule to the study of alloys, its application to the study of the conditions regulating the formation of minerals is no less so; and although we do not propose to consider different cases in detail here, still attention must be drawn to certain points connected with this interesting subject.
In the first place, it will be evident from what has already been said, that that mineral which first crystallizes out from a molten magma is not necessarily the one with the highest melting point. The composition of the fused mass must be taken into account. When the system consists of two components which do not form a compound, one or other of these will separate out in a pure state, according as the composition of the molten mass lies on one or other side of the eutectic composition; and the separation of the one component will continue until the composition of the eutectic point is reached. Further cooling will then lead to the simultaneous separation of the two components.
If, however, the two components form a stable compound (e.g. orthoclase, from a fused mixture of silica and potassium aluminate), then the freezing-point curve will resemble that {233}shown in Fig. 64; i.e. there will be a middle curve possessing a dystectic point, and ending on either side at a eutectic point. This curve would represent the conditions under which orthoclase is in equilibrium with the molten magma. If the initial composition of the magma is represented by a point between the two eutectic points, orthoclase will separate first. The composition of the magma will thereby change, and the mass will finally solidify to a mixture of orthoclase and silica, or orthoclase and potassium aluminate, according to the initial composition.
What has just been said holds, however, only for stable equilibria, and it must not be forgotten that complications can arise owing to suspended transformation (when, for example, the magma is rapidly cooled) and the production of metastable equilibria. These conditions occur very frequently in nature.
The study of the formation of minerals from the point of view of the Phase Rule is still in its initial stages, but the results which have already been obtained give promise of a rich harvest in the future.[316]
SYSTEMS OF THREE COMPONENTS
General.—It has already been made evident that an increase in the number of the components from one to two gives rise to a considerable increase in the possible number of systems, and introduces not a few complications into the equilibrium relations of these. No less is this the case when the number of components increases from two to three; and although examples of all the possible types of systems of three components have not been investigated, nor, indeed, any one type fully, nevertheless, among the systems which have been studied experimentally, cases occur which not only possess a high scientific interest, but are also of great industrial importance. On account not only of the number, but more especially of the complexity of the systems constituted of three components, no attempt will be made to give a full account, or, indeed, even a survey of all the cases which have been subjected to a more or less complete experimental investigation; on the contrary, only a few of the more important classes will be selected, and the most important points in connection with the behaviour of these described.
On applying the Phase Rule
P + F = C + 2
to the systems of three components, we see that in order that the system shall be invariant, no fewer than five phases must be present together, and an invariant system will therefore exist at a quintuple point. Since the number of liquid phases can never exceed the number of the components, and since there can be only one vapour phase, it is evident that in this case, {235}as in others, there must always be at least one solid phase present at the quintuple point. As the number of phases diminishes, the variability of the system can increase from one to four, so that in the last case the condition of the system will not be completely defined until not only the temperature and the total pressure of the system, but also the concentrations of two of the components have been fixed. Or, instead of the concentrations, the partial pressures of the components may also be taken as independent variables.
Graphic Representation.—Hitherto the concentrations of the components have been represented by means of rectangular co-ordinates, although the numerical relationships have been expressed in two different ways. In the one case, the concentration of the one component was expressed in terms of a fixed amount of the other component. Thus, the solubility of a salt was expressed by the number of grams of salt dissolved by 100 grams of water or other solvent; and the numbers so obtained were measured along one of the co-ordinates. The second co-ordinate was then employed to indicate the change of another independent variable, e.g. temperature. In the other case, the combined weights of the two components A and B were put equal to unity, and the concentration of the one expressed as a fraction of the whole amount. This method allows of the representation of the complete series of concentrations, from pure A to pure B, and was employed, for example, in the graphic representation of the freezing point curves.
Even in the case of three components rectangular co-ordinates can also be employed, and, indeed, are the most convenient in those cases where the behaviour of two of the components to one another is very different from their behaviour to the third component; as, for example, in the case of two salts and water. In these cases, the composition of the system can be represented by measuring the amounts of each of the two components in a given weight of the third, along two co-ordinates at right angles to one another; and the change of the system with the temperature can then be represented by a third axis at right angles to the first two. In those cases, {236}however, where the three components behave in much the same manner towards one another, the rectangular co-ordinates are not at all suitable, and instead of these a triangular diagram is employed. Various methods have been proposed for the graphic representation of systems of three components by means of a triangle, but only two of these have been employed to any considerable extent; and a short description of these two methods will therefore suffice.[317]
 Fig. 80.
In the method proposed by Gibbs an equilateral triangle of unit height is used (Fig 80).[318] The quantities of the different components are expressed as fractional parts of the whole, and the sum of their concentrations is therefore equal to unity, and can be represented by the height of the triangle. The corners {237}of the triangle represent the pure substances A, B, and C respectively. A point on one of the sides of the triangle will give the composition of a mixture in which only two components are present, while a point within the triangle will represent the composition of a ternary mixture. Since every point within the triangle has the property that the sum of the perpendiculars from that point on the sides of the triangle is equal to unity (the height of the triangle), it is evident that the composition of a ternary mixture can be represented by fixing a point within the triangle such that the lengths of the perpendiculars from the point to the sides of the triangle are equal respectively to the fractional amounts of the three components present; the fractional amount of A, B, or C being represented by the perpendicular distance from the side of the triangle opposite the corners A, B, and C respectively.
The location of this point is simplified by dividing the normals from each of the corners on the opposite side into ten or one hundred parts, and drawing through these divisions lines at right angles to the normal and parallel to the side of the triangle. A network of rhombohedra is thus obtained, and the position of any point can be read off in practically the same manner as in the case of rectangular co-ordinates. Thus the point P in Fig. 80 represents a ternary mixture of the composition A = 0.5, B = 0.3, C = 0.2; the perpendiculars Pa, Pb, and Pc being equal respectively to 0.5, 0.2, and 0.3 of the height of the triangle.
Another method of representation, due to Roozeboom, consists in employing an equilateral triangle, the length of whose side is made equal to unity, or one hundred; the sum of the fractional or percentage amounts of the three components being represented therefore by a side of the triangle. In this case the composition of a ternary mixture is obtained by determining, not the perpendicular distance of a point P from the three sides of the triangle, but the distance in a direction parallel to the sides of the triangle (Fig. 81). Conversely, in order to represent a mixture consisting of a, b, and c parts of the components A, B, and C respectively, one side of the triangle, say AB, is first of all divided into ten or one {238}hundred parts; a portion, Bx = a, is then measured off, and represents the amount of A present. Similarly, a portion, Ax′ = b, is measured off and represents the fractional amount of B, while the remainder, xx′ = c, represents the amount of C. From x and x′ lines are drawn parallel to the sides of the triangle, and the point of intersection, P, represents the composition of the ternary mixture of given composition; for, as is evident from the figure, the distance of the point P from the three sides of the triangle, when measured in directions parallel to the sides, is equal to a, b, and c respectively. From the division marks on the side AB, it is seen that the point P in this figure also represents a mixture of 0.5 parts of A, 0.2 parts of B, and 0.3 parts of C. This gives exactly the same result as the previous method. The employment of a right-angled isosceles triangle has also been suggested,[319] but is not in general use.
 Fig. 81.
In employing the triangular diagram, it will be of use to note a property of the equilateral triangle. A line drawn from one corner of the triangle to the opposite side, represents the composition of all mixtures in which the relative amounts of two of the components remain unchanged. Thus, as Fig. 82 shows, if the component C is added to a mixture x, in which A and B are present in the proportions of a : b, a mixture x′, which is thereby obtained, also contains A and B in the ratio a : b. For the two triangles ACx and BCx are similar to the two triangles HCx′ and KCx′; and, {239}therefore, Ax : Bx = Hx′ : Kx′. But Ax = Dx and Bx = Ex; further Hx′ = Fx′ and Kx′ = Gx′. Therefore, Dx : Ex = Fx′ : Gx′ = b : a. At all points on the line Cx, therefore, the ratio of A to B is the same.
 Fig. 82.
 Fig. 83.
If it is desired to represent at the same time the change of another independent variable, e.g. temperature, this can be done by measuring the latter along axes drawn perpendicular to the corners of the triangle. In this way a right prism (Fig. 83) is obtained, and each section of this cut parallel to the base represents therefore an isothermal surface.
SOLUTIONS OF LIQUIDS IN LIQUIDS
We have already seen (p. 95) that when two liquids are brought together, they may mix in all proportions and form one homogeneous liquid phase; or, only partial miscibility may occur, and two phases be formed consisting of two mutually saturated solutions. In the latter case, the concentration of the components in either phase and also the vapour pressure of the system had, at a given temperature, perfectly definite values. In the case of three liquid components, a similar behaviour may be found, although complete miscibility of three components with the formation of only one liquid phase is of much rarer occurrence than in the case of two components. When only partial miscibility occurs, various cases are met with according as the three components form one, two, or three pairs of partially miscible liquids. Further, when two of the components are only partially miscible, the addition of the third may cause either an increase or a diminution in the mutual solubility of these. An increase in the mutual solubility is generally found when the third component dissolves readily in each of the other two; but when the third component dissolves only sparingly in the other two, its addition diminishes the mutual solubility of the latter.
We shall consider here only a few examples illustrating the three chief cases which can occur, viz. (1) A and B, and also B and C are miscible in all proportions, while A and C are only partially miscible. (2) A and B are miscible in all proportions, but A and C and B and C are only partially miscible. (3) A and B, B and C, and A and C are only partially miscible. A, B, and C here represent the three components.
1.—The three components form only one pair of partially miscible liquids. {241}
An example of this is found in the three substances: chloroform, water, and acetic acid.[320] Chloroform and acetic acid, and water and acetic acid, are miscible with one another in all proportions, but chloroform and water are only partially miscible with one another. If, therefore, chloroform is shaken with a larger quantity of water than it can dissolve, two layers will be formed consisting one of a saturated solution of water in chloroform, the other of a saturated solution of chloroform in water. The composition of these two solutions at a temperature of about 18°, will be represented by the points a and b in Fig. 84; a representing a solution of the composition: chloroform, 99 per cent.; water, 1 per cent.; and b a solution of the composition: chloroform, 0.8 per cent.; water, 99.2 per cent. When acetic acid is added, it distributes itself between the two liquid layers, and two conjugate ternary solutions, consisting of chloroform, water, and acetic acid are thereby produced which are in equilibrium with one another, and the composition of which will be represented by two points inside the triangle. In this way a series of pairs of ternary solutions will be obtained by the addition of acetic acid to the mixture of chloroform and water. By this addition, also, not only do the two liquid phases become increasingly rich in acetic acid, but the mutual solubility of the chloroform and water increases; so that the layer a becomes relatively richer in water, and layer b relatively richer in chloroform. This is seen from the following table, which gives the percentage composition of different conjugate ternary solutions at 18°.
| Heavier layer. | Lighter layer. | ||||
| Chloroform. | Water. | Acetic acid. | Chloroform. | Water. | Acetic acid. |
| 99.01 | 0.99 | 0 | 0.84 | 99.16 | 0 |
| 91.85 | 1.38 | 6.77 | 1.21 | 73.69 | 25.10 |
| 80.00 | 2.28 | 17.72 | 7.30 | 48.58 | 44.12 |
| 70.13 | 4.12 | 25.75 | 15.11 | 34.71 | 50.18 |
| 67.15 | 5.20 | 27.65 | 18.33 | 31.11 | 50.56 |
| 59.99 | 7.93 | 32.08 | 25.20 | 25.39 | 49.41 |
| 55.81 | 9.58 | 34.61 | 28.85 | 23.28 | 47.87 |
By the continued addition of acetic acid, the composition of the successive conjugate solutions in equilibrium with one another becomes, as the table shows, more nearly the same, and a point is at length reached at which the two solutions become identical. This will therefore be a critical point (p. 98). Increased addition of acetic acid beyond this point will lead to a single homogeneous solution.
These relationships are represented graphically by the curve aKb, Fig. 84. The points on the branch aK represent the composition of the solutions relatively rich in chloroform (heavier layer), those on the curve bK the composition of solutions relatively rich in water (lighter layer); and the points on these two branches representing conjugate solutions are joined together by "tie-lines." Thus, the points a′b′ represent conjugate solutions, and the line a′b′ is a tie-line.
 Fig. 84.
Since, now, acetic acid when added to a heterogeneous mixture of chloroform and water does not enter in equal amounts into the two layers, but in amounts depending on its coefficient of distribution between chloroform and water,[321] the {243}tie-lines will not be parallel to AB, but will be inclined at an angle. As the solutions become more nearly the same, the tie-lines diminish in length, and at last, when the conjugate solutions become identical, shrink to a point. For the reason that the tie-lines are, in general, not parallel to the side of the triangle, the critical point at which the tie-line vanishes will not be at the summit of the curve, but somewhere below this, as represented by the point K.
The curve aKb, further, forms the boundary between the heterogeneous and homogeneous systems. A mixture of chloroform, water, and acetic acid represented by any point outside the curve aKb, will form only one homogeneous phase; while any mixture represented by a point within the curve, will separate into two layers having the composition represented by the ends of the tie-line passing through that point. Thus, a mixture of the total composition x, will separate into two layers having the composition a′ and b′ respectively.
Since three components existing in three phases (two liquid and a vapour phase) constitute a bivariant system, the final result, i.e. the composition of the two layers and the total vapour pressure, will not depend merely on the temperature, as in the case of two-component systems (p. 102), but also on the composition of the mixture with which we start. At constant temperature, however, all mixtures, the composition of which is represented by a point on one and the same tie-line, will separate into the same two liquid phases, although the relative amounts of the two phases will vary. If we omit the vapour phase, the condition of the system will depend on the pressure as well as on the temperature and composition of the initial mixture. By keeping the pressure constant, e.g. at atmospheric pressure (by working with open vessels), the system again becomes bivariant. We see, therefore, that the position of the curve aKb, or, in other words, the composition of the different conjugate ternary solutions, will vary with the temperature, and only with the temperature, if we assume either constancy of pressure or the presence of the vapour phase. Since at the critical point the condition is imposed that the two liquid phases become identical, one degree of freedom is thereby {244}lost, and therefore only one degree of freedom remains. The critical point, therefore, depends on the temperature, and only on the temperature; always on the assumption, of course, that the pressure is constant, or that a vapour phase is present. Fig. 84, therefore, represents an isothermal (p. 239).
It is of importance to note that the composition of the different ternary solutions obtained by the addition of acetic acid to a heterogeneous mixture of chloroform and water, will depend not only on the amount of acetic acid added, but also on the relative amounts of chloroform and water at the commencement. Suppose, for example, that we start with chloroform and water in the proportions represented by the point c′ (Fig. 84). On mixing these, two liquid layers having the composition a and b respectively will be formed. Since by the addition of acetic acid the relative amounts of these two substances in the system as a whole cannot undergo alteration, the total composition of the different ternary systems which will be obtained must be represented by a point on the line Cc′ (p. 238). Thus, for example, by the addition of acetic acid a system may be obtained, the total composition of which is represented by the point c″. Such a system, however, will separate into two conjugate ternary solutions, the composition of which will be represented by the ends of the tie-line passing through the point c″. So long as the total composition of the system lies below the point S, i.e. the point of intersection of the line Cc′ with the boundary curve, two liquid layers will be formed; while all systems having a total composition represented by a point on the line Cc′, above S, will form only one homogeneous solution.
From the figure, also, it is evident that as the amount of acetic acid is increased, the relative amounts of the two liquid layers formed differ more and more until at S a limiting position is reached, when the amount of the one liquid layer dwindles to nought, and only one solution remains.
The same reasoning can be carried through for different initial amounts of chloroform and water, but it would be fruitless to discuss all the different systems which can be obtained. The reason for the preceding discussion was to show that {245}although the addition of acetic acid to a mixture of chloroform and water will, in all cases, lead ultimately to a limiting system, beyond which homogeneity occurs, that point is not necessarily the critical point. On the contrary, in order that addition of acetic acid shall lead to the critical mixture, it is necessary to start with a binary mixture of chloroform and water in the proportions represented by the point c′. In this case, addition of acetic acid will give rise to a series of conjugate ternary solutions, the composition of which will gradually approach to one another, and at last become identical.
From the foregoing it will be evident that the amount of acetic acid required to produce a homogenous solution, will depend on the relative amounts of chloroform and water from which we start, and can be ascertained by joining the corner C with the point on the line AB representing the total composition of the initial binary system. The point where this line intersects the boundary curve aKb will indicate the minimum amount of acetic acid which, under these particular conditions, is necessary to give one homogeneous solution.
Retrograde Solubility.—As a consequence of the fact that acetic acid distributes itself unequally between chloroform and water, and the critical point K, therefore, does not lie at the summit of the curve, it is possible to start with a homogeneous solution in which the percentage amount of acetic acid is greater than at the critical point, and to pass from this first to a heterogenous and then again to a homogenous system merely by altering the relative amounts of chloroform and water. This phenomenon, to which the term retrograde solubility is applied, will be observed not only in the case of chloroform, water, and acetic acid, but in all other systems in which the critical point lies below the highest point of the boundary curve for heterogeneous systems. This will be seen from the diagram, Fig. 85. Starting with the homogeneous system represented by x, in which, therefore, the concentration of C is greater than in the critical mixture (K), if the relative amounts of A and B are altered in the direction xx′, while the amount of C is maintained constant, the system will become heterogeneous when the composition reaches the point y, and will remain {246}heterogeneous with changing composition until the point y′ is passed, when it will again become homogeneous. If the relative concentration of C is increased above that represented by the line SS, this phenomenon will, of course, no longer be observed.
 Fig. 85.
Relationships similar to those described for chloroform, water, and acetic acid are also found in the case of a number of other trios, e.g. ether, water, and alcohol; chloroform, water, and alcohol.[322] They have also been observed in the case of a considerable number of molten metals.[323] Thus, molten lead and silver, as well as molten zinc and silver, mix in all proportions; but molten lead and zinc are only partially miscible with one another. When melted together, therefore, the last two metals will separate into two liquid layers, one rich in lead, the other rich in zinc. If silver is now added, and the temperature maintained above the freezing point of the mixture, the silver passes for the most part, in accordance with the law of distribution, into the upper layer, which is rich in zinc; silver being more soluble in molten zinc than in molten lead. This is clearly shown by the following figures:—[324]
| Heavier alloy. | Lighter alloy. | ||||
| Percentage amount of | Percentage amount of | ||||
| Silver. | Lead. | Zinc. | Silver. | Lead. | Zinc. |
| 1.25 | 96.69 | 2.06 | 38.91 | 3.12 | 57.97 |
| 1.71 | 96.43 | 1.86 | 45.01 | 3.37 | 51.62 |
| 5.55 | 93.16 | 1.29 | 54.93 | 4.21 | 40.86 |
The numbers in the same horizontal row give the composition of the conjugate alloys, and it is evident that the upper layer consists almost entirely of silver and zinc. On allowing the mixture to cool slightly, the upper layer solidifies first, and can be separated from the still molten lead layer. It is on this behaviour of silver towards a mixture of molten lead and zinc that the Parkes's method for the desilverization of lead depends.[325] If aluminium is also added, a still larger proportion of silver passes into the lighter layer, and the desilverization of the lead is more complete.[326]
 Fig. 87.
 Fig. 86.
The Influence of Temperature.—As has already been said, a ternary system existing in three phases possesses two degrees of freedom; and the state of the system is therefore dependent not only on the relative concentration of the components, but also on the temperature. As the temperature changes, therefore, the boundary curve of the heterogeneous system will also alter; and in order to represent this alteration we shall make use of the right prism, in which the temperature is measured upwards. In this way the boundary curve passes into a boundary surface (called a dineric surface), as shown in Fig. 86. In this figure the curve akb is the isothermal for the ternary system; the curve aKb shows the change in the binary system AB with the temperature, with {248}a critical point at K. This curve has the same meaning as those given in Chapter VI. The curve kK is a critical curve joining together the critical points of the different isothermals. In such a case as is shown in Fig. 86, there does not exist any real critical temperature for the ternary system, for as the temperature is raised, the amount of C in the "critical" solution becomes less and less, and at K only two components, A and B, are present. In the case, however, represented in Fig. 87, a real ternary critical point is found. In this figure ak′b is an isothermal, ak″ is the curve for the binary system, and K is the ternary critical point. All points outside the helmet-shaped boundary surface represent homogeneous ternary solutions, while all points within the surface belong to heterogeneous systems. Above the temperature of the point K, the three components are miscible in all proportions. An example of a ternary system yielding such a boundary surface is that consisting of phenol, water, and acetone.[327] In this case the critical temperature K is 92°, and the composition at this ternary critical point is—
| Water | 59 per cent. |
| Acetone | 12 ,, |
| Phenol | 29 ,, |
 Fig. 88.
The difference between the two classes of systems just mentioned, is seen very clearly by a glance at the Figs. 88 and 89, which show the projection of the isothermals on the base of the prism. In Fig. 88, the projections yield paraboloid curves, the two branches of which are cut by one side of the triangle; and the critical point is represented by a point on {249}this side. In the second case (Fig. 89), however, the projections of the isothermals form ellipsoidal curves surrounding the supreme critical point, which now lies inside the triangle. At lower temperatures, these isothermal boundary curves are cut by a side of the triangle; at the critical temperature, k″, of the binary system AB, the boundary curve touches the side AB, while at still higher temperatures the boundary curve comes to lie entirely within the triangle. At any given temperature, therefore, between the critical point of the binary system (k″), and the supreme critical point of the ternary system (K), each pair of the three components are miscible with one another in all proportions; for the region of heterogeneous systems is now bounded by a closed curve lying entirely within the triangle. Outside this curve only homogeneous systems are found. Binary mixtures, therefore, represented by any point on one of the sides of the triangle must be homogeneous, for they all lie outside the boundary curve for heterogeneous states.
 Fig. 89.
2. The three components can form two pairs of partially miscible liquids.
In the case of the three components water, alcohol, and succinic nitrile, water and alcohol are miscible in all proportions, but not so water and succinic nitrile, or alcohol and succinic nitrile.
 Fig. 91.
 Fig. 90.
As we have already seen (p. 122), water and succinic nitrile can form two liquid layers between the temperatures 18.5° and 55.5°; while alcohol and nitrile can form two liquid layers between 13° and 31°. If, then, between these two temperature limits, alcohol is added to a heterogeneous mixture of water and nitrile, or water is added to a mixture of alcohol and nitrile, two heterogeneous ternary systems will be formed, {250}and two boundary curves will be obtained in the triangular diagram, as shown in Fig. 90.[328] On changing the temperature, the boundary curves will also undergo alteration, in a manner similar to that just discussed. As the temperature falls, the two curves will spread out more and more into the centre of the triangle, and might at last meet one another; while at still lower temperatures we may imagine the curves still further expanding so that the two heterogeneous regions flow into one another and form a band on the triangular diagram (Fig. 91). This, certainly, has not been realized in the case of the three components mentioned, because at a temperature higher than that at which the two heterogeneous regions could fuse together, solid separates out.
 Fig. 92.
The gradual expansion of a paraboloid into a band-like area of heterogeneous ternary systems, has, however, been observed in the case of water, phenol, and aniline.[329] In Fig. 92 are shown three isothermals, viz. those for 148°, 95°, and 50°. At 148°, water and aniline form two layers having the composition—
| Water, 83.5 per cent. | 
| and |  | water, 20 per cent. |
| Aniline, 16.5 ,, | aniline, 80 ,, |
and the critical point k′ has the composition—
Water, 65; phenol, 13.2; aniline, 21.8 per cent.
At 95°, the composition of the two binary solutions is—
| Water, 93 per cent. |
| and | | water, 8 per cent. |
| Aniline, 7 ,, | aniline, 92 ,, |
while the point k″ has the composition
Water, 69.9; phenol, 26.6; aniline, 3.5 per cent.
At 50°, the region of heterogeneous states now forms a band, and the two layers formed by water and aniline have the composition—
| Water, 96.5 per cent. |
| and | | water, 5.5 per cent. |
| Aniline, 3.5 ,, | aniline, 94.5 ,, |
while the two layers formed by water and phenol have the composition—
| Water, 89 per cent. |
| and | | water, 20 per cent. |
| Phenol, 11 ,, | phenol, 80 ,, |
All mixtures of water, phenol, and aniline, therefore, the composition of which is represented by any point within the band abcd, will form two ternary solutions; while if the composition is represented by a point outside the band, only one homogeneous solution will be produced.
3. The three components form three pairs of partially miscible liquids.
 Fig. 93.
The third chief case which can occur is that no two of the components are completely miscible with one another. In this case, therefore, we shall obtain three paraboloid boundary curves, as shown in Fig. 93. If, now, we imagine these three curves to expand in towards the centre of the triangle, as might happen, for example, by lowering the temperature, a point will {252}be reached at which the curves partly overlap, and we shall get the appearance shown in Fig. 94.
The points a, b, and c represent the points where the three curves cut, and the triangle abc is a region where the curves overlap. From this diagram we can see that any mixture having a composition represented by a point in one of the clear spaces at the corners of the larger triangle, will form a homogeneous solution; if the composition corresponds to any point lying in one of the quadrilateral regions x1, x2 or x3, two ternary solutions will be formed; while, if the composition is represented by any point in the inner triangle, separation into three layers will occur.
 Fig. 94.
Since in the clear regions at the corners of the triangle we have three components in two phases, liquid and vapour, the systems have three degrees of freedom. At constant temperature, therefore, the condition of the system is not defined until the concentrations of two of the components are fixed. A system belonging to one of the quadrilateral spaces has, as we have seen, two degrees of freedom; besides the temperature, one concentration must be fixed. Lastly, a system the composition of which falls within the inner triangle abc, will form three layers, and will therefore possess only one degree of freedom. If the temperature is fixed, the composition of the three layers is also determined, viz. that of the points a, b, and c respectively; and a change in the composition of the original mixture can lead only to a difference in the relative amounts of the three layers, not to a difference in their composition.
An example of a system which can form three liquid phases is found in water, ether, and succinic nitrile.[330]
PRESENCE OF SOLID PHASES
A. The Ternary Eutectic Point.—In passing to the consideration of those ternary systems in which one or more solid phases can exist together with one liquid phase, we shall first discuss not the solubility curves, as in the case of two-component systems, but the simpler relationships met with at the freezing point. That is, we shall first of all examine the freezing point curves of ternary systems.
 Fig. 95.
Since it is necessary to take into account not only the changing composition of the liquid phase, but also the variation of the temperature, we shall employ the right prism for the graphic representation of the systems, as shown in Fig. 95. A, B, and C in this figure, therefore, denote the melting points of the pure components. If we start with the component A at its melting point, and add B, which is capable of dissolving in liquid A, the freezing point of A will be lowered; and, similarly, the freezing point of B by addition of A. In this way we get the freezing point curve Ak1B for the binary system; k1; being an eutectic point. This curve will of course lie in the plane formed by one face of the prism. In a similar manner we obtain the freezing point curves Ak2C and Bk3C. These curves give the composition of the binary liquid phases in equilibrium {254}with one of the pure components, or at the eutectic points, with a mixture of two solid components. If, now, to the system represented say by the point k1, a small quantity of the third component, C, is added, the temperature at which the two solid phases A and B can exist in equilibrium with the liquid phase is lowered; and this depression of the eutectic point is all the greater the larger the addition of C. In this way we obtain the curve k1K, which slopes inwards and downwards, and indicates the varying composition of the ternary liquid phase with which a mixture of solid A and B are in equilibrium. Similarly, the curves k2K and k3K are the corresponding eutectic curves for A and C, and B and C in equilibrium with ternary solutions. At the point K, the three solid components are in equilibrium with the liquid phase; and this point, therefore, represents the lowest temperature attainable with the three components given. Each of the ternary eutectic curves, as they may be called, is produced by the intersection of two surfaces, while at the ternary eutectic point, three surfaces, viz. Ak1Kk2, Bk1Kk3, and Ck1Kk3 intersect. Any point on one of these surfaces represents a ternary solution in equilibrium with only one component in the solid state; the lines or curves of intersection of these represent equilibria with two solid phases, while at the point K, the ternary eutectic point, there are three solid phases in equilibrium with a liquid and a vapour phase. The surfaces just mentioned represent bivariant systems. One component in the solid state can exist in equilibrium with a ternary liquid phase under varying conditions of temperature and concentration of the components in the solution; and before the state of the system is defined, these two variables, temperature and composition of the liquid phase, must be fixed. On the other hand, the curves formed by the intersection of these planes represent univariant systems; at a given temperature two solid phases can exist in equilibrium with a ternary solution, only when the latter has a definite composition. Lastly, the ternary eutectic point, K, represents an invariant system; three solid phases can exist in equilibrium with a ternary solution, only when the latter has one fixed composition and when the temperature has a definite value. This eutectic point, therefore, {255}has a perfectly definite position, depending only on the nature of the three components.
Instead of employing the prism, the change in the composition of the ternary solutions can also be indicated by means of the projections of the curves k1K, k2K, and k3K on the base of the prism, the particular temperature being written beside the different eutectic points and curves. This is shown in Fig. 96.
 Fig. 96.
The numbers which are given in this diagram refer to the eutectic points for the system bismuth—lead—tin, the data for which are as follows:—[331]
| Melting point of pure metal. | Percentage composition of binary eutectic mixture. | Temperature of binary eutectic point. | ||
| Bi | Pb | Sn | ||
| Bismuth, 268° | 55 | 45 | — | Bi—Pb, 127° |
| Lead, 325° | 58 | — | 42 | Bi—Sn, 133° |
| Tin, 232° | — | 37 | 63 | Pb—Sn, 182° |
| Percentage composition of ternary eutectic mixture. | Temperature of ternary eutectic point. | ||
| Bi | Pb | Sn | |
| 52 | 32 | 16 | 96° |
Formation of Compounds.—In the case just discussed, the components crystallized out from solution in the pure state. If, however, combination can take place between two of the components, the relationships will be somewhat different; the curves which are obtained in such a case being represented in Fig. 97. From the figure, we see that the two components B {256}and C form a compound, and the freezing point curve of the binary system has therefore the form shown in Fig. 64 (p. 209). Further, there are two ternary eutectic points, K1 and K2, the solid phases present being A, B, and compound, and A, C, and compound respectively.
 Fig. 97.
The particular point, now, to which it is desired to draw attention is this. Suppose the ternary eutectic curves projected on a plane parallel to the face of the prism containing B and C, i.e. suppose the concentrations of the two components B and C, between which interaction can occur, expressed in terms of a constant amount of the third component A,[332] curves will then be obtained which are in every respect analogous to the freezing point curves of binary systems. Thus, suppose the eutectic curves k1K and k2K in Fig. 95 projected on the face BC of the prism, then evidently a curve will be obtained consisting of two branches meeting in an eutectic point. On the other hand, the projection of the ternary eutectic curves in Fig. 97 on the face BC of the prism, will give a curve consisting of three portions, as shown by the outline k1K1K2k2 in Fig. 97.
Various examples of this have been studied, and the following table contains some of the data for the system ethylene bromide (A), picric acid (B), and β-naphthol (C), obtained by Bruni.[333]
| Temperature. | Solid phases present. | |
| Point k1 | 9.41° | Ethylene bromide, picric acid. |
| Curve k1K1 | — | ,, ,, |
| Point K1 | 9.32° | Ethylene bromide, picric acid, and β-naphthol picrate. |
| Curve K1D′K2 | — | Ethylene bromide, β-naphthol picrate. |
| Point D′ | 9.75° | ,, ,, ,, ,, |
| Point K2 | 8.89° | ,, ,, β-naphthol, and picrate. |
| Curve K2k2 | — | ,, ,, β-naphthol. |
| Point k2 | 9.04° | ,, ,, ,, |
From what has been said, it will be apparent that if the ternary eutectic curve of a three-component system (in which one of the components is present in constant amount) is determined, it will be possible to state, from the form of curve obtained, whether or not the two components present in varying amount crystallize out pure or combine with one another to form a compound. It may be left to the reader to work out the curves for the other possible systems; but it will be apparent, that the projections of the ternary eutectic curves in the manner given will yield a series of curves alike in all points to the binary curves given in Figs. 63-65, pp. 208-210.
Since, from the method of investigation, the temperatures of the eutectic curves will depend on the melting point of the third component (A), it is possible, by employing substances with widely differing melting points, to investigate the interaction of the two components (e.g. two optical antipodes) B and C over a range of temperature; and thus determine the range of stability of the compound, if one is formed. Since, in some cases, two substances which at one temperature form mixed crystals combine at another temperature to form a definite compound, the relationships which have just been described can be employed, and indeed, have been employed, to determine the temperature at which this change occurs.[334] By means of this method, Adriani found that below 103° i-camphoroxime exists as a racemic compound, while above {258}that temperature it occurs as a racemic mixed crystal[335] (cf. p. 219).
B. Equilibria at Higher Temperatures. Formation of Double Salts.—After having studied the relationships which are found in the neighbourhood of the freezing points of the components, we now pass to the discussion of the equilibria which are met with at higher temperatures. In this connection we shall confine the discussion entirely to the systems formed of two salts and water, dealing more particularly with those cases in which the water is present in relatively large amount and acts as solvent. Further, in studying these systems, one restriction must be made, viz. that the single salts are salts either of the same base or of the same acid; or are, in other words, capable of yielding a common ion in solution. Such a restriction is necessary, because otherwise the system would be one not of three but of four components.[336]
Transition Point.—As is very well known, there exist a number of hydrated salts which, on being heated, undergo apparent partial fusion; and in Chapter V. the behaviour of such hydrates was more fully studied in the light of the Phase Rule. Glauber's salt, or sodium sulphate decahydrate, for example, on being heated to a temperature of about 32.5°, partially liquefies, owing to the fact that the water of crystallization is split off and anhydrous sodium sulphate formed, as shown by the equation—
Na2SO4,10H2O = Na2SO4 + 10H2O
The temperature of 32.5°, it was learned, constituted a transition point for the decahydrate and anhydrous salt plus water; decomposition of the hydrated salt occurring above this temperature, combination of the anhydrous salt and water below it.
Analogous phenomena are met with in systems constituted of two salts and water in which the formation of double salts can take place. Thus, for example, if d-sodium potassium {259}tartrate is heated to above 55°, apparent partial fusion occurs, and the two single salts, d-sodium tartrate and d-potassium tartrate, are deposited, the change which occurs being represented by the equation—
4NaKC4O6H4,4H2O = 2Na2C4O6H4,2H2O + 2K2C4O6H4,½H2O + 11H2O
On the other hand, if sodium and potassium tartrates are mixed with water in the proportions shown on the right side of the equation, the system will remain partially liquid so long as the temperature is maintained above 55° (in a closed vessel to prevent loss of water), but on allowing the temperature to fall below this point, complete solidification will ensue, owing to the formation of the hydrated double salt. Below 55°, therefore, the hydrated double salt is the stable system, while above this temperature the two single salts plus saturated solution are stable.[337]
A similar behaviour is found in the case of the double salt copper dipotassium chloride (CuCl2,2KCl,2H2O or CuK2Cl4,2H2O).[338] When this salt is heated to 92°, partial liquefaction occurs, and the original blue plate-shaped crystals give place to brown crystalline needles and white cubes; while on allowing the temperature to fall, re-formation of the blue double salt ensues. The temperature 92° is, therefore, a transition point at which the reversible reaction—
CuK2Cl4,2H2O CuKCl3 + KCl + 2H2O
takes place.
The decomposition of sodium potassium tartrate, or of copper dipotassium chloride, differs in so far from that of Glauber's salt that two new solid phases are formed; and in the case of copper dipotassium chloride, one of the decomposition products is itself a double salt.
In the two examples of double salt decomposition which have just been mentioned, sufficient water was yielded to cause a partial liquefaction; but other cases are known where this is not so. Thus, when copper calcium acetate is heated to a {260}temperature of 75°, although decomposition of the double salt into the two single salts occurs as represented by the equation[339]—
CuCa(C2H3O2)4,8H2O = Cu(C2H3O2)2,H2O + Ca(C2H3O2)2,H2O + 6H2O
the amount of water split off is insufficient to give the appearance of partial fusion, and, therefore, only a change in the crystals is observed.
The preceding examples, in which decomposition of the double salt was effected by a rise of temperature, were chosen for first consideration as being more analogous to the case of Glauber's salt; but not a few examples are known where the reverse change takes place, formation of the double salt occurring above the transition point, and decomposition into the constituent salts below it. Instances of this behaviour are found in the case of the formation of astracanite from sodium and magnesium sulphates, and of sodium ammonium racemate from the two sodium ammonium tartrates, to which reference will be made later. Between these various systems, however, there is no essential difference; and whether decomposition or formation of the double salt occurs at temperatures above the transition point, will of course depend on the heat of change at that point. For, in accordance with van't Hoff's law of movable equilibrium (p. 58), that change will take place at the higher temperature which is accompanied by an absorption of heat. If, therefore, the formation of the double salt from the single salts is accompanied by an absorption of heat, the double salt will be formed from the single salts on raising the temperature; but if the reverse is the case, then the double salt on being heated will decompose into the constituent salts.[340]
In those cases, now, which have so far been studied, the change at the transition point is accompanied by a taking up or a splitting off of water; and in such cases the general rule can be given, that if the water of crystallization of the two constituent {261}salts together is greater than that of the double salt, the latter will be produced from the former on raising the temperature (e.g. astracanite from sodium and magnesium sulphates); but if the double salt contains more water of crystallization than the two single salts, increase of temperature will effect the decomposition of the double salt. When we seek for the connection between this rule and the law of van't Hoff, it is found in the fact that the heat effect involved in the hydration or dehydration of the salts is much greater than that of the other changes which occur, and determines, therefore, the sign of the total heat effect.[341]
Vapour Pressure. Quintuple Point.—In the case of Glauber's salt, we saw that at a certain temperature the vapour pressure curve of the hydrated salt cut that of the saturated solution of anhydrous sodium sulphate. That point, it will be remembered, was a quadruple point at which the four phases sodium sulphate decahydrate, anhydrous sodium sulphate, solution, and vapour, could co-exist; and was also the point of intersection of the curves for four univariant systems. In the case of the formation of double salts, similar relationships are met with; and also certain differences, due to the fact that we are now dealing with systems of three components. Two cases will be chosen here for brief description, one in which formation, the other in which decomposition of the double salt occurs with rise of temperature.
On heating a mixture of sodium sulphate decahydrate and magnesium sulphate heptahydrate, it is found that at 22° partial liquefaction occurs with formation of astracanite. At this temperature, therefore, there can coexist the five phases—
Na2SO4,10H2O; MgSO4,7H2O; Na2Mg(SO4)2,4H2O; solution; vapour.
This constitutes, therefore, a quintuple point; and since there are three components present in five phases, the system is invariant. This point, also, will be the point of intersection of curves for five univariant systems, which, in this case, must each be composed of four phases. These systems are—
I. Na2SO4,10H2O; MgSO4,7H2O; Na2Mg(SO4)2,4H2O; vapour.
II. Na2SO4,10H2O; MgSO4,7H2O; solution; vapour.
III. MgSO4,7H2O; Na2Mg(SO4)2,4H2O; solution; vapour.
IV. Na2SO4,10H2O; Na2Mg(SO4)2,4H2O; solution; vapour.
V. Na2SO4,10H2O; MgSO4,7H2O; Na2Mg(SO4)2,4H2O; solution.
 Fig. 98.
On representing the vapour pressures of these different systems graphically, a diagram is obtained such as is shown in Fig. 98,[342] the curves being numbered in accordance with the above list. When the system I. is heated, the vapour pressure increases until at the quintuple point the liquid phase (solution) is formed, and it will then depend on the relative amounts of the different phases whether on further heating there is formed system III., IV., or V. If either of the first two is produced, we shall obtain the vapour pressure of the solutions saturated with respect to both double salt and one of the single salts; while if the vapour phase disappears, there will be obtained the pressure of the condensed systems formed of double salt, two single salts and solution. This curve, therefore, indicates the change of the transition point with pressure; and since in the ordinary determinations of the transition point in open vessels, we are in reality dealing with condensed systems under the pressure of 1 atm., it will be evident that the transition point does not accurately coincide with the quintuple point (at which the system is under the pressure of its own vapour). As in the case of other condensed systems, however, pressure has only a slight influence on the temperature of the transition point. Whether or not pressure raises or lowers the transition point will depend on whether transformation is accompanied by an increase or {263}diminution of volume (theorem of Le Chatelier, p. 58). In the case of the formation of astracanite, expansion occurs, and the transition point will therefore be raised by increase of pressure. Although measurements have not been made in the case of this system, the existence of such a curve has been experimentally verified in the case of copper and calcium acetates and water (v. infra).[343]
 Fig. 99.
The vapour pressure diagram in the case of copper calcium acetate and water (Fig. 99), is almost the reverse of that already discussed. In this case, the double salt decomposes on heating, and the decomposition is accompanied by a contraction. Curve I. is the vapour pressure curve for double salt, two single salts (p. 260), and vapour; curves II. and III. give the vapour pressures of solutions saturated with respect to double salt and one of the single salts; curve IV. is the curve of pressures for the solutions saturated with respect to the two single salts; while curve V. again represents the change of the transition point with pressure. On examining this diagram, it is seen that whereas {264}astracanite could exist both above and below the quintuple point, copper calcium acetate can exist only below the quintuple point. This behaviour is found only in those cases in which the double salt is decomposed by rise of temperature, and where the decomposition is accompanied by a diminution of volume.[344]
As already mentioned, the decomposition of copper calcium acetate into the single salts and saturated solution is accompanied by a contraction, and it was therefore to be expected that increase of pressure would lower the transition point. This expectation of theory was confirmed by experiment, for van't Hoff and Spring found that although the transition point under atmospheric pressure is about 75°, decomposition of the double salt took place even at the ordinary temperature when the pressure was increased to 6000 atm.[345]
Solubility Curves at the Transition Point.—At the transition point, as has already been shown, the double salt and the two constituent salts can exist in equilibrium with the same solution. The transition point, therefore, must be the point of intersection of two solubility curves; the solubility curve of the double salt and the solubility curve of the mixtures of the two constituent salts. It should be noted here that we are not dealing with the solubility curves of the single salts separately, for since the systems are composed of three components, a single solid phase can, at a given temperature, be in equilibrium with solutions of different composition, and two solid phases in contact with solution (and vapour) are therefore necessary to give an univariant system. The same applies, of course, to the solubility of the double salt; for a double salt also constitutes a single phase, and can therefore exist in equilibrium with solutions of varying composition. If, however, we make the restriction (which we do for the present) that the double salt is not decomposed by water, then the solution will contain the constituent salts in the same relative proportions as they are contained in the double salt, and the system may therefore be regarded as one of two components, viz. double salt and water. In this case one solid phase is sufficient, with solution and {265}vapour, to give an univariant system; and at a given temperature, therefore, the solubility will have a perfectly definite value.
Since in almost all cases the solubility is determined in open vessels, we shall in the following discussion consider that the vapour phase is absent, and that the system is under a constant pressure, that of the atmosphere. With this restriction, therefore, four phases will constitute an invariant system, three phases an univariant, and two phases a bivariant system.
It has already been learned that in the case of sodium sulphate and water, the solubility curve of the salt undergoes a sudden change in direction at the transition point, and that this is accompanied by a change in the solid phase in equilibrium with the solution. The same behaviour is also found in the case of double salts. To illustrate this, we shall briefly discuss the solubility relations of a few double salts, beginning with one of the simplest cases, that of the formation of rubidium racemate from rubidium d- and l-tartrates. The solubilities are represented diagrammatically in Fig. 100, the numerical data being contained in the following table, in which the solubility is expressed as the number of gram-molecules Rb2C4H4O6 in 100 gm.-molecules of water.[346]
| Temperature. | Solubility of tartrate mixture. | Solubility of racemate. |
| 25° | 13.03 | 10.91 |
| 35° | — | 12.63 |
| 40.4° | — | 13.48 |
| 40.7° | 13.46 | — |
| 54° | 13.83 | — |
In Fig. 100 the curve AB represents the solubility of the racemate, while A′BC represents the solubility of the mixed tartrates. Below the transition point, therefore, the solubility of the racemate is less than that of the mixed tartrates. The solution, saturated with respect to the latter, will be supersaturated with respect to the racemate; and if a nucleus of this is present, racemate will be deposited, and the mixed tartrates, if present in equimolecular amounts, will ultimately {266}entirely disappear, and only racemate will be left as solid phase. The solution will then have the composition represented by a point on the curve AB. Conversely, above the transition point, the saturated solution of the racemate would be supersaturated with respect to the two tartrates, and transformation into the latter would ensue. If, therefore, a solution of equimolecular proportions of rubidium d- and l-tartrates is allowed to evaporate at a temperature above 40°, a mixture of the two tartrates will be deposited; while at temperatures below 40° the racemate will separate out.
 Fig. 100.
Similar relationships are met with in the case of sodium ammonium d- and l-tartrate and sodium ammonium racemate; but in this case the racemate is the stable form in contact with solution above the transition point (27°).[347] Below the transition point, therefore, the solubility curve of the mixed tartrates will lie below the solubility curve of the racemate. Below the transition point, therefore, sodium ammonium racemate will break up in contact with solution into a mixture of sodium ammonium d- and l-tartrates. At a higher temperature, 35°, sodium ammonium racemate undergoes decomposition into sodium racemate and ammonium racemate.[348]
The behaviour of sodium ammonium racemate is of interest from the fact that it was the first racemic substance to be resolved into its optically active forms by a process of crystallization. On neutralizing a solution of racemic tartaric acid, half with soda and half with ammonia, and allowing the solution to evaporate, Pasteur[349] obtained a mixture of sodium ammonium {267}d- and l-tartrates. Since Pasteur was unaware of the existence of a transition point, the success of his experiment was due to the happy chance that he allowed the solution to evaporate at a temperature below 27°; for had he employed a temperature above this, separation of the racemate into the two enantiomorphous forms would not have occurred. For this reason the attempt of Staedel to perform the same resolution met only with failure.[350]
Decomposition of the Double Salt by Water.—In the two cases just described, the solubility relationships at the transition point are of a simpler character than in the case of most double salts. If, at a temperature above the transition point, a mixture of rubidium d- and l-tartrates in equimolecular proportions is brought in contact with water a solution will be obtained, which is saturated with respect to both enantiomorphous forms; and since the solubility of the two optical antipodes is identical, and the effect of one on the solubility of the other also the same, the solution will contain equimolecular amounts of the d- and l-salt. If, now, the solution is cooled down in contact with the solid salts to just below the transition point, it becomes supersaturated with respect to the racemate, and this will be deposited. The solution thereby becomes unsaturated with respect to the mixture of the active salts, and these must therefore pass into solution. As the latter are equally soluble, equal amounts of each will dissolve, and a further quantity of the racemate will be deposited. These processes of solution and deposition will continue until the single tartrates have completely disappeared, and only racemate is left as solid phase. As a consequence of the identical solubility of the two tartrates, therefore, no excess of either form will be left on passing through the transition point. From this it will be evident that the racemate can exist as single solid phase in contact with its saturated solution at the transition point; or, in other words, the racemate is not decomposed by water at the transition point. The same behaviour will evidently be exhibited by sodium ammonium racemate at 27°, for the two enantiomorphous sodium ammonium tartrates have also identical solubility.
Very different, however, is the behaviour of, say, astracanite, or of the majority of double salts; for the solubility of the constituent salts is now no longer the same. If, for example, excess of a mixture of sodium sulphate and magnesium sulphate, in equimolecular proportions, is brought in contact with water below the transition point (22°), more magnesium sulphate than sodium sulphate will dissolve, the solubility of these two salts in a common solution being given by the following figures, which express number of molecules of the salt in 100 molecules of water.[351]
Composition of Solutions saturated with respect to Na2SO4,10H2O and MgSO4,7H2O.
| Temperature. | Na2SO4. | MgSO4. |
| 18.5° | 2.16 | 4.57 |
| 24.5° | 3.43 | 4.68 |
At the transition point, then, it is evident that the solution contains more magnesium sulphate than sodium sulphate: and this must still be the case when astracanite, which contains sodium sulphate and magnesium sulphate in equimolecular proportions, separates out. If, therefore, the temperature is raised slightly above the transition point, magnesium sulphate and sodium sulphate will pass into solution, the former, however, in larger quantities than the latter, and astracanite will be deposited; and this will go on until all the magnesium sulphate has disappeared, and a mixture of astracanite and sodium sulphate decahydrate is left as solid phases. Since there are now three phases present, the system is univariant (by reason of the restriction previously made that the vapour phase is absent), and at a given temperature the solution will have a definite composition; as given in the following table:—
Composition of Solutions saturated with respect to Na2Mg(SO4)2,4H2O and Na2SO4,10H2O.
| Temperature. | Na2SO4. | MgSO4. |
| 22° | 2.95 | 4.70 |
| 24.5° | 3.45 | 3.62 |
From the above figures, therefore, it will be seen that at a temperature just above the transition point a solution in contact with the two solid phases, astracanite and Glauber's salt, contains a relatively smaller amount of sodium sulphate than a pure solution of astracanite would; for in this case there would be equal molecular amounts of Na2SO4 and MgSO4. A solution which is saturated with respect to astracanite alone, will contain more sodium sulphate than the solution saturated with respect to astracanite plus Glauber's salt, and the latter will therefore be deposited. From this, therefore, it is clear that if astracanite is brought in contact with water at about the transition point, it will undergo decomposition with separation of Glauber's salt (supersaturation being excluded).
 Fig. 101.
This will perhaps be made clearer by considering Fig. 101. In this diagram the ordinates represent the ratio of sodium sulphate to magnesium sulphate in the solutions, and the abscissæ represent the temperatures. The line AB represents solutions saturated with respect to a mixture of the single salts (p. 268); BC refers to solutions in equilibrium with astracanite and magnesium sulphate; while BX represents the composition of solutions in contact with the solid phases astracanite and Glauber's salt. The values of the solubility are contained in the following table, and in that on p. 268, and are, as before, expressed in gm.-molecules of salt in 100 gm.-molecules of water.[352]
| Temperature. | Astracanite + sodium sulphate. | Astracanite + magnesium sulphate. | ||
| Na2SO4. | MgSO4. | Na2SO4. | MgSO4. | |
| 18.5° | — | — | 3.41 | 4.27 |
| 22° | 2.95 | 4.70 | 2.85 | 4.63 |
| 24.5° | 3.45 | 3.62 | 2.68 | 4.76 |
| 30° | 4.58 | 2.91 | 2.30 | 5.31 |
| 35° | 4.30 | 2.76 | 1.73 | 5.88 |
At the transition point the ratio of sodium sulphate to magnesium sulphate is approximately 1 : 1.6. In the case of solutions saturated with respect to both astracanite and Glauber's salt, the relative amount of sodium sulphate increases as the temperature rises, while in the solutions saturated for astracanite and magnesium sulphate, the ratio of sodium sulphate to magnesium sulphate decreases.
If, now, we consider only the temperatures above the transition point, we see from the figure that solutions represented by points above the line BX contain relatively more sodium sulphate than solutions in contact with astracanite and Glauber's salt; and solutions lying below the line BC contain relatively more magnesium sulphate than solutions saturated with this salt and astracanite. These solutions will therefore not be stable, but will deposit in the one case, astracanite and Glauber's salt, and in the other case, astracanite and magnesium sulphate, until a point on BX or BC is reached. All solutions, however, lying to the right of CBX, will be unsaturated with respect to these two pairs of salts, and only the solutions represented by the line XY (and which contain equimolecular amounts of sodium and magnesium sulphates) will be saturated with respect to the pure double salt.
Transition Interval.—Fig. 101 will also render intelligible a point of great importance in connection with astracanite, and of double salts generally. At temperatures between those represented by the points B and X, the double salt when brought in contact with water will be decomposed with separation of sodium sulphate. Above the temperature of the point {271}X, however, the solution of the pure double salt is stable, because it can still take up a little of either of the components. At temperatures, then, above that at which the solution in contact with the double salt and the less soluble single salt, contains the single salts in the ratio in which they are present in the double salt, solution of the latter will take place without decomposition. The range of temperature between that at which double salt can begin to be formed (the transition point) and that at which it ceases to be decomposed by water is called the transition interval.[353] If the two single salts have identical solubility at the transition point, the transition interval diminishes to nought.
In those cases where the double salt is the stable form below the transition point, the transition interval will extend downwards to a lower temperature. Fig. 101 will then have the reverse form.
Summary.—With regard to double salts we have learned that their formation from and their decomposition into the single salts, is connected with a definite temperature, the transition temperature. At this transition temperature two vapour pressure curves cut, viz. a curve of dehydration of a mixture of the single salts and the solubility curve of the double salt; or the dehydration curve of the double salt and the solubility curve of the mixed single salts. The solubility curves, also, of these two systems intersect at the transition point, but although the formation of the double salt commences at the transition point, complete stability in contact with water may not be attained till some temperature above (or below) that point. Only when the temperature is beyond the transition interval, will a double salt dissolve in water without decomposition (e.g. the alums).
ISOTHERMAL CURVES AND THE SPACE MODEL
In the preceding chapter we considered the changes in the solubility of double salts and of mixtures of their constituent salts with the temperature; noting, more especially, the relationships between the two systems at the transition point. It is now proposed to conclude the study of the three-component systems by discussing very briefly the solubility relations at constant temperature, or the isothermal solubility curves. In this way fresh light will be thrown on the change in the solubility of one component by the addition of another component, and also on the conditions of formation and stable existence of double salts in solution. With the help of these isothermal curves, also, the phenomena of crystallization at constant temperature—phenomena which have not only a scientific interest but also an important bearing on the industrial preparation of double salts—will be more clearly understood.[354]
A brief description will also be given of the method of representing the variation of the concentration of the two salts in the solution with the temperature.
Non-formation of Double Salts.—In Fig. 102 are shown the solubility curves of two salts, A and B, which at the given temperature do not form a double salt.[355] The ordinates represent the amount of A, the abscissæ the amount of B in a constant amount of the third component, the solvent. The {273}point A, therefore, represents the solubility of the salt A at the given temperature; and similarly, point B represents the solubility of B. Since we are dealing with a three-component system, one solid phase in contact with solution will constitute a bivariant system (in the absence of the vapour phase and under a constant pressure). At any given temperature, therefore, the concentration of the solution in equilibrium with the solid can undergo change. If, now, to a pure solution of A a small quantity of B is added, the solubility of A will in general be altered; as a rule it is diminished, but sometimes it is increased.[356] The curve AC represents the varying composition of the solution in equilibrium with the solid component A. Similarly, the curve BC represents the composition of the solutions in contact with pure B as solid phase. At the point, C, where these two curves intersect, there are two solid phases, viz. pure A and pure B, in equilibrium with solution, and the system becomes invariant. At this point the solution is saturated with respect to both A and B, and at a given temperature must have a perfectly definite composition. To take an example, if we suppose A to represent sodium sulphate decahydrate, and B, magnesium sulphate heptahydrate, and the temperature to be 18.5° (i.e. below the transition point), the point C would represent a solution containing 2.16 gm.-molecules Na2SO4 and 4.57 gm.-molecules MgSO4 per 100 gm.-molecules of water (p. 268). The curve ACB is the boundary curve for saturated solutions; solutions lying outside this curve are supersaturated, those lying within the area ACBO, are unsaturated.
 Fig. 102.
 Fig. 104.
 Fig. 103.
Formation of Double Salt.—We have already learned in the preceding chapter that if the temperature is outside[357] the {274}transition interval, it is possible to prepare a pure saturated solution of the double salt. If, now, we suppose the double salt to contain the two constituent salts in equimolecular proportions, its saturated solution must be represented by a point lying on the line which bisects the angle AOB; e.g. point D, Fig. 103. But a double salt constitutes only a single phase, and can exist, therefore, in contact with solutions of varying concentration, as represented by EDF.
Let us compare, now, the relations between the solubility curve for the double salt, and those for the two constituent salts. We shall suppose that the double salt is formed from the single salts when the temperature is raised above a certain point (as in the formation of astracanite). At a temperature below the transition point, as we have already seen, the solubility of the double salt is greater than that of a mixture of the single salts. The curve EDF, therefore, must lie above the point C, in the region representing solutions supersaturated with respect to the single salts (Fig. 104). Such a solution, however, would be metastable, and on being brought in contact with the single salts would deposit these and yield a solution represented by the point C. At this particular temperature, therefore, the isothermal solubility curve will consist of only two branches.
 Fig. 105.
Suppose, now, that the temperature is that of the transition point. At this point, the double salt can exist together with the single salts in contact with solution. The solubility curve {275}of the double salt must, therefore, pass through the point C, as shown in Fig. 105.
From this figure, now, it is seen that a solution saturated with respect to double salt alone (point D), is supersaturated with respect to the component A. If, then, at the temperature of the transition point, excess of the double salt is brought in contact with water,[358] and if supersaturation is excluded, the double salt will undergo decomposition and the component A will be deposited. The relative concentration of the component B in the solution will, therefore, increase, and the composition of the solution will be thereby altered in the direction DC. When the solution has the composition of C, the single salt ceases to be deposited, for at this point the solution is saturated for both double and single salt; and the system becomes invariant.
This diagram explains very clearly the phenomenon of the decomposition of a double salt at the transition point. As is evident, this decomposition will occur when the solution which is saturated at the temperature of the transition point, with respect to the two single salts (point C), does not contain these salts in the same ratio in which they are present in the double salt. If point C lay on the dotted line bisecting the right angle, then the pure saturated solution of the double salt would not be supersaturated with respect to either of the single salts, and the double salt would, therefore, not be decomposed by water. As has already been mentioned, this behaviour is found in the case of optically active isomerides, the solubilities of which are identical.
At the transition point, therefore, the isothermal curve also consists of two branches; but the point of intersection of the two branches now represents a solution which is saturated not {276}only with respect to the single salts, but also for the double salt in presence of the single salts.
We have just seen that by a change of temperature the two solubility curves, that for the two single salts and that for the double salt, were made to approach one another (cf. Figs. 104 and 105). In the previous chapter, however, we found that on passing the transition point to the region of stability for the double salt, the solution which is saturated for a mixture of the two constituent salts, is supersaturated for the double salt. In this case, therefore, point C must lie above the solubility curve of the pure double salt (Fig. 106), and a solution of the composition C, if brought in contact with double salt, will deposit the latter. If the single salts were also present, then as the double salt separated out, the single salts would pass into solution, because so long as the two single salts are present, the composition of the solution must remain unaltered. If one of the single salts disappear before the other, there will be left double salt plus A or double salt plus B, according to which was in excess; and the composition of the solution will be either that represented by D (saturated for double salt plus A), or that of the point F (saturated for double salt plus B).
 Fig. 106.
In connection with the isothermal represented in Fig. 106, it should be noted that at this particular temperature a solution saturated with respect to the pure double salt is no longer supersaturated for one of the single salts (point D); so that at the temperature of this isothermal the double salt is not decomposed by water. At this temperature, further, the boundary curve consists of three branches AD, DF, and FB, which give the composition of the solutions in equilibrium with pure A, double salt, and pure B respectively; while the points D and F represent solutions saturated for double salt plus A and double salt plus B.
On continuing to alter the temperature in the same direction {277}as before, the relative shifting of the solubility curves becomes more marked, as shown in Fig. 107. At the temperature of this isothermal, the solution saturated for the double salt now lies in a region of distinct unsaturation with respect to the single salts; and the double salt can now exist as solid phase in contact with solutions containing both relatively more of A (curve ED), and relatively more of B (curve DF), than is contained in the double salt itself.
 Fig. 107.
Transition Interval.—From what has been said, and from an examination of the isothermal diagrams, Figs. 104-107, it will be seen that by a variation of the temperature we can pass from a condition where the double salt is quite incapable of existing in contact with solution (supersaturation being excluded), to a condition where the existence of the double salt in presence of solution becomes possible; only in the presence, however, of one of the single salts (transition point, Fig. 105). A further change of temperature leads to a condition where the stable existence of the pure double salt in contact with solution just becomes possible (Fig. 106); and from this point onwards, pure saturated solutions of the double salt can be obtained (Fig. 107). At any temperature, therefore, between that represented by Fig. 105, and that represented by Fig. 106, the double salt undergoes partial decomposition, with deposition of one of the constituent salts. The temperature range between the transition point and the temperature at which a stable saturated solution of the pure double salt just begins to be possible, is known as the transition interval (p. 270). As the figures show, the transition interval is limited on the one side by the transition temperature, and on the other by the temperature at which the solution saturated for double salt and the less soluble of the single salts, contains the component salts in the same ratio as they are present in the double salt. The greater the difference in the solubility of the single salts, the larger will be the transition interval. {278}
Isothermal Evaporation.—The isothermal solubility curves are of great importance for obtaining an insight into the behaviour of a solution when subjected to isothermal evaporation. To simplify the discussion of the relationships found here, we shall still suppose that the double salt contains the single salts in equimolecular proportions; and we shall, in the first instance, suppose that the unsaturated solution with which we commence, also contains the single salts in the same ratio. The composition of the solution must, therefore, be represented by some point lying on the line OD, the bisectrix of the right angle.
From what has been said, it is evident that when the formation of a double salt can occur, three temperature intervals can be distinguished, viz. the single-salt interval, the transition interval, and the double-salt interval.[359] When the temperature lies in the first interval, evaporation leads first of all to the crystallization of one of the single salts, and then to the separation of both the single salts together. In the second temperature interval, evaporation again leads, in the first place, to the deposition of one of the single salts, and afterwards to the crystallization of the double salt. In the third temperature interval, only the double salt crystallizes out. This will become clearer from what follows.
 Fig. 109.
 Fig. 108.
If an unsaturated solution of the two single salts in equimolecular proportion (e.g. point x, Fig. 108) is evaporated at a temperature at which the formation of double salt is impossible, the component A, the solubility curve of which is {279}cut by the line OD, will first separate out; the solution will thereby become richer in B. On continued evaporation, more A will be deposited, and the composition of the solution will change until it attains the composition represented by the point C, when both A and B will be deposited, and the composition of the solution will remain unchanged. The result of evaporation will therefore be a mixture of the two components.
If the formation of double salt is possible, but if the temperature lies within the transition interval, the relations will be represented by a diagram like Fig. 109. Isothermal evaporation of the solution X will lead to the deposition of the component A, and the composition of the solution will alter in the direction DE; at the latter point the double salt will be formed, and the composition of the solution will remain unchanged so long as the two solid phases are present. As can be seen from the diagram, however, the solution in E contains less of component A than is contained in the double salt. Deposition of the double salt at E, therefore, would lead to a relative decrease in the concentration of A in the solution, and to counterbalance this, the salt which separated out at the commencement must redissolve.
Since the salts were originally present in equimolecular proportions, the final result of evaporation will be the pure double salt. If when the solution has reached the point E the salt A which had separated out is removed, double salt only will be left as solid phase. At a given temperature, however, a single solid phase can exist in equilibrium with solutions of different composition. If, therefore, isothermal evaporation is continued after the removal of the salt A, double salt will be deposited, and the composition of the solution will change in the direction EF. At the point F the salt B will separate out, and on evaporation both double salt and the salt B will be deposited. In the former case (when the salt A disappears on evaporation) we are dealing with an incongruently saturated solution; but in the latter case, where both solid phases continue to be deposited, the solution is said to be congruently saturated.[360]
A "congruently saturated solution" is one from which the {280}solid phases are continuously deposited during isothermal evaporation to dryness, whereas in the case of "incongruently saturated solutions," at least one of the solid phases disappears during the process of evaporation.
 Fig. 110.
Lastly, if the temperature lies outside the transition interval, isothermal evaporation of an unsaturated solution of the composition X (Fig. 110) will lead to the deposition of pure double salt from beginning to end. If a solution of the composition Y is evaporated, the component A will first be deposited and the composition of the solution will alter in the direction of E, at which point double salt will separate out. Since the solution at this point contains relatively more of A than is present in the double salt, both the double salt and the single salt A will be deposited on continued evaporation, in order that the composition of the solution shall remain unchanged. In the case of solution Z, first component B and afterwards the double salt will be deposited. The result will, therefore, be a mixture of double salt and the salt B (congruently saturated solutions),
It may be stated here that the same relationships as have been explained above for double salts are also found in the resolution of racemic compounds by means of optically active substances (third method of Pasteur). In this case the single salts are doubly active substances (e.g. strychnine-d-tartrate and strychnine-l-tartrate), and the double salt is a partially racemic compound.[361]
Crystallization of Double Salt from Solutions containing Excess of One Component.—One more case of isothermal crystallization may be discussed. It is well known that a double salt which is decomposed by pure water can nevertheless be obtained pure by crystallization from a solution containing excess of one of the single salts (e.g. in the case of carnallite). Since the double salt is partially decomposed by water, the temperature of the experiment must be within the transition {281}interval, and the relations will, therefore, be represented by a diagram like Fig. 109. If, now, instead of starting with an unsaturated solution containing the single salts in equimolecular proportions, we commence with one in which excess of one of the salts is present, as represented by the point Y, isothermal evaporation will cause the composition to alter in the direction YD′, the relative amounts of the single salts remaining the same throughout. When the composition of the solution reaches the point D′, pure double salt will be deposited. The separation of double salt will, however, cause a relative decrease in the concentration of the salt A, and the composition of the solution will, therefore, alter in the direction D′F. If the evaporation is discontinued before the solution has attained the composition F, only double salt will have separated out. Even within the transition interval, therefore, pure double salt can be obtained by crystallization, provided the original solution has a composition represented by a point lying between the two lines OE and OF. Since, as already shown, the composition of the solution alters on evaporation in the direction EF, it will be best to employ a solution having a composition near to the line OE.
Formation of Mixed Crystals.—If the two single salts A and B do not crystallize out pure from solution, but form an unbroken series of mixed crystals, it is evident that an invariant system cannot be produced. The solubility curve will therefore be continuous from A to B; the liquid solutions of varying composition being in equilibrium with solid solutions also of varying composition. If, however, the series of mixed crystals is not continuous, there will be a break in the solubility curve at which two solid solutions of different composition will be in equilibrium with liquid solution. This, of course, will constitute an invariant system, and the point will correspond to the point C in Fig. 108. A full discussion of these systems would, however, lead us too far, and the above indication of the behaviour must suffice.[362]
Application to the Characterization of Racemates.—The form of the isothermal solubility curves is also of great value for determining whether an inactive substance is a racemic compound or a conglomerate of equal proportions of the optical antipodes.[363]
As has already been pointed out, the formation of racemic compounds from the two enantiomorphous isomerides, is analogous to the formation of double salts. The isothermal solubility curves, also, have a similar form. In the case of the latter, indeed, the relationships are simplified by the fact that the two enantiomorphous forms have identical solubility, and the solubility curves are therefore symmetrical to the line bisecting the angle of the co-ordinates. Further, with the exception of the partially racemic compounds to be mentioned later, there is no transition interval.
In Fig. 111, are given diagrammatically two isothermal solubility curves for optically active substances. From what has been said in the immediately preceding pages, the figure ought really to explain itself. The upper isothermal acb represents the solubility relations when the formation of a racemic compound is excluded, as, e.g. in the case of rubidium d- and l-tartrates above the transition point (p. 265). The solution at the point c is, of course, inactive, and is unaffected by addition of either the d- or l- form. The lower isothermal, on the other hand, would be obtained at a temperature at which the racemic compound could be formed. The curve a′e is the solubility curve for the l- form; b′f, that for the d- form; and edf, that for the racemic compound in presence of solutions of varying concentration. The point d corresponds to saturation for the pure racemic compound.
 Fig. 111.
From these curves now, it will be evident that it will be possible, in any given case, to decide whether or not an inactive body is a mixture or a racemic compound. For this purpose, {283}two solubility determinations are made, first with the inactive material alone (in excess), and then with the inactive material plus excess of one of the optically active forms. If we are dealing with a mixture, the two solutions thus obtained will be identical; both will have the composition corresponding to the point c, and will be inactive. If, however, the inactive material is a racemic compound, then two different solutions will be obtained; namely, an inactive solution corresponding to the point d (Fig. 111), and an active solution corresponding either to e or to f, according to which enantiomorphous form was added.
Partially racemic compounds.[364] In this case we are no longer dealing with enantiomorphous forms, and the solubility of the two oppositely active isomerides is no longer the same. The symmetry of the solubility curves therefore disappears, and a figure is obtained which is identical in its general form with that found in the case of ordinary double salts (Fig. 112). In this case there is a transition interval.
 Fig. 112.
The curves acb belong to a temperature at which the partially racemic compound cannot be formed; a′dfb′, to the temperature at which the compound just begins to be stable in contact with water, and a″ed′f′b″ belongs to a temperature at which the partially racemic compound is quite stable in contact with water. Suppose now solubility determinations, made in the first case with the original material alone, and then with the original body plus each of the two compounds, formed from the enantiomorphous substances separately, then if the original body was a mixture, identical solutions will be obtained in all three cases (point c); if it was a partially racemic compound, three different solutions (e, d′, and f′) will be obtained if the temperature was outside the transition interval, and two solutions, d and f, if the temperature belonged to the transition interval.
Representation in Space.
Space Model for Carnallite.—Interesting and important as the isothermal solubility curves are, they are insufficient for the purpose of obtaining a clear insight into the complete behaviour of the systems of two salts and water. A short description will, therefore, be given here of the representation in space of the solubility relations of potassium and magnesium chlorides, and of the double salt which they form, carnallite.[365]
 Fig. 113.
Fig. 113 is a diagrammatic sketch of the model for carnallite looked at sideways from above. Along the X-axis is measured the concentration of magnesium chloride in the {285}solution; along the Y-axis, the concentration of potassium chloride; while along the T-axis is measured the temperature. The three axes are at right angles to one another. The XT-plane, therefore, contains the solubility curve of magnesium chloride; the YT-plane, the solubility curve of potassium chloride, and in the space between the two planes, there are represented the composition of solutions containing both magnesium and potassium chlorides. Any surface between the two planes will represent the various solutions in equilibrium with only one solid phase, and will therefore indicate the area or field of existence of bivariant ternary systems. A line or curve formed by the intersection of two surfaces will represent solutions in equilibrium with two solid phases (viz. those belonging to the intersecting surfaces), and will show the conditions for the existence of univariant systems. Lastly, points formed by the intersection of three surfaces will represent invariant systems, in which a solution can exist in equilibrium with three solid phases (viz. those belonging to the three surfaces).
We shall first consider the solubility relations of the single salts. The complete equilibrium curve for magnesium chloride and water is represented in Fig. 113 by the series of curves ABF1 G1 H1 J1 L1 N1. AB is the freezing-point curve of ice in contact with solutions containing magnesium chloride, and B is the cryohydric point at which the solid phases ice and MgCl2,12H2O can co-exist with solution. BFG is the solubility curve of magnesium chloride dodecahydrate. This curve shows a point of maximum temperature at F1, and a retroflex portion F1G1. The curve is therefore of the form exhibited by calcium chloride hexahydrate, or the hydrates of ferric chloride (Chapter VIII.). G1 is a transition point at which the solid phase changes from dodecahydrate to octahydrate, the solubility of which is represented by the curve G1H1. At H1 the octahydrate gives place to the hexahydrate, which is the solid phase in equilibrium with the solutions represented by the curve H1J1. J1 and L1 are also transition points at which the solid phase undergoes change, in the former case from hexahydrate to tetrahydrate; and in the latter case, {286}from tetrahydrate to dihydrate. The complete curve of equilibrium for magnesium chloride and water is, therefore, somewhat complicated, and is a good example of the solubility curves obtained with salts capable of forming several hydrates.
The solubility curve of potassium chloride is of the simplest form, consisting only of the two branches AC, the freezing-point curve of ice, and CO, the solubility curve of the salt. C is the cryohydric point. This point and the two curves lie in the YT-plane.
On passing to the ternary systems, the composition of the solutions must be represented by points or curves situated between the two planes. We shall now turn to the consideration of these. BD and CD are ternary eutectic curves (p. 284). They give the composition of solutions in equilibrium with ice and magnesium chloride dodecahydrate (BD), and with ice and potassium chloride (CD). D is a ternary cryohydric point. If the temperature is raised and the ice allowed to disappear, we shall pass to the solubility curve for MgCl2,12H2O + KCl (curve DE). At E carnallite is formed and the potassium chloride disappears; EFG is then the solubility curve for MgCl2,12H2O + carnallite (KMgCl3,6H2O). This curve also shows a point of maximum temperature (F) and a retroflex portion. GH and HJ represent the solubility curves of carnallite + MgCl2,8H2O and carnallite + MgCl2,6H2O, G and H being transition points. JK is the solubility curve for carnallite + MgCl2,4H2O. At the point K we have the highest temperature at which carnallite can exist with magnesium chloride in contact with solution. Above this temperature decomposition takes place and potassium chloride separates out.
If at the point E, at which the two single salts and the double salt are present, excess of potassium chloride is added, the magnesium chloride will all disappear owing to the formation of carnallite, and there will be left carnallite and potassium chloride. The solubility curve for a mixture of these two salts is represented by EMK; a simple curve exhibiting, however, a temperature maximum at M. This maximum point corresponds with the fact that dry carnallite melts at this temperature with separation of potassium chloride. At all temperatures {287}above this point, the formation of double salt is impossible. The retroflex portion of the curve represents solutions in equilibrium with carnallite and potassium chloride, but in which the ratio MgCl2 : KCl is greater than in the double salt.
Throughout its whole course, the curve EMK represents solutions in which the ratio of MgCl2 : KCl is greater than in the double salt. As this is a point of some importance, it will be well, perhaps, to make it clearer by giving one of the isothermal curves, e.g. the curve for 10°, which is represented diagrammatically in Fig. 114. E and F here represent solutions saturated for carnallite plus magnesium chloride hydrate, and for carnallite plus potassium chloride. As is evident, the point F lies above the line representing equimolecular proportions of the salts (OD).
 Fig. 114.
Summary and Numerical Data.—We may now sum up the different systems which can be formed, and give the numerical data from which the model is constructed.[366]
I. Bivariant Systems.
| Solid phase. | Area of existence. |
| Ice | ABDC |
| KCl | CDEMKLNO |
| Carnallite | EFGHJKM |
| MgCl2,12H2O | BF1G1GFED |
| MgCl2,8H2O | G1H1HG |
| MgCl2,6H2O | H1I1IH |
| MgCl2,4H2O | I1L1LKI |
| MgCl2,2H2O | L1N1NL |
II. Univariant Systems.—The different univariant systems have already been described. The course of the curves will be sufficiently indicated if the temperature and composition of the solutions for the different invariant systems are given.
III.—Invariant Systems—Binary and Ternary.
| Point. | Solid Phases. | Temperature. | Composition of solution. Gram- molecules of salt per 1000 gram- mol. water. | |||
| A | Ice | 0° | — | |||
| B | Ice; MgCl2,12H2O | -33.6° | 49.2 MgCl2 | |||
| C | Ice; KCl | -11.1° | 59.4 KCl | |||
| D | Ice; MgCl2,12H2O; KCl | -34.3° | 43 MgCl2; 3 KCl | |||
| E | | MgCl2,12H2O; KCl; carnallite |
| -21° | 66.1 MgCl2; 4.9 KCl | |
| F1 | MgCl2,12H2O | -16.4° | 83.33 MgCl2 | |||
| F | MgCl2,12H2O; carnallite | -16.6° | | Almost same as F1; contains small amount of KCl | ||
| G1 | | MgCl2,12H2O; MgCl2,8H2O |
| -16.8° | 87.5 MgCl2 | |
| G | | MgCl2,12H2O; MgCl2,8H2O; carnallite |
| -16.9° | | Almost same as G1, but contains small quantity of KCl |
| H1 | | MgCl2,8H2O; MgCl2,6H2O |
| -3.4° | 99 MgCl2 | |
| H | | MgCl2,8H2O; MgCl2,6H2O; carnallite |
| ca. -3.4° | | Almost same as H1, but contains small amount of KCl |
| J1 | | MgCl2,6H2O; MgCl2,4H2O |
| 116.67° | 161.8 MgCl2 | |
| J | | MgCl2,6H2O; MgCl2,4H2O; carnallite |
| 115.7° | 162 MgCl2; 4 KCl | |
| K | | MgCl2,4H2O; KCl; carnallite |
| 152.5° | 200 MgCl2; 24 KCl | |
| L1 | | MgCl2,4H2O; MgCl2,2H2O |
| 181° | 238.1 MgCl2 | |
| L | | MgCl2,4H2O; MgCl2,2H2O; KCl |
| 176° | 240 MgCl2; 41 KCl | |
| M | Carnallite; KCl | 167.5° | 166.7 MgCl2; 41.7 KCl | |||
| [N1 | MgCl2,2H2O | 186° | ca. 241 MgCl2] | |||
| N | MgCl2,2H2O; KCl | 186° | 240 MgCl2; 63 KCl | |||
| [O | KCl | 186° | 195.6 KCl] | |||
With the help of the data in the preceding table and of the solid model it will be possible to state in any given case what will be the behaviour of a system composed of magnesium chloride, potassium chloride and water. One or two different cases will be very briefly described; and the reader should have no difficulty in working out the behaviour under other conditions with the help of the model and the numerical data just given. {289}
In the first place it may be again noted that at a temperature above 167.5° (point M) carnallite cannot exist. If, therefore, a solution of magnesium and potassium chlorides is evaporated at a temperature above this point, the result will be a mixture of potassium chloride and either magnesium chloride tetrahydrate or magnesium chloride dihydrate, according as the temperature is below or above 176°. The isothermal curve here consists of only two branches.
Further, reference has already been made to the fact that all points of the carnallite area correspond to solutions in equilibrium with carnallite, but in which the ratio of MgCl2 to KCl is greater than in the double salt. A solution which is saturated with respect to double salt alone will be supersaturated with respect to potassium chloride. At all temperatures, therefore, carnallite is decomposed by water with separation of potassium chloride; hence all solutions obtained by adding excess of carnallite to water will lie on the curve EM. A pure saturated solution of carnallite cannot be obtained.
If an unsaturated solution of the two salts in equimolecular amounts is evaporated, potassium chloride will first be deposited, because the plane bisecting the right angle formed by the X and Y axes cuts the area for that salt. Deposition of potassium chloride will lead to a relative increase in the concentration of magnesium chloride in the solution; and on continued evaporation a point (on the curve EM) will be reached at which carnallite will separate out. So long as the two solid phases are present, the composition of the solution must remain unchanged. Since the separation of carnallite causes a decrease in the relative concentration of the potassium chloride in the solution, the portion of this salt which was deposited at the commencement must redissolve, and carnallite will be left on evaporating to dryness. (Incongruently saturated solution.)
Although carnallite is decomposed by pure water, it will be possible to crystallize it from a solution having a composition represented by any point in the carnallite area. Since during the separation of the double salt the relative amount of magnesium chloride increases, it is most advantageous to {290}commence with a solution the composition of which is represented by a point lying just above the curve EM (cf. p. 281).
From the above description of the behaviour of carnallite in solution, the processes usually employed for obtaining potassium chloride will be readily intelligible.[367]
Ferric Chloride—Hydrogen Chloride—Water.—In the case of another system of three components which we shall now describe, the relationships are considerably more complicated than in those already discussed. They deserve discussion, however, on account of the fact that they exhibit a number of new phenomena.
In the system formed by the three components, ferric chloride, hydrogen chloride, and water, not only can various compounds of ferric chloride and water (p. 152), and of hydrogen chloride and water be formed, each of which possesses a definite melting point, but various ternary compounds are also known. Thus we have the following solid phases:—
| 2FeCl3,12H2O | HCl,3H2O | 2FeCl3,2HCl,12H2O |
| 2FeCl3,7H2O | HCl,2H2O | 2FeCl3,2HCl,8H2O |
| 2FeCl3,5H2O | HCl,H2O | 2FeCl3,2HCl,4H2O |
| 2FeCl3,4H2O | ||
| FeCl3 |
From this it will be readily understood that the complete study of the conditions of temperature and concentration under which solutions can exist, either with one solid phase or with two or three solid phases, are exceedingly complicated; and, as a matter of fact, only a few of the possible equilibria have been investigated. We shall attempt here only a brief description of the most important of these.[368]
If we again employ rectangular co-ordinates for the graphic {291}representation of the results, we have the two planes XOT and YOT (Fig. 115): the concentration of ferric chloride being measured along the X-axis, the concentration of hydrogen chloride along the Y-axis, and the temperature along the T-axis. The curve ABCDEFGHJK is, therefore, the solubility curve of ferric chloride in water (p. 152), and the curve A′B′C′D′E′F′ the solubility curve of hydrogen chloride and its hydrates. B′ and D′ are the melting points of the hydrates HCl,3H2O and HCl,2H2O. In the space between these two planes are represented those systems in which all three components are present. As already stated, only a few of the possible ternary systems have been investigated, and these are represented in Fig. 116. The figure shows the model resting on the XOT-plane, so that the lower edge represents the solubility curve of ferric chloride, the concentration increasing from right to left. The concentration of hydrogen chloride is measured upwards, and the temperature forwards. The further end of the model represents the isothermal surface for -30°. The surface of the model on the left does not correspond with the plane YOT in Fig. 115, but with a parallel plane which cuts the concentration axis for ferric chloride at a point representing 65 gm.-molecules FeCl3 in 100 gm.-molecules of water. The upper surface corresponds with a plane parallel to the axis XOT, at a distance corresponding with the concentration of 50 gm.-molecules HCl in 100 gm.-molecules of water.
 Fig. 115.
Ternary Systems.—We pass over the binary system FeCl3—H2O, which has already been discussed (p. 152), and the similar system HCl—H2O (see Fig. 115), and turn to the discussion of some of the ternary systems represented by {292}points on the surface of the model between the planes XOT and YOT. As in the case of carnallite, a plane represents the conditions of concentration of solution and temperature under which a ternary solution can be in equilibrium with a single solid phase (bivariant systems), a line represents the conditions for the coexistence of a solution with two solid phases (univariant systems), and a point the conditions for equilibrium with three solid phases (invariant systems).
 Fig. 116.
In the case of a binary system, in which 2FeCl3,12H2O is in equilibrium with a solution of the same composition, addition of hydrogen chloride must evidently lower the temperature at which equilibrium can exist; and the same holds, of course, {293}for all other binary solutions in equilibrium with this solid phase. In this way we obtain the surface I., which represents the temperatures and concentrations of solutions in which 2FeCl3,12H2O can be in equilibrium with a ternary solution containing ferric chloride, hydrogen chloride, and water. This surface is analogous to the curved surface K1K2k4k3 in Fig. 97 (p. 256). Similarly, the surfaces II., III., IV., and V. represent the conditions for equilibrium between the solid phases 2FeCl3,7H2O; 2FeCl3,5H2O; 2FeCl3,4H2O; FeCl3 and ternary solutions respectively. The lines CL, EM, GN, and IO on the model represent univariant systems in which a ternary solution is in equilibrium with two solid phases, viz. with those represented by the adjoining fields. These lines correspond with the ternary eutectic curves k3K1 and k4K2 in Fig. 97. Besides the surfaces already mentioned, there are still three others, VI., VII., and VIII., which also represent the conditions for equilibrium between one solid phase and a ternary solution; but in these cases, the solid phase is not a binary compound or an anhydrous salt, but a ternary compound containing all three components. The solid phases which are in equilibrium with the ternary solutions represented by the surfaces VI., VII., and VIII., are 2FeCl3,2HCl,4H2O; 2FeCl3,2HCl,8H2O; and 2FeCl3,2HCl,12H2O respectively.
The model for FeCl3—HCl—H2O exhibits certain other peculiarities not found in the case of MgCl2—KCl—H2O. On examining the model more closely, it is found that the field of the ternary compound 2FeCl3,2HCl,8H2O (VII.) resembles the surface of a sugar cone, and has a projecting point, the end of which corresponds with a higher temperature than does any other point of the surface. At the point of maximum temperature the composition of the liquid phase is the same as that of the solid. This point, therefore, represents the melting point of the double salt of the above composition.
The curves representing univariant systems are of two kinds. In the one case, the two solid phases present are both binary compounds; or one is a binary compound and the other is one of the components. In the other case, either one or both solid phases are ternary compounds. Curves belonging {294}to the former class (so-called border curves) start from binary eutectic points, and their course is always towards lower temperatures, e.g. CL, EM, GN, IO. Curves belonging to the latter class (so-called medial curves) would, in a triangular diagram, lie entirely within the triangle. Such curves are YV, WV, VL, LM, MV, NS, ST, SO, OZ. These curves do not always run from higher to lower temperatures, but may even exhibit a point of maximum temperature. Such maxima are found, for example, at U (Fig. 116), and also on the curves ST and LV.
Finally, whereas all the other ternary univariant curves run in valleys between the adjoining surfaces, we find at the point X a similar appearance to that found in the case of carnallite, as the univariant curve here rises above the surrounding surface. The point X, therefore, does not correspond with a eutectic point, but with a transition point. At this point the ternary compound 2FeCl3,2HCl,12H2O melts with separation of 2FeCl3,12H2O, just as carnallite melts at 168° with separation of potassium chloride.
The Isothermal Curves.—A deeper insight into the behaviour of the system FeCl3—HCl—H2O is obtained from a study of the isothermal curves, the complete series of which, so far as they have been studied, is given in Fig. 117.[369] In this figure the lightly drawn curves represent isothermal solubility curves, the particular temperature being printed beside the curve.[370] The dark lines give the composition of the univariant systems at different temperatures. The point of intersection of a dark with a light curve gives the composition of the univariant solution at the temperature represented by the light curve; and the point of intersection of two dark lines gives the composition of the invariant solution in equilibrium with three solid phases. The dotted lines represent metastable systems, and the points P, Q, and R represent solutions of {295}the composition of the ternary salts, 2FeCl3,2HCl,4H2O; 2FeCl3,2HCl,8H2O; and 2FeCl3,2HCl,12H2O.
 Fig. 117.
The farther end of the model (Fig. 116) corresponds, as already mentioned, to the temperature -30°, so that the outline evidently represents the isothermal curve for that temperature. Fig. 117 does not show this. We can, however, follow the isothermal for -20°, which is the extreme curve on the right in Fig. 117. Point A represents the solubility of 2FeCl3,12H2O in water. If hydrogen chloride is added, the concentration of ferric chloride in the solution first decreases and then increases, until at point 34 the ternary double salt 2FeCl3,2HCl,12H2O is formed. If the addition of hydrogen chloride is continued, the ferric chloride disappears ultimately, and only the ternary double salt remains. This salt can coexist with solutions of the composition represented by the curve which passes through the points 173, 174, 175. At the last-mentioned point, the ternary salt with 8H2O is formed. The composition of the solutions with which this salt is in equilibrium at -20° is represented by the curve which passes through a point of maximal concentration with respect to HCl, and cuts the curve SN at the point 112, at which the solution is in equilibrium with the two solid phases 2FeCl3,4H2O and 2FeCl3,2HCl,8H2O. The succeeding portion of the isotherm represents the solubility curve at -20° of 2FeCl3,4H2O, which cuts the dark line OS at point 113, at which the solution is in equilibrium with the two solid phases 2FeCl3,4H2O and 2FeCl3,2HCl,4H2O. Thereafter comes the solubility curve of the latter compound.
The other isothermal curves can be followed in a similar manner. If the temperature is raised, the region of existence of the ternary double salts becomes smaller and smaller, and at temperatures above 30° the ternary salts with 12H2O and 8H2O are no longer capable of existing. If the temperature is raised above 46°, only the binary compounds of ferric chloride and water and the anhydrous salt can exist as solid phases. The isothermal curve for 0° represents the solubility curve for 2FeCl3,12H2O; 2FeCl3,7H2O; 2FeCl3,5H2O; and 2FeCl3,4H2O. {296}
Finally, in the case of the system FeCl3—HCl—H2O, we find closed isothermal curves. Since, as already stated, the salt 2FeCl3,2HCl,8H2O has a definite melting point, the temperature of which is therefore higher than that at which this compound is in equilibrium with solutions of other composition, it follows that the line of intersection of an isothermal plane corresponding with a temperature immediately below the melting point of the salt with the cone-shaped surface of its region of existence, will form a closed curve. This is shown by the isotherm for -4.5°, which surrounds the point Q, the melting point of the ternary salt.
The following table gives some of the numerical data from which the curves and the model have been constructed:—
| Point. | Solid Phases. | Temperature. | Composition of the solution in gm.-mols. salt to 100 gm.-mols. water. | |||
| HCl | FeCl3 | |||||
| A | 2FeCl3,12H2O | -20° | — | 6.56 | ||
| C | 2FeCl3,12H2O; 2FeCl3,7H2O | 27.4° | — | 24.30 | ||
| E | 2FeCl3,7H2O; 2FeCl3,5H2O | 30° | — | 30.24 | ||
| G | 2FeCl3,5H2O; 2FeCl3,4H2O | 55° | — | 40.64 | ||
| J | 2FeCl3,4H2O; FeCl3 | 66° | — | 58.40 | ||
| L | | 2FeCl3,12H2O; 2FeCl3,7H2O; 2FeCl3,2HCl,8H2O |
| -7.5° | 19.22 | 23.72 |
| M | | 2FeCl3,7H2O; 2FeCl3,5H2O; 2FeCl3,2HCl,8H2O |
| -7.3° | 23.08 | 28.55 |
| N | | 2FeCl3,5H2O; 2FeCl3,4H2O; 2FeCl3,2HCl,8H2O |
| -16° | 28.40 | 31.89 |
| S | | 2FeCl3,4H2O; 2FeCl3,2HCl,8H2O; 2FeCl3,2HCl,4H2O |
| -27.5° | 32.33 | 34.21 |
| O | | 2FeCl3,4H2O; FeCl3; 2FeCl3,2HCl,4H2O |
| 29° | 33.71 | 49.84 |
| U | | 2FeCl3,7H2O; 2FeCl3,2HCl,8H2O |
| -4.5° | 20.66 | 25.74 |
| V | | 2FeCl3,12H2O; 2FeCl3,2HCl,12H2O; 2FeCl3,2HCl,8H2O |
| -13° | 22.40 | 18.00 |
| X | | 2FeCl3,12H2O; 2FeCl3,2HCl,12H2O |
| -12.5° | 22.14 | 16.69 |
| Q | 2FeCl3,2HCl,8H2O | -3° (melting point) | ||||
Basic Salts.—Another class of systems in the study of {297}which the Phase Rule has performed exceptional service, is that of the basic salts. In many cases it is impossible, by the ordinary methods of analysis, to decide whether one is dealing with a definite chemical individual or with a mixture. The question whether a solid phase is a chemical individual can, however, be answered, in most cases, with the help of the principles which we have already learnt. Let us consider, for example, the formation of basic salts from bismuth nitrate, and water. In this case we can choose as components Bi2O3, N2O5, and H2O; since all the systems consist of these in varying amounts. If we are dealing with a condition of equilibrium at constant temperature between liquid and solid phases, three cases can be distinguished,[371] viz.—
1. The solutions in different experiments have the same composition, but the composition of the precipitate alters. In this case there must be two solid phases.
2. The solutions in different experiments can have varying composition, while the composition of the precipitate remains unchanged. In this case only one solid phase exists, a definite compound.
3. The composition both of the solution and of the precipitate varies. In this case the solid phase is a solid solution or a mixed crystal.
In order, therefore, to decide what is the nature of a precipitate produced by the hydrolysis of a normal salt, it is only necessary to ascertain whether and how the composition of the precipitate alters with alteration in the composition of the solution. If the composition of the solution is represented by abscissæ, and the composition of the precipitate by ordinates, the form of the curves obtained would enable us to answer our question; for vertical lines would indicate the presence of two solid phases (1st case), horizontal lines the presence of only one solid phase (2nd case), and slanting lines the presence of mixed crystals (3rd case). This method of representation cannot, however, be carried out in most cases. It is, however, {298}generally possible to find one pair or several pairs of components, the relative amounts of which in the solution or in the precipitate undergo change when, and only when, the composition of the solution or of the precipitate changes. Thus, in the case of bismuth, nitrate, and water, we can represent the ratio of Bi2O3 : N2O5 in the precipitate as ordinates, and N2O5 : H2O in the solution as abscissæ. A horizontal line then indicates a single solid phase, and a vertical line two solid phases. An example of this is given in Fig. 118.[372]
 Fig. 118.
Bi2O3—N2O5—H2O.—Although various systems have been studied in which there is formation of basic salts,[373] we shall content ourselves here with the description of some of the conditions for the formation of basic salts of bismuth nitrate, and for their equilibrium in contact with solutions.[374]
Three normal salts of bismuth oxide and nitric acid are known, viz. Bi2O3,3N2O5,10H2O(S10); Bi2O3,3N2O5,4H2O(S4); and Bi2O3,3N2O5,3H2O(S3). Besides these normal salts, there are the following basic salts:—
| Bi2O3,N2O5,2H2O | (represented by B1-1-2) |
| Bi2O3,N2O5,H2O | ( ,, ,, B1-1-1) |
| 6Bi2O3,5N2O5,9H2O | ( ,, ,, B6-5-9) |
| 2Bi2O3,N2O5,H2O | ( ,, ,, B2-1-1) |
Probably some others also exist. The problem now is to find the conditions under which these different normal and basic salts can be in equilibrium with solutions of varying concentration of the three components. Having determined the equilibrium conditions for the different salts, it is then possible to construct a model similar to that for MgCl2—KCl—H2O or for FeCl3—HCl—H2O, from which it will be possible to determine the limits of stability of the different salts, and to predict what will occur when we bring the salts in contact with solutions of nitric acid of different concentrations and at different temperatures.
For our present purpose it is sufficient to pick out only some of the equilibria which have been studied, and which are represented in the model (Fig. 119). In this case use has been made of the triangular method of representation, so that the surface of the model lies within the prism.
 Fig. 119.
This model shows the three surfaces, A, B, and C, which represent the conditions for the stable existence of the salts B1-1-1, S10, and S3 in contact with solution at different {300}temperatures. The front surface of the model represents the temperature 9°, and the farther end the temperature 75.5°. The dotted curve represents the isotherm for 20°. The prominences between the surfaces represent, of course, solutions which are saturated in respect of two solid phases. Thus, for example, pabc represents solutions in equilibrium with B1-1-1 and S10; and the ridge qdc, solutions in equilibrium with S10 and S3. The point b, which lies at 75.5°, is the point of maximum temperature for S10. If the temperature is raised above this point, S10 decomposes into the basic salt B1-1-1 and solution. This point is therefore analogous to the point M in the carnallite model, at which this salt decomposes into potassium chloride and solution (p. 284); or to the point at which the salt 2FeCl3,2HCl,12H2O decomposes into 2FeCl3,12H2O and solution (p. 294). The curve pab has been followed to the temperature of 72° (point c). The end of the model is incomplete, but it is probable that in the neighbourhood of the point c there exists a quintuple point at which the basic salt B1-2-2 appears. In the neighbourhood of e also there probably exists another quintuple point at which S4 is formed. These systems have, however, not been studied.
The following tables give some of the numerical data:—
Isotherm for 20°.
| Solid Phase. | Composition of the solution. Gram-mols. in 1000 gm.-mols. of water. | |
| Bi2O3 | N2O5 | |
| B1-1-1 | 10.50 | 38.65 |
| — | 27.20 | 83.84 |
| B1-1-1; S10 | 30.15 | 97.97 |
| S10 | 29.70 | 96.57 |
| — | 19.65 | 98.76 |
| — | 10.51 | 162.58 |
| — | 33.51 | 355.87 |
| S10; S3 | 51.00 | 403.0 |
| S3 | 14.35 | 492.0 |
| — | 7.45 | 592.9 |
Systems in Equilibrium with B1-1-1 and S10 (Curve pabc).
| Solid Phase. | Composition of the solution. Gram-mols. in 1000 gm.-mols. of water. | |
| Bi2O3 | N2O5 | |
| 9° | 26.7 | 88.2 |
| 20° (point a) | 30.15 | 97.97 |
| 30° | 33.6 | 112.3 |
| 50° | 41.8 | 148.4 |
| 65° | 57.21 | 190.8 |
| 75.5° (point b) | 87.9 | 288.4 |
| 72° (point c) | 96.0 | 327.0 |
Systems in Equilibrium with S10 and S3 (Curve qde).
| Solid Phase. | Composition of the solution. Gram-mols. in 1000 gm.-mols. of water. | |
| Bi2O3 | N2O5 | |
| 11.5° | 44.5 | 396 |
| 20° | 51.0 | 405.4 |
| 50° | 66.5 | 444.2 |
| 65° | 80.0 | 454.4 |
Basic Mercury Salts.—The Phase Rule has also been applied by A. J. Cox[375] in an investigation of the basic salts of mercury, the result of which has been to show that, of the salts mentioned in text-books, quite a number are incorrectly stated to be chemical compounds or chemical individuals (p. 92). The investigation, which was carried out essentially in the manner described above, included the salts mentioned in the following table; and of the basic salts said to be derived from them, only those mentioned really exist. In the following table, the numbers in the second column give the minimum values of the concentration of the acid, expressed in equivalent normality, necessary for the existence of the {302}corresponding salts in contact with solution at the temperature given in the third column:—
| Salt. | Normality of acid. | Temperature. |
| HgCrO4 | 1.41 | 50° |
| 3HgO.CrO3 | 2.6 × 10⁻⁴ | 50° |
| Hg(NO3)2.H2O | 18.72 | 25° |
| 3HgO.N2O5 | 0.159 | 25° |
| HgSO4 | 6.87 | 25° |
| 3HgO.SO3 | 1.3 × 10⁻³ | 25° |
| HgF2 | 1.14 | 25° |
| HgNO3.H2O | 2.95 | 25° |
| 5Hg2O.3N2O5.2H2O | ca. 0.293 | 25° |
| 2Hg2O.N2O5(?) | 0.110 | 25° |
| 3Hg2O.N2O5.2H2O(?) | 1.7 × 10⁻³ | 25° |
| Hg2SO4 | 4.2 × 10⁻³ | 25° |
| 2Hg2O.SO3.H2O | 5.6 × 10⁻⁴ | 25° |
Mercuric fluoride does not form any basic salt.
Since two succeeding members of a series can coexist only in contact with a solution of definite concentration, we can prepare acid solutions of definite concentration by bringing an excess of two such salts in contact with water.
Indirect Determination of the Composition of the Solid Phase.—It has already been shown (p. 228) how the composition of the solid phase in a system of two components can be determined without analysis, and we shall now describe how this can be done in a system of three components.[376]
We shall assume that we are dealing with the aqueous solution of two salts which can give rise to a double salt, in which case we can represent the solubility relations in a system of rectangular co-ordinates. In this case we should obtain, as before (Fig. 120), the isotherm adcb, if we express the {303}composition of the solution in gram-molecules of A or of B to 100 gram-molecules of water.
 Fig. 120.
Let us suppose, now, that the double salt is in equilibrium with the solution at a definite temperature, and that the composition of the solution is represented by the point e. The greater part of the solution is now separated from the solid phase, and the latter, together with the adhering mother liquor, is analyzed. The composition (expressed, as before, in gram-molecules of A and B to 100 gram molecules of water) will be represented by a point (e.g. f) on the line eS, where S represents the composition of the double salt. That this is so will be evident when one considers that the composition of the whole mass must lie between the composition of the solution and that of the double salt, no matter what the relative amounts of the solid phase and the mother liquor.
If, in a similar manner, we analyze a solution of a different composition in equilibrium with the same double salt (not necessarily at the same temperature as before), and also the mixture of solid phase and solution, we shall obtain two other points, as, for example, g and h, and the line joining these must likewise pass through S. The method of finding the {304}composition of an unknown double salt consists, therefore, in finding, in the manner just described, the position of two lines such as ef and gh. The point of intersection of these lines then gives the composition of the double salt.
If the double salt is anhydrous, the point S lies at infinity, and the lines ef and gh are parallel to each other.
The same result is arrived at by means of the triangular method of representation.[377] If we start with the three components in known amounts, and represent the initial composition of the whole by a point in the triangle, and then ascertain the final composition of the solution in equilibrium with the solid phase at a definite temperature, the line joining the points representing the initial and end concentration passes through the point representing the composition of the solid phase. If two determinations are made with solutions having different initial and final concentrations in equilibrium with the same solid phase, then the point of intersection of the two lines so obtained gives the composition of the solid phase.
ABSENCE OF A LIQUID PHASE
In the preceding chapters dealing with equilibria in three-component systems, our attention was directed only to those cases in which liquid solutions formed one or more phases. Mention must, however, be made of certain systems which contain no liquid phase, and in which only solids and gases are in equilibrium. Since, in all cases, there can be but one gas phase, four solid phases will be necessary in order to form an invariant system. When only three solid phases are present, the system is univariant; and when only two solid phases coexist with gas, it is bivariant. If, however, we make the restriction that the gas pressure is constant, we diminish the variability by one.
On account of their great industrial importance, we shall describe briefly some of the systems belonging to this class.
Iron, Carbon Monoxide, Carbon Dioxide.—Some of the most important systems of three components in which equilibrium exists between solid and gas phases are those formed by the three components—iron, carbon monoxide, and carbon dioxide—and they are of importance especially for the study of the processes occurring in the blast furnace.
If carbon monoxide is passed over reduced iron powder at a temperature of about 600°, the iron is oxidized and the carbon monoxide reduced with separation of carbon in accordance with the equation
Fe + CO = FeO + C
This reaction is succeeded by the two reactions
FeO + CO = Fe + CO2
CO2 + C = 2CO
 Fig. 121.
The former of these reactions is not complete, but leads to a definite equilibrium. The result of the different reactions is therefore an equilibrium between the three solid phases, carbon, iron, and ferrous oxide, and the gas phase consisting of carbon monoxide and dioxide. We have here four phases; and if the total pressure is maintained constant, equilibrium can occur only at a definite temperature.
Since, under certain conditions, we can also have the reaction
Fe3O4 + CO = 3FeO + CO2
a second series of equilibria can be obtained of a character similar to the former. These various equilibria have been investigated by Baur and Glaessner,[378] and the following is a short account of the results of their work.
Mixtures of the solid phases in equilibrium with carbon monoxide and dioxide were heated in a porcelain tube at a definite temperature until equilibrium was produced, and the gas was then pumped off and analyzed. The results which were obtained are given in the following tables, and represented graphically in Fig. 121.
Solid Phases: Fe3O4; FeO.
| No. | Tube filled with | Duration of the experiment in hours. | Temperature. | Percentage of | |
| CO2 | CO | ||||
| 1 | CO | 14 | 600° | 59.3 | 40.7 |
| 2 | CO | 15 | 590° | 54.7 | 45.3 |
| 3 | CO2 | 16 | 590° | 64.6 | 35.4 |
| 4 | CO | 24 | 590° | 58.4 | 41.6 |
| 5 | CO | 22 | 730° | 67.7 | 32.3 |
| 6 | CO2 | 22 | 730° | 86.1 | 31.9 |
| 7 | CO | 22 | 750° | 68.4 | 31.6 |
| 8 | CO2 | 22 | 610° | 64.9 | 35.1 |
| 9 | CO | 23 | 420° | 56.0 | 44.0 |
| 10 | CO | 47 | 350° | 65.6 | 34.4 |
| 11 | CO2 | 46 | 350° | 72.8 | 27.2 |
| 12 | CO | 53 | 350° | 64.0 | 36.0 |
| 13 | CO | 18 | 570° | 53.4 | 46.6 |
| 14 | CO | 19 | 680° | 60.5 | 39.5 |
| 15 | CO2 | 24 | 540° | 55.5 | 44.5 |
| 16 | CO | 21 | 630° | 57.5 | 42.5 |
| 17 | CO2 | 17 | 690° | 65.5 | 34.5 |
| 18 | CO2 | 17 | 670° | 67.0 | 33.0 |
| 19 | CO2 | 24 | 410° | 58.5 | 41.5 |
| 20 | CO | 24 | 490° | 51.7 | 48.8 |
| 21 | CO2 | 23 | 590° | 54.4 | 45.6 |
| 22 | CO2 | 4 | 950° | 77.0 | 23.0 |
| 23 | CO2 | 15 | 850° | 73.4 | 26.6 |
| 24 | CO | 8 | 800° | 71.2 | 28.8 |
| 25 | CO2 | 24 | 540° | 56.7 | 43.3 |
Solid Phases: FeO; Fe.
| No. | Tube filled with | Duration of the experiment in hours. | Temperature. | Percentage of | |
| CO2 | CO | ||||
| I. | CO | 15 | 800° | 35.2 | 64.8 |
| II. | CO | 18 | 530° | 29.1 | 70.9 |
| III. | CO | 13 | 880° | 30.2 | 69.6 |
| IV. | CO2 | 24 | 870° | 32.3 | 67.7 |
| V. | CO | 18 | 760° | 36.9 | 63.1 |
| VI. | CO2 | 16 | 820° | 34.7 | 65.3 |
| VII. | CO2 | 18 | 730° | 41.1 | 58.9 |
| VIII. | CO | 18 | 630° | 34.9 | 65.1 |
| IX. | CO2 | 17 | 630° | 61.6 | 58.4 |
| X. | CO | 18 | 540° | 25.0 | 75.0 |
| XI. | CO2 | 25 | 540° | 36.5 | 63.5 |
As is evident from the above tables and from the curves in Fig. 121, the curve of equilibrium in the case of the reaction
Fe3O4 + CO = 3FeO + CO2
exhibits a maximum for the ratio CO : CO2, at 490°, while, for the reaction
FeO + CO = Fe + CO2
this ratio has a minimum value at 680°. From these curves can be derived the conditions under which the different solid phases can exist in contact with gas. Thus, for example, at a temperature of 690°, FeO and Fe3O4 can coexist with a mixture of 65.5 per cent. of CO2 and 34.5 per cent. of CO. If the partial pressure of CO2 is increased, there occurs the reaction
3FeO + CO2 = Fe3O4 + CO
and if carbon dioxide is added in sufficient amount, the ferrous oxide finally disappears completely. If, on the other hand, the partial pressure of CO is increased, there occurs the reaction
Fe3O4 + CO = 3FeO + CO2
and all the ferric oxide can be made to disappear. We see, therefore, that Fe3O4 can only exist at temperatures and in {309}contact with mixtures of carbon monoxide and dioxide, represented by the area which lies below the under curve in Fig. 121. Similarly, the region of existence of FeO is that represented by the area between the two curves; while metallic iron can exist under the conditions of temperature and composition of gas phase represented by the area above the upper curve in Fig. 121. If, therefore, ferric oxide or metallic iron is heated for a sufficiently long time at temperatures above 700° (to the right of the dotted line; vide infra), complete transformation to ferrous oxide finally occurs.
In another series of equilibria which can be obtained, carbon is one of the solid phases. In Fig. 121 the equilibria between carbon, carbon monoxide, and carbon dioxide under pressures of one and of a quarter atmosphere, are represented by dotted lines.[379]
If we consider only the dotted line on the right, representing the equilibria under atmospheric pressure, we see that the points in which the dotted line cuts the other two curves must represent systems in which carbon monoxide and carbon dioxide are in equilibrium with FeO + Fe3O4 + C, on the one hand, and with Fe + FeO + C on the other. These systems can only exist at one definite temperature, if we make the restriction that the pressure is maintained constant (atmospheric pressure). Starting, therefore, with the equilibrium FeO + Fe3O4 + CO + CO2 at a temperature of about 670°, and then add carbon to the system, the reaction
C + CO2 = 2CO
will occur, because the concentration of CO2 is greater than what corresponds with the system FeO + Fe3O4 + C in equilibrium with carbon monoxide and dioxide. In consequence of this reaction, the equilibrium between FeO + Fe3O4 and the gas phase is disturbed, and the change in the composition of the gas phase is opposed by the reaction Fe3O4 + CO = 3FeO + CO2, which continues until either all the carbon {310}or all the ferric oxide is used up. If the ferric oxide first disappears, the equilibrium corresponds with a point on the dotted line in the middle area of Fig. 121, which represents equilibria between FeO + C as solid phases, and a mixture of carbon monoxide and dioxide as gas phase. If the temperature is higher than 685°, at which temperature the curve for C—CO—CO2 cuts that for Fe—FeO—CO—CO2; then, when all the ferric oxide has disappeared, the concentration of CO2 is still too great for the coexistence of FeO and C. Consequently, there occurs the reaction C + CO2 = 2CO, and the composition of the gas phase alters until a point on the upper curve is reached. A further increase in the concentration of CO is opposed by the reaction FeO + CO = Fe + CO2, and the pressure remains constant until all the ferrous oxide is reduced and only iron and carbon remain in equilibrium with gas. If the quantities of the substances have been rightly chosen, we ultimately reach a point on the dotted curve in the upper part of Fig. 121.
Fig. 121 shows us, also, what are the conditions under which the reduction of ferric to ferrous oxide by carbon can occur. Let us suppose, for example, that we start with a mixture of carbon monoxide and dioxide at about 600° (the lowest point on the dotted line), and maintain the total pressure constant and equal to one atmosphere. If the temperature is increased, the concentration of the carbon dioxide will diminish, owing to the reaction C + CO2 = 2CO, but the ferric oxide will undergo no change until the temperature reaches 647°, the point of intersection of the dotted curve with the curve for FeO and Fe3O4. At this point further increase in the concentration of carbon monoxide is opposed by the reduction of ferric oxide in accordance with the equation Fe3O4 + CO = 3FeO + CO2. The pressure, therefore, remains constant until all the ferric oxide has disappeared. If the temperature is still further raised, we again obtain a univariant system, FeO + C, in equilibrium with gas (univariant because the total pressure is constant); and if the temperature is raised the composition of the gas must undergo change. This is effected by the reaction C + CO2 = 2CO. When the {311}temperature rises to 685°, at which the dotted curve cuts the curve for Fe—FeO, further change is prevented by the reaction FeO + CO = Fe + CO2. When all the ferrous oxide is used up, we obtain the system Fe + C in equilibrium with gas. If the temperature is now raised, the composition of the gas undergoes change, as shown by the dotted line. The two temperatures, 647° and 685°, give, evidently, the limits within which ferric or ferrous oxide can be reduced directly by carbon.
It is further evident that at any temperature to the right of the dotted line, carbon is unstable in presence of iron or its oxides; while at temperatures lower than those represented by the dotted line, it is stable. In the blast furnace, therefore, separation of carbon can occur only at lower temperatures, and the carbon must disappear on raising the temperature.
Finally, it may be remarked that the equilibrium curves show that ferrous oxide is most easily reduced at 680°, since the concentration of the carbon monoxide required at this temperature is a minimum. On the other hand, ferric oxide is reduced with greatest difficulty at 490°, since at this temperature the requisite concentration of carbon monoxide is a maximum.
Other equilibria between solid and gas phases are: Equilibrium between iron, ferric oxide, water vapour, and hydrogen,[380] and the equilibria between carbon, carbon monoxide, carbon dioxide, water vapour, and hydrogen,[381] which is of importance for the manufacture of water gas.
SYSTEMS OF FOUR COMPONENTS
In the systems which have so far been studied, we have met with cases where two or three components could enter into combination; but in no case did we find double decomposition occurring. The reason of this is that in the systems previously studied, in which double decomposition might have been possible, namely in those systems in which two salts acted as components, the restriction was imposed that either the basic or the acid constituent of these salts must be the same; a restriction imposed, indeed, for the very purpose of excluding double decomposition. Now, however, we shall allow this restriction to fall, thereby extending the range of study.
Hitherto, in connection with four-component systems, the attention has been directed solely to the study of aqueous solutions of salts, and more especially of the salts which occur in sea-water, i.e. chiefly, the sulphates and chlorides of magnesium, potassium, and sodium. The importance of these investigations will be recognized when one recollects that by the evaporation of sea-water there have been formed the enormous salt-beds at Stassfurt, which constitute at present the chief source of the sulphates and chlorides of magnesium and potassium. The investigations, therefore, are not only of great geological interest as tending to elucidate the conditions under which these salt-beds have been formed, but are of no less importance for the industrial working of the deposits.
It is, however, not the intention to enter here into any detailed description of the different systems which have so far been studied, and of the sometimes very complex relationships {313}met with, but merely to refer briefly to some points of more general import in connection with these systems.[382]
Reciprocal Salt-Pairs. Choice of Components.—When two salts undergo double decomposition, the interaction can be expressed by an equation such as
NH4Cl + NaNO3 = NaCl + NH4NO3
Since one pair of salts—NaCl + NH4NO3—is formed from the other pair—NH4Cl + NaNO3—by double decomposition, the two pairs of salts are known as reciprocal salt-pairs.[383] It is with systems in which the component salts form reciprocal salt-pairs that we have to deal here.
It must be noted, however, that the four salts formed by two reciprocal salt-pairs do not constitute a system of four, but only of three components. This will be understood if it is recalled that only so many constituents are taken as components as are necessary to express the composition of all the phases present (p. 12). It will be seen, now, that the composition of each of the four salts which can be present together can be expressed in terms of three of them. Thus, for example, in the case of NH4Cl, NaNO3, NH4NO3, NaCl, we can express the composition of NH4Cl by NH4NO3 + NaCl - NaNO3; or of NaNO3 by NH4NO3 + NaCl - NH4Cl. In all these cases it will be seen that negative quantities of one of the components must be employed; but that we have seen to be quite permissible (p. 12). The number of components is, therefore, three; but any three of the four salts can be chosen.
Since, then, two reciprocal salt-pairs constitute only three {314}components or independently variable constituents, another component is necessary in order to obtain a four-component system. As such, we shall choose water.
Transition Point.—In the case of the formation of double salts from two single salts, we saw that there was a point—the quintuple point—at which five phases could coexist. This point we also saw to be a transition point, on one side of which the double salt, on the other side the two single salts in contact with solution, were found to be the stable system. A similar behaviour is found in the case of reciprocal salt-pairs. The four-component system, two reciprocal salt-pairs and water, can give rise to an invariant system in which the six phases, four salts, solution, vapour, can coexist; the temperature at which this is possible constitutes a sextuple point. Now, this sextuple point is also a transition point, on the one side of which the one salt-pair, on the other side the reciprocal salt-pair, is stable in contact with solution.
The sextuple point is the point of intersection of the curves of six univariant systems, viz. four solubility curves with three solid phases each, a vapour-pressure curve for the system: two reciprocal salt-pairs—vapour; and a transition curve for the condensed system: two reciprocal salt-pairs—solution. If we omit the vapour phase and work under atmospheric pressure (in open vessels), we find that the transition point is the point of intersection of four solubility curves.
Just as in the case of three-component systems we saw that the presence of one of the single salts along with the double salt was necessary in order to give a univariant system, so in the four-component systems the presence of a third salt is necessary as solid phase along with one of the salt-pairs. In the case of the reciprocal salt-pairs mentioned above, the transition point would be the point of intersection of the solubility curves of the systems with the following groups of salts as solid phases: Below the transition point: NH4Cl + NaNO3 + NaCl; NH4Cl + NaNO3 + NH4NO3; above the transition point: NaCl + NH4NO3 + NaNO3; NaCl + NH4NO3 + NH4Cl. From this we see that the two salts NH4Cl and NaNO3 would be able to exist together with solution below the transition point, but not above it. This transition point has not been determined. {315}
Formation of Double Salts.—In all cases of four-component systems so far studied, the transition points have not been points at which one salt-pair passed into its reciprocal, but at which a double salt was formed. Thus, at 4.4° Glauber's salt and potassium chloride form glaserite and sodium chloride, according to the equation
2Na2SO4,10H2O + 3KCl = K3Na(SO4)2 + 3NaCl + 20H2O
Above the transition point, therefore, there would be K3Na(SO4)2, NaCl and KCl; and it may be considered that at a higher temperature the double salt would interact with the potassium chloride according to the equation
K3Na(SO4)2 + KCl = 2K2SO4 + NaCl
thus giving the reciprocal of the original salt-pair. This point has, however, not been experimentally realized.[384]
Transition Interval.—A double salt, we learned (p. 277), when brought in contact with water at the transition point undergoes partial decomposition with separation of one of the constituent salts; and only after a certain range of temperature (transition interval) has been passed, can a pure saturated solution be obtained. A similar behaviour is also found in the case of reciprocal salt-pairs. If one of the salt-pairs is brought in contact with water at the transition point, interaction will occur and one of the salts of the reciprocal salt-pair will be deposited; and this will be the case throughout a certain range of temperature, after which it will be possible to prepare a solution saturated only for the one salt-pair. In the case of ammonium chloride and sodium nitrate the lower limit of the transition interval is 5.5°, so that above this temperature and up to that of the transition point (unknown), ammonium chloride and sodium nitrate in contact with water would give rise to a third salt by double decomposition, in this case to sodium chloride.[385]
Graphic Representation.—For the graphic representation of systems of four components, four axes may be chosen intersecting at a point like the edges of a regular octahedron (Fig. 122).[386] Along these different axes the equivalent molecular amounts of the different salts are measured.
 Fig. 123.
 Fig. 122.
To represent a given system consisting of xB, yC, and zD in a given amount of water (where B, C, and D represent equivalent molecular amounts of the salts), measure off on OB and OC lengths equal to x and y respectively. The point of intersection a (Fig. 122) represents a solution containing xB and yC (ab = x; ac = y). From a a line aP is drawn parallel to OD and equal to z. P then represents the solution of the above composition.
It is usual, however, not to employ the three-dimensional figure, but its horizontal and vertical projections. Fig. 122, if projected on the base of the octahedron, would yield a diagram such as is shown in Fig. 123. The projection of the edges of the octahedron form two axes at right angles and give rise to four quadrants similar to those employed for the representation of ternary solutions (p. 273). Here, the point a represents a ternary solution saturated with respect to B and C; and aP, quaternary solutions in equilibrium with the same two salts as solid phases. Such a diagram represents the conditions of equilibrium only for one definite temperature, and corresponds, therefore, to the isothermal diagrams for ternary systems (p. 273). In such a diagram, since the temperature and {317}pressure are constant (vessels open to the air), a surface will represent a solution in equilibrium with only one solid phase; a line, a solution with two solid phases, and a point, one in equilibrium with three solid phases.
 Fig. 124.
Example.—As an example of the complete isothermal diagram, there may be given one representing the equilibria in the system composed of water and the reciprocal salt-pair sodium sulphate—potassium chloride for the temperature 0° (Fig. 124).[387] The amounts of the different salts are measured along the four axes, and the composition of the solution is {318}expressed in equivalent gram-molecules per 1000 gram-molecules of water.[388]
The outline of this figure represents four ternary solutions in which the component salts have a common acid or basic constituent; viz. sodium chloride—sodium sulphate, sodium sulphate—potassium sulphate, potassium sulphate—potassium chloride, potassium chloride—sodium chloride. These four sets of curves are therefore similar to those discussed in the previous chapter. In the case of sodium and potassium sulphate, a double salt, glaserite [K3Na(SO4)2] is formed. Whether glaserite is really a definite compound or not is still a matter of doubt, since isomorphic mixtures of Na2SO4 and K2SO4 have been obtained. According to van't Hoff and Barscholl,[389] glaserite is an isomorphous mixture; but Gossner[390] considers it to be a definite compound having the formula K3Na(SO4)2. Points VIII. and IX. represent solutions saturated with respect to glaserite and sodium sulphate, and glaserite and potassium sulphate respectively.
The lines which pass inwards from these boundary curves represent solutions containing three salts, but in contact with only two solid phases; and the points where three lines meet, or where three fields meet, represent solutions in equilibrium with three solid phases; with the phases, namely, belonging to the three concurrent fields.
If it is desired to represent a solution containing the salts say in the proportions, 51Na2Cl2, 9.5K2Cl2, 3.5K2SO4, the difficulty is met with that two of the salts, sodium chloride and potassium sulphate, lie on opposite axes. To overcome this difficulty the difference 51 - 3.5 = 47.5 is taken and measured off along the sodium chloride axis; and the solution is therefore represented by the point 47.5Na2Cl2, 9.5K2Cl2. In order, therefore, to find the amount of potassium sulphate present {319}from such a diagram, it is necessary to know the total number of salt molecules in the solution. When this is known, it is only necessary to subtract from it the sum of the molecules of sodium and potassium chloride, and the result is equal to twice the number of potassium sulphate molecules. Thus, in the above example, the total number of salt molecules is 64. The number of molecules of sodium and potassium chloride is 57; 64 - 57 = 7, and therefore the number of potassium sulphate molecules is 3.5.
Another method of representation employed is to indicate the amounts of only two of the salts in a plane diagram, and to measure off the total number of molecules along a vertical axis. In this way a solid model is obtained.
The numerical data from which Fig. 124 was constructed are contained in the following table, which gives the composition of the different solutions at 0°:—[391]
| Point. | Solid phases. | Composition of solution in gram-mols. per 1000 gram-mols. water. | Total number of salt molecules. | |||||
| Na2Cl2. | K2Cl2. | Na2SO4. | K2SO4. | |||||
| I. | NaCl | 55 | — | — | — | 55 | ||
| II. | KCl | — | 34.5 | — | — | 34.5 | ||
| III. | Na2SO4,10H2O | — | — | 6 | — | 6 | ||
| IV. | K2SO4 | — | — | — | 9 | 9 | ||
| V. | NaCl; KCl | 46.5 | 12.5 | — | — | 59 | ||
| VI. | NaCl; Na2SO4,10H2O | 47.5 | — | 8 | — | 55.5 | ||
| VII. | KCl; K2SO4 | — | 34.5 | — | 1 | 35.5 | ||
| VIII. | | Glaserite; Na2SO4,10H2O |
| — | — | 10 | 10 | 20 |
| IX. | Glaserite; K2SO4 | — | — | 7.5 | 10 | 17.5 | ||
| X. | | Na2SO4,10H2O; KCl; NaCl |
| 51 | 9.5 | — | 3.5 | 64 |
| XI. | | Na2SO4,10H2O; KCl; glaserite |
| 40.5 | 13 | — | 3.5 | 57 |
| XII. | K2SO4; KCl; glaserite | 18 | 23 | — | 3 | 44 | ||
From the aspect of these diagrams the conditions under which the salts can coexist can be read at a glance. Thus, {320}for example, Fig. 124 shows that at 0° Glauber's salt and potassium chloride can exist together with solution; namely, in contact with solutions having the composition X—XI. This temperature must therefore be below the transition point of this salt-pair (p. 314). On raising the temperature to 4.4°, it is found that the curve VIII.—XI. moves so that the point XI. coincides with point X. At this point, therefore, there will be four concurrent fields, viz. Glauber's salt, potassium chloride, glaserite, and sodium chloride. But these four salts can coexist with solution only at the transition point; so that 4.4° is the transition temperature of the salt-pair: Glauber's salt—potassium chloride. At higher temperatures the line VIII.—XI. moves still further to the left, so that the field for Glauber's salt becomes entirely separated from the field for potassium chloride. This shows that at temperatures above the transition point the salt-pair Glauber's salt—potassium chloride cannot coexist in presence of solution.
 Fig. 125.
If it is only desired to indicate the mutual relationships of the different components and the conditions for their coexistence (paragenesis), a simpler diagram than Fig. 124 can be employed. Thus if the boundary curves of Fig. 124 are so drawn that they cut one another at right angles, a figure such as Fig. 125 is obtained, the Roman numerals here corresponding with those in Fig. 124.
Ammonia-Soda Process.—One of the most important applications of the Phase Rule to systems of four components with reciprocal salt-pairs has recently been made by Fedotieff[392] in his investigations of the conditions for the formation of sodium carbonate by the so-called ammonia-soda (Solvay) {321}process.[393] This process consists, as is well known, in passing carbon dioxide through a solution of common salt saturated with ammonia.
Whatever differences of detail there may be in the process as carried out in different manufactories, the reaction which forms the basis of the process is that represented by the equation
NaCl + NH4HCO3 = NaHCO3 + NH4Cl
We are dealing here, therefore, with reciprocal salt-pairs, the behaviour of which has just been discussed in the preceding pages. The present case is, however, simpler than that of the salt-pair Na2SO4.10H2O + KCl, inasmuch as under the conditions of experiment neither hydrates nor double salts are formed. Since the study of the reaction is rendered more difficult on account of the fact that ammonium bicarbonate in solution, when under atmospheric pressure, undergoes decomposition at temperatures above 15°, this temperature was the one chosen for the detailed investigation of the conditions of equilibrium. Since, further, it has been shown by Bodländer[394] that the bicarbonates possess a definite solubility only when the pressure of carbon dioxide in the solution has a definite value, the measurements were carried out in solutions saturated with this gas. This, however, does not constitute another component, because we have made the restriction that the sum of the partial pressures of carbon dioxide and water vapour is equal to 1 atmosphere. The concentration of the carbon dioxide is, therefore, not independently variable (p. 10).
 Fig. 126.
In order to obtain the data necessary for a discussion of the conditions of soda formation by the ammonia-soda process, solubility determinations with the four salts, NaCl, NH4Cl, NH4HCO3, and NaHCO3 were made, first with the single salts and then {322}with the salts in pairs. The results obtained are represented graphically in Fig. 126, which is an isothermal diagram similar to that given by Fig. 124. The points I., II., III., IV., represent the composition of solutions in equilibrium with two solid salts. We have, however, seen (p. 314) that the transition point, when the experiment is carried out under constant pressure (atmospheric pressure), is the point of intersection of four solubility curves, each of which represents the composition of solutions in equilibrium with three salts, viz. one of the reciprocal salt-pairs along with a third salt. Since, now, it was found that the stable salt-pair at temperatures between 0° and 30° is sodium bicarbonate and ammonium chloride, determinations were made of the composition of solutions in equilibrium with NaHCO3 + NH4Cl + NH4HCO3 and with NaHCO3 + NH4Cl + NaCl as solid phases. Under the {323}conditions of experiment (temperature = 15°) sodium chloride and ammonium bicarbonate cannot coexist in contact with solution. These determinations gave the data necessary for the construction of the complete isothermal diagram (Fig. 127). The most important of these data are given in the following table (temperature, 15°):—
| Point. | Solid phases. | Composition of solution in gram-mols. per 1000 gram-mols. water. | |||
| NaHCO3 | NaCl | NH4HCO3 | NH4Cl | ||
| — | NaHCO3 | 1.08 | — | — | — |
| — | NaCl | — | 6.12 | — | — |
| — | NH4HCO3 | — | — | 2.36 | — |
| — | NH4Cl | — | — | — | 6.64 |
| I. | NaHCO3; NaCl | 0.12 | 6.06 | — | — |
| II. | NaCl; NH4Cl | — | 4.55 | — | 3.72 |
| III. | NH4Cl; NH4HCO3 | — | — | 0.81 | 6.40 |
| IV. | NaHCO3; NH4HCO3 | 0.71 | — | 2.16 | — |
| P1 | NaHCO3; NH4HCO3; NH4Cl | 0.93 | 0.51 | — | 6.28 |
| P2 | NaHCO3; NaCl; NH4Cl | 0.18 | 4.44 | — | 3.73 |
With reference to the solution represented by the point P1, it may be remarked that it is an incongruently saturated solution (p. 279). If sodium chloride is added to this solution, the composition of the latter undergoes change; and if a sufficient amount of the salt is added, the solution P2 is obtained.
Turning now to the practical application of the data so obtained, consider first what is the influence of concentration on the yield of soda. Since the reaction consists essentially in a double decomposition between sodium chloride and ammonium bicarbonate, then, after the deposition of the sodium bicarbonate, we obtain a solution containing sodium chloride, ammonium chloride, and sodium bicarbonate. In order to ascertain to what extent the sodium chloride has been converted into solid sodium bicarbonate, it is necessary to examine the composition of the solution which is obtained {324}with definite amounts of sodium chloride and ammonium bicarbonate.
 Fig. 127.
Consider, in the first place, the solutions represented by the curve P2P1. With the help of this curve we can state the conditions under which a solution, saturated for ammonium chloride, is obtained, after deposition of sodium bicarbonate. In the following table the composition of the solutions is given which are obtained with different initial amounts of sodium chloride and ammonium bicarbonate. The last two columns give the percentage amount of the sodium used, which is deposited as solid sodium bicarbonate (UNa); and likewise the percentage amount of ammonium bicarbonate which is usefully converted into sodium bicarbonate, that is to say, the amount of the radical HCO3 deposited (UNH4):— {325}
| Point. | Initial composition of the solutions: grams of salt to 1000 grams of water. | Composition of solutions obtained: gram-equivalents per 1000 grams of water. | UNa per cent. | UNH4 per cent. | ||||
| NaCl | NH4HCO3 | HCO3 | Cl | Na | NH4 | |||
| P2 | 479 | 295 | 0.18 | 8.17 | 4.62 | 3.73 | 43.4 | 95.1 |
| — | 448 | 360 | 0.31 | 7.65 | 3.39 | 4.56 | 55.7 | 93.4 |
| — | 417 | 431 | 0.51 | 7.13 | 2.19 | 5.45 | 69.2 | 90.5 |
| P1 | 397 | 496 | 0.92 | 6.79 | 1.44 | 6.28 | 78.8 | 85.1 |
This table shows that the greater the excess of sodium chloride, the greater is the percentage utilization of ammonia (Point P2); and the more the amount of sodium chloride decreases, the greater is the percentage amount of sodium chloride converted into bicarbonate. In the latter case, however, the percentage utilization of the ammonium bicarbonate decreases; that is to say, less sodium bicarbonate is deposited, or more of it remains in solution.
Consider, in the same manner, the relations for solutions represented by the curve P2IV, which gives the composition of solutions saturated with respect to sodium bicarbonate and ammonium bicarbonate. In this case we obtain the following results:—
| Point. | Initial composition of the solutions: grams of salt to 1000 grams of water. | Composition of solutions obtained: gram-equivalents per 1000 grams of water. | UNa per cent. | UNH4 per cent. | ||||
| NaCl | NH4HCO3 | HCO3 | Cl | Na | NH4 | |||
| P1 | 397 | 496 | 0.92 | 6.79 | 1.44 | 6.28 | 78.8 | 85.1 |
| — | 351 | 446 | 0.99 | 6.00 | 1.34 | 5.65 | 77.7 | 82.5 |
| — | 316 | 412 | 1.07 | 5.41 | 1.27 | 5.21 | 76.4 | 79.5 |
| — | 294 | 389 | 1.12 | 5.03 | 1.23 | 4.92 | 75.5 | 75.1 |
| — | 234 | 327 | 1.30 | 4.00 | 1.16 | 4.14 | 71.0 | 68.6 |
As is evident from this table, diminution in the relative amount of sodium chloride exercises only a slight influence {326}on the utilization of this salt, but is accompanied by a rapid diminution of the effective transformation of the ammonium bicarbonate. So far as the efficient conversion of the sodium is concerned, we see that it reaches its maximum at the point P1, and that it decreases both with increase and with decrease of the relative amount of sodium chloride employed; and faster, indeed, in the former than in the latter case. On the other hand, the effective transformation of the ammonium bicarbonate reaches its maximum at the point P2, and diminishes with increase in the relative amount of ammonium bicarbonate employed. Since sodium chloride is, in comparison with ammonia—even when this is regenerated—a cheap material, it is evidently more advantageous to work with solutions which are relatively rich in sodium chloride (solutions represented by the curve P1P2). This fact has also been established empirically.
When, as is the case in industrial practice, we are dealing with solutions which are saturated not for two salts but only for sodium bicarbonate, it is evident that we have then to do with solutions the composition of which is represented by points in the area P1P2I,IV. Since in the commercial manufacture, the aim must be to obtain as complete a utilization of the materials as possible, the solutions employed industrially must lie in the neighbourhood of the curves P2P1IV, as is indicated by the shaded portion in Fig. 127. The best results, from the manufacturer's standpoint, will be obtained, as already stated, when the composition of the solutions approaches that given by a point on the curve P2P1. Considered from the chemical standpoint, the results of the experiments lead to the conclusion that the Solvay process, i.e. passage of carbon dioxide through a solution of sodium chloride saturated with ammonia, is not so good as the newer method of Schlösing, which consists in bringing together sodium chloride and ammonium bicarbonate with water.[395]
Preparation of Barium Nitrite.—Mention may also be made here of the preparation of barium nitrite by double decomposition of barium chloride and sodium nitrite.[396]
The reaction with which we are dealing here is represented by the equation
BaCl2 + 2NaNO2 = 2NaCl + Ba(NO2)2
It was found that at the ordinary temperature NaCl and Ba(NO2)2 form the stable salt-pair. If, therefore, barium chloride and sodium nitrite are brought together with an amount of water insufficient for complete solution, transformation to the stable salt-pair occurs, and sodium chloride and barium nitrite are deposited. When, however, a stable salt-pair is in its transition interval (p. 315), a third salt—in this case barium chloride—will be deposited, as we have already learned. On bringing barium chloride and sodium nitrite together with water, therefore, three solid phases are obtained, viz. BaCl2, NaCl, Ba(NO2)2. These three phases, together with solution and vapour, constitute a univariant system, so that at each temperature the composition of the solution must be constant.
Witt and Ludwig found that the presence of solid barium chloride can be prevented by adding an excess of sodium nitrite, as can be readily foreseen from what has been said. Since the solution in presence of the three solid phases must have a definite composition at a definite temperature, the addition of sodium nitrite to the solution must have, as its consequence, the solution of an equivalent amount of barium chloride, and the deposition of an equivalent amount of sodium chloride and barium nitrite. By sufficient addition of sodium nitrite, the complete disappearance of the solid barium chloride can be effected, and there will remain only the stable salt-pair sodium chloride and barium nitrite. As was pointed out by Meyerhoffer, however, the disappearance of the barium chloride is effected, not by a change in the {328}composition of the solution, but by the necessity for the composition of the solution remaining constant.
 Fig. 128.
Barium Carbonate and Potassium Sulphate.—As has been found by Meyerhoffer,[397] these two salts form the stable pair, not only at the ordinary temperature, but also at the melting point. For the ordinary temperatures this was proved in the following manner: A solution with the solid phases K2SO4 and K2CO3.2H2O in excess can only coexist in contact either with BaCO3 or with BaSO4, since, evidently, in one of the two groups the stable system must be present. Two solutions were prepared, each with excess of K2SO4 + K2CO3.2H2O, {329}and to one was added BaCO3 and to the other BaSO4. After stirring for a few days, the barium sulphate was completely transformed to BaCO3, whereas the barium carbonate remained unchanged. Consequently, BaCO3 + K2SO4 + K2CO3.2H2O is stable, and, therefore, so also is BaCO3 + K2SO4. That BaCO3 + K2SO4 is the stable pair also at the melting point was proved by a special analytical method which allows of the detection of K2CO3 in a mixture of the four solid salts. This analysis showed that a mixture of BaCO3 + K2SO4, after being fused and allowed to solidify, contains only small amounts of K2CO3; and this is due entirely to the fact that BaCO3 + K2SO4 on fusion deposits a little BaSO4, thereby giving rise at the same time to the separation of an equivalent amount of K2CO3.
The different solubilities are shown in Fig. 128. In this diagram the solubility of the two barium salts has been neglected. A is the solubility of K2CO3.2H2O; addition of BaCO3 does not alter this. B is the solubility of K2CO3.2H2O + K2SO4 + BaCO3. A and B almost coincide, since the potassium sulphate is very slightly soluble in the concentrated solution of potassium carbonate. D gives the concentration of the solution in equilibrium with K2SO4 + BaSO4. The most interesting point is C. This solution is obtained by adding a small quantity of water to BaCO3 + K2SO4, whereupon, being in the transition interval, BaSO4 separates out and an equivalent amount of K2CO3 goes into solution. C is the end point of the curve CO, which is called the Guldberg-Waage curve, because these investigators determined several points on it.
In their experiments, Guldberg and Waage found the ratio K2CO3 : K2SO4 in solution to be constant and equal to 4. This result is, however, not exact, for the curve CO is not a straight line, as it should be if the above ratio were constant; but it is concave to the abscissa axis, and more so at lower than at higher temperatures.
The following table refers to the temperature of 25°. The Roman numbers in the first column refer to the points in Fig. 128. The numbers in the column Σk2 give the amount, {330}in gram-molecules, of K2CO3 + K2SO4 contained in 1000 gram-molecules of water:—
Solubility Determinations at 25°.
| No. | Solid phases. | 100 gms. of the solution contain, in grams, | 1000 moles of water contain, in moles, | Σk2 | K2CO3 K2SO4 | ||||||
| K2CO3 | K2SO4 | K2CO3 | K2SO4 | ||||||||
| I. | K2CO3.2H2O + BaCO3 | 53.2 | — | 147.9 | — | — | — | ||||
| II. | | K2CO3.2H2O + K2SO4 + BaCO3 | | 53.0 | 0.023 | 147.8 | 0.051 | — | — | ||
| III. IV. | | K2SO4 + BaCO3 | | 28.5 22.1 | 0.886 1.72 | 52.58 37.79 | 1.296 2.333 | — — | — — | ||
| V. | BaCO3 + K2SO4 + BaSO4 | 17.81 | 2.485 | 29.11 | 3.220 | 32.32 | 9.03 | ||||
| VI. VII. | | K2SO4 + BaSO4 | | 12.6 5.85 | 3.92 6.76 | 19.66 8.724 | 4.853 7.995 | — — | — — | ||
| VIII. | K2SO4 | — | 10.76 | — | 12.47 | — | — | ||||
| IX. X. | | BaCO3 + BaSO4 | | 7.35 2.85 | 0.602 0.173 | 10.43 3.828 | 0.676 0.184 | 11.11 4.0 | 15.0 21.0 | ||
The Guldberg-Waage curve at 100° was also determined, and it was found that the ratio K2CO3: K2SO4 is also not constant, although the variations are not so great as at 25°.
Guldberg-Waage Curve at 100°.
| Solid phases. | 100 moles of water contain, in moles, | Σk2 | K2CO3 K2SO4 | |
| K2CO3 | K2SO4 | |||
| BaCO3 + K2SO4 + BaSO4 | 23.9 | 12.65 | 35.65 | 1.82 |
| BaCO3 + BaSO4 | 6.28 | 2.02 | 8.3 | 3.1 |
| " " | 3.17 | 0.851 | 4.025 | 3.7 |
EXPERIMENTAL DETERMINATION OF THE TRANSITION POINT
For the purpose of determining the transition temperature, a number of methods have been employed, and the most important of these will be briefly described here. In any given case it is sometimes possible to employ more than one method, but all are not equally suitable, and the values of the transition point obtained by the different methods are not always identical. Indeed, a difference of several degrees in the value found may quite well occur.[398] In each case, therefore, some care must be taken to select the method most suitable for the purpose.
I. The Dilatometric Method.—Since, in the majority of cases, transformation at the transition point is accompanied by an appreciable change of volume, it is only necessary to ascertain the temperature at which this change of volume occurs, in order to determine the transition point. For this purpose the dilatometer is employed, an apparatus which consists of a bulb with capillary tube attached, and which constitutes a sort of large thermometer (Fig. 129). Some of the substance to be examined is passed into the bulb A through the tube B, which is then sealed off. The rest of the bulb and a small portion of the capillary tube is then filled with some liquid, which, of course, must be without chemical action on the substance under investigation. A liquid, however, may be employed which dissolves the substance, for, as we have seen (p. 70), the transformation at the transition point is, as a rule, accelerated by the presence of a solvent. On the other hand, the liquid must not dissolve in the substance under examination, for the temperature of transformation would be thereby altered.
In using the dilatometer, two methods of procedure may be followed. According to the first method, the dilatometer containing the form stable at lower temperatures is placed in a thermostat, maintained at a constant temperature, until it has taken the temperature of the bath. The height of the meniscus is then read on a millimetre scale attached to the capillary. The temperature of the thermostat is then raised degree by degree, and the height of the meniscus at each point ascertained. If, now, no change takes place in the solid, the expansion will be practically uniform, or the rise in the level of the meniscus per degree of temperature will be practically the same at the different temperatures, as represented diagrammatically by the line AB in Fig. 130. On passing through the transition point, however, there will be a more or less sudden increase in the rise of the meniscus per degree (line BC) if the specific volume of the form stable at higher temperatures is greater than that of the original modification; thereafter, the expansion will again be uniform (line CD). Similarly, on cooling, contraction will at first be uniform and then at the transition point there will be a relatively large diminution of volume.
 Fig. 129.
 Fig. 130.
If, now, transformation occurred immediately the transition point was reached, the sudden expansion and contraction would take place at the same temperature. It is, however, generally found that there is a lag, and that with rising temperature the relatively large expansion does not take place until a temperature somewhat higher than the transition point; and with falling temperature the contraction occurs at a temperature somewhat below the transition point. This is represented in Fig. 130 by the lines BC and EF. The amount of lag will vary from case to case, and will {333}also depend on the length of time during which the dilatometer is maintained at constant temperature.
As an example, there may be given the results obtained in the determination of the transition point at which sodium sulphate and magnesium sulphate form astracanite (p. 268).[399] The dilatometer was charged with a mixture of the two sulphates.
| Temperature. | Level of oil in capillary. | Rise per 1°. |
| 15.6° 16.6° 17.6° 18.6° 19.6° 20.6° 21.6° 22.6° 23.6° 24.6° | 134 141 148 154 161 168 241 243 251 259 | 7 7 6 7 7 73 2 8 8 |
The transition point, therefore, lies about 21.6° (p. 268).
The second method of manipulation depends on the fact that, while above or below the transition point transformation of one form into the other can take place, at the transition point the two forms undergo no change. The bulb of the dilatometer is, therefore, charged with a mixture of the stable and metastable forms and a suitable liquid, and is then immersed in a bath at constant temperature. After the temperature of the bath has been acquired, readings of the height of the meniscus are made from time to time to ascertain whether expansion or contraction occurs. If expansion is found, the temperature of the thermostat is altered until a temperature is obtained at which a gradual contraction takes place. The transition point must then lie between these two temperatures; and by repeating the determinations it will be possible to reduce the difference between the temperatures at which expansion and contraction take place to, say, 1°, and to fix the temperature of the transition point, therefore, to within half a degree. By this method the transition point, for example, of sulphur was found to be 95.6° under a pressure of 4 atm.[400] The following are the figures obtained by Reicher, who used a mixture {334}of 1 part of carbon disulphide (solvent for sulphur) and 5 parts of turpentine as the measuring liquid.
| Temperature 95.1°. | |
| Time in minutes. | Level of liquid. |
| 5 | 343.5 |
| 30 | 340.5 |
| 55 | 335.75 |
| 65 | 333 |
| Temperature 96.1°. | |
| Time in minutes. | Level of liquid. |
| 5 | 342.75 |
| 30 | 354.75 |
| 55 | 360.5 |
| 60 | 361.5 |
| Temperature 95.6°. | |
| Time in minutes. | Level of liquid. |
| 5 | 368.75 |
| 100 | 368 |
| 110 | 368.75 |
At a temperature of 95.1° there is a contraction, i.e. monoclinic sulphur passes into the rhombic, the specific volume of the former being greater than that of the latter. At 96.1°, however, there is expansion, showing that at this temperature rhombic sulphur passes into monoclinic; while at 95.6° there is neither expansion nor contraction. This is, therefore, the transition temperature; and since the dilatometer was sealed up to prevent evaporation of the liquid, the pressure within it was 4 atm.
II. Measurement of the Vapour Pressure.—In the preceding pages it has been seen repeatedly that the vapour pressures of the two systems undergoing reciprocal transformation become identical at the transition point (more strictly, at the triple or {335}multiple point), and the latter can therefore be determined by ascertaining the temperature at which this identity of vapour pressure is established. The apparatus usually employed for this purpose is the Bremer-Frowein tensimeter (p. 91).
Although this method has not as yet been applied to systems of one component, it has been used to a considerable extent in the case of systems containing water or other volatile component. An example of this has already been given in Glauber's salt (p. 139).
III. Solubility Measurements.—The temperature of the transition point can also be fixed by means of solubility measurements, for at that point the solubility of the two systems becomes identical. Reference has already been made to several cases in which this method was employed, e.g. ammonium nitrate (p. 112), Glauber's salt (p. 134), astracanite and sodium and magnesium sulphates (p. 268).
The determinations of the solubility can be carried out in various ways. One of the simplest methods, which also gives sufficiently accurate results when the temperature is not high or when the solvent is not very volatile, can be carried out in the following manner. The solid substance is finely powdered (in order to accelerate the process of solution), and placed in sufficient quantity along with the solvent in a tube carefully closed by a glass stopper; the latter is protected by a rubber cap, such as a rubber finger-stall. The tube is then rotated in a thermostat, the temperature of which does not vary more than one or two tenths of a degree, until saturation is produced. The solution is withdrawn by means of a pipette to which a small glass tube, filled with cotton wool to act as a filter, is attached. The solution is then run into a weighing bottle, and weighed; after which the amount of solid in solution is determined in a suitable manner.
For more accurate determinations of the solubility, especially when the solvent is appreciably volatile at the temperature of experiment, other methods are preferable. In Fig. 131 is shown the apparatus employed by H. Goldschmidt,[401] and used to a considerable extent in the laboratory of van't Hoff. This consists essentially of three parts: a, a tube in which the solvent and salt are placed; this is closed at the foot by an india-rubber stopper. Through this stopper there passes the bent tube cb, which connects the tube a with the weighing-tube d. At c there is a plug of cotton wool. Tube e is open to the air. The wider portion of the tube cb, which passes through the rubber stopper in a, can be closed by a plug {336}attached to a glass rod ff, which passes up through a hollow Witt stirrer, g. After being fitted together, the whole apparatus is immersed in the thermostat. After the solution has become saturated, the stopper of the bent tube is raised by means of the rod ff and a suction-pump attached to the end of e. The solution is thereby drawn into the weighing-tube d, the undissolved salt being retained by the plug at c. The apparatus is then removed from the thermostat, tube d detached and immediately closed by a ground stopper. It is then carefully dried and weighed.
 Fig. 131.
Another form of solubility vessel, due to Meyerhoffer and Saunders, is shown in Fig. 132.[402] This consists of a single tube, and the stirring is effected by means of a glass screw.
 Fig. 132.
The progress of the solution towards saturation can be very well tested by determining the density of the solution from time to {337}time. This is most conveniently carried out by means of the pipette shown in Fig. 133.[403] With this pipette the solution can not only be removed for weighing, but the volume can be determined at the same time. It consists of the wide tube a, to which the graduated capillary b, furnished with a cap c, is attached. To the lower end of the pipette the tube e, with plug of cotton wool, can be fixed. After the pipette has been filled by sucking at the end of b, the stop-cock d is closed and the cap c placed on the capillary. The apparatus can then be weighed, and the volume of the solution be ascertained by means of the graduations.
As has already been insisted, particular care must be paid to the characterization of the solid in contact with the solution.
 Fig. 133.
IV. Thermometric Method.—If a substance is heated, its temperature will gradually rise until the melting point is reached, and the temperature will then remain constant until all the solid has passed into liquid. Similarly, if a substance which can undergo transformation is heated, the temperature will rise until the transition point is reached, and will then remain constant until complete transformation has taken place.
This method, it will be remembered, was employed by Richards for the determination of the transition point of sodium sulphate decahydrate (p. 136). The following figures give the results obtained by Meyerhoffer in the case of the transformation:—
CuK2Cl4,2H2O CuKCl3 + KCl + 2H2O
the temperature being noted from minute to minute: 95°, 93°, 91.8°, 91.7°, 92°, 92.3°, 92.4°, 92.2°, 92.2°, 92°, 90.5°, 89°, and then a rapid fall in the temperature. From this we see that the transition point is about 92.2°. It is also evident that a slight supercooling took place (91.7°), owing to a delay in the transformation, but that then the temperature rose to the transition point. This is analogous to the supercooling of a liquid.
A similar halt in the temperature would be observed on passing from lower to higher temperatures; but owing to a lag in the transformation, the same temperature is not always obtained.
V. Optical Method.—The transition point can sometimes be determined by noting the temperature at which some alteration in the appearance of the substance occurs, such as a change of colour or of the crystalline form. Thus mercuric iodide changes colour from red to yellow, and the blue quadratic crystals of copper calcium acetate change, on passing the transition point, into green rhombs of copper acetate and white needles of calcium acetate (p. 260). Or again, changes in the double refraction of the crystals may be also employed to ascertain the temperature of the transition point. These changes are best observed by means of a microscope.
For the purpose of regulating the temperature of the substance a small copper air-bath is employed.[404]
VI. Electrical Methods.—Electrical methods for the determination of the transition point are of two kinds, based on measurements of conductivity or of electromotive force. Both methods are restricted in their application, but where applicable give very exact results.
The former method, which has been employed in several cases, need not be described here. The second method, however, is of considerable interest and importance, and calls for special reference.[405]
If two pieces, say, of zinc, connected together by a conducting wire, are placed in a solution of a zinc salt, e.g. zinc sulphate, the potential of the two electrodes will be the same, and no current will be produced in the connecting wire. If, however, the zinc electrodes are immersed in two solutions of different concentration contained in separate vessels, but placed in connection with one another by means of a bent tube filled with a conducting solution, the potentials at the electrodes will no longer be the same, and a current will now flow through the connecting wire. The direction of this current in the cell will be from the weaker to the more concentrated solution.
The greater the difference in the concentration of the solutions with respect to zinc, the greater will be the difference of the potential at the two electrodes, or the greater will be the E.M.F. of the cell. When the concentration of the two solutions becomes the same, the E.M.F. will become zero, and no current will pass.
It will be understood now how this method can be made use of {339}for determining the transition point of a salt, when we bear in mind that at the transition point the solubility of the two forms becomes identical. Thus, for example, the transition point of zinc sulphate heptahydrate into hexahydrate could be determined in the following manner. Tube A (Fig. 134) contains, say, a saturated solution of the heptahydrate along with some of the solid salt; tube B, a saturated solution of the hexahydrate along with the solid salt. The tube C is a connecting tube bent downwards so as to prevent the mixing of the solutions by convection currents. ZZ are two zinc electrodes immersed in the solution; the cell is placed in a thermostat and the zinc electrodes connected with a galvanometer. Since, now, at temperatures below the transition point the solubility of the hexahydrate (the metastable form) is greater than that of the heptahydrate, a current will be produced, flowing in the cell from heptahydrate to hexahydrate. As the temperature is raised towards the transition point, the solubilities of the two hydrates also approach, and the current produced will therefore become weaker, because the E.M.F. of the cell becomes less; and when the transition point is attained, the E.M.F. becomes zero, and the current ceases. If the temperature is raised above this, the solubility of the heptahydrate becomes greater than that of the hexahydrate, and a current will again be produced, but in the opposite direction. By noting the temperature, therefore, at which the current ceases, or the E.M.F. becomes zero, the transition temperature can be ascertained.[406]
 Fig. 134.
In the case just described, the electrodes consisted of the same metal as was contained in the salt. But in some cases, e.g. sodium sulphate, electrodes of the metal contained in the salt cannot be employed. Nevertheless, the above electrical method can be used {340}even in those cases, if a suitable non-polarizable mercury electrode is employed.[407]
Although, as we saw, no current was produced when two pieces of zinc were immersed in the same solution of zinc salt, a current will be obtained if two different metals, or even two different modifications of the same metal, are employed. Thus an E.M.F. will be established when electrodes of grey and of white tin are immersed in the same solution of zinc salt, but at the transition point this E.M.F. will become zero. By this method Cohen determined the transition point of grey and white tin (p. 42).
A
Abegg, 52
Allan, 298
Allen, L. E., 109
Allen, R. W., 63
Ampolla, 213
Andreä, 109
Aristotle, 41
Armstrong, E. F., 313
Armstrong, H. E., 196
Arzruni, 33
Auerbach, 326
B
Babo, 126
Bancroft, 102, 104, 161, 176, 196, 202, 229, 246, 260, 261, 272, 281, 302
Barschall, 318
Barus, 67
Battelli, 23
Beckmann, 49
Bell, 229
Berthollet, 7
Bogojawlenski, 72
Braun, 107
Bredig, 52
Bremer, 91
Bruner, 126
Bunsen, 67
C
Cady, 192
Calvert, 130
Cameron, 203
Carnelley, 47
Carpenter, 225
Centnerszwer, 158
Chapman, 47
Charpy, 255
Churchill, 140
Coehn, 52
Cox, 301
F
Fahrenheit, 30
Fath, 204
Foote, 69
Friedländer, 72
Fritsche, 41
Frowein, 91
Füchtbauer, 75
Fyffe, 143
G
Gay-Lussac, 135
Gernez, 72
Glaessner, 307
Goldschmidt, E., 41
Goldschmidt, H., 335
Goldschmidt, V., 32
Goossens, 26
Gossner, 318
Graham, 178
Guertler, 73
Guldberg, 7
H
Haber, 311
Hallock, 35
Hammerl, 145
Hautefeuille, 46, 49, 50, 51, 178
Heller, 311
Henry, 94
Herold, 321
Hertz, 49
Hickmans, 219
Hiorns, 228
Hoitsema, 14, 90, 177, 178, 298
Hollmann, 204
Holsboer, 110
Hudson, 102
K
Kastle, 71
Kaufler, 49
Kaufmann, 112
Kayser, 176
Keeling, 225
Kelvin, 25
Kipping, 219
Kirchhoff, 32
Knorr, 203
Krasnicki, 144
Kuenen, 105
Kultascheff, 233
{343}Kuriloff, 216
M
Mack, 67
Magnus, 22
Mathews, 221
Mellor, 80
Meusser, 142
Meyer, J., 71
Meyer, V., 47
Meyerhoffer, 158, 233, 259, 268, 271, 278, 279, 280, 284, 313, 315, 317, 319, 327, 328, 336, 337
Middelberg, 116
Miers, 114
Miller, 297
Mond, 178
Moore, 72
Moss, 66
O
Offer, 119
Ostwald, 8, 10, 13, 16, 22, 44, 58, 68, 70, 74, 85, 88, 92, 102, 110, 117, 125, 127, 130, 141, 198
P
Parsons, 298
Pasteur, 266
Paternò, 213
Payen, 74
Pedler, 47
Pfaundler, 119
von Pickardt, 73
Planck, 68
Pope, 219
Poynting, 68
Preuner, 311
Puschin, 222
Q
Quincke, 52
R
Rabe, 113
Ramsay, 3, 22, 23, 24, 30, 32, 63, 64, 66, 79, 90, 165, 178
Raoult, 180
Reed, 71
Regnault, 22
Reicher, 36, 37, 110, 260, 333
Riddle, 47
Roberts-Austen, 63, 194, 221, 223, 225
Roloff, 117
Roozeboom, 10, 38, 45, 47, 49, 50, 51, 54, 56, 57, 62, 63, 68, 88, 103, 126, 145, 147, 150, 151, 157, 162, 170, 174, 178, 182, 196, 201, 211, 217, 220, 225, 236, 238, 262, 264, 269, 272, 273, 281, 282, 290, 331
{344}Rose, 223
Rotarski, 52
Rutten, 298
S
Saposchnikoff, 212
Saunders, 313, 317, 319, 336, 337
Saurel, 151
Schneider, 52
Schönbeck, 75
Schreinemakers, 122, 126, 246, 248, 250, 252, 290, 302
Schrötter, 46
Schukowsky, 52
Schwarz, 331
Seitz, 52
Shields, 178
Skirrow, 130
Spring, 63
Staedel, 267
Stokes, 236
T
Taber, 229
Tammann, 26, 32, 33, 37, 38, 39, 48, 52, 65, 67, 68, 72, 73, 140, 151, 176, 221, 230
Thomson, W., 25
Trevor, 16
Tumlirz, 72
V
Van Bemmelen, 180
Van Deventer, 110, 139, 266, 267, 333
Van't Hoff, 36, 38, 58, 70, 90, 92, 108, 127, 139, 140, 165, 175, 225, 258, 260, 263, 265, 266, 267, 272, 284, 290, 313, 318, 333, 340
Van Leeuwen, 259
Van Wyk, 185
A
Acetaldehyde and paraldehyde, 204
Acetic acid, chloroform, water, 241
Acetone, phenol, water, 248
Adsorption, 176
Alcohol, chloroform, water, 246
——, ether, water, 246
Alloys, equilibrium curves of, 221
—— of copper and tin, liquefaction of, by cooling, 194
—— of iron and carbon, 223
—— of thallium and mercury, 222
——, ternary, 246
Ammonia compounds of metal chlorides, 82
Ammonia silver chlorides, 82
—— —— ——, dissociation pressures of, 84
Ammonia-soda process, 320
Ammonium chloride, dissociation of, 3, 79
—— cyanide, dissociation of, 80
—— hydrosulphide, dissociation of, 80
—— nitrate, solubility of, 113
Aniline, phenol, water, 250
B
Babo, law of, 126
Barium acetate, solubility of, 143
Barium carbonate and potassium sulphate, 328
—— nitrite, preparation of, 327
Basic salts, 296
Benzaldoximes, 203
Benzene and picric acid, 216
Bismuth, effect of pressure on the melting point of, 67
——, lead, tin, 255
—— nitrates, basic, 298
Bivariant systems, 16
Bromocinnamic aldehyde and chlorocinnamic aldehyde, 183
C
Calcium carbonate, dissociation of, 3, 11, 81
—— chloride hexahydrate, solubility of, 146
—— ——, solubility of hydrates of, 148
—— ——, vapour-pressure of hydrates of, 88
Carnallite, 284
Cementite, 224
Chlorine and iodine, 161
Chlorocinnamic aldehyde and bromocinnamic aldehyde, 183
Chloroform, acetic acid, water, 241
——, alcohol, water, 246
{346}Classification of systems, 17
Components, choice of, 12, 13, 14, 76, 313
——, determination of number of, 13
——, systems of four, 312
——, —— of three, 234
——, variation in number of, 11, 14
Composition, determination of, without analysis, 228, 302
Concentration-temperature curve for two liquids, 101
Condensed systems, 36
Constituent, 10
Cooling curve, 230
Copper calcium acetate, 260
—— chloride, heat of solution of, 110
—— dipotassium chloride, 259
—— sulphate, 85
Critical concentration, 98, 242
—— pressure of water, 23
—— solution temperature, 98
—— temperature of water, 23
Cryohydric point, 117
—— ——, changes at the, 119
—— —— for silver nitrate and ice, 116
Crystals, liquid, 51
——, ——, equilibria of, 53
——, ——, list of, 54
——, ——, nature of, 52
——, mixed, 180
Crystallization, velocity of, 72, 74
——, spontaneous, 114
D
Deliquescence, 130
Devitrification, 73
Diethylamine and water, solubility of, 101
Dilatometer, determination of transition points by, 331
Dineric surface, 247
Dissociation equilibrium, effect of addition of dissociation products on, 4
—— of ammonia compounds of metal chlorides, 82, 84
—— of ammonium chloride, 3, 79
—— —— cyanide, 80
—— —— hydrosulphide, 80
—— of calcium carbonate, 3, 81
—— of compounds, degree of, 147
—— of phosphonium bromide, 80
—— of salt hydrates, 85
——, phenomena of, 79
Dissociation pressure, 81
Distillation of supercooled liquid to solid, 32, 50
Double salt interval, 278
—— salts, crystallization from solution, 280
—— ——, decomposition by water, 267
E
Efflorescence, 86
Electrical methods of determining transition points, 338
Equilibria, Gibbs's theory of, 8
——, metastable, 69
Equilibrium apparent (false), 5, 6
—— between ice and solution, 116
—— between ice and water, 25
—— between ice, water, vapour, 27
—— between water and vapour, 21
——, heterogeneous, 5
——, homogeneous, 5
——, independence of, on amounts of phases, 9
——, law of movable, 58
{347}Ether, alcohol, water, 246
——, succinic nitrile, water, 252
Ethylene bromide, picric acid, β-naphthol, 256
F
Ferric chloride, evaporation of solutions of, 155
—— ——, hydrogen chloride and water, systems of, 290
Ferrite, modifications of, 224
Freedom, degree of, 14
Freezing mixtures, 120
—— point, natural, 198
Fusion curve, 66
—— —— of ice, 25
—— of ice, influence of pressure on, 26
——, partial, 139
H
Hydrates, range of existence of, 89
—— chloride and water, 174
Hydrogen bromide and water, 174
Hylotropic substances, 198
I
Ice I., 32
—— II., 32
—— III., 32
——, equilibrium between water and, 25
——, influence of pressure on melting point of, 25, 26
——, sublimation curve of, 24
——, vapour pressure of, 25, 31
Indifferent point, 150
Individual, chemical, 92
Inversion temperature, 36
Iodine and chlorine, 161
Iron—carbon alloys, 223
——, carbon monoxide and carbon dioxide, 305
——, ——, equilibrium between, 195, 196
——, ——, equilibrium point of, 198
——, transformation of unstable into stable, 201
Isomerism, dynamic, 196
Isothermal evaporation, 278
—— solubility curves, 272
L
Lead, bismuth, tin, 255
——, desilverization of, 247
——, silver, zinc, 246
Le Chatelier, theorem of, 57
Lime, burning of, 3
Liquidus curve, 182
M
Mandelic acid, 217
Martensite, 224
Mass action, law of, 7
Melting point, influence of pressure on, 66
{348}—— ——, congruent, 146
—— ——, incongruent, 139
—— under the solvent, 122
Menthyl mandelates, 219
Mercuric bromide and iodide, 188
Mercury salts, basic, 301
Metastable equilibria, 69
—— region, 30
—— state, 30
Methylethyl ketone and water, 100
Minerals, formation of, 232
Miscibility of liquids, complete, 95, 104, 114
—— ——, changes in, with temperature, 192
—— ——, examples of, 183, 186, 187, 190, 192, 219, 223
—— ——, fractional crystallization of, 188
—— ——, freezing points of, 182
—— ——, melting points of, 182, 184
—— ——, pseudoracemic, 219
Mixtures, isomorphous, 181
—— of constant boiling point, 105
—— of constant melting point, 117, 186, 187, 192, 209, 255, 257
Multivariant systems, 16
N
Naphthalene and monochloracetic acid, 192
—— and β-naphthol, mixed crystals of, 183
β-Naphthol, ethylene bromide, picric acid, 256
α-Naphthylamine and phenol, 213
Nickel iodate, solubility of, 142
o-Nitrophenol and p-toluidine, 213
O
Occlusion of gases, 176
Optical method of determining transition points, 338
Optically active substances, freezing-point curves of, 216
Order of a system, 13
Organic compounds, application of Phase Rule to, 212
P
Palladium and hydrogen, 90, 178
Paragenesis, 320
Paraldehyde and acetaldehyde, 204
Partial pressures of two components, 102
Pearlite, 224
Phase, 8
—— ——, deduction of, 18
—— ——, scope of, 1
Phases, formation of new, 69
——, number of, 9
Phenol, acetone, water, 248
——, aniline, water, 250
—— and α-naphthylamine, 213
—— and p-toluidine, 214
—— and water, solubility of, 97
Phosphonium bromide, dissociation of, 80
—— chloride, 65
Phosphorus, 46
——, distillation of white to red, 50
——, melting point of red, 47
——, —— —— of white, 48
——, solubility of white and red, 47
——, vapour pressure of white and red, 46
Picric acid and benzene, 216
—— ——, ethylene bromide, and β-naphthol, 256
Polymorphic forms, solubility of, 112
{349}—— substances, list of, 63
Polymorphism, 33
Potassium nitrate and thallium nitrate, 192
Potential, chemical, 19
Pressure-concentration diagram for two liquids, 102
Pressure-temperature diagram for solutions, 126
Pseudomonotropy, 45
Pseudo-racemic mixed crystals, 21
Pyridine and methyl iodide, 147
Pyrometer, registering, 230
R
Racemates, characterization of, 217, 282
Reactions, law of successive, 73
Reciprocal salt-pairs, 313
—— ——, transition point of, 314
Rubidium tartrates, 265
S
Salt hydrates, 85
—— ——, indefiniteness of vapour pressure of, 87
—— —— with definite melting point, 145
Separation of salt on evaporation, 130
Silicates, hydrated, 176
Silver, lead, zinc, 246
Silver nitrate, solubility of, 114
—— —— and sodium nitrate, 190
Single salt interval, 278
Sodium ammonium tartrates, 266
—— nitrate and silver nitrate, 190
—— sulphate and water, equilibria between, 134
Sodium sulphate and water, vapour pressures of, 138, 140
—— ——, anhydrous, dehydration by, 138
—— ——, solubility of, 135
—— —— decahydrate, solubility of, 134
—— —— ——, transition point of, 136, 139
—— —— heptahydrate, solubility of, 136
—— —— ——, transition point of, 137
Solidus curve, 182
Solubility curve at higher temperatures, 114
—— ——, form of, 108
—— —— of anhydrous salts, 111
—— ——, retroflex, 146, 151, 162
—— curves, interpolation and extrapolation of, 111
—— —— of three component systems, 264
——, determination of transition points by, 335
——, influence of pressure on, 107
——, —— of subdivision on, 10
——, —— of temperature on, 109
—— of metastable forms, 47, 112, 137
Solubility of polymorphic forms, 112
—— of supercooled liquids, 125
——, retrograde, 245
Solute, 93
Solution, definition of, 92
——, supersaturated, 108
—— temperature, critical, 98
——, unsaturated, 108
Solutions, bivariant systems, 129
——, congruently saturated, 279
{350}——, incongruently saturated, 279, 289
——, inevaporable, 157
—— of gases in liquids, 93
—— —— in solids, 176
—— of liquids in liquids (binary), 95
—— —— —— (ternary), 240
—— ——, influence of temperature on, 247
—— of solids in liquids, 106
—— —— in solids, 180
——, univariant systems, 127
Space model for carnallite, 284
Stability limit, 202
Steel, formation of, 223
Sublimation curve, 63
—— —— of ice, 24
—— without fusion, 65
Succinic nitrile and water, 122
—— ether, water, 252
—— dioxide and water, 169
—— —— and potassium iodide, 158
——, transition point of rhombic and monoclinic, 36
Supersaturation, 113, 114, 124
——, limits of, 114
Systems, condensed, 36
—— of one component, 21
T
Tachydrite, influence of pressure on the transition point of, 263
Tartrate, dimethyl, 217
——, sodium potassium, 259
Tautomeric substances, 195
Tensimeter, 91
Thallium nitrate and potassium nitrate, 192
Theorem of van't Hoff and Le Chatelier, 57
Thermometric determination of transition point, 337
Tin, 41
——, lead, bismuth, 255
—— plague, 43
——, transition point of white and grey, 41
p-Toluidine and o-nitrophenol, 213
—— and phenol, 214
Transformation of optically active substances, 220
——, suspended, 37, 69, 89, 113, 137, 155
——, velocity of, 70
Transition curve, 66
—— —— of Glauber's salt, 68, 140
—— —— of rhombic and monoclinic sulphur, 37
—— point, 34
—— —— for double salts, 258
—— ——, influence of pressure on the, 68
—— points, as fixed points in thermometry, 140
—— ——, methods of determining, 331
—— —— of polymorphic substances, 63
Triangle, graphic representation by, 235
Triethylamine and water, 101
—— ——, arrangement of curves round, 56
—— ——, changes at, 58
—— ——, ice, water, vapour, 27
—— ——, ice II., ice III., and water, 33
—— ——, metastable, 38
—— ——, monoclinic sulphur, liquid, vapour, 38
—— ——, monoclinic and rhombic sulphur, liquid, 38
—— ——, monoclinic and rhombic sulphur, vapour, 34
{351}—— ——, red phosphorus, liquid, vapour, 47
—— ——, rhombic sulphur, liquid, vapour, 38
—— —— solid, solid, vapour, 62
—— ——, white phosphorus, liquid, vapour, 48
U
Univariant systems, 16
V
Van't Hoff, theorem of, 57
Vaporization curve, 63
—— ——, interpolation and extrapolation of, 66
Vapour pressure, constancy of, and formation of compounds, 90
—— ——, dependence of, on solid phase, 88
—— ——, influence of surface tension on, 2
—— —— in three-component systems, 261
—— ——, measurement of, 91, 334
—— —— of calcium chloride solutions, 150
—— —— of small drops, 10
—— —— of sodium sulphate and water, 138
Vapour pressure of solid, solution, vapour, 126
Variability of a system, 14, 16
Variance of a system, 16
Volatile components, two, 161
W
Water, 21
——, acetic acid, chloroform, 241
——, acetone, phenol, 248
——, alcohol, ether, 246
——, ——, chloroform, 246
——, aniline, phenol, 250
——, bivariant systems of, 29
——, critical pressure of, 23
——, critical temperature of, 23
——, equilibrium between ice and, 25
——, —— between vapour and, 21
——, ether, succinic nitrile, 252
——, supercooled, 30
——, ——, vapour pressure of, 31
——, vaporization curve of, 21
——, vapour pressure of, 23
THE END
PRINTED BY WILLIAM CLOWES AND SONS, LIMITED, LONDON AND BECCLES.
[1] Except when the volume of the liquid becomes exceedingly small, in which case the surface tension exerts an influence on the vapour pressure.
[2] For reasons which will appear later (Chap. IV.), the volume of the vapour is supposed to be large in comparison with that of the solid and liquid.
[3] Ramsay and Young, Phil. Trans., 1886, 177. 87.
[4] See, more especially, Vogt, Die Silikatschmelzlösungen. (Christiania, 1903, 1904.)
[5] Trans. Connecticut Acad., 1874-1878.
[6] Lehre von der chemischen Verwandtschaft der Körper, 1777.
[7] See Ostwald's Klassiker, No. 74.
[8] Etudes sur les affinités chimiques, 1867; Ostwald's Klassiker, No. 104.
[9] Died April, 1903.
[10] For a mathematical treatment of the Phase Rule the reader is referred to the volume in this series on Thermodynamics, by F. G. Donnan.
[11] Liebig's Annalen, 1873, 170, 192; Ostwald, Lehrbuch, II. 2. 111.
[12] The action of gravity and other forces being excluded (see p. 5).
[13] It may seem as if this were a contradiction to what was said on p. 4 as to the effect of the addition of ammonia or hydrogen chloride to the system constituted by solid ammonium chloride in contact with its products of dissociation. There is, however, no contradiction, because in the case of ammonium chloride the gaseous phase consists of ammonia and hydrogen chloride in equal proportions, and in adding ammonia or hydrogen chloride alone we are not adding the gaseous phase, but only a constituent of it. Addition of ammonia and hydrogen chloride together in the proportions in which they are combined to form ammonium chloride would cause no change in the equilibrium.
[14] The vapour pressure of water in small drops is greater than that of water in mass, and the solubility of a solid is greater when in a state of fine subdivision than when in large pieces (cf. Hulett, Zeitschr. physikal. Chem., 1901, 37. 385).
[15] See Ostwald, Lehrbuch, II. 2. 476, 934; Roozeboom, Zeitschr. physikal. Chem., 1894, 15. 150; Heterogene Gleichgewichte, I. p. 16; Wegscheider, Zeitschr. physikal. Chem., 1903, 43. 89.
[16] Ostwald, Lehrbuch, II. 2. 478.
[17] See also Hoitsema, Zeitschr. physikal. Chem. 1895, 17. 651.
[18] The term "degree of freedom" employed here must not be confused with the same term used to denote the various movements of a gas molecule according to the kinetic theory.
[19] Trevor, Jour. Physical Chem., 1902, 6. 136.
[20] Ostwald, Principles of Inorganic Chemistry, translated by A. Findlay, 2nd edit., p. 7. (Macmillan, 1904.)
[21] See the volume in this series on Thermodynamics by F. G. Donnan.
[22] Pogg. Annalen, 1844, 61. 225.
[23] Mémoires de l'Acad., 26. 751.
[24] Phil. Trans. 1884, 175. 461; 1892, A, 183. 107.
[25] Bihang Svenska Akad. Handl. 1891, 17. I. 1.
[26] Abhandl. physikal.-tech. Reichsanstalt, 1900, 3. 71.
[27] Ostwald-Luther, Physiko-chemische Messungen, 2nd edit., p. 156.
[28] Annales chim. et phys., 1892 [6], 26. 425.
[29] The vapour pressure of water at 0° has recently been very accurately determined by Thiesen and Scheel (loc. cit.), and found to be 4.579 ± 0.001 mm. of mercury (at 0°), or equal to 0.006025 atm.
[30] Juhlin, Bihang Svenska Akad. Handl., 1891, 17. I. 58. See also Ramsay and Young, loc. cit.
[31] Trans. Roy. Soc. Edin., 1849, 16. 575.
[32] Proc. Roy. Soc. Edin., 1850, 2, 267.
[33] Annalen der Physik, 1899 [3], 68. 564; 1900 [4], 2. 1, 424. See also Dewar, Proc. Roy. Soc., 1880, 30. 533.
[34] The pressure of 1 atmosphere is equal to 1.033 kilogm. per sq. cm.; or the pressure of 1 kilogm. per sq. cm. is equal to 0.968 atm.
[35] Tammann, loc. cit., 1900, 2. 1, 424; cf. Goossens, Arch. néerland, 1886, 20. 449.
[36] J. Thomson, Proc. Roy. Soc., 1874, 22. 28.
[37] A field is "enclosed" by two curves when these cut at an angle less than two right angles. It may be useful to remember that an invariant system is represented by a point, a univariant system by a line, and a bivariant system by an area.
[38] Phil. Trans., 1724, 39. 78.
[39] Juhlin, loc. cit., p. 61; cf. Ramsay and Young, loc. cit.: Thiesen and Scheel, loc. cit.
[40] This small difference is due to experimental errors in the determination of the vapour pressures; a differential method betrayed no difference between the vapour pressure of ice and of water at 0°.
[41] Phil. Mag., 1874 [4], 47. 447; Proc. Roy. Soc., 1873, 22. 27.
[42] Pogg. Annalen, 1858, 103, 206.
[43] See Phil. Trans., 1884, 175, 461.
[44] This phenomenon of distillation from the supercooled liquid to the solid has been very clearly observed in the case of furfuraldoxime (V. Goldschmidt, Zeitschr. f. Krystallographie, 1897, 28. 169).
[45] Annalen der Physik, 1900 [4], 2. 1, 424.
[46] A similar triple point has been determined by Tammann in the case of phenol (Annalen der Physik, 1902 [4], 9. 249).
[47] Annales chim. et phys., 1821, 19. 414.
[48] Lehmann, Molekularphysik, I. 153.; Arzruni, Physikalische Chemie der Krystalle. (Graham-Otto, Lehrbuch der Chemie, I. 3.)
[49] Brodie, Proc. Roy. Soc., 1855, 7. 24.
[50] That solid sulphur does possess a certain vapour pressure has been shown by Hallock, who observed the formation at the ordinary temperature of copper sulphide in a tube containing copper and sulphur (Amer. Jour. Sci., 1889 [3], 37. 405). See also Zenghelis, Zeitschr. physikal. Chem., 1904, 50. 219.
[51] Zeitschr. für Krystallographie, 1884, 8. 593.
[52] Van't Hoff, Studies on Chemical Dynamics, p. 163.
[53] Reicher, loc. cit. See also Tammann, Annalen der Physik, 1899 [3], 68. 663.
[54] Tammann, Annalen der Physik, 1899 [3], 68. 633.
[55] Rec. Trav. Chim. Pays-Bas, 1887, 6. 314.
[56] Cf. van't Hoff, Lectures on Physical Chemistry, I., p. 27 (Arnold).
[57] Annalen der Physik, 1899 [3], 68. 663.
[58] Brauns, Jahrbuch für Mineralogie, 1899-1901, 13. Beilage, p. 39.
[59] Fritsche, Ber., 1869, 2. 112, 540.
[60] De mirabilibus Auscultationibus, Cap. 51 (v. Cohen, Zeitschr. physikal. Chem., 1901, 36. 513).
[61] E. Cohen and C. van Eyk, Zeitschr. physikal. Chem., 1899, 30. 601; Cohen, ibid., 1900, 33. 59; 35. 588; 1901, 36. 513; Cohen and E. Goldschmidt, ibid., 1904, 50. 225.
[62] Zeitschr. physikal. Chem., 1900, 33, 58.
[63] Stortenbeker, Zeitschr. physikal. Chem., 1889, 3. 11; Rec. Trav. Chim. Pays-Bas, 1888, 7. 152.
[64] Zincke, Ber., 1871, 4. 576.
[65] Ostwald, Zeitschr. physikal. Chem., 1897, 22. 313.
[66] Roozeboom, Das Heterogene Gleichgewicht, I. p. 177.
[67] Roozeboom, ibid., p. 179.
[68] Schrötter, Pogg. Annalen, 1850, 81. 276; Troost and Hautefeuille, Annales de Chim. et Phys. 1874 [5], 2. 153; Ann. Scient. École Norm. 1868 [2], II. 266.
[69] Pedler, Trans. Chem. Soc., 1890, 57. 599.
[70] Brodie, Trans. Chem. Soc., 1853, 5, 289.
[71] This is a familiar fact in the case of the solubility in carbon disulphide.
[72] Roozeboom, Das Heterogene Gleichgewicht, I. p. 170.
[73] Trans. Chem. Soc., 1899, 57. 734.
[74] Carnelley, Trans. Chem. Soc., 1876, 29. 489; 1878, 33. 275. V. Meyer and Riddle, Ber., 1893, 26. 2443.
[75] Riecke, Zeitschr. physikal. Chem., 1890, 6. 411.
[76] Annalen der Physik., 1898 [3], 66. 492.
[77] Zeitschr. physikal. Chem., 1899, 28. 666.
[78] See Naumann, Ber., 1872, 4. 646; Troost and Hautefeuille, Compt. rend., 1868, 66. 795; 1868, 67. 1345; Roozeboom, Das Heterogene Gleichgewicht, I. pp. 62, 171.
[79] Mitscherlich, Lieb. Annalen, 1834, 12. 137; Deville and Troost, Compt. rend., 1863, 56. 891.
[80] Beckmann, Zeitschr. physikal. Chem., 1890, 5. 79; Hertz, ibid., 6. 358.
[81] Ber., 1902, 35. 351. Cf. also, K. Schaum, Annalen der Chem., 1898, 300. 221; R. Wegscheider and Kaufler, Sitzungsber. kaiserl. Akad. Wissensch. in Wien, 1901, 110, II. 606.
[82] See also Roozeboom, Das Heterogene Gleichgewicht, I. p. 177.
[83] Annales de Chim. et Phys., 1874 [5], 2. 154.
[84] Compt. rend., 1887, 104. 1505.
[85] Compt. rend., 1868, 66. 795.
[86] Phil. Mag., 1884 [5], 18. 210. See also Roozeboom, Das Heterogene Gleichgewicht, I. p. 177.
[87] Brauns, Neues Jahrbuch für Mineralogie, 1900, 13. Beilage-Band, p. 39; Roozeboom, Das Heterogene Gleichgewicht, I. p. 181.
[88] Monatshefte, 1888, 9. 435.
[89] Gattermann, Ber., 1890, 53. 1738.
[90] Zeitschr. physikal. Chem., 1889, 4. 468; Annalen der Physik, 1900 [4], 2. 649.
[91] Quincke, Annalen der Physik, 1894 [3], 53. 613; Tammann, Annalen der Physik, 1901 [4], 4. 524; 1902, 8. 103; Rotarski, ibid., 4. 528.
[92] Annalen der Physik, 1900 [4], 2. 649.
[93] Annalen der Physik, 1902 [4], 8. 911.
[94] See, more especially, O. Lehmann, Annalen der Physik, 1900 [4], 2. 649; Reinitzer, Sitzungsber. kaiserl. Akad. zu Wien., 1888, 94. (2), 719; 97. (1), 167; Gattermann, loc. cit.; Schenck, Zeitschr. physikal. Chem., 1897, 23. 703; 1898, 25. 337; 27. 170; 1899, 28. 280; Schenck and Schneider, ibid., 1899, 29. 546; Abegg and Seitz, ibid., 1899, 29. 491; Hulett, ibid., 1899, 28. 629; Coehn, Zeitschr. Elektrochem., 1904, 10. 856: Bredig and Schukowsky, ibid., 3419. For a full account of the subject, the reader is referred to the work by Lehmann, Flüssige Kristalle (Engelmann, 1904), or the smaller monograph by Schenck, Kristallinische Flüssigkeiten und flüssige Kristalle (Engelmann, 1905).
[95] A. C. de Kock, Zeitschr. physikal. Chem., 1904, 48. 129.
[96] On account of the fact that all grades of rigidity have been realized between the ordinary solid and the liquid state, in the case both of crystalline and amorphous substances, it has been proposed to abandon the terms "solid" and "liquid," and to class bodies as "crystalline" or "amorphous," the passage from the one condition to the other being discontinuous; crystalline bodies possess a certain regular orientation of their molecules and a directive force, while in amorphous bodies these are wanting (see Lehmann, Annalen der Physik, 1900 [4], 2. 696).
[97] Hulett, loc. cit.
[98] Roozeboom, Das Heterogene Gleichgewicht, I. p. 144. See also Schenck, Kristallinische Flüssigkeiten und flüssige Kristalle, p. 8 (Engelmann, 1904).
[99] The possible number of triple points in a one-component system is given by the expression
| n(n - 1)(n - 2) | , |
| 1.2.3 |
where n is the number of phases (Riecke, Zeitschr. physikal. Chem., 1890, 6, 411). The number of triple points, therefore, increases very rapidly as the number of possible phases increases.
[100] Duhem, Zeitschr. physikal. Chem., 1891, 8. 371. Cf. Roozeboom, Das Heterogene Gleichgewicht, p. 94 ff.
[101] Roozeboom, Das Heterogene Gleichgewicht, I. p. 99.
[102] Roozeboom, Zeitschr. physikal. Chem., 1888, 2. 474.
[103] These changes can be predicted quantitatively by means of the thermodynamic equation,
| dp | = | Q | , |
| dt | T(v2 - v1) |
provided the specific volumes of the phases are known, and the heat effect which accompanies the transformation of one phase into the other.
[104] Studies on Chemical Dynamics, translated by Ewan, p. 218.
[105] Le Chatelier, Compt. rend., 1884, 99. 786.
[106] See Principles of Inorganic Chemistry, translated by Findlay, 2nd edit., p. 133. (Macmillan, 1904.)
[107] Roozeboom, Zeitschr. physikal. Chem., 1888, 2. 474.
[108] Roozeboom, Das Heterogene Gleichgewicht, I. p. 189.
[109] Roozeboom, Das Heterogene Gleichgewicht, I. p. 125. See also Zawidski, Zeitschr. physikal. Chem., 1904, 47. 727; van Eyk, ibid., 1905, 51. 720.
[110] Roberts-Austen, Proc. Roy. Soc., 63. 454; Spring, Zeitschr. physikal. Chem., 1894, 15. 65. See also p. 35.
[111] Ramsay and Young, Phil. Trans., 1884, 175. 461; Allen, Trans. Chem. Soc., 1900, 77. 413.
[112] Ramsay and Young, Phil. Trans. 1886, 177. 87.
[113] This is exemplified in the well-known experiment with the cryophorus.
[114] Tammann has, however, found that the fusion curve (solid in contact with liquid) of phosphonium chloride can be followed up to temperatures above the critical point (Arch. néer., 1901 [2], 6. 244).
[115] Phil. Mag., 1886, 21. 33. See also S. A. Moss, Physical Review, 1903, 16. 356.
[116] This is found also in the case of bismuth. See Tammann, Zeitschr. anorgan. Chem., 1904, 40. 54.
[118] Pogg. Annalen, 1850, 81. 562.
[119] Barus, Amer. Jour. Sci., 1892, 42. 125; Mack, Compt. rend., 1898, 127. 361; Hulett, Zeitschr. physikal. Chem., 1899, 38. 629.
[120] Annalen der Physik, 1899 [3], 68. 553, 629; 1900 [4], 1. 275; 2. 1; 3. 161. See also Tammann, Kristallisieren und Schmelzen (Leipzig, 1903).
[121] Ostwald, Lehrbuch, II. 2. 373; Poynting, Phil. Mag., 1881 [5], 12. 2; Planck, Wied. Annalen, 1882, 15. 446.
[122] Bakhuis Roozeboom, Das Heterogene Gleichgewicht, I. p. 91.
[123] Lussana, Il nuovo Cimento, 1895 [4], 1. 105.
[124] Tammann, Zeitschr. physikal. Chem., 1903, 46. 818.
[125] Foote, Zeitschr. physikal. Chem., 1900, 33. 740.
[126] Ostwald, Zeitschr. physikal. Chem., 1897, 22. 289.
[127] Van't Hoff, Arch, néer., 1901, 6. 471.
[128] See, for example, the determinations of the solubility of rhombic and monoclinic sulphur, by J. Meyer, Zeitschr. anorg. Chem., 1902, 33. 140.
[129] Zeitschr. physikal. Chem., 1899, 32. 506.
[130] Kastle and Reed, Amer. Chem. Jour., 1902, 27. 209.
[131] Zeitschr. physikal. Chem., 1900, 35. 581.
[132] Compt. rend., 1882, 95. 1278; 1884, 97. 1298, 1366, 1433.
[133] Zeitschr. physikal. Chem., 1893, 12. 545.
[134] Sitzungsber. Wiener Akad., 1894, 103. IIa. 226.
[135] Zeitschr. physikal. Chem., 23-29. See also Küster, ibid., 25-28.
[136] Zeitschr. physikal. Chem., 1897, 24. 152.
[137] Ibid., 1898, 27. 585.
[138] See W. Guertler, Zeitschr. anorgan. Chem., 1904, 40. 268; Tammann, Zeitschr. Elektrochem., 1904, 10. 532.
[139] E. von Pickardt, Zeitschr. physikal. Chem., 1902, 42. 17.
[140] Zeitschr. physikal. Chem., 1904, 48. 467.
[141] M. Padoa, Accad. Lincei, Atti, 1904, 13. 329.
[142] Deville, Compt. rend., 1852, 34. 561; Payen, ibid., 1852, 34. 508; Debray, ibid., 1858, 46. 576. It has also been found by Jaffé (Zeitschr. physikal. Chem., 1903, 43. 465) that when spontaneous crystallization from solution occurs, the less stable form always separates first when purification has been carried sufficiently far.
[143] Brauns, Neues Jahrbuch für Mineralogie, 1899, 13. (Beilage Band) 84.
[144] Lehrbuch, II. 2. 445. See also Principles of Inorganic Chemistry, 2nd edit., p. 210 ff.
[145] Schaum and Schönbeck, Annalen der Physik, 1902 [4], 8. 652. See also Chr. Füchtbauer, Zeitschr. physikal. Chem., 1904, 48. 549.
[146] Ramsay and Young, Phil. Trans., 1886, 177. 87.
[147] See volume in this series on Chemical Dynamics, by Dr. J. W. Mellor.
[148] Isambert, Compt. rend., 1881, 92. 919; 1882, 94. 958; 1883, 96. 643. Walker and Lumsden, Jour. Chem. Soc., 1897, 71. 428.
[149] Compt. rend., 1867, 64. 603.
[150] Compt. rend., 1883, 102. 1243.
[151] Compt. rend., 1868, 66, 1259.
[152] Horstmann, Ber., 1876, 9. 749.
[153] Loc. cit.
[154] For the reasons for choosing anhydrous salt and water instead of salt hydrate and water as components, see p. 14.
[155] See Ostwald, Lehrbuch, II. 2. 527.
[156] Ostwald, Lehrbuch, II. 2. 538.
[157] Zeitschr. physikal. Chem., 1889, 4. 43.
[158] Ber., 1876, 9. 749.
[159] See, for example, van't Hoff, Lectures on Theoretical and Physical Chemistry, I. p. 62 (Arnold).
[160] Jour. Chem. Soc., 1877, 32. 395.
[161] Hoitsema, Zeitschr. physikal. Chem., 1895, 17. 1.
[162] Zeitschr. physikal. Chem., 1887, 1. 5; 1895, 17. 52.
[163] It is important to powder the salt, since otherwise the dehydration of the hydrate and the production of equilibrium occurs with comparatively great tardiness.
[164] A chemical individual is a substance which persists as a phase of constant composition when the conditions of temperature, pressure, and composition of the other phases present, undergo continuous alteration within certain limits—the limits of existence of the substance (Wald, Zeitschr. physikal. Chem., 1897, 24. 648).
[165] Van't Hoff, Zeitschr. physikal. Chem., 1890, 5. 323; Ostwald, Lehrbuch, I. 606.
[166] That mercury does dissolve in water can be argued from analogy, say, with mercury and bromonaphthalene. At the ordinary temperature these two liquids appear to be quite insoluble in one another, but at a temperature of 280° the mercury dissolves in appreciable quantity; for on heating a tube containing bromonaphthalene over mercury the latter sublimes through the liquid bromonaphthalene and condenses on the upper surface of the tube.
[167] Phil. Mag., 1884, [5], 18. 22; 495.
[168] Wied. Annalen, 1886, 28. 305.
[169] Zeitschr. physikal. Chem., 1898, 26. 433.
[170] Rothmund, loc. cit.
[171] Rothmund, loc. cit.
[172] A similar behaviour is found in the case of diethylamine and water (R. T. Lattey, Phil. Mag., 1905, [6], 10, 397).
[173] C. S. Hudson, Zeitschr. physikal. Chem., 1904, 47. 113.
[174] Konowaloff, Wied. Annalen, 1881, 14. 219. Ostwald, Lehrbuch, II. 2. 687. Bancroft, Phase Rule, p. 96.
[175] Konowaloff, loc. cit.
[176] Roozeboom, Zeitschr. physikal. Chem., 1891, 8. 526; Rec. Trav. Chim. Pays-Bas, 1884, 3. 38.
[177] Konowaloff, loc. cit. Cf. Bancroft, Phase Rule, p. 100.
[178] Phil. Mag., 1884 [5], 18. 503.
[179] See, for example, Walker, Introduction to Physical Chemistry, 3rd edit., p. 86 (Macmillan, 1903). Consult also Young, Fractional Distillation (Macmillan, 1903), or Kuenen, Verdampfung und Verflüssigung von Gemischen (Barth, 1906), where the subject is fully treated.
[180] Since this is the only phase of variable composition present.
[181] E. von Stackelberg, Zeitschr. physikal. Chem., 1896, 20. 337. If the change of volume which accompanies solution, and the heat effect are known, the quantitative change of the solubility with the pressure can be calculated (Braun, Zeitschr. physikal. Chem., 1887, 1. 259).
[182] Van't Hoff, Arch. néerland. 1901 [2], 6. 471.
[183] Tilden and Shenstone, Phil. Trans. 1884, 175. 23; Hulett and Allen, Jour. Amer. Chem. Soc. 1902, 24. 667; Andreä, Jour. prak. Chem. 137. 474; Lumsden, Jour. Chem. Soc., 1902, 81. 350; Mylius and v. Wrochem, Ber. 1900, 33. 3689.
[184] E. von Stackelberg, Zeitschr. physikal. Chem. 1896, 20. 159; 1898, 26. 533; Lumsden, Jour. Chem. Soc., 1902, 81. 350; Holsboer, Zeitschr. physikal. Chem., 1902, 39. 691.
[185] Reicher and van Deventer, Zeitschr. physikal. Chem. 1890, 5. 559; cf. Ostwald, Lehrbuch, II. 2. 803.
[186] It has been shown that the formula of Ramsay and Young (p. 66) can be applied (with certain restrictions) to the interpolation and extrapolation of the solubility curve of a substance provided two (or three) points on the curve are known. In this case T, T1, etc., refer to the temperatures at which the two substances—one the solubility curve of which is known, the other the solubility curve of which is to be calculated—have equal solubilities, instead of, as in the previous case, equal vapour pressures. (Findlay, Proc. Roy. Soc., 1902, 69. 471; Zeitschr. physikal. Chem., 1903, 42. 110.)
[187] W. Müller and P. Kaufmann, Zeitschr. physikal. Chem. 1903, 42. 497.
[188] W. O. Rabe, Zeitschr. physikal. Chem., 1901, 38. 175.
[189] With regard to the limits of supersaturation and the spontaneous crystallization of the solute from supersaturated solutions, see Jaffé, Zeitschr. physikal. Chem., 1903, 43. 565, and the very interesting paper by Miers and Isaac, Trans. Chem. Soc., 1906, 89. 413.
[190] Annales chim. phys., 1894 [7], 2. 524.
[191] Phil. Trans., 1884, 175. 23.
[192] Hissink, Zeitschr. physikal. Chem., 1900, 32. 543.
[193] Zeitschr. physikal. Chem., 1903, 43. 313.
[194] Guthrie, Phil. Mag., 1875, [4], 49. 1; 1884, [5], 17. 462.
[195] See Roloff, Zeitschr. physikal. Chem., 1895, 17. 325; Guthrie, loc. cit.
[196] Guthrie, Phil. Mag., loc. cit. Cf. Ostwald, Lehrbuch, II. 2. 843.
[197] Guthrie, Phil. Mag., 1875 [4], 49. 269.
[198] Ber., 1877, 20. 2223.
[199] Silz-Ber. Wien. Akad., 1880, 81. II. 1058.
[200] Guthrie, Phil. Mag., 1875 [4], 49. 206.
[201] If in the neighbourhood of the cryohydric point solution should be accompanied by an evolution of heat, then as the solubility would in that case increase with fall of temperature, salt would pass into solution.
[202] Walker, Zeitschr. physikal. Chem., 1890, 5. 193.
[203] Zeitschr. physikal. Chem., 1897, 23. 418.
[204] Provided the solid nitrile is not present in too great excess.
[205] Wied. Annalen, 1886, 28. 328. Cf. Ostwald, Lehrbuch, II. 2. 872.
[206] Walker, Zeitschr. physikal. Chem., 1890, 5. 193. Schreinemakers, ibid., 1897, 23. 417. Roozeboom, Rec. trav. chim. Pays-Bays, 1889, 8. 257. Bruner, Zeitschr. physikal. Chem., 1897, 23. 542.
[207] Van't Hoff, Lectures on Theoretical Chemistry, I. p. 42. Ostwald, Lehrbuch, II. 2. 824.
[208] Ostwald, Principles of Inorganic Chemistry, translated by A. Findlay, 2nd edit., p. 453 (Macmillan, 1904); Skirrow and Calvert, Zeitschr. physikal. Chem., 1901, 37. 217.
[209] Vide Loewel, Annales chim. phys., 1857 [3], 49. 32. Cf. Löwenherz, Zeitschr. physikal. Chem., 1895, 18. 82.
[210] Loewel, loc. cit. Gay-Lussac, Annales chim. phys., 1819, 11. 296. For the solubility at higher temperatures, see Tilden and Shenstone, Phil. Trans., 1884, 175. 23. Étard, Annales chim. phys., 1894 [7], 2. 548.
[211] Richards, Zeitschr. physikal. Chem., 1898, 26. 690; Richards and Wells, ibid., 1903, 43. 465. This temperature is not quite the same as that of the quadruple point anhydrous salt—hydrated salt—solution—vapour, because the latter is the temperature at which the system is under the pressure of its own vapour. Since, however, the influence of pressure on the solubility is very slight (p. 107), the position of the two points will not be greatly different. The quadruple point was found by Cohen (Zeitschr. physikal. Chem., 1894, 14. 90) to be 32.6° and 30.8 mm. of mercury.
[212] Van't Hoff and van Deventer, Zeitschr. physikal. Chem., 1887, 1. 185. Cf. Cohen, ibid., 1894, 14. 88.
[213] Debray, Compt. rend., 1868, 66. 194.
[214] Richards, Zeitschr. physikal. Chem., 1898, 26. 690. A number of other salt hydrates, having transition-points ranging from 20° to 78°, which might be used for the same purpose, have been given by Richards and Churchill, ibid., 1899, 28. 313.
[215] Zeitschr. physikal. Chem., 1903, 46. 818.
[216] Van't Hoff, Lectures on Physical Chemistry, I. p. 67.
[217] Cohen, Zeitschr. physikal. Chem., 1894, 14. 90.
[218] Ziz, Schweigger's Journal, 1815, 15. 166. See Ostwald, Lehrbuch, II. 2. 717.
[219] See, for example, the solubility determinations published in Wissenschaftliche Abhandl. der physikalisch-technischen Reichsanstalt, Vol. III., or in the Berichte, for the years 1897-1901.
[220] Meusser, Ber., 1901, 34. 2440.
[221] Mylius and von Wrochem, Ber., 1900, 33. 3693.
[222] Walker and Fyffe, Jour. Chem. Soc., 1903, 83. 180.
[223] Monatshefte, 1887, 8. 601.
[224] The equilibria between calcium chloride and water have been most completely studied by Roozeboom (Zeitschr. physikal. Chem., 1889, 4. 31).
[225] Hammerl, Sitzungsber. Wien. Akad., 2te Abteil, 1878, 78. 59. Roozeboom, Zeitschr. physikal. Chem., 1889, 4. 31.
[226] Lidbury, Zeitschr. physikal. Chem., 1902, 39. 453. The curvature at the melting point is all the greater the more the compound is dissociated into its components in the liquid state. If the compound is completely undissociated, even in the vapour phase, the two branches of the curve will intersect, (e.g. pyridine and methyl iodide; Aten, Versl. Konink. Akad. Wetensch. Amsterdam, 1905, 13. 462). The smaller the degree of dissociation, therefore, the sharper will be the bend. (See Stortenbeker, Zeitschr. physikal. Chem., 1892, 10. 194.) From the extent of flattening of the curve, it is also possible, with some degree of approximation, to calculate the degree of dissociation of the substance in the fused state. (See Roozeboom and Aten, Zeitschr. physikal. Chem., 1905, 53. 463; Kremann, Zeitschr. Elektrochem., 1906, 12. 259.)
[227] See Roozeboom, Zeitschr. physikal. Chem., 1889, 4. 31.
[228] Tammann, Wied. Annalen, 1899, 68. 577.
[229] Duhem, Journ. Physical Chem., 1898, 2. 31.
[230] Gibbs, Trans. Conn. Acad., 3. 155; Saurel, Journ. Phys. Chem., 1901, 5. 35.
[231] In the case of the fusion of a compound of two components with formation of a liquid phase of the same composition, the temperature is a maximum; in the case of liquid mixtures of constant boiling-point, the temperature may be a minimum (p. 105).
[232] Roozeboom, Zeitschr. physikal. Chem., 1892, 10. 477. The formula of ferric chloride has been doubled, in order to avoid fractions in the expression of the water of crystallization.
[233] Roozeboom, Zeitschr. physikal. Chem., 1892, 10. 477.
[234] A similar series of hydrates is formed by zinc chloride and water (Dietz and Mylius, Zeitschr. anorg. Chem., 1905, 44. 209).
[235] Meyerhoffer, Ber., 1897, 30. 1810.
[236] Walden, Ber., 1899, 32. 2863.
[237] Zeitschr. physikal. Chem., 1903, 42. 432.
[238] This composition was also confirmed by measurements of the vapour pressure (cf. p. 90).
[239] Since all substances are no doubt volatile to a certain extent at some temperature, it is to be understood here that the substances are appreciably volatile at the temperature of the experiment.
[240] For a general discussion of the partial pressures in a system of two components, see Bancroft, Journ. Physical Chem., 1899, 3. 1.
[241] Zeitschr. physikal. Chem., 1889, 3. 11; Rec. trav. chim. Pays-Bas, 1888, 7. 152.
[242] The composition of a solution
is represented symbolically by placing a double wavy line between the
symbols of the components, and indicating the number of atoms present in
the ordinary manner: thus, I Clx represents a solution containing x
atoms of chlorine to one atom of iodine (Roozeboom, Zeitschr.
physikal. Chem., 1888, 2. 450).
[243] Since iodine monochloride in the liquid state is only very slightly dissociated, the bend at C is very sharp (see p. 147, footnote). See also the investigation of the system pyridine and methyl iodide (Aten, Versl. Konink. Akad. Wetensch. Amsterdam, 1905, 13. 462).
[244] This upper branch of the curve is not shown in the figure, as the ordinate corresponding to 30° would be very great.
[245] Stortenbeker, Zeitschr. physikal. Chem., 1889, 3. 22.
[246] Ramsay and Young, Journ. Chem. Soc., 1886, 49. 458.
[247] Van't Hoff, Lectures on Physical Chemistry, I. p. 77 (Arnold).
[248] This is different from what we found in the case of non-volatile solutes (p. 126). In the present case, the partial pressure of the iodine in the vapour will be lowered by addition of chlorine, but the total pressure is increased.
[249] The diminution of volume is supposed to be carried out at constant temperature. The pressure and the composition of the phases must, therefore, remain unchanged, and only the relative amounts of these can undergo alteration.
[250] At point b the ratio of chlorine to iodine in the solution is less than in the monochloride, so that by the separation of this the excess of chlorine yielded by the condensation of the vapour is removed.
[251] Roozeboom, Rec. trav. chim. Pays-Bas, 1884, 3. 29; 1885, 4. 65; Zeitschr. physikal. Chem., 1888, 2. 450.
[252] Two curves "enclose" a field when they form with one another an angle less than two right angles.
[253] Roozeboom, Zeitschr. physikal. Chem., loc. cit.
[254] Van't Hoff, Zeitschr. physikal. Chem., 1890, 5. 323.
[255] Bancroft has proposed to restrict the term "occlusion" to the formation of solid solutions, and to apply "adsorption" only to effects which are primarily due to surface tension. Such a distinction, however, would probably be very difficult to carry through, for although adsorption may, in large measure, be due to surface tension, the behaviour of adsorbed substances is similar to that of substances existing in solid solutions.
[256] Tammann, Wied. Annalen, 1897, 63. 16; Zeitschr. physikal. Chem., 1898, 27. 323.
[257] See, for example, Chappuis, Wied. Annalen, 1881, 12. 161; Joulin, Annal. chim. phys., 1881, [5], 22. 398; Kayser, Wied. Annalen, 1881, 12. 526.
[258] Hoitsema, Zeitschr. physikal. Chem., 1895, 17. 1.
[259] Annales chim. phys., 1874, [5], 2. 279.
[260] Hoitsema, Zeitschr. physikal. Chem., 1895, 17. 1; Dewar, Phil. Mag., 1874, [4], 47, 324, 342; Mond, Ramsay and Shields, Proc. Royal Soc., 1897, 62. 290.
[261] Loc. cit.
[262] It is noteworthy that the form of curve obtained for hydrogen and palladium bears a striking resemblance to that for the dehydration of colloids containing absorbed water, e.g. silicic acid (vide van Bemmelen, Zeitschr. anorg. Chem., 1897-1900. Cf. Zacharias, Zeitschr. physikal. Chem., 1902, 39. 480).
[263] Zeitschr. physikal. Chem., 1890, 5. 322.
[264] Küster, Zeitschr. physikal. Chem., 1895, 17. 367. Bodländer, Neues Jahrbuch f. Mineralogie, 1898-99, Beilage Band, 12. 92.
[265] Bruni and Padoa, Atti Accad. Lincei, 1902 [5], 11. 1; 565.
[266] Roozeboom, Zeitschr. physikal. Chem., 1899, 30. 385; Bruni, Rend. Accad. Lincei, 1898, 2. 138, 347. For a general account of "solid solutions" the reader is referred to Bruni, "Ueber feste Lösungen" (Ahrens'sche Sammlung), and to Bodländer, loc. cit. For the formation and transformation of liquid mixed crystals, see A. C. de Kock, Zeitschr. physikal. Chem., 1904, 48. 129.
[267] In discussing the various systems which may be obtained here, Roozeboom (loc. cit.) made use of the variation of the thermodynamic potential (p. 29) with the concentration. In spite of the advantages which such a treatment affords, the temperature-concentration diagram has been adopted as being more readily understood and as more suitable for an elementary discussion of the subject.
[268] These curves are also called the "liquidus" and the "solidus" curve respectively.
[269] Küster, Zeitschr. physikal. Chem., 1895, 17. 360.
[270] Küster, ibid., 1891, 8. 589.
[271] It should be remarked that the behaviour described here will hold strictly only when the solid mixed crystals undergo change sufficiently rapidly to be always in equilibrium with the liquid. This, however, is not always the case (see Reinders, Zeitschr. physikal. Chem., 1900, 32. 494; van Wyk, Zeitschr. anorg. Chem., 1905, 48. 25), and complete solidification will not in this case take place at the temperature corresponding with the line dc in Fig. 50, but only at a lower temperature.
[272] Adriani, Zeitschr. physikal. Chem., 1900, 33. 469.
[273] Reinders, Zeitschr. physikal. Chem., 1900, 32. 494.
[274] Hissink, Zeitschr. physikal. Chem., 1900, 32. 542.
[275] Van Eyk, Zeitschr. physikal. Chem., 1899, 30. 430.
[276] Cady, Journ. Physical. Chem., 1899, 3. 127.
[277] See Roberts-Austen and Stansfield, Rapports du congrès international de physique, 1900, I. 363.
[278] Heycock and Neville, Proc. Roy. Soc., 1903, 71. 409. For the partial liquefaction of mixed crystals on cooling, see also A. C. de Kock (Zeitschr. physikal. Chem., 1904, 48. 129).
[279] Armstrong, Watt's Dictionary of Chemistry (Morley and Muir), III., p. 88. See also Lowry, Jour. Chem. Soc., 1899, 75. 211.
[280] See Bancroft, Journ. Physical Chem., 1898, 2. 143; Roozeboom, Zeitschr. physikal. Chem., 1899, 28. 288.
[281] Hylotropic substances are such as can undergo transformation into other substances of the same composition (Ostwald, Lehrbuch, II. 2. 298).
[282] Also called Equilibrium Point (Lowry).
[283] For a discussion of these systems, see Roozeboom, Zeitschr. physikal. Chem., loc. cit.
[284] See Bancroft, loc. cit., p. 147; Wegscheider, Sitzungsber. Wiener Akad., 1902, 110. 908.
[285] Reference may be made here to the term "stability limit," introduced by Knorr (Annalen, 1896, 293. 88) to indicate that temperature above which liquefaction and isomeric change takes place. As employed by Knorr and others, the term does not appear to have a very precise meaning, since it is used to denote, not the temperature at which these changes can occur, but the temperature at which the change is rapid (vide Annalen, 1896, 293. 91; 1899, 306. 334); and the introduction of an indefinite velocity of change renders the temperature of the stability limit also somewhat indefinite. The definiteness of the term is also not a little diminished by the fact that the "limit" can be altered by means of catalytic agents. Since, as we have seen, the stable modification can always undergo isomeric change and liquefy at temperatures above the natural freezing point, but not below that point; and, further, the less stable modification can undergo isomeric transformation and liquefy at temperatures above the eutectic point, but will not liquefy at temperatures below that; it seems to the author that it would be more precise to identify these two points—the natural freezing point and the eutectic point—which are not altered by catalytic agents, with the "stability limits" of the stable and unstable modification respectively. A perfectly definite meaning would thereby be given to the term. In the case of those substances which do not undergo appreciable isomeric change at the temperature of the melting point, the stability limits would be the points G and H, Fig. 60.
[286] Cameron, Journ. Physical Chem., 1898, 2. 409.
[287] Carveth, Journ. Phys. Chem., 1898, 2. 159. See also Dutoit and Fath, Journ. chim. phys., 1903, 1. 358; Findlay, Trans. Chem. Soc., 1904, 85. 403.
[288] Hollmann, Zeitschr. physikal. Chem., 1903, 43. 129.
[289] For other examples of the application of the Phase Rule to isomeric substances, see Journ. Physical Chem., vols. 2. et seq.; Findlay, Trans. Chem. Soc., 1904, 85. 403.
[290] See Roozeboom, Zeitschr. physikal. Chem., 1899, 30. 410.
[291] See also Saposchnikoff, Zeitschr. physikal. Chem., 49. 688; Kremann, Monatshefte, 1904, 25. 1215, 1271, 1311.
[292] J. C. Philip, Journ. Chem. Soc., 1903, 83. 821.
[293] Cf. also Paterno and Ampolla, Gazzetta chim. ital., 1897, 27. 481.
[294] Philip, loc. cit., p. 826.
[295] Philip, loc. cit., p. 829. Compare curves for iodine monochloride, Fig. 42, p. 162.
[296] Kuriloff, Zeitschr. physikal. Chem., 1897, 23. 676.
[297] Ladenburg, Ber., 1895, 28. 163; 1991.
[298] Roozeboom, Zeitschr. physikal. Chem., 1899, 28. 494; Adriani, ibid., 1900, 33. 453.
[299] Adriani, Zeitschr. physikal. Chem., 1900, 33. 453.
[300] A. Findlay and Miss E. Hickmans.
[301] Kipping and Pope, Journ. Chem. Soc., 1897, 71. 993.
[302] See Roozeboom, Zeitschr. physikal. Chem., 1899, 28. 512; Adriani, ibid., 1900, 33. 473; 1901, 36. 168.
[303] In this connection reference should be made more especially to the paper by Roberts-Austen and Stansfield, "Sur la constitution des alliages métalliques," in the Rapports du congrès international de physique, 1900, I. 363; J. A. Mathews, Journ. of the Franklin Inst., 1902; Gautier, Compt. rend., 1896, 123. 109; Roberts-Austen, "Reports of the Alloys Research Committee," in Journ. Inst. Mechan. Engineers, from 1891 to 1904; and the papers by Heycock and Neville, published in the Journ. Chem. Soc., and the Trans. Roy. Soc. since 1897; also Neville, Reports of the British Association, 1900, p. 131. Reference must also be made to the important metallographic investigations by Tammann and his pupils, and of Kurnakoff (Zeitschr. anorgan. Chem., vol. 40 and onwards), and also to those of Shepherd, Journ. Physical Chem., 8. A bibliography of the alloys is given in Zeitschr. anorgan. Chem., 1903, 35. 249.
[304] Kurnakoff and Puschin, Zeitschr. anorgan. Chem., 1902, 30. 104.
[305] Gautier, Bull. Soc. d'Encouragement, 1896 [5], 1. 1312.
[306] Heycock and Neville, Phil. Trans., 1900, 194. 201.
[307] Gautier, loc. cit. See also Roberts-Austen and Rose, Proc. Roy. Soc., 1903, 71. 161.
[308] Heycock and Neville, Journ. Chem. Soc., 1897, 71. 414.
[309] See Roberts-Austen, Introduction to Metallurgy, 5th edit., p. 102; Bakhuis Roozeboom, Journ. Iron and Steel Inst., 1900, II. 311; Zeitschr. physikal. Chem., 1900, 34. 437; von Jüptner, Siderology, p. 223 (translation by C. Salter); van't Hoff, Zinn, Gips, und Stahl, p. 24, or Acht Vorträge über physikalische Chemie, p. 37. Further, Roozeboom, Zeitschr. Elektrochem., 1904, 10. 489; E. Heyn, ibid., p. 491; Carpenter and Keeling, Journ. Iron and Steel Inst., 1904, 65. 224.
[310] The melting point of pure iron is given by Carpenter and Keeling (Journ. Iron and Steel Inst., 1904, 65. 224) as 1505°.
[311] Zeitschr. für Elektrochem., 1904, 10. 491.
[312] See also Hiorns, Journ. Soc. Chem. Ind., 1906, 25. 50.
[313] Bancroft, Jour. Physical Chem., 1902, 6. 178; Bell and Taber, ibid., 1906, 10. 120.
[314] The method to be followed when the third component enters into the solid phase will be explained later.
[315] Tammann, Zeitschr. anorg. Chem., 1903, 37. 303; 1905, 45. 24. Reference may be made here to the registering pyrometer of Kurnakoff, Zeitschr. anorg. Chem., 1904, 42. 184.
[316] In this connection, see Doelter, Physikalisch-chemisch Mineralogie (Barth, 1901); Meyerhoffer, Zeitschr. f. Kristallographie, 1902, 36. 593; Guthrie, Phil. Mag., 1884 [5], 17. 479; Le Chatelier, Compt. rend., 1900, 130. 85; and especially E. Baur, Zeitschr. physikal. Chem., 1903, 42. 567; J. H. L. Vogt, Zeitschr. Elektrochem., 1903, 9. 852, and Die Silikatschmelzlösungen, Parts I. and II. (Christiania, 1903, 1904). See also N. V. Kultascheff, Zeitschr. anorg. Chem., 1903, 35. 187.
[317] G. G. Stokes, Proc. Roy. Soc., 1891, 49. 174; Gibbs, Trans. Conn. Acad., 1876, 3. 176; Roozeboom, Zeitschr. physikal. Chem., 1894, 15. 147.
[318] This figure has been taken from Ostwald's Lehrbuch, II. 2. 984.
[319] Roozeboom, Zeitschr. physikal. Chem., 1893, 12. 369.
[320] C. R. A. Wright, Proc. Roy. Soc., 1891, 49. 174; 1892, 50. 375.
[321] The distribution coefficient will not remain constant because, apart from other reasons, the mutual solubility of chloroform and water is altered by the addition of the acid.
[322] Bancroft, Physical Review, 1895, 3. 21; Schreinemakers, Zeitschr. physikal. Chem., 1897, 23. 652, and subsequent volumes.
[323] C. R. A. Wright, Proc. Roy. Soc., 1889-1893.
[324] C. R. A. Wright, Proc. Roy. Soc., 1892, 50. 390.
[325] Bodländer, Berg- und Hüttenmänn. Ztg., 1897, 56. 331.
[326] C. R. A. Wright, Proc. Roy. Soc., loc. cit.
[327] Schreinemakers, Zeitschr. physikal. Chem., 1900, 33. 78.
[328] Schreinemakers, Zeitschr. physikal. Chem., 1898, 27. 95.
[329] Schreinemakers, Zeitschr. physikal. Chem., 1899, 29. 577.
[330] Schreinemakers, Zeitschr. physikal. Chem., 1898, 25. 543.
[331] Charpy, Compt. rend., 1898, 126. 1569. Compare the curves for the system KNO3—NaNO3—LiNO3 (H. R. Carveth, Journ. Physical Chem., 1898, 2. 209). Also alloys of Pb—Sn—Bi (E. S. Shepherd, Journ. Physical Chem., 1902, 6. 527).
[332] It should be remembered that in the triangular diagram a line parallel to one of the sides indicates, at a given temperature, a constant amount of the component represented by the opposite corner of the triangle; and, hence, points in a plane, parallel to one face of a right prism, will indicate for different temperatures, variation in the amounts of two components, but constancy in the amount of the third.
[333] Gazzetta chim. ital., 1898, 28. II. 520.
[334] Bruni, Gazzetta chim. ital., 1898, 28. II. 508; 1900, 30. I. 35.
[335] Zeitschr. physikal. Chem., 1900, 36. 168.
[336] For a discussion of these systems, see van't Hoff, Bildung und Spaltung von Doppelsalzen (Leipzig, 1897).
[337] Van Leeuwen, Zeitschr. physikal. Chem., 1897, 23. 35.
[338] Meyerhoffer, Zeitschr. physikal. Chem., 1889, 3. 336; 1890, 5. 97.
[339] Reicher, Zeitschr. physikal. Chem., 1887, 1. 220.
[340] For other examples of the formation and decomposition of double salts at a transition point, the reader is referred to the work by van't Hoff, already cited, on the Bildung und Spaltung von Doppelsalzen; or to Bancroft, Phase Rule, p. 180.
[341] Bancroft, Phase Rule, p. 183.
[342] Roozeboom, Zeitschr. physikal. Chem., 1888, 2. 514.
[343] The influence of pressure on the transition point in the case of tachydrite has been determined by van't Hoff, Kenrick, and Dawson (Zeitschr. physikal. Chem., 1901, 39. 27, 34; van't Hoff, Zur Bildung der ozeanischen Salzablagerungen, I. p. 66—Brunswick, 1905). This salt is formed from magnesium chloride and calcium chloride at 22°, in accordance with the equation—
2MgCl2.6H2O + CaCl2.6H2O = Mg2CaCl6.12H2O + 6H2O
Increase of pressure raises the transition point, because the formation of tachydrite is accompanied by increase of volume; the elevation being 0.016° for an increase of pressure of 1 atm. The number calculated from the theoretical formula (p. 57) is 0.013° for 1 atm.
If one calculates the influence of the pressure of sea-water on the temperature of formation of tachydrite (which is of interest on account of the natural occurrence of this salt), it is found that a depth of water of 1500 metres, exerting a pressure of 180 atm., would alter the temperature of formation of tachydrite by only 3°. The effect is, therefore, comparatively unimportant.
[344] Roozeboom, Zeitschr. physical. Chem., 1887, 1. 227.
[345] Zeitschr. physical. Chem., 1887, 1. 227.
[346] Van't Hoff and Müller, Ber., 1898, 31. 2206.
[347] Van't Hoff and van Deventer, Zeitschr. physikal. Chem., 1887, 1. 165.
[348] For a full discussion of the solubility relations of sodium ammonium racemate, see van't Hoff, Bildung und Spaltung von Doppelsalzen, p. 81.
[349] Annales chim. phys., 1848 [3], 24. 442.
[350] See Van't Hoff and van Deventer, Zeitschr. phys. Chem., 1887, 1. 165.
[351] Meyerhoffer, Zeitschr. physikal. Chem., 1890, 5. 121.
[352] Roozeboom, Zeitschr. physikal. Chem., 1888, 2. 518.
[353] Meyerhoffer, Zeitschr. physikal. Chem., 1890, 5. 109. On the importance of the transition interval in the case of optically active substances, see Meyerhoffer, Ber., 1904, 37. 2604.
[354] In connection with this chapter, see, more especially, van't Hoff, Bildung und Spaltung von Doppelsalzen, p. 3, ff.; Roozeboom, Zeitschr. physikal Chem., 1892, 10. 158; Bancroft, Phase Rule, p. 201; 209.
[355] The same restriction must be made here as was imposed in the preceding chapter, namely, that the two salts in solution give a common ion.
[356] For example, addition of ammonium chloride to solutions of ferric chloride (Roozeboom, Zeitschr. physikal. Chem., 1892, 10. 149).
[357] It must, of course, be understood that the temperature is on that side of the transition point on which the double salt is stable.
[358] Excess of the double salt must be taken, because otherwise an unsaturated solution might be formed, and this would, of course, not deposit any salt.
[359] Meyerhoffer, Ber., 1904, 37. 2605.
[360] Meyerhoffer, Ber., 1897, 30. 1809.
[361] Meyerhoffer, Ber., 1904, 37. 2604.
[362] Bancroft, Phase Rule, p. 203; Roozeboom, Zeitschr. physikal. Chem., 1891, 8. 504, 531; Stortenbeker, ibid., 1895, 17. 643; 1897, 22. 60; 1900, 34. 108.
[363] Roozeboom, Zeitschr. phys. Chem., 1899, 28. 494; Ber., 1899, 32. 537.
[364] As, for instance, strychnine racemate, a compound of racemic acid with the optically active strychnine. This would be resolved into strychnine d-tartrate and strychnine l-tartrate, which are not enantiomorphous forms.
[365] Van't Hoff and Meyerhoffer, Zeitschr. physikal Chem., 1898, 27. 75; 1899, 30. 86. Fig. 113 is taken from the latter paper.
[366] Solid models constructed of plaster of Paris can be obtained from Max Kaehler and Martini, Berlin.
[367] Instead of the present method of obtaining potassium chloride by decomposing carnallite with water, advantage might be taken of the fact that carnallite when heated to 168° undergoes decomposition with separation of three-fourths of the potassium chloride (van't Hoff, Acht Vorträge über physikalische Chemie, 1902, p. 32).
[368] Roozeboom and Schreinemakers, Zeitschr. physikal. Chem., 1894, 15. 588.
[369] These curves represent only portions of the isotherms, since the systems in which a ternary solution is in equilibrium with solid hydrogen chloride or a hydrate, have not been investigated.
[370] The numbers printed beside the points on the curves refer to the number of the experiment in the original paper.
[371] Lash, Miller and Kenrick, Journ. Physical. Chem., 1903, 7. 259; Allan, Amer. Chem. Journ., 1901, 25. 307.
[372] Allan, Amer. Chem. Journ., 1901, 25. 307.
[373] Hoitsema, Zeitschr. physikal. Chem., 1895, 17. 651; Allan, loc. cit.
[374] Rutten, Zeitschr. anorgan. Chem., 1902, 30. 342. Compare the system BeO—SO3—H2O; Parsons, Zeitschr. anorgan. Chem., 1904, 42. 250.
[375] Zeitschr. anorgan. Chem., 1904, 40. 146.
[376] Schreinemakers, Zeitschr. physikal. Chem., 1893, 11. 76; Bancroft, Journ. Physical Chem., 1902, 6. 179.
[377] Zeitschr. anorgan. Chem., 1904, 40. 148.
[378] Zeitschr. physikal. Chem., 1903, 43. 354.
[379] These equilibria were obtained by Boudouard, Annales chim. phys., 1901 [7], 24. 5. See also Hahn, Zeitschr. physikal. Chem., 1903, 42. 705; 44. 513.
[380] G. Preuner, Zeitschr. physikal. Chem., 1903, 47. 385.
[381] See Hahn, Zeitschr. physikal. Chem., 1903, 42. 705; 44. 513; Boudouard, Bull. Soc. chim., [3], 25. 484; Bodländer, Zeitschr. f. Elektrochem., 1902, 8. 833; R. Schenck and Zimmermann, Ber., 1903, 36. 1231, 3663; Schenck and Heller, ibid., 1905, 38. 2132; Zeitschr. f. Elektrochem., 1903, 9. 691; Haber, Thermodynamik technischer Gasreaktionen, p. 293 (Munich, 1903).
[382] A very useful summary of the investigations carried out by van't Hoff and his pupils on the formation of the Stassfurt salt-beds is given by E. F. Armstrong, in the Reports of the British Association for 1901, p. 262. See also van't Hoff, Zur Bildung der ozeanischen Salzablagerungen (Brunswick, 1905).
[383] See especially Meyerhoffer, Silzungsber. Wien. Akad., 1895, 104. II. b, 840; Meyerhoffer and Saunders, Zeitschr. physikal. Chem., 1899, 28. 453; 31. 370. The investigation of the equilibria between reciprocal salt-pairs alone (three-component systems) is of great importance for the artificial preparations of minerals, as also in analytical chemistry for the proper understanding of the methods of conversion of insoluble systems into soluble by fusion (see Meyerhoffer, Zeitschr. physikal. Chem., 1901, 38. 307).
[384] See Meyerhoffer, Zeitschr. physikal. Chem., 1899, 28. 459.
[385] Compare the reciprocal salt-pair NaCl—NH4HCO3 (p. 321). In this case the upper limit of the transition interval was found by extrapolation of the solubility curve for NaHCO3 + NH4Cl + NH4HCO3 and NaHCO3 + NH4Cl + NaCl to be 32° (Fedotieff, Zeitschr. phys. Chem., 1904, 49. 179).
[386] Löwenherz, Zeitschr. physikal. Chem., 1894, 13. 464.
[387] Meyerhoffer and Saunders, Zeitschr. physikal. Chem., 1899, 28. 479.
[388] As the quantities of the salts are expressed in equivalent gram-molecules, the molecule of sodium and potassium chloride must be doubled in order to be equivalent to sodium sulphate and potassium sulphate.
[389] Sitz-Ber. der kgl. preuss. Akad. der Wiss., 1903, p. 359. Van't Hoff, Zur Bildung der ozeanischen Salzablagerungen, I. p. 34 (Brunswick, 1905).
[390] Zeitschr. für Kristallographie, 1904, 39. 155.
[391] Meyerhoffer and Saunders, Zeitschr. physikal. Chem., 1899, 28. 479.
[392] Zeitschr. physikal. Chem., 1904, 49. 162.
[393] Another commercial process, in the study of which good service is done by the Phase Rule, is the caustification of the alkali salts (G. Bodländer, Zeitschr. für Elektrochem., 1905, 11. 186; J. Herold, ibid., 418).
[394] Zeitschr. physikal. Chem., 1900, 35. 32.
[395] Mention may also be made here of the equilibria between magnesium carbonate and potassium carbonate, although these do not form a reciprocal salt-pair (Auerbach, Zeitschr. für Elektrochem., 1904, 10. 161).
[396] O. N. Witt and K. Ludwig, Ber., 1903, 36. 4384; Meyerhoffer, ibid., 1904, 37. 261, 1116.
[397] Zeitschr. physikal. Chem., 1905, 53. 513. Compare also, ibid., 1903, 38. 307.
[398] See Schwarz, Beiträge zur Kenntnis der umkehrbaren Umwandlungen polymorpher Korper (Göttingen, 1892); or, Roozeboom, Heterogen. Gleichgewicht, I. p. 125. Also Barnes and Cooke, Journ. Physical Chem., 1902, 6. 172.
[399] Van't Hoff and van Deventer, Zeitschr. physikal. Chem., 1887, 1. 173.
[400] Reicher, Zeitschr. für Krystallographie, 1884, 8. 593.
[401] Zeitschr. physikal. Chem., 1895, 17. 153.
[402] Zeitschr. physikal. Chem., 1899, 28. 464.
[403] Meyerhoffer and Saunders, ibid., p. 466.
[404] See Van Eyk, Zeitschr. physikal. Chem., 1899, 30. 446.
[405] See in this connection the volume in this series on Electro-chemistry, by Dr. R. A. Lehfeldt.
[406] Barnes and Cooke, Journ. Physical Chem., 1902, 6. 172.
[407] For a description and explanation of these, the reader should consult the volume in this series by Dr. Lehfeldt on Electro-chemistry; and van't Hoff, Bildung und Spaltung von Doppelsalzen, p. 48 ff.
***END OF THE PROJECT GUTENBERG EBOOK THE PHASE RULE AND ITS APPLICATIONS***
******* This file should be named 34457-h.txt or 34457-h.zip *******
This and all associated files of various formats will be found in:
http://www.gutenberg.org/3/4/4/5/34457
Updated editions will replace the previous one--the old editions will be renamed.
Creating the works from public domain print editions means that no one owns a United States copyright in these works, so the Foundation (and you!) can copy and distribute it in the United States without permission and without paying copyright royalties. Special rules, set forth in the General Terms of Use part of this license, apply to copying and distributing Project Gutenberg-tm electronic works to protect the PROJECT GUTENBERG-tm concept and trademark. Project Gutenberg is a registered trademark, and may not be used if you charge for the eBooks, unless you receive specific permission. If you do not charge anything for copies of this eBook, complying with the rules is very easy. You may use this eBook for nearly any purpose such as creation of derivative works, reports, performances and research. They may be modified and printed and given away--you may do practically ANYTHING with public domain eBooks. Redistribution is subject to the trademark license, especially commercial redistribution.
*** START: FULL LICENSE ***

THE FULL PROJECT GUTENBERG LICENSE
PLEASE READ THIS BEFORE YOU DISTRIBUTE OR USE THIS WORK

To protect the Project Gutenberg-tm mission of promoting the free
distribution of electronic works, by using or distributing this work
(or any other work associated in any way with the phrase "Project
Gutenberg"), you agree to comply with all the terms of the Full Project
Gutenberg-tm License (available with this file or online at
http://www.gutenberg.org/license).


Section 1.  General Terms of Use and Redistributing Project Gutenberg-tm
electronic works

1.A.  By reading or using any part of this Project Gutenberg-tm
electronic work, you indicate that you have read, understand, agree to
and accept all the terms of this license and intellectual property
(trademark/copyright) agreement.  If you do not agree to abide by all
the terms of this agreement, you must cease using and return or destroy
all copies of Project Gutenberg-tm electronic works in your possession.
If you paid a fee for obtaining a copy of or access to a Project
Gutenberg-tm electronic work and you do not agree to be bound by the
terms of this agreement, you may obtain a refund from the person or
entity to whom you paid the fee as set forth in paragraph 1.E.8.

1.B.  "Project Gutenberg" is a registered trademark.  It may only be
used on or associated in any way with an electronic work by people who
agree to be bound by the terms of this agreement.  There are a few
things that you can do with most Project Gutenberg-tm electronic works
even without complying with the full terms of this agreement.  See
paragraph 1.C below.  There are a lot of things you can do with Project
Gutenberg-tm electronic works if you follow the terms of this agreement
and help preserve free future access to Project Gutenberg-tm electronic
works.  See paragraph 1.E below.

1.C.  The Project Gutenberg Literary Archive Foundation ("the Foundation"
or PGLAF), owns a compilation copyright in the collection of Project
Gutenberg-tm electronic works.  Nearly all the individual works in the
collection are in the public domain in the United States.  If an
individual work is in the public domain in the United States and you are
located in the United States, we do not claim a right to prevent you from
copying, distributing, performing, displaying or creating derivative
works based on the work as long as all references to Project Gutenberg
are removed.  Of course, we hope that you will support the Project
Gutenberg-tm mission of promoting free access to electronic works by
freely sharing Project Gutenberg-tm works in compliance with the terms of
this agreement for keeping the Project Gutenberg-tm name associated with
the work.  You can easily comply with the terms of this agreement by
keeping this work in the same format with its attached full Project
Gutenberg-tm License when you share it without charge with others.

1.D.  The copyright laws of the place where you are located also govern
what you can do with this work.  Copyright laws in most countries are in
a constant state of change.  If you are outside the United States, check
the laws of your country in addition to the terms of this agreement
before downloading, copying, displaying, performing, distributing or
creating derivative works based on this work or any other Project
Gutenberg-tm work.  The Foundation makes no representations concerning
the copyright status of any work in any country outside the United
States.

1.E.  Unless you have removed all references to Project Gutenberg:

1.E.1.  The following sentence, with active links to, or other immediate
access to, the full Project Gutenberg-tm License must appear prominently
whenever any copy of a Project Gutenberg-tm work (any work on which the
phrase "Project Gutenberg" appears, or with which the phrase "Project
Gutenberg" is associated) is accessed, displayed, performed, viewed,
copied or distributed:

This eBook is for the use of anyone anywhere at no cost and with
almost no restrictions whatsoever.  You may copy it, give it away or
re-use it under the terms of the Project Gutenberg License included
with this eBook or online at www.gutenberg.org

1.E.2.  If an individual Project Gutenberg-tm electronic work is derived
from the public domain (does not contain a notice indicating that it is
posted with permission of the copyright holder), the work can be copied
and distributed to anyone in the United States without paying any fees
or charges.  If you are redistributing or providing access to a work
with the phrase "Project Gutenberg" associated with or appearing on the
work, you must comply either with the requirements of paragraphs 1.E.1
through 1.E.7 or obtain permission for the use of the work and the
Project Gutenberg-tm trademark as set forth in paragraphs 1.E.8 or
1.E.9.

1.E.3.  If an individual Project Gutenberg-tm electronic work is posted
with the permission of the copyright holder, your use and distribution
must comply with both paragraphs 1.E.1 through 1.E.7 and any additional
terms imposed by the copyright holder.  Additional terms will be linked
to the Project Gutenberg-tm License for all works posted with the
permission of the copyright holder found at the beginning of this work.

1.E.4.  Do not unlink or detach or remove the full Project Gutenberg-tm
License terms from this work, or any files containing a part of this
work or any other work associated with Project Gutenberg-tm.

1.E.5.  Do not copy, display, perform, distribute or redistribute this
electronic work, or any part of this electronic work, without
prominently displaying the sentence set forth in paragraph 1.E.1 with
active links or immediate access to the full terms of the Project
Gutenberg-tm License.

1.E.6.  You may convert to and distribute this work in any binary,
compressed, marked up, nonproprietary or proprietary form, including any
word processing or hypertext form.  However, if you provide access to or
distribute copies of a Project Gutenberg-tm work in a format other than
"Plain Vanilla ASCII" or other format used in the official version
posted on the official Project Gutenberg-tm web site (www.gutenberg.org),
you must, at no additional cost, fee or expense to the user, provide a
copy, a means of exporting a copy, or a means of obtaining a copy upon
request, of the work in its original "Plain Vanilla ASCII" or other
form.  Any alternate format must include the full Project Gutenberg-tm
License as specified in paragraph 1.E.1.

1.E.7.  Do not charge a fee for access to, viewing, displaying,
performing, copying or distributing any Project Gutenberg-tm works
unless you comply with paragraph 1.E.8 or 1.E.9.

1.E.8.  You may charge a reasonable fee for copies of or providing
access to or distributing Project Gutenberg-tm electronic works provided
that

- You pay a royalty fee of 20% of the gross profits you derive from
     the use of Project Gutenberg-tm works calculated using the method
     you already use to calculate your applicable taxes.  The fee is
     owed to the owner of the Project Gutenberg-tm trademark, but he
     has agreed to donate royalties under this paragraph to the
     Project Gutenberg Literary Archive Foundation.  Royalty payments
     must be paid within 60 days following each date on which you
     prepare (or are legally required to prepare) your periodic tax
     returns.  Royalty payments should be clearly marked as such and
     sent to the Project Gutenberg Literary Archive Foundation at the
     address specified in Section 4, "Information about donations to
     the Project Gutenberg Literary Archive Foundation."

- You provide a full refund of any money paid by a user who notifies
     you in writing (or by e-mail) within 30 days of receipt that s/he
     does not agree to the terms of the full Project Gutenberg-tm
     License.  You must require such a user to return or
     destroy all copies of the works possessed in a physical medium
     and discontinue all use of and all access to other copies of
     Project Gutenberg-tm works.

- You provide, in accordance with paragraph 1.F.3, a full refund of any
     money paid for a work or a replacement copy, if a defect in the
     electronic work is discovered and reported to you within 90 days
     of receipt of the work.

- You comply with all other terms of this agreement for free
     distribution of Project Gutenberg-tm works.

1.E.9.  If you wish to charge a fee or distribute a Project Gutenberg-tm
electronic work or group of works on different terms than are set
forth in this agreement, you must obtain permission in writing from
both the Project Gutenberg Literary Archive Foundation and Michael
Hart, the owner of the Project Gutenberg-tm trademark.  Contact the
Foundation as set forth in Section 3 below.

1.F.

1.F.1.  Project Gutenberg volunteers and employees expend considerable
effort to identify, do copyright research on, transcribe and proofread
public domain works in creating the Project Gutenberg-tm
collection.  Despite these efforts, Project Gutenberg-tm electronic
works, and the medium on which they may be stored, may contain
"Defects," such as, but not limited to, incomplete, inaccurate or
corrupt data, transcription errors, a copyright or other intellectual
property infringement, a defective or damaged disk or other medium, a
computer virus, or computer codes that damage or cannot be read by
your equipment.

1.F.2.  LIMITED WARRANTY, DISCLAIMER OF DAMAGES - Except for the "Right
of Replacement or Refund" described in paragraph 1.F.3, the Project
Gutenberg Literary Archive Foundation, the owner of the Project
Gutenberg-tm trademark, and any other party distributing a Project
Gutenberg-tm electronic work under this agreement, disclaim all
liability to you for damages, costs and expenses, including legal
fees.  YOU AGREE THAT YOU HAVE NO REMEDIES FOR NEGLIGENCE, STRICT
LIABILITY, BREACH OF WARRANTY OR BREACH OF CONTRACT EXCEPT THOSE
PROVIDED IN PARAGRAPH 1.F.3.  YOU AGREE THAT THE FOUNDATION, THE
TRADEMARK OWNER, AND ANY DISTRIBUTOR UNDER THIS AGREEMENT WILL NOT BE
LIABLE TO YOU FOR ACTUAL, DIRECT, INDIRECT, CONSEQUENTIAL, PUNITIVE OR
INCIDENTAL DAMAGES EVEN IF YOU GIVE NOTICE OF THE POSSIBILITY OF SUCH
DAMAGE.

1.F.3.  LIMITED RIGHT OF REPLACEMENT OR REFUND - If you discover a
defect in this electronic work within 90 days of receiving it, you can
receive a refund of the money (if any) you paid for it by sending a
written explanation to the person you received the work from.  If you
received the work on a physical medium, you must return the medium with
your written explanation.  The person or entity that provided you with
the defective work may elect to provide a replacement copy in lieu of a
refund.  If you received the work electronically, the person or entity
providing it to you may choose to give you a second opportunity to
receive the work electronically in lieu of a refund.  If the second copy
is also defective, you may demand a refund in writing without further
opportunities to fix the problem.

1.F.4.  Except for the limited right of replacement or refund set forth
in paragraph 1.F.3, this work is provided to you 'AS-IS,' WITH NO OTHER
WARRANTIES OF ANY KIND, EXPRESS OR IMPLIED, INCLUDING BUT NOT LIMITED TO
WARRANTIES OF MERCHANTIBILITY OR FITNESS FOR ANY PURPOSE.

1.F.5.  Some states do not allow disclaimers of certain implied
warranties or the exclusion or limitation of certain types of damages.
If any disclaimer or limitation set forth in this agreement violates the
law of the state applicable to this agreement, the agreement shall be
interpreted to make the maximum disclaimer or limitation permitted by
the applicable state law.  The invalidity or unenforceability of any
provision of this agreement shall not void the remaining provisions.

1.F.6.  INDEMNITY - You agree to indemnify and hold the Foundation, the
trademark owner, any agent or employee of the Foundation, anyone
providing copies of Project Gutenberg-tm electronic works in accordance
with this agreement, and any volunteers associated with the production,
promotion and distribution of Project Gutenberg-tm electronic works,
harmless from all liability, costs and expenses, including legal fees,
that arise directly or indirectly from any of the following which you do
or cause to occur: (a) distribution of this or any Project Gutenberg-tm
work, (b) alteration, modification, or additions or deletions to any
Project Gutenberg-tm work, and (c) any Defect you cause.


Section  2.  Information about the Mission of Project Gutenberg-tm

Project Gutenberg-tm is synonymous with the free distribution of
electronic works in formats readable by the widest variety of computers
including obsolete, old, middle-aged and new computers.  It exists
because of the efforts of hundreds of volunteers and donations from
people in all walks of life.

Volunteers and financial support to provide volunteers with the
assistance they need are critical to reaching Project Gutenberg-tm's
goals and ensuring that the Project Gutenberg-tm collection will
remain freely available for generations to come.  In 2001, the Project
Gutenberg Literary Archive Foundation was created to provide a secure
and permanent future for Project Gutenberg-tm and future generations.
To learn more about the Project Gutenberg Literary Archive Foundation
and how your efforts and donations can help, see Sections 3 and 4
and the Foundation web page at http://www.gutenberg.org/fundraising/pglaf.


Section 3.  Information about the Project Gutenberg Literary Archive
Foundation

The Project Gutenberg Literary Archive Foundation is a non profit
501(c)(3) educational corporation organized under the laws of the
state of Mississippi and granted tax exempt status by the Internal
Revenue Service.  The Foundation's EIN or federal tax identification
number is 64-6221541.  Contributions to the Project Gutenberg
Literary Archive Foundation are tax deductible to the full extent
permitted by U.S. federal laws and your state's laws.

The Foundation's principal office is located at 4557 Melan Dr. S.
Fairbanks, AK, 99712., but its volunteers and employees are scattered
throughout numerous locations.  Its business office is located at
809 North 1500 West, Salt Lake City, UT 84116, (801) 596-1887, email
business@pglaf.org.  Email contact links and up to date contact
information can be found at the Foundation's web site and official
page at http://www.gutenberg.org/about/contact

For additional contact information:
     Dr. Gregory B. Newby
     Chief Executive and Director
     gbnewby@pglaf.org

Section 4.  Information about Donations to the Project Gutenberg
Literary Archive Foundation

Project Gutenberg-tm depends upon and cannot survive without wide
spread public support and donations to carry out its mission of
increasing the number of public domain and licensed works that can be
freely distributed in machine readable form accessible by the widest
array of equipment including outdated equipment.  Many small donations
($1 to $5,000) are particularly important to maintaining tax exempt
status with the IRS.

The Foundation is committed to complying with the laws regulating
charities and charitable donations in all 50 states of the United
States.  Compliance requirements are not uniform and it takes a
considerable effort, much paperwork and many fees to meet and keep up
with these requirements.  We do not solicit donations in locations
where we have not received written confirmation of compliance.  To
SEND DONATIONS or determine the status of compliance for any
particular state visit http://www.gutenberg.org/fundraising/pglaf

While we cannot and do not solicit contributions from states where we
have not met the solicitation requirements, we know of no prohibition
against accepting unsolicited donations from donors in such states who
approach us with offers to donate.

International donations are gratefully accepted, but we cannot make
any statements concerning tax treatment of donations received from
outside the United States.  U.S. laws alone swamp our small staff.

Please check the Project Gutenberg Web pages for current donation
methods and addresses.  Donations are accepted in a number of other
ways including checks, online payments and credit card donations.
To donate, please visit: http://www.gutenberg.org/fundraising/donate


Section 5.  General Information About Project Gutenberg-tm electronic
works.

Professor Michael S. Hart is the originator of the Project Gutenberg-tm
concept of a library of electronic works that could be freely shared
with anyone.  For thirty years, he produced and distributed Project
Gutenberg-tm eBooks with only a loose network of volunteer support.

Project Gutenberg-tm eBooks are often created from several printed
editions, all of which are confirmed as Public Domain in the U.S.
unless a copyright notice is included.  Thus, we do not necessarily
keep eBooks in compliance with any particular paper edition.

Each eBook is in a subdirectory of the same number as the eBook's
eBook number, often in several formats including plain vanilla ASCII,
compressed (zipped), HTML and others.

Corrected EDITIONS of our eBooks replace the old file and take over
the old filename and etext number.  The replaced older file is renamed.
VERSIONS based on separate sources are treated as new eBooks receiving
new filenames and etext numbers.

Most people start at our Web site which has the main PG search facility:

http://www.gutenberg.org

This Web site includes information about Project Gutenberg-tm,
including how to make donations to the Project Gutenberg Literary
Archive Foundation, how to help produce our new eBooks, and how to
subscribe to our email newsletter to hear about new eBooks.

EBooks posted prior to November 2003, with eBook numbers BELOW #10000,
are filed in directories based on their release date.  If you want to
download any of these eBooks directly, rather than using the regular
search system you may utilize the following addresses and just
download by the etext year.

http://www.gutenberg.org/dirs/etext06/

    (Or /etext 05, 04, 03, 02, 01, 00, 99,
     98, 97, 96, 95, 94, 93, 92, 92, 91 or 90)

EBooks posted since November 2003, with etext numbers OVER #10000, are
filed in a different way.  The year of a release date is no longer part
of the directory path.  The path is based on the etext number (which is
identical to the filename).  The path to the file is made up of single
digits corresponding to all but the last digit in the filename.  For
example an eBook of filename 10234 would be found at:

http://www.gutenberg.org/dirs/1/0/2/3/10234

or filename 24689 would be found at:
http://www.gutenberg.org/dirs/2/4/6/8/24689

An alternative method of locating eBooks:
http://www.gutenberg.org/dirs/GUTINDEX.ALL

*** END: FULL LICENSE ***