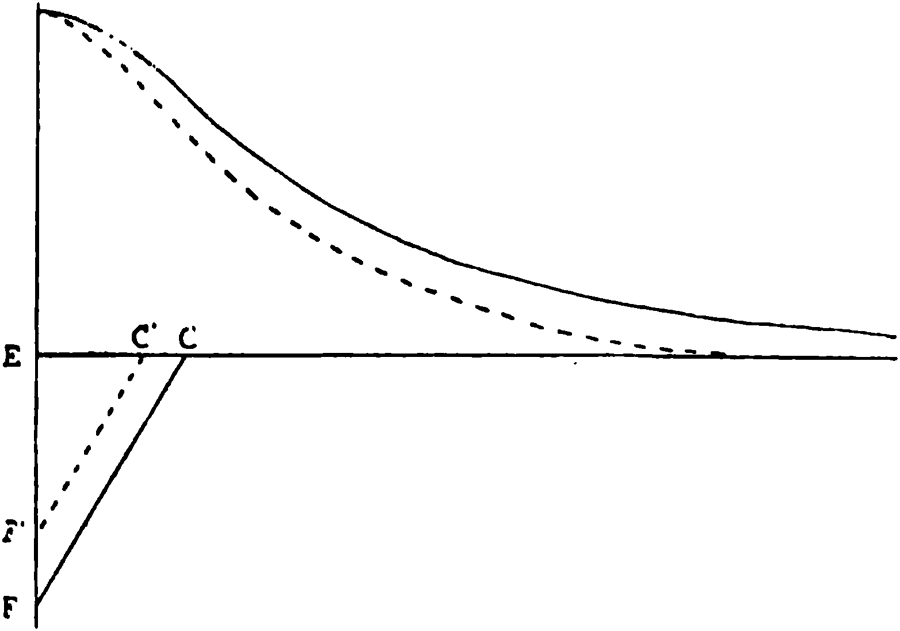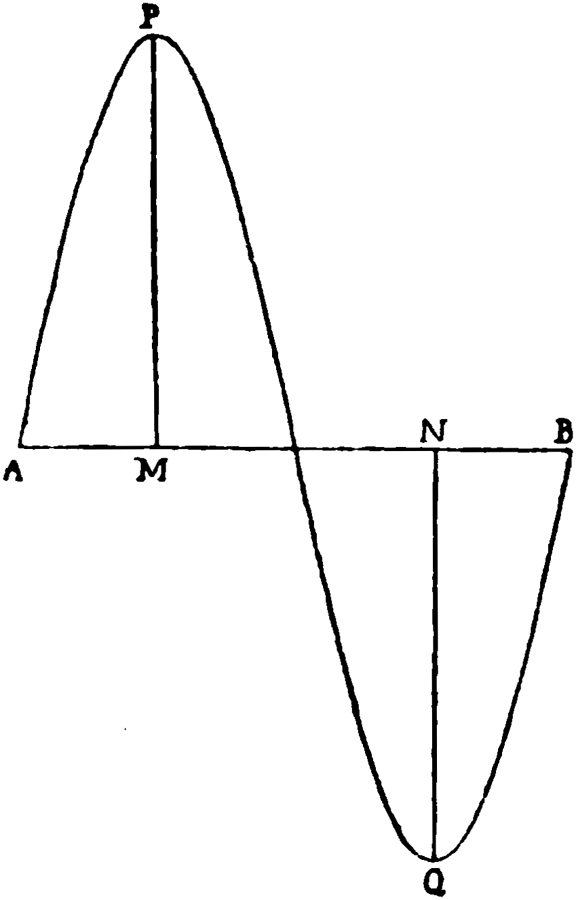
Fig. 1.—Diagram to illustrate simple harmonic motion.ToList
Project Gutenberg's A Study of Recent Earthquakes, by Charles Davison

This eBook is for the use of anyone anywhere at no cost and with
almost no restrictions whatsoever.  You may copy it, give it away or
re-use it under the terms of the Project Gutenberg License included
with this eBook or online at www.gutenberg.org


Title: A Study of Recent Earthquakes

Author: Charles Davison

Release Date: April 12, 2008 [EBook #25062]

Language: English

Character set encoding: ISO-8859-1

*** START OF THIS PROJECT GUTENBERG EBOOK A STUDY OF RECENT EARTHQUAKES ***


Produced by Jeannie Howse, Henry Craig and the Online
Distributed Proofreading Team at http://www.pgdp.net (This
file was produced from images generously made available
by The Internet Archive)
Transcriber's Note:
Inconsistent hyphenation in the original document has been preserved.
Obvious typographical errors have been corrected. For a complete list, please see the end of this document.
Some unicode characters may not show in all browsers, hover your mouse over the missing character to see the meaning. Like this.
Click on the images to see a larger version.
The present volume differs from a text-book of seismology in giving brief, though detailed, accounts of individual earthquakes rather than a discussion of the phenomena and distribution of earthquakes in general. At the close of his Les Tremblements de Terre, Professor Fouqué has devoted a few chapters to some of the principal earthquakes between 1854 and 1887; and there are also the well-known chapters in Lyell's Principles of Geology dealing with earthquakes of a still earlier date. With these exceptions, there is no other work covering the same ground; and he who wishes to study any particular earthquake can only do so by reading long reports or series of papers written perhaps in several different languages. The object of this volume is to save him this trouble, and to present to him the facts that seem most worthy of his attention.
The chapter on the Japanese earthquake is reprinted, with a few slight additions, from a paper published in the Geographical Journal, and I am indebted to the editor, not only for the necessary permission, but also for his courtesy in furnishing [vi]me with clichés of the blocks which illustrated the original paper. The editor of Knowledge has also allowed me to use a paper which appeared four years ago as the foundation of the ninth chapter in this book.
CHARLES DAVISON.
Birmingham,
January, 1905.
| PAGE | |
| CHAPTER I. | |
| Introduction | 1 |
| CHAPTER II. | |
| The Neapolitan Earthquake of December 16th, 1857 | 7 |
| CHAPTER III. | |
| The Ischian Earthquakes of March 4th, 1881, and July 28th, 1883 | 45 |
| CHAPTER IV. | |
| The Andalusian Earthquake of December 25th, 1884 | 75 |
| CHAPTER V. | |
| The Charleston Earthquake of August 31st, 1886 | 102 |
| CHAPTER VI. | |
| The Riviera Earthquake of February 23rd, 1887 | 138 |
| [viii]CHAPTER VII. | |
| The Japanese Earthquake of October 28th, 1891 | 177 |
| CHAPTER VIII. | |
| The Hereford Earthquake of December 17th, 1896, and the Inverness Earthquake of September 18th, 1901 | 215 |
| CHAPTER IX. | |
| The Indian Earthquake of June 12th, 1897 | 262 |
| CHAPTER X. | |
| Conclusion | 321 |
| Index | 349 |
I propose in this book to describe a few of the more important earthquakes that have occurred during the last half century. In judging of importance, the standard which I have adopted is not that of intensity only, but rather of the scientific value of the results that have been achieved by the study of the shocks. Even with this reservation, the number of earthquakes that might be included is considerable; and I have therefore selected those which seem to illustrate best the different methods of investigation employed by seismologists, or which are of special interest owing to the unusual character of their phenomena or to the light cast by them on the nature and origin of earthquakes in general.
Thus, the Neapolitan earthquake possesses interest from a historical point of view; it is the first earthquake in the study of which modern scientific methods were employed. The Ischian earthquakes are described as examples of those connected with [2]volcanic action; the Andalusian earthquake is chiefly remarkable for the recognition of the unfelt earth-waves; that of Charleston for the detection of the double epicentre and the calculation of the velocity with which the vibrations travelled. In the Riviera earthquake are combined the principal features of the last two shocks with several phenomena of miscellaneous interest, especially those connected with its submarine foci. The Japanese earthquake is distinguished from others by its extraordinary fault-scarp and the very numerous shocks that followed it. The Hereford earthquake is a typical example of a twin earthquake, and provided many observations on the sound phenomena; while the Inverness earthquakes are important on account of their connection with the growth of a well-known fault. The great Indian earthquake owns few, if any, rivals within historical times, whether we consider the intensity of the disturbance or the diversity and interest of the phenomena displayed by it—the widespread changes in the earth's crust, both superficial and deep-seated, and the tracking of the unfelt pulsations completely round the globe.
Some terms are of such frequent use in describing earthquakes that it will be convenient to group them here for reference, others more rarely employed being introduced as they are required.
An earthquake is caused by a sudden displacement of the material which composes the earth's interior. The displacement gives rise to series of waves, which are propagated outwards in all directions, and which, [3]when they reach the surface, produce the sensations known to us as those of an earthquake.
The region within which the displacement occurs is sometimes called the hypocentre, but more frequently the seismic focus or simply the focus. The portion of the earth's surface which is vertically above the seismic focus is called the epicentre. The focus and epicentre are often spoken of for convenience as if they were points, and they may then be regarded as the centres of the region and area in which the intensity was greatest. This is not quite accurate, but to attempt a more exact definition would at present be out of place.
An isoseismal line is a curve which passes through all points at which the intensity of the shock was the same. It is but rarely that the absolute intensity at any point of an isoseismal line can be ascertained, and only one example is given in this volume. As a rule, the intensity of a shock is determined by reference to the degrees of different arbitrary scales. These will be quoted when required.
In every strong earthquake there is a central district which differs in a marked manner from that outside in the far greater strength and complexity of the phenomena. As this district includes the epicentre, it is sometimes referred to as the epicentral area, but the term meizoseismal area is more appropriate, and will be employed accordingly.
The district over which an earthquake is perceptible to human beings without instrumental aid is its disturbed area. In like manner, that over which the earthquake-sound is heard is the sound-area.
A great earthquake never occurs alone. It is merely the most prominent member of a group of [4]shocks of greater or less intensity, and is known as the principal shock or earthquake, while the others are called minor or accessory shocks, and fore-shocks or after-shocks according as they occur before or after the principal earthquake. When the sound only is heard, without an accompanying tremor being anywhere perceptible, it is more accurately called an earth-sound, but is frequently for convenience numbered among the minor shocks.
The movement of the ground during a vibration of the simplest character (known as simple harmonic motion) is represented in Fig. 1. The pointer of the recording seismograph is here supposed to oscillate along a line at right angles to AB, and the smoked paper or glass on which the record is made to travel to the left. The distance MP of the crest P of any wave from the line AB represents the amplitude of the vibration, the sum of the distances MP and NQ its range, and the length AB the period of the vibration. From the amplitude and period we can calculate, in the case of simple harmonic motion, both the maximum velocity and maximum acceleration of the vibrating particles of the ground.[1]
A few terms describing the nature of the shock are [5]also in common use among Italians and Spaniards. An undulatory shock consists of one or several waves, the movement to and fro being along a nearly horizontal line; a subsultory shock of movements in a nearly vertical direction; while a vorticose shock consists of undulatory or subsultory movements crossing one another in different directions.
Earthquakes are grouped, according to their origin, into three classes. The first consists of slight local shocks, caused by the fall of rock in underground passages; the second of volcanic earthquakes, also local in character, but often of considerable intensity near the centre of the disturbed area; while in the third class we have tectonic earthquakes, or those directly connected with the shaping of the earth's crust, which vary in strength from the weakest perceptible tremor to the most destructive and widely felt shock. Of the earthquakes described in this volume, the Ischian earthquakes belong to the second class, and all the others to the third.
That tectonic earthquakes are closely connected with the formation of faults seems now established beyond doubt. They occur far from all traces of recent volcanic action. Their isoseismal lines are elongated in directions parallel to known faults, and this is sometimes the case in one and the same district with faults that occur at right angles to one another. Indeed, when several isoseismals are carefully drawn, it is possible from their form and relative position to predict the position of the originating fault.[2] The [6]initial formation and further spreading of the rent may be the cause of a few earthquakes, but by far the larger number are due to the subsequent growth of the fault. The relative displacement of the rocks adjoining the fault, which may amount to thousands of feet, occasionally even to miles, is the result, not of one great movement, but of innumerable slips taking place in different parts of the fault and spread over vast ages of time. With every fault-slip, intense friction is suddenly brought into action by the rubbing of one mass of rock against the other; and, according to the modern view, it is this friction that gives rise to the earthquake waves.
In most earthquakes, the slip takes place at a considerable depth, perhaps not less than one or several miles, and the vertical slip is so small that it dies out before reaching the surface. But, in a few violent earthquakes, such as the Japanese and Indian earthquakes described in this volume, the slip is continued up to the surface and is left visible there as a small cliff or fault-scarp. In these cases, the sudden spring of the crust may increase and complicate the effects of the vibratory shock.
[1] If a is the amplitude of the vibration and T its period, the maximum velocity is 2πa ÷ T and the maximum acceleration 4π²a ÷ T².
[2] See Chapter VIII., on the Hereford and Inverness earthquakes.
Half a century ago, seismology was in its infancy. On the Continent, Alexis Perrey of Dijon was compiling his earthquake catalogues with unfailing enthusiasm and industry. In 1846, Robert Mallet applied the laws of wave-motion in solids, as they were then known, to the phenomena of earthquakes; and his memoir on the Dynamics of Earthquakes[3] may be regarded as the foundation-stone of the new science. During the next twelve years he contributed his well-known Reports to the British Association,[4] and prepared a series of instructions for the observation and study of earthquake-shocks.[5] The latter, it is worth noting, contains an outline, but hardly more than an outline, of the methods of investigation which he developed and employed eight years afterwards in studying the Neapolitan earthquake.
The history of Mallet's preparation for his great work is somewhat strange. No one else at that time possessed so full a knowledge of earthquake phenomena. It was, however, a knowledge that had little, [8]if any, foundation in actual experience; for, when he was awakened by the British earthquake of November 9th, 1852, he failed to recognise its seismic character. Although this shock disturbed an area of about 75,000 square miles and was felt in all four parts of the kingdom, the paucity of observations and the absence of durable records combined in preventing the successful application of his new modes of study.[6] Nevertheless, with confidence unshaken in their power, he awaited the occurrence of a more violent shock, but five years had to pass before his opportunity came towards the close of 1857.
So destructive was the Neapolitan earthquake of this year (Mallet ranks it third among European earthquakes in extent and severity), that nearly a week elapsed before any news of it reached the outer world. Without further loss of time, he applied for and obtained a grant of money from the Council of the Royal Society, and proceeded early in the following February to what was then the kingdom of Naples. Armed with letters of authority to different officials, he visited the chief towns and villages in the meizoseismal area; and, in spite of unfavourable weather and the difficulties of travelling in a country so recently devastated, he completed his examination in little more than two months. It was a task, surely, that would have baffled any but the most enthusiastic investigator or one unspurred by the feeling that he possessed the key to one of the most obscure of Nature's problems.
Mallet's confidence in the accuracy of his methods was almost unbounded. His great report was published four years later; but he seems to have [9]regarded it almost as a text-book of "observational seismology" and the results of his Neapolitan work as mere illustrations. His successors, however, have transposed the order of importance, and rank his two large volumes as the model, if not the inspirer, of many of our more recent earthquake monographs.
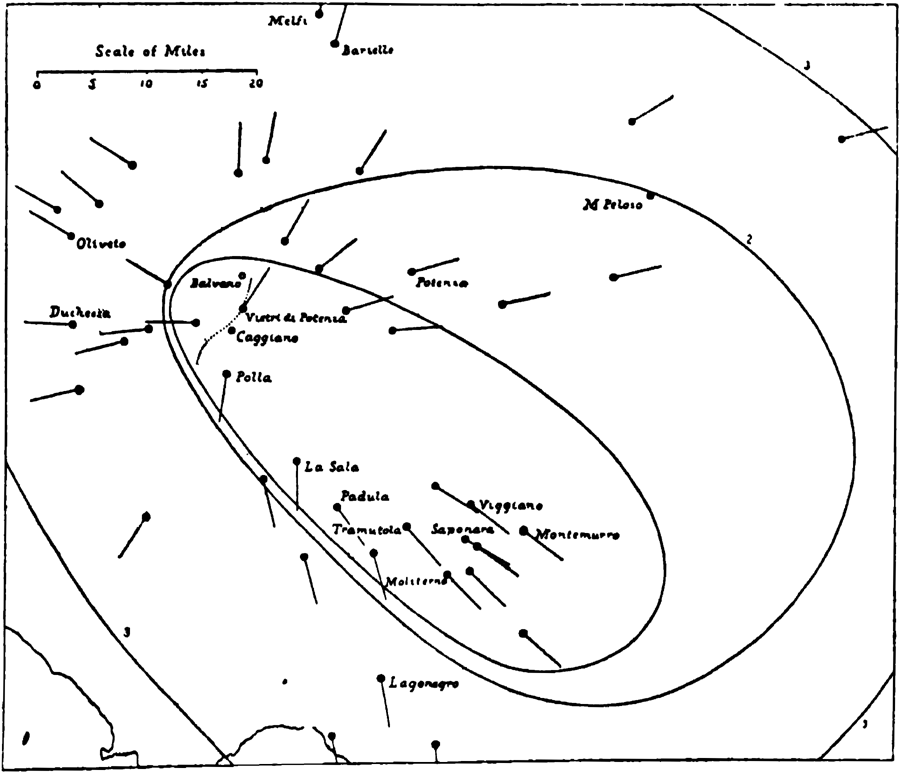
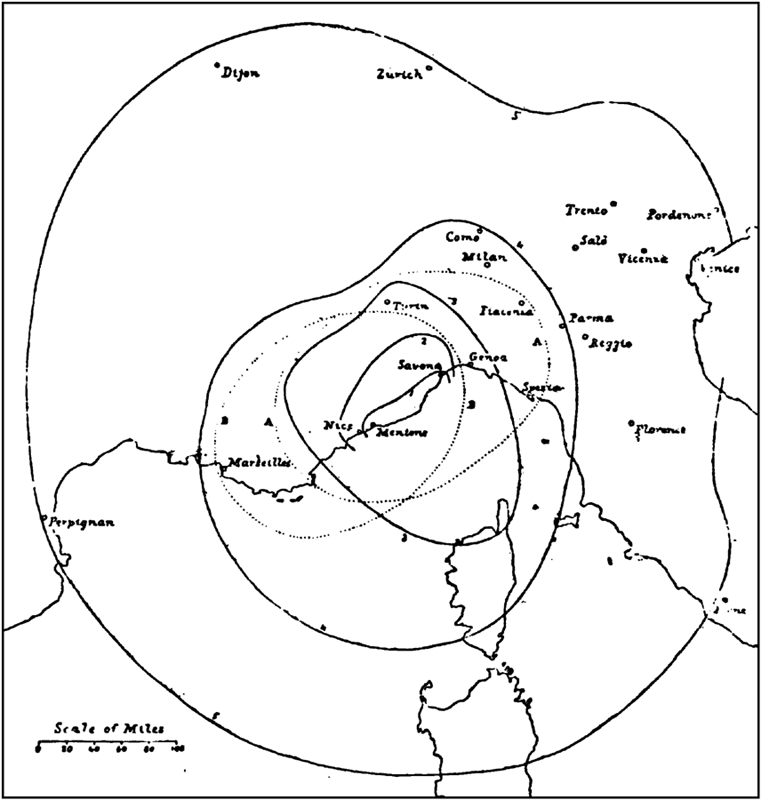
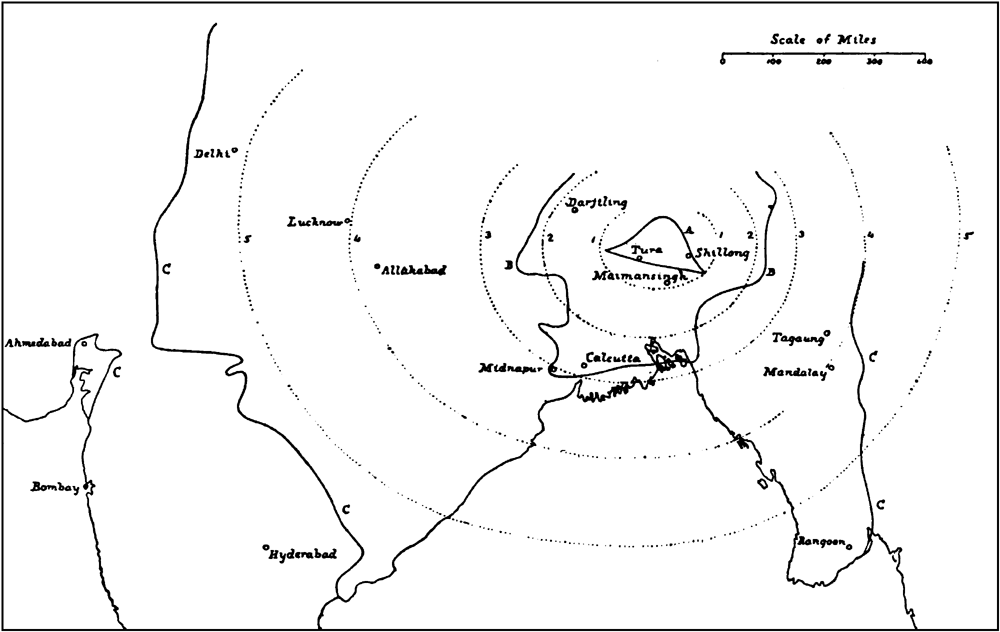
The position of the meizoseismal area, to which Mallet devoted most of his time, is indicated by the small oval area marked 1 in Fig. 2, represented on a larger scale in Fig. 9. It is 40 miles long and 23 miles [10]wide,[7] and contains 950 square miles. Within this area, the loss of life was great and most of the towns were absolutely prostrated.
The next isoseismal, No. 2, which is also shown more clearly in Fig. 9, bounds the area in which the loss of life was still great and many persons were wounded, while large portions of the towns within it were thrown down. Its length is 65 miles, width 47 miles, and area 2,240 square miles. The third isoseismal includes a district in which buildings were only occasionally thrown down, though none escaped some slight damage, and in which practically no loss of life occurred. This curve is 103 miles long, 82 miles wide, and includes 6,615 square miles. Lastly, the fourth isoseismal marks the boundary of the disturbed area, which is 250 miles long, 210 miles wide, and contains not more than 39,200 square miles; an amount that must be regarded as strangely small, and hardly justifying Mallet's estimate of the Neapolitan earthquake as the third among European earthquakes in extent as well as in seventy.
As regards destruction to life and property, however, the Neapolitan earthquake owns but few European rivals. Less favourable conditions for withstanding a great shock are seldom, indeed, to be found than those possessed by the mediæval towns and villages of the meizoseismal area. In buildings of every class, the walls are very thick and consist as a rule of a coarse, short-bedded, ill-laid rubble masonry, without [11]thorough bonding and connected by mortar of slender cohesion. The floors are made of planks coated with a layer of concrete from six to eight inches thick, the whole weighing from sixty to a hundred pounds per square foot. Only a little less heavy are the roofs, which are covered with thick tiles secured, except at the ridges, by their own weight alone. Thus, for the most part, the walls, floors, and roofs are extremely massive, while the connections of all to themselves and to each other are loose and imperfect.
Again, the towns, for greater security from attacks in early times, are generally perched upon the summits and steep flanks of hills, especially of the lower spurs that skirt the great mountain ranges; and the rocking of the hill-sites, in Mallet's opinion, greatly aggravated the natural effects of the shock. The streets, moreover, are steep and narrow, sometimes only five feet, and not often more than fifteen feet, in width; and the houses, when shaken down, fell against one another and upon those beneath them. As Dolomieu said of the great earthquake in 1783, "the ground was shaken down like ashes or sand laid upon a table."
Of the total amount of damage, not even the roughest estimate can be made. The official returns are clearly, and no doubt purposely, deficient, and obstacles were placed in Mallet's way when he endeavoured to ascertain the numbers of persons killed and wounded. Taking only the towns into account, he calculated that, out of a total population of 207,000, the number of persons killed was 9,589, and of wounded 1,343.[8] A few towns were marked by an [12]excessively high death-rate. Thus, at Montemurro, 5000 out of 7002 persons were killed and 500 wounded; at Saponara, 2000 out of 4010 were killed; and, at Polla, more than 2000 out of a population of less than 7000.
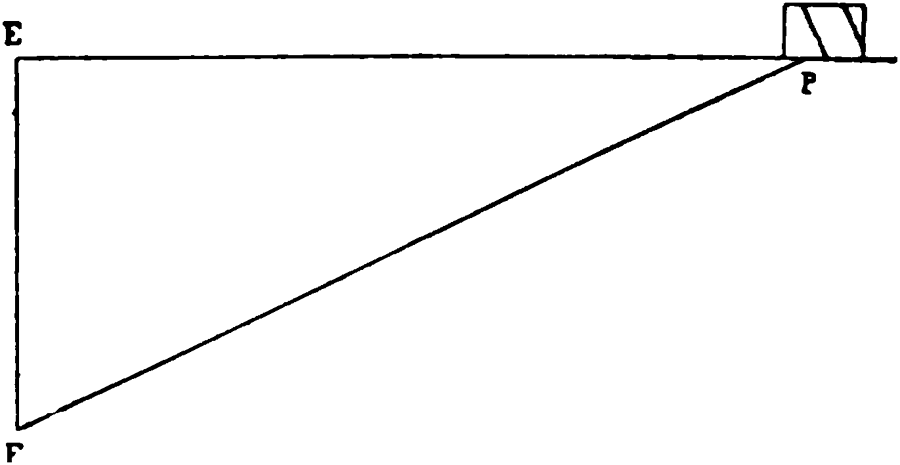
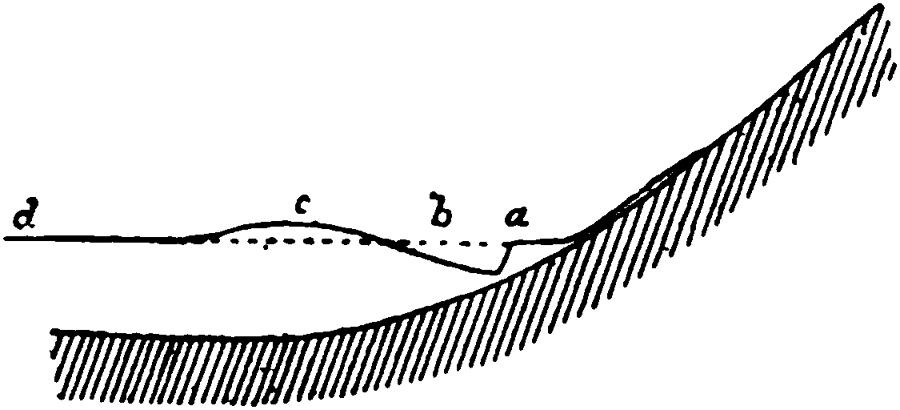
The principal objects of Mallet's investigation were to determine the position of the epicentre and the depth of the seismic focus. If, in Fig. 3, F represents the seismic focus (here, for convenience, supposed to be a point), the vertical line FE will cut the surface of the earth in the epicentre E.[9] The dotted lines represent circles drawn on the surface of the earth with E as centre and passing through the places P and Q.
[13]When the impulse causing the earthquake takes place at the focus, two elastic waves spread outwards from it in all directions through the earth's crust. The first wave which reaches a point P consists of longitudinal vibrations, that is, the particle of rock at P moves in a closed curve with its longer axis in the direction FP. Mallet supposes this curve to be so elongated that it is practically a straight line coincident in direction with FP. In the second or transversal wave, the vibration of the particle at P takes place in a plane at right angles to FP. These vibrations Mallet, for his main purpose, neglects.
Returning to the longitudinal wave, Mallet calls the line FP the wave-path at P. The direction EP gives the azimuth of the wave-path, or its direction along the surface of the earth. The angle LPA, or EPF, he defines as the angle of emergence at the point P. If Q be farther from E than P, the angle EQF is less than the angle EPF, or the angle of emergence diminishes as the distance from the epicentre increases. At the epicentre, the angle of emergence is a right-angle; at a great distance from the epicentre, it is nearly zero.
Mallet argued that the direction of the wave-path FPA, or its equivalents, the horizontal direction EPL and the angle of emergence EPF, should be discoverable from the effects of the shock at P. The cracks in damaged buildings, he urged, would be at right angles to the wave-path FPA; overturned monuments or gate-pillars should fall along the line EPL, either towards or from the epicentre according to their conditions of support; loose or slightly attached bodies, such as the stone balls surmounting gate-pillars, should be projected nearly in the direction of [14]the wave-path FPA, and their subsequent positions, supposing the balls not to have rolled, should give the horizontal direction EPL of the wave-path, and might, in some circumstances, determine the angle of emergence and the velocity with which they were projected. I shall return to details later on. For the present, it is clear that, in the destruction wrought by the earthquake, Mallet expected to find the materials most valuable for his purpose. Indeed, so obvious did this mode of examination appear to him, that he could not conceal his surprise at the blindness of his predecessors. They seem, he says, "to have been perfectly unconscious that in the fractured walls and overthrown objects scattered in all directions beneath their eyes, they had the most precious data for determining the velocities and directions of the shocks that produced them."
Mallet's Method of Determining the Position of the Epicentre.—In many cases the examination of a damaged building or of an overthrown body served more than one purpose, providing materials for ascertaining the depth of the seismic focus as well as the position of the epicentre. For the present, however, it will be convenient to consider alone the method by which the latter object was to be attained.
Nothing could be simpler than the principle of the [15]method proposed. The horizontal direction PL of the wave-path at any place P (Fig. 4), when produced backwards, must pass through the epicentre E; and the intersection of the directions at two places, P and Q, must therefore give the position of the epicentre. In practice, it is of course impossible to determine the direction with very great accuracy, and Mallet therefore found it necessary to make several measurements in every place, and to visit all the more important towns within and near the meizoseismal area.
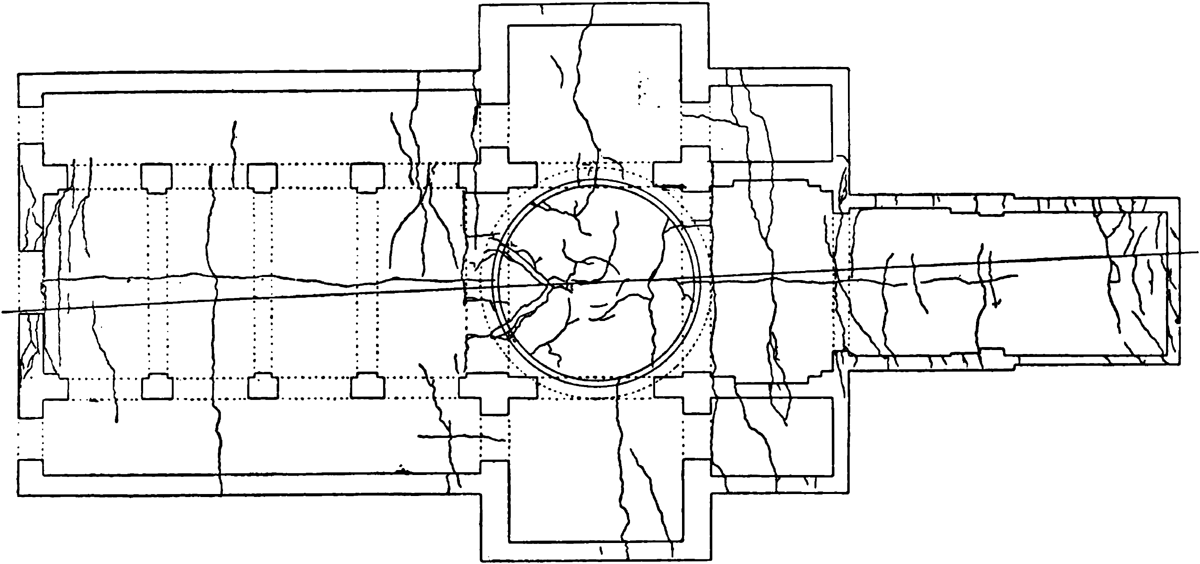
In a ruined town there are many objects from which the direction may be ascertained, the most important of all, according to Mallet, being fissures in walls that are fractured but not overthrown. He regarded such fissures, indeed, as "the sheet-anchor, as respects direction of wave-path, to the seismologist in the field," and at least three out of every four of his determinations of the direction were made by their means. If the buildings are detached and large, simple and symmetrical in form, well built and not too much injured, the fissures in the walls should, he argued, occur along lines at right angles to the wave-path, whether that path be parallel or inclined to the principal axis of the building. Cracks in the floors and ceilings should also be similarly directed, and provide evidence which Mallet regarded as only second in value to that given by the walls.
No building showed the different kinds of evidence on which Mallet relied as clearly as the cathedral church at Potenza, the plan of which is given in Fig. 5, and the vertical section along its axis in Fig. 12. This is a modern work, nearly 200 feet long, with its axis directed east and west. The walls are composed[16] [17]of fairly good rubble masonry and brick; and the arches in the nave and transepts, the semi-cylindrical roof and the central dome are made of brick. The fissures represented in both diagrams were drawn to scale by the cathedral architect before Mallet's arrival, and, as the work of an unbiassed observer, are of special value. Most of those in the roof, it will be seen, were transverse to the axial line of the church; but there were others parallel to this line, one in particular running right along the soffit of the nave and chancel. There were also numerous small fissures in the dome, due to local structural causes and therefore of varying direction, and a large portion of the dome slipped westward, leaving open fissures of seven to eight inches in width. The mean direction of the wave-path, as deduced from nine sets of fissures, none of which differs more than four degrees from the mean, is W. 2½° S. and E. 2½° N., which corresponds precisely with the direction of throw on the displaced portion of the dome. The great east and west fissures in the arch of the nave and chancel Mallet attributed to a second shock, of the existence of which there is ample evidence.
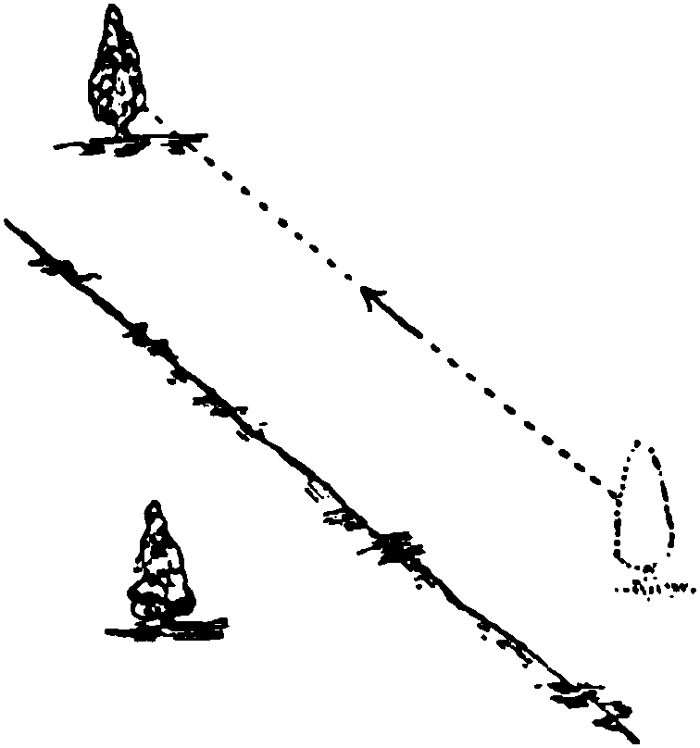
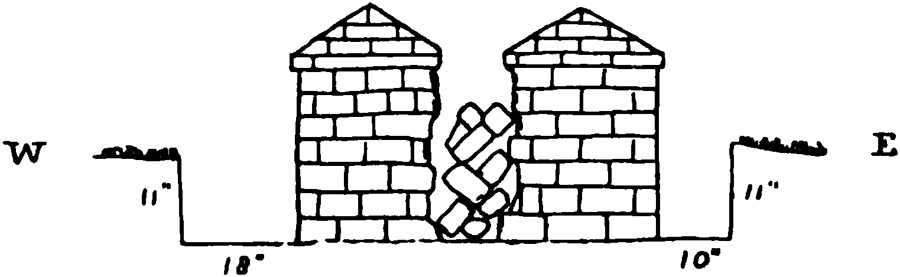
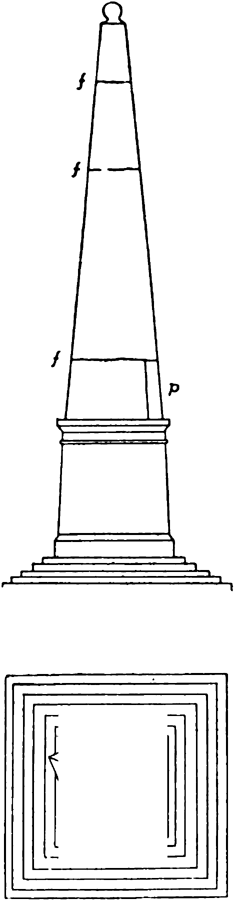
Next to fissures, Mallet made most use of overthrown objects, such as the two gate piers near Saponara, represented in Fig. 6. They were made of rubble ashlar masonry, three feet square and seven feet in height. Both were fractured clean off at the [18]level of the ground, the mortar being poor, and fell in directions that were accurately parallel, indicating a wave-path towards S. 39½°E. A few observations were also made on projected stones, fissures in nearly level ground, and the swinging of lamps and chandeliers; but their value was small, except as corroboration of the more important evidence afforded by fissures in the walls and roofs of buildings.
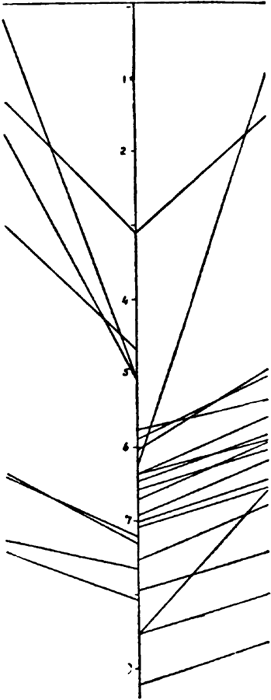
Remarks on Mallets Method.—It would have been more difficult in Mallet's day than it is now, to offer objections to his method of determining the position of the epicentre. The focus, as he was well aware, could not be a point, and, at places near the epicentre (the very places where most of his observations were made), there must be rapid changes of direction due to the arrival of vibrations from different parts of the focus. He records the occurrence of the so-called vorticose shocks at several places, though he attributes them to another cause. Perhaps the best known example of such a shock is that which has been so well illustrated by the late Professor Sekiya's model of the motion of an earth-particle during the Japanese earthquake of January 15th, 1887. The motion in this case was so complicated that the model was, for simplicity, made in three parts, the first of which alone is represented in Fig. 7.[10] It is clear that in such an earthquake, Mallet's method would utterly fail in giving definite results.
While this shock was one of great complexity, another Japanese earthquake, that of June 20th, 1894, was unusually simple in character. The movement at Tokio consisted of one very prominent oscillation [19]with a total range of 73 mm. or 2.9 inches in the direction S. 70° W.; the vibrations which preceded and followed it being comparatively small. Most, if not all, of the damage caused by the earthquake must have been due to this great oscillation; and yet the cylindrical stone-lamps so common in Japanese gardens were found by Professor Omori to have fallen in many different directions. Taking only those which had circular bases, twenty-nine were overthrown in directions between north and east, sixteen between east and south, eighty-one between south and west, and fourteen between west and north.[11] Fig. 8 represents Professor Omori's results graphically, [20]the line drawn from O to any point being proportional to the number of lamps which fell in directions between 7½° on either side of the line.

Fig. 8.—Plan of directions of fall of overturned stone-lamps at Tokio during the earthquake of 1894.ToList
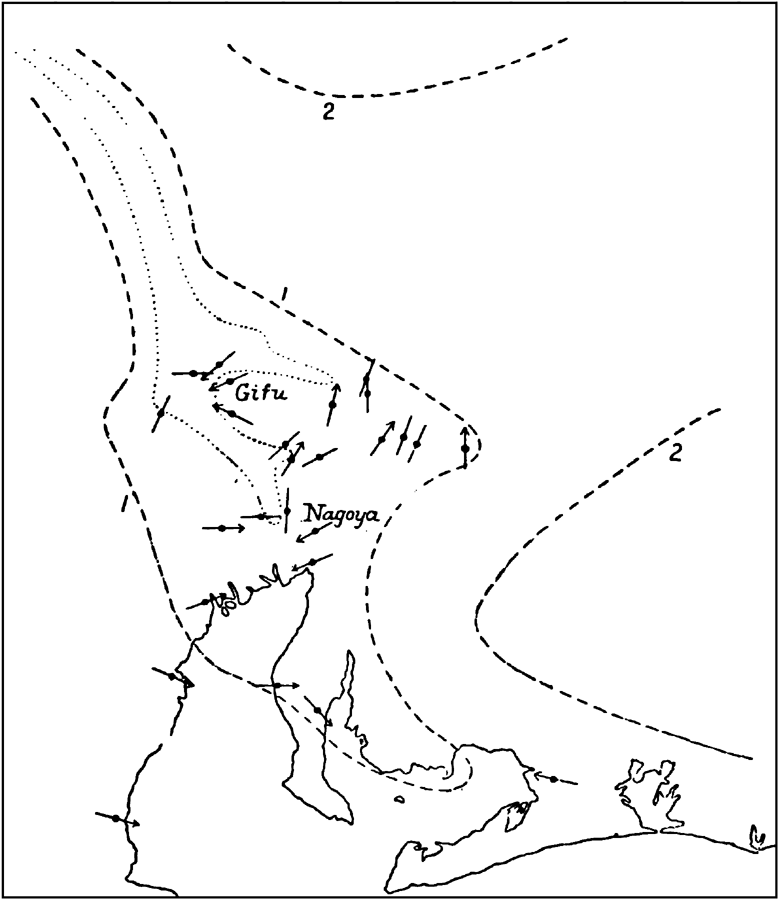
It will be seen from this figure that most of the stone lamps fell in directions between west and south-west, and it is remarkable that the mean direction of fall is S. 70° W.,[12] which is exactly the same as that of the great oscillation. Somewhat similar results were obtained by this able seismologist at different places affected by the great Japanese earthquake of 1891 (Figs. 43 and 44), and the study of the apparent directions observed during the Hereford earthquake of 1896 leads to the same conclusion.
It thus appears that an isolated observation may give a result very different from the true direction. Indeed, if we may judge from Professor Omori's measurements in 1894, the chance that a single direction may be within five degrees of the mean direction is about 1 in 9. But, on the other hand, it is equally clear from these and other observations that the mean of a large number of measurements will give a result that agrees very closely with the true direction.
One other point may be alluded to before leaving Professor Omori's interesting observations. It would seem, from the list that he gives, that he exercised no selection in his measurements, but continued measuring the direction of every fallen lamp indifferently until he had obtained sufficient records for his purpose. Now, if the number of fallen lamps at his disposal had been small, say 12 [21]instead of 144, the mean observed direction would probably have differed from the direction given from the seismograph.[13] But, on the other hand, a preliminary survey without any actual measurements would have revealed at once the predominant direction of overthrow, and a fairly accurate result might have been obtained by neglecting discordant directions and taking the mean of those only which appeared to agree with the mentally determined average.
This, indeed, appears to have been the course followed, more or less unconsciously, by Mallet in his Neapolitan work. "When the observer," he says, "first enters upon one of those earthquake-shaken towns, he finds himself in the midst of utter confusion. The eye is bewildered by 'a city become an heap.' He wanders over masses of dislocated stone and mortar, with timbers half buried, prostrate, or standing stark up against the light, and is appalled by spectacles of desolation.... Houses seem to have been precipitated to the ground in every direction of azimuth. There seems no governing law, nor any indication of a prevailing direction of overturning force. It is only by first gaining some commanding point, whence a general view over the whole field of ruin can be had, and observing its places of greatest and least destruction, and then by patient examination, compass in hand, of many details of overthrow, house by house and street by street, analysing each detail and comparing the results, as to the direction of force, that must have produced each particular fall, with those previously [22]observed and compared, that we at length perceive, once for all, that this apparent confusion is but superficial."
Mallet's Determination of the Epicentre.—Within the third isoseismal line Mallet made altogether 177 measurements of the direction of the wave-path at 78 places. These are plotted on his great map [23]of the earthquake; but, owing to the small scale of Fig. 9, it is only possible to represent, by means of short lines, the mean or most trustworthy direction at each place.[14] Producing these directions backwards, he found that those at sixteen places passed within five hundred yards of a point which is practically coincident with the village of Caggiano; those at sixteen other places passed within one geographical mile (1.153 statute miles) of this point; the directions at sixteen more places within two and a half geographical miles; while those at twelve places passed through points not more than five geographical miles from Caggiano. As the direction of the shock at places near the epicentre must have been influenced by the mere size of the focus, this approximate coincidence is certainly remarkable, and there can be little doubt, I think, that the epicentre, or, at any rate, an epicentre must have been situated not far from the position assigned to it by Mallet's laborious observations.
Existence of Two Epicentres.—It is difficult, however, to realise that the impulse at the focus corresponding to Mallet's epicentre was the origin of all the destruction of life and property that occurred. The position of the epicentre close to the north-west boundary of the meizoseismal area, the extraordinary extension of that area towards the south-east, and especially the great loss of life at Montemurro and the adjoining towns, can hardly be accounted for in this manner. Mallet himself recognised that these facts required explanation, and he suggested that the situation and character of the [24]towns were in part responsible for their ruin, and the physical structure of the country for the course of the isoseismal lines. But the comparative escape of places much nearer Caggiano, and the wide extent of the meizoseismal area, embracing many towns and villages of varied character and site and many different surface-features, point unmistakably to a different explanation.
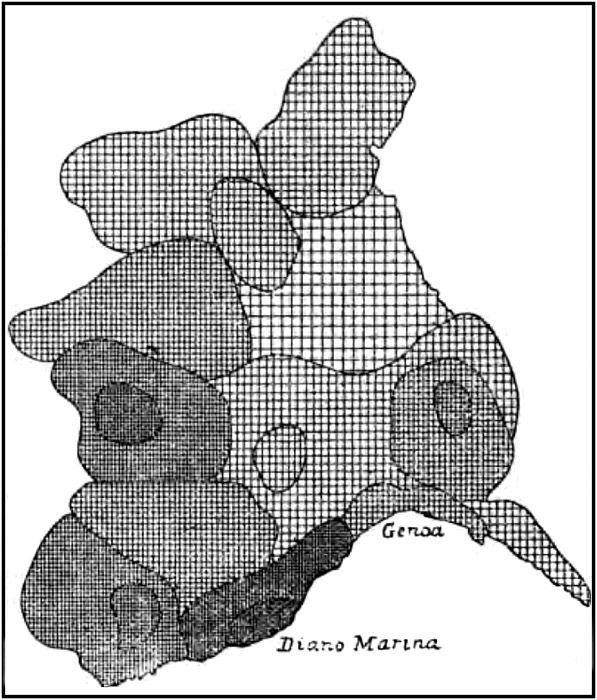
One clue to the solution of the problem is afforded by the seismic death-rate of the damaged towns. From a table given by Mallet (vol. ii. pp. 162-163), we know the population before the earthquake of the different communes in the province of Basilicata, and the loss of life in each due to the shock; and from these figures we can find the percentage of deaths at nearly every place of importance. As will be seen from Fig. 10, it varies from seventy-one at [25]Montemurro and fifty at Saponara down to less than one at all the places marked to which figures are not attached. There is thus a group of places, with its centre near Montemurro, where the loss of life far exceeded that in the surrounding country; and also a slightly less-marked group, with its centre near Polla, in the north-west of the meizoseismal area; while in the intermediate region the death-rate was invariably small. Too much stress should not be laid upon the exact figures, for there were no doubt local conditions that affected the death-roll. But it seems clear that one focus was situated not far from Montemurro; while the north-westerly group of places, combined with Mallet's observations on the direction, point to a second focus near Polla, about twenty-four miles to the north-west. It will be seen in a later section that the observations on the nature of the shock also imply the existence of a double focus.
Mallet's Method of Determining the Depth of the Focus.—In ascertaining the position of the epicentre, Mallet's work was remarkable only for the novelty of the method employed by him; but, in his attempt to calculate the depth of the seismic focus, he was breaking new ground. That the depth must be comparatively small had already been recognised, and was indeed obvious from the limited area disturbed by nearly every earthquake. No one, however, had tried to estimate the depth in miles; and it is impossible not to sympathise with Mallet while he accumulated his observations with feverish activity and subjected them to the first rough examination [26]even if one cannot share his confidence that he had succeeded in measuring the depth "in miles and yards with the certainty that belongs to an ordinary geodetic operation."
The method employed by him for the purpose is no less simple theoretically than that used for locating the epicentre. If the position of the latter (E) is known, one accurate measurement of the angle of emergence EPF, at any other point P would be sufficient to fix the depth of some point within the focus F (Fig. 11). Here, again, Mallet relied chiefly on fissures in walls that were fractured but not overthrown. In detail, these fissures are nearly always jagged or serrated, for they tend to follow the lines of joints rather than break through the solid stone, though they sometimes traverse bricks and mortar alike. But the general course of the fissures, he urged, would be at right angles to the wave-path, and their inclination to the vertical should be equal to the angle of emergence.
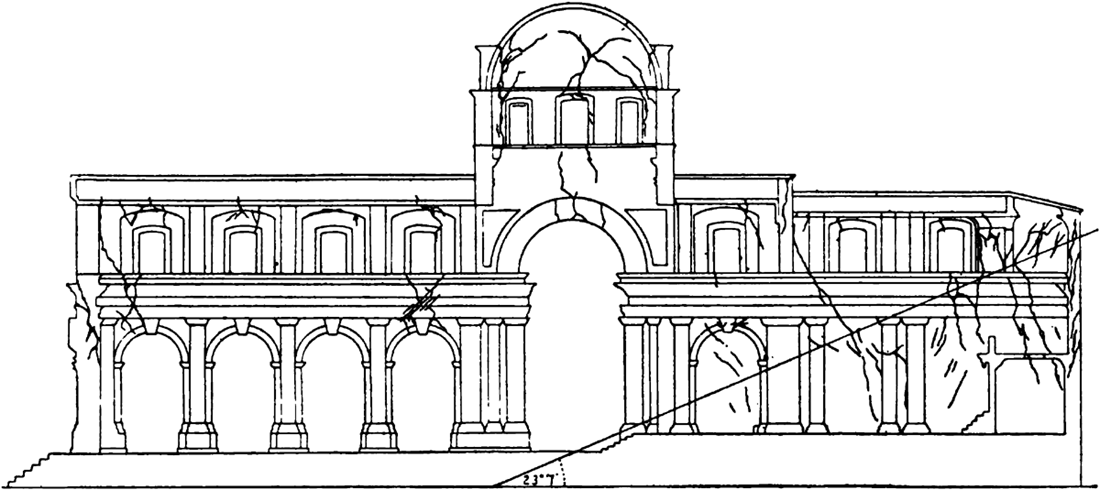
In obtaining measurements of this angle, the buildings to be chosen are those of large size, with few windows or other apertures, and with walls made of brick or small short-bedded stones. The cathedral-church at Potenza perhaps satisfies these conditions more closely than any other structure examined by Mallet. The plan of the fissures in the walls and roof has been given in Fig. 5, and Fig. 12 represents the fissures In the vertical section along the axial line and looking north, as drawn by the cathedral architect. From these fissures Mallet calculated the mean angle of emergence at Potenza to be 23° 7'. The distance of Potenza from Caggiano being seventeen miles, and the height of the former being 2,580 feet, the depth of the focus resulting from this observation alone would be 6¾ miles below the level of the sea.
[28]Objection to Mallet's Method.—The weakest point in Mallet's method is probably his assumption that the wave-paths are straight lines extending outward from the focus. Even if the depth of the focus is not more than a few miles, the waves must traverse rocks of varying density and elasticity, and, at every bounding surface, they must undergo refraction. If the rocks are so constituted that the velocity of the earth-waves in them increases with the depth, then the wave-paths must be bent continually outwards from the vertical, so that the angle of emergence at the surface may be considerably less than it would have been with a constant velocity throughout. In this case, the actual depth will be greater, perhaps much greater, than the calculated depth. For instance, if the angle of emergence at Potenza were diminished only 5° by refraction, the calculated depth of the focus would be too small by 1¾ miles.
Mallet's Estimate of the Depth of the Focus.—Mallet measured the angle of emergence at twenty-six places, the mean angle (i.e. the mean of the greatest and least observed angles) varying from 72° at Vietri di Potenza and 70° degrees at Pertosa, which are about two miles from the calculated epicentre, to 11½° at Salerno, distant about 40 miles. Fig. 13 reproduces part of the diagram on which he plotted the mean [29]angle of emergence at different places. The horizontal line represents the level of the sea, and the vertical line one passing through the epicentre and focus, called by Mallet the "seismic vertical." The lines on the left-hand side represent the commencing wave-paths (assumed straight) to the observing stations situated to the westward of the meridian through the epicentre, those on the right-hand side corresponding to places to the eastward of the same meridian. Small horizontal marks are added to indicate the depth in miles below the level of the sea.
It will be seen, from this diagram, that all the wave-paths start from the seismic vertical at depths between three and nine miles; but the points of departure are clustered thickly within a portion, the length of which is about 3½ miles and the mean depth about 6½ miles. So great was Mallet's confidence in these calculations that he assigns the diverging origin of the wave-paths to different points of the focus, and thus concludes that, while the mean depth of the focus was about 6½ miles, its dimensions in a vertical direction did not exceed 3½ miles.
[30]How far Mallet's results should be accepted as correct, it is difficult to say in our ignorance of the constitution of the earth's interior. There can be no doubt that the focus was of considerable size, and that, in consequence, the wave-paths would diverge from different points of it. But that each wave-path should actually intersect the focus, and so enable its magnitude to be determined, would surely involve an approach to some law connecting the direction of a wave-path with the depth of its own origin, and no such law seems to be ascertainable. Nor can the limitation of these apparent origins between certain depths be held to argue that the focus, or any part of it, was equally confined, for the wave-paths would to a great extent be similarly refracted. I fear that the only conclusions that we can with safety draw from Mallet's admirable work are that his figures indicate the order of magnitude both of the vertical dimensions and of the mean depth of the focus.
It is not easy to form any precise image of the earthquake as it appeared to the terrified witnesses within the meizoseismal area. To minds unbalanced by the suddenness of the shock and by the crash of falling houses, actuated too by the intense need of safety, the mere succession of events must have presented but little interest. The interval of two months that elapsed between the occurrence of the earthquake and its investigation was also unfavourable to the collection of accurate accounts from a wonder-loving people. Only one feature, therefore, stands [31]out clearly in the few records given by Mallet—namely, the division of the shock into two distinct parts.
In the central district, this division is perhaps less apparent than elsewhere. At Polla, for instance, which lies close to the north-west epicentre, the first warning was given by a rushing sound; almost instantly, and while it was yet heard, came a strong subsultory or up-and-down movement, succeeded after a few seconds, but without any interval, by an undulatory motion. At Potenza, which is not far from the same epicentre but a few miles outside the meizoseismal area, the separation was more pronounced. According to one observer, the first movement was from west to east; and, within a second or two afterwards, there was a less violent shock in a transverse direction, followed immediately by a shaking in all directions, called by the Italians vorticose. Naples lies sixty-nine miles from the north-west epicentre, and here more accurate observations could be made. Dr. Lardner, well known fifty years ago as a writer of scientific works, describes the first movement felt there as "a short, jarring, horizontal oscillation, that made all doors and windows rattle, and the floors and furniture creak. This ceased, and after an interval that seemed but a few seconds was renewed with greater violence, and, he thought, with a distinctly undulatory movement, 'like that in the cabin of a small vessel in a very short chopping sea.'"
In five other earthquakes studied in this volume, the separation of the shock into two parts was a well-marked phenomenon. In the Neapolitan earthquake, the separation was so distinct that Mallet took some [32]pains to account for its origin. He regarded it in every case as due to the reflection or refraction of the earth-waves by underlying rocks, though he does not explain why the reflected or refracted wave should be more intense than that transmitted directly. I shall refer to the subject in greater detail when describing the Andalusian, Charleston, Riviera, and Hereford earthquakes. For the present, it may be sufficient to urge that the double shock cannot have been due to the separation of the original waves by underground reflection or refraction, for then the second part should have been generally the weaker; nor to the succession of longitudinal and transverse waves, for, in that case, every earthquake-shock should be duplicated. The only remaining supposition is that there was a second impulse occurring either in the same or in a different focus.
Which alternative should be adopted, the evidence on the nature of the shock is too scanty to determine. The defect is, however, supplemented by Mallet's observations on the direction of motion; for, at many places within and near the meizoseismal area, he met with the clearest signs of a double direction. Sometimes this was apparent to the senses of the observer; in other cases, damaged buildings presented two sets of fissures. At La Sala and near Padula, the first movement was roughly east and west, the second north and south. At Moliterno, there was evidence of a subordinate shock at right angles to the chief one; in the neighbourhood of Tramutola, its direction was from about E. 30° S. In these and other cases, Mallet saw the effects of earthquake-echoes; but the underground reflection of earth-waves would give rise to the second part of the shock, not the first as [33]at La Sala and Padula. Moreover, the secondary directions, though they are seldom recorded accurately, point nearly to an epicentre not far from Montemurro. The observations on the nature and direction of the double shock thus confirm the conclusion, derived from the distribution of the seismic death-rate, that there were two detached foci, one near Polla and the other near Montemurro.
This seems to be the best explanation of the facts recorded by Mallet. There is, however, a possible difficulty that should not be overlooked—namely, the apparently slight influence of the Montemurro focus on the mean direction of the shock (Fig. 9). At a few places, of course, the mean direction passes through both epicentres; at some others, as we have seen, one of the two observed directions points towards the Montemurro epicentre. It is not impossible, also, that Mallet, after the first few days' work, may occasionally have quite unconsciously selected and measured those fissures from the maze presented to him which agreed most closely with his early impressions obtained from the neighbourhood of Polla. But, for places nearer Polla than Montemurro (and these form the majority of those visited by Mallet), the probable explanation of the difficulty is that the Montemurro focus was not so deep as the Polla focus. This, as will appear more fully in the next chapter, would account for the comparatively great intensity in the immediate neighbourhood of Montemurro and for its rapid decline outwards; and it receives some support from an isolated reference by Mallet to two angles of emergence at Padula, one of 25° from the north, and the other of 8° or 10° in the perpendicular walls.
[34]The elements of the wave-motion, as mentioned in the introductory chapter, are four in number, namely, the period, amplitude, maximum velocity, and maximum acceleration. If any two of these are known for each vibration—and the first two are now given by every accurately constructed seismograph—the others can be determined if the vibrations follow the law of simple harmonic motion.[15]
Amplitude.—To ascertain the amplitude, Mallet had to rely chiefly on the fissures made in very inelastic walls. If the parts into which such a wall are fractured are free to move, and yet, being inelastic, obliged to remain in the farthest position to which they are carried by the wave, the distance traversed by the centre of gravity of one of the displaced parts should give a "rude approximate measure" of the horizontal amplitude of the earth-wave. At Certosa, near Padula, he thus found the amplitude to be about 4 inches, at Sarconi about 4¾ inches, and at Tramutola about 4½ inches. From somewhat similar evidence, the amplitude at Polla appears to have been about 2½ or 3 inches; and, from the oscillation of a suspended clock or watch on a rough wall, about 3½ inches at La Sala and 1¾ inches at Barielle. With the exception of Barielle, these places lie nearly on a straight line passing through Mallet's epicentre, and he gives the following table, showing an increase in amplitude with the distance from the epicentre:—
[35]| Polla. | La Sala. | Certosa. | Tramutola. | Sarconi. | |
| Distance in miles | 4.0 | 13.4 | 19.0 | 23.8 | 30.8 |
| Amplitude in inches | 2½ | 3½ | 4 | 4½ | 4¾ |
The existence of the Montemurro focus must, however, complicate any relation that may connect these two quantities.
Maximum Velocity.—The means at Mallet's disposal for determining the maximum velocity were more numerous than those available for the amplitude. From the dimensions of a fallen column of regular form we should be able, he remarks, to find an inferior limit to the value of the maximum velocity; while a superior limit at the same place may be obtained from some other regular solid which escaped being overthrown. If a loose body is projected by the shock at a place where the angle of emergence is known, the horizontal and vertical distances traversed by the centre of gravity will give the velocity of projection. Or, if two such bodies are projected at one place, the same measures for each will as a rule give both the angle of emergence and the velocity of projection. A third method depends on the fissuring of walls, supposing that we know the force per unit surface which, when suddenly applied, is just sufficient to produce fracture. Sometimes more than one method must be applied to the same object. The two gate-pillars near Saponara (illustrated in Fig. 6) for example required a horizontal velocity of 5.48 feet per second to fracture them, and an additional velocity of 5.14 feet per second to overthrow them.
The well-known seismologist, Professor Milne, urges very forcibly that measurements obtained from the projection or fall of columns are unreliable, for the earlier tremors might cause the columns to rock, and [36]their overthrow need not therefore measure accurately the maximum velocity of the critical vibration.[16] There can be no doubt that Mallet was alive to this difficulty, though he may not have appreciated it at its full value. Thus, at the Certosa de St. Lorenzo, a monastery near Padula, a vase projected from the summit of a slender gate-pier implied a velocity of 21¾ feet per second; and the excess of about 8¼ feet per second above the velocity determined by other means is attributed by him to the oscillation of the pier itself. How far this source of error enters into other observations it is impossible to say; but it is worth noticing how closely the velocities obtained by different methods agree with one another. Thus, from projection only, we have velocities of 11.5 feet per second at the Certosa, 11.8 at Moliterno and Monticchio, 14.8 at Tramutola, and 9.8 feet per second at Sarconi; from overthrow alone, 11.0 feet per second at Viscolione, near Saponara, and 11.6 at Barielle; from overthrow and projection, 13.2 feet per second at Polla and 12.9 at Padula; from fracture and overthrow, 12.3 feet per second at Potenza and 15.6 at Saponara. The comparatively high values at Tramutola and Saponara, Mallet imagined might be due to the oscillation of the hills on which these towns are built. He therefore omits them in calculating the mean maximum velocity, which he finds to be twelve feet per second, a velocity less than that with which a man reaches the ground when he jumps off a table.
With the same omissions, Mallet gives the following table, showing a general decrease in the maximum velocity as the distance from his epicentre increases:—
[37]| Polla. | Padula. | Certosa. | Moliterno. | Sarconi. | Viscolione. | |
| Distance in miles | 4.0 | 19.0 | 19.0 | 29.4 | 30.0 | 30.8 |
| Max. vel. in ft. per sec. | 13.2 | 12.9 | 11.5 | 11.8 | 11.0 | 9.8 |
On the north side of the epicentre we have:—
| Potenza. | Monticchio. | Barielle. | ||
| Distance in miles | 17.3 | 27.1 | 28.2 | |
| Max. vel. in ft. per sec. | 12.3 | 11.8 | 11.6 |
It is not impossible that the high calculated velocities at Tramutola and Saponara were partly or entirely due to the impulse from the Montemurro focus.
If we take 4 inches for the amplitude of the largest variation, and 12 feet per second for the maximum velocity, and assume the motion to have been of a simple harmonic character, the period of a complete vibration would be less than one-fifth of a second.[17] Now, we know from seismographic records that this is roughly the period of the small tremors that form the commencement of an earthquake-shock, while the period of the largest vibrations may amount to as much as one or two seconds. We may therefore conclude either that the assumption of simple harmonic motion is incorrect, or that the maximum velocity is too great, or more probably perhaps that the amplitude is too small.[18]
Mallet was one of the first seismologists to realise the significance of the earthquake-sound; and he attended closely to the subject, though finding the [38]sound even more elusive of precise observation than the shock.
The chief result obtained by him was the comparative smallness of the area over which the sound was heard. He estimates it at little more than 3,300 square miles, or about one-twelfth of that over which the shock was felt. It extends north and south from Melfi to Lagonegro, and east and west from Monte Peloso to Duchessa and Senerchia. The sound was thus confined to the region in which the shock attained its most destructive character.
Towards the north and south ends of the sound-area all observers described the sound as a low, grating, heavy, sighing rush, lasting from twenty to sixty seconds, some adding that it was also of a rumbling nature. Near the centre and the east and west boundaries, the sound was distinctly more rumbling; it was shorter in duration, and began and ended more abruptly.
The earthquake, Mallet remarks, "began everywhere with tremors; the sounds generally arrived at the same time; the apparent direction of movement of the tremulous oscillations appeared rapidly to change, and still more rapidly to increase in amplitude; then the great shove of the destructive shock arrived, in some places rather before, in some a little after, the moment of loudest sound, and it died away suddenly (i.e., with extreme rapidity) into tremors again, but differing in direction from that of the great shock itself."[19]
The earthquake-sound will be described more fully in the chapter dealing with the Hereford earthquake [39]of 1896, in which it will be found that the phenomena recorded by Mallet are equally characteristic of the slighter shocks felt in this country.
In 1857 little was known about the velocity of earthquake-waves. Experiments had been made by Mallet himself in 1849 in the neighbourhood of Dublin. These gave 825 feet per second for the velocity in dense wet sand, 1,306 feet per second in discontinuous granite, and 1,665 feet per second in more solid granite.[20] The only earthquake for which the velocity had been calculated was the Rhenish earthquake of 1846, the value ascertained by Schmidt being 1,376 French feet, or 1,466 English feet, per second.
The accurate public measurement of time, which, as Mallet remarks, is one of the surest indications of advancing civilisation, was, however, unknown in the kingdom of Naples; and his attempt was therefore fettered by the rarity of precise estimates of the time of occurrence. Throughout the whole disturbed area only six good records could be obtained, and three of these (at Vietri di Potenza, Atella, and Naples) were derived from stopped clocks, witnesses of rather doubtful value. At Montefermo and Barielle the time was at once read from a watch, and at Melfi from an accurate pocket chronometer. The times given vary from 9h. 59m. 16s. P.M. (Naples mean time) at Vietri di Potenza to 10h. 7m. 44s. at Naples. Allowing for the supposed change of direction by refraction at [40]the Monte St. Angelo range on the way to Naples, Mallet finds the mean surface velocity to be 787 feet per second. Omitting the Naples record, and taking account of the calculated depth of the focus, the mean velocity becomes 804 feet per second.
A great earthquake rarely, if ever, occurs without some preparation in the form of a marked increase of seismic activity. Perrey records several shocks during the two years 1856-57 that were felt at places as far apart as Naples, Melfi, and Cosenza. On December 7th, 1857, a slight shock, with a report from beneath like the explosion of a mine, was felt at Potenza. Then came the great earthquake on December 16th, at about 10 P.M.
This was followed by numerous after-shocks—how numerous it is impossible to say, for the records are of the scantiest description. For some hours the ground within the meizoseismal area is said to have trembled almost incessantly. At Potenza many slight shocks, both vertical and horizontal, were felt during the night, and for a month or more they were so frequent as to render enumeration difficult. Mallet's last record is dated March 23rd, 1858, when four slight shocks were felt at La Sala and Potenza, but occasional tremors were reported to him until May 1859.
The most important of all these after-shocks was one felt about an hour after the principal earthquake. Everywhere far less powerful, it was yet strong enough to shake down many buildings at Polla that had been shattered by the great shock. [41]Towards the south at Moliterno, and towards the north at Oliveto and Barielle, it evidently attracted very little attention. So far as can be judged from the evidence given by Mallet, the disturbed area seems to have been approximately of the same form and dimensions as the meizoseismal area, and elongated in the same direction, but concentric with the north-west focus.
On the other hand, if we may rely on too brief evidence, several after-shocks recorded only at Montemurro, Saponara, Viggiano, or Lagonegro, were probably connected with the south-east or Montemurro focus.
Mallet's theories have suffered perhaps more than any other part of his work from the recent growth of our knowledge. From a historical point of view, some reference to his explanation of the origin of the Neapolitan earthquake seems desirable, and his own conscientious work demands it. On the other hand, his conclusions are, for the present at any rate, superseded, and it will therefore be sufficient to describe them briefly.
Most of the wave-paths, as we have seen, pass within three miles of a point almost coincident with the village of Caggiano. Of the remainder, six traverse a spot about two miles farther to the south-west, and three cross another about two miles farther to the north-east. Neglecting other points of intersection, but taking account of the observed emergences at Vietri di Potenza, Auletta, Polla, etc., Mallet infers that the horizontal section of the focus [42]was a curve (indicated by the dotted line in Fig. 9) not less than ten miles in length, and passing from near Balvano on the north, close to Vietri di Potenza, Caggiano, and Pertosa, to a point about two and a half miles west of Polla. Again, he remarks, the observed emergences at places near the epicentre indicate that the vertical section of the seismic focus was either more or less curved, or more probably a surface inclined towards the south-east. He concludes, therefore, that the seismic focus was a curved fissure, 10 miles long and 3½ miles in height, and with its centre at a depth of 6½ miles below the level of the sea.
The production of this great fissure, accompanied, perhaps by the injection into it of steam at high pressure, was regarded by Mallet as the cause of the principal earthquake. He imagines that the rent would start at or near the central point of the focus and then extend rapidly outwards in all directions. In the initial stage, vibrations of very small amplitude would alone be transmitted, and these would give rise to the early sounds and tremors. As the rending proceeded, the vibrations would increase in strength up to a certain point when they produced the shock itself. After this, they would decrease; and, in the final stage, would give place to the small vibrations corresponding to the sounds and tremors that marked the close of the earthquake.
The rush of steam at high pressure into the focus Mallet does not seem to have considered essential, though he evidently regarded it as possible, indeed probable; and he suggests that it may have been in part the cause of the earthquake which occurred an hour later. Though feeling sceptical as to the [43]existence of any general law of increase of underground temperature, he assumes it, for the sake of illustration, to be 1° F. for every 60 feet of descent. This would give a temperature of 339° F. at the upper limit of the focus, 643° F. at its central point, and 884° F. at its lower margin. If the focus were filled with steam at each of these temperatures, the corresponding pressures on its walls would be 8, 149, and 684 atmospheres, respectively. As the steam may be supposed to be admitted suddenly and to be unlimited in supply, Mallet infers that it might exist at the tension due to the highest of these temperatures, in which case it would be capable of lifting a column of limestone 8,550 feet in height (or about one-half the depth of the upper margin of the focus), and would exert a pressure on the walls of the focus of 4.58 tons per square inch, or of more than 640,528 millions of tons upon its whole surface.
So many pages have already been given to this interesting earthquake that I must sketch still more briefly my own view as to its origin. There were, I believe, two distinct foci with their centres about twenty-four miles apart along a north-west and south-east line, and it was to this arrangement that the elongation of the meizoseismal area was chiefly, though not entirely, due. The evidence is insufficient to determine whether the earthquake was caused by fault-slipping; it is in no way opposed to this view, but if the Neapolitan earthquake stood alone, we should hardly be justified in drawing any further inference. Relying, however, on knowledge obtained from the study of more recent shocks, it seems to me probable that the two foci formed parts of one [44]fault with a general north-west and south-east direction. The slip causing the first part of the double shock apparently took place within the south-east focus, and was followed after a few seconds by one within the north-west focus, greater in amount as well as more deeply seated. In consequence of these displacements there were local increases of stress, causing numerous small slips within or near both principal foci; and, if we may judge from some slight shocks felt at La Sala, accompanied also by other minor slips in the intermediate region of the fault.
Mallet, R.—The Great Neapolitan Earthquake of 1857: The First Principles of Observational Seismology, etc. 2 vols 1862.
[3] Irish Acad. Trans., vol. xxi., 1848, pp. 51-105 (read Feb. 9, 1846).
[4] Brit. Assoc. Reports, 1850, pp. 1-87; 1851, pp. 272-330; 1852, pp. 1-176; 1853, pp. 117-212; 1854, pp. 1-326; 1858, pp. 1-136.
[5] A Manual of Scientific Enquiry, edited by Sir J.F.W. Herschel, 1849, pp. 196-223.
[6] Irish Acad. Trans., vol. xxii., 1855, pp. 397-410.
[7] The linear dimensions of the isoseismal lines are obtained by measurements from Mallet's maps. The areas are given by him in geographical square miles.
[8] Mallet, by some accident, omitted the losses at Polla and neighbouring towns from this estimate. Mercalli (Geologia d'Italia, pte. 3, p. 324) gives the number of killed as more than 12,300.
[9] Mallet does not make use of the term epicentre; he speaks of the line FE as the seismic vertical. The modern and accepted terms are used above.
[10] Japan Seismol. Soc. Trans., vol. xi., 1887, pp. 175-177.
[11] Ital. Seismol. Soc. Boll., vol. ii., 1896, pp. 180-188.
[12] Professor Omori gives the mean direction as S. 71° W., but this was obtained from observation on lamps with square, as well as with circular bases.
[13] Twelve measurements chosen at random from Professor Omori's list gave a mean direction of S. 78° W.
[14] When the accuracy of all the observations seemed equally probable, he adopted the mean of the two extremes as the true direction.
[15] If a be the amplitude of a simple harmonic vibration, T its complete period, v its maximum velocity, and f its maximum acceleration, we have v = 2πa ÷ T and f = 4π²a ÷ T²
[16] Earthquakes and other Earth Movements, pp. 81-82.
[17] Obtained from the formula: T = 2πa ÷ v = 2πx ⅓ ÷ 12
[18] If we take the maximum velocity to be 12 feet per second, and the period to be one second, the amplitude would be about 11½ inches.
[19] Vol. ii., p. 299. The punctuation of the original is not followed in the above extract.
[20] British Association Report, 1851, pp. 272-320.
Separated from Italy by a distance of not more than six miles, Ischia and the intermediate island of Procida strictly form part of the Phlegræan Fields, the well-known volcanic district to the north of Naples. Ischia, the larger of the two islands, is six miles long from east to west, and five miles from north to south, and contains an area of twenty-six square miles. In 1881, the total population was 22,170, that of Casamicciola, the largest town, being 3,963.
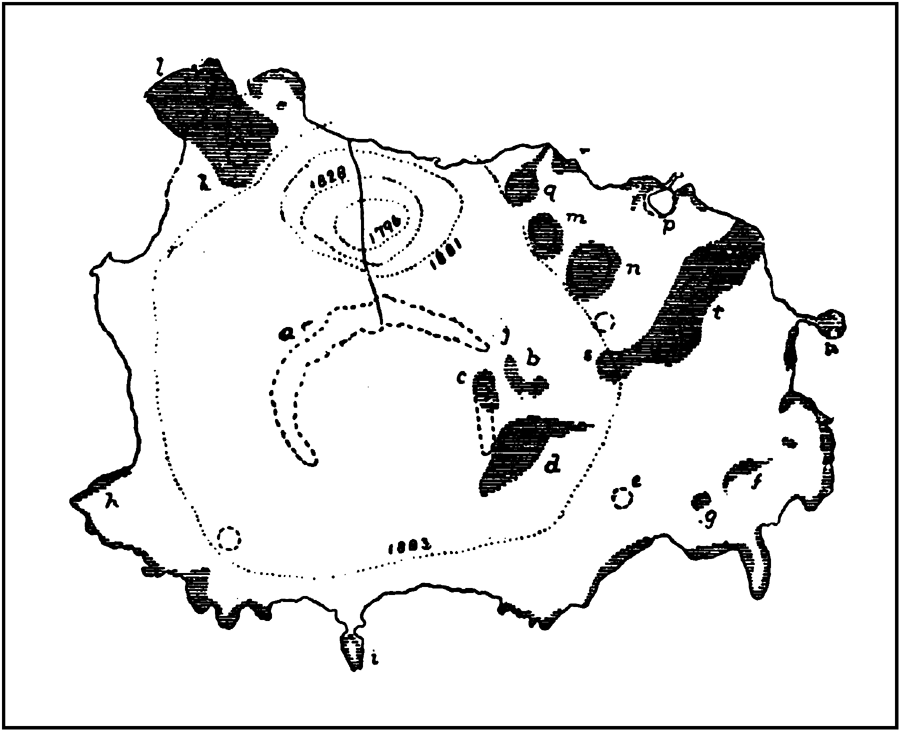
The central feature of Ischia is the great crater of Epomeo (a, Fig. 14). On the south side, and partly also on the east, the crater-wall has been broken down and removed; the portion remaining is about 1½ mile in diameter from east to west, and reaches a height of 2,600 feet above the sea-level. All the upper part of the mountain is composed of a pumiceous tufa, rich in sanidine and of a characteristic greenish colour. At two points, to the west near Forio and to the north between Lacco and Casamicciola, this tufa is seen reaching down to the sea; but, in all other parts, it is covered by streams of trachitic lava, by more recent tufas, or by a deposit of marly appearance, [46]which is regarded by Fuchs as resulting from the decomposition of the Epomean tufa.
There are two distinct periods in the geological history of Ischia. The first, a submarine period, probably began with the dawn of the quaternary epoch, for all the marine fossils of the island belong to existing species. About this time, Epomeo seems to have originated in eruptions occurring in a sea at least 1,700 feet in depth—eruptions that preceded the formation of Monte Somma and were either contemporaneous or alternating with those that gave rise to the oldest trachitic tufas of the Phlegræan Fields. The destruction of the south wall may have occurred much later through some great eruptive paroxysm, but more probably, as Professor Mercalli suggests, through early marine erosion and subsequent subaerial denudation. To the submarine period must also be assigned the formation of the trachitic masses which compose Monti Trippiti, Vetta, and Garofoli (b, c, d, Fig. 14), on the east side of Epomeo; and, in part only, those of Monte Campagnano and Monte Vezza (f, g).
At or near the close of the elevation, many violent eruptions occurred on the south-west of Epomeo, during which was formed the south-west corner of the island, including Monte Imperatore and Capo Sant' Angelo (h, i).
In the second or terrestrial period, when the island had practically attained its present altitude, the eruptive activity was almost confined to the eastern and northern flanks of Epomeo. At the beginning Monte Lo Toppo (j) was formed by a lateral eruption. In the north-west corner of the island, Monte Marecocco and Monte Zale (k and l) owe their origin to a gigantic flow of sanidinic trachite,[47] [48]issuing probably from the depression which now exists between them. Lastly, towards the north-east, are the recent lateral craters of Rotaro, Montagnone, Bagno, and Cremate (m, n, p, s), the first two being the most regular and best preserved in the island.
The earliest eruption of the historic, or rather human, period appears to have taken place from Montagnone, and probably also at about the same time from the secondary crater of Porto d'Ischia (u), about the beginning of the eleventh century B.C. The eruptions of Marecocco and Zale are referred to about B.C. 470; and those of Rotaro and Tabor (q) to between the years 400 and 352 B.C. Another eruption is said to have occurred in B.C. 89, but the site of it is unknown; and three others are recorded on doubtful authority about the years A.D. 79-81, 138-161, and 284-305. The last outburst of all took place after the series of earthquakes in 1302 from a new crater, that of Cremate (s), which opened on the north-east flank of Epomeo, and from which a stream of lava, called the Arso (t), flowed down rapidly and, after a course of two miles, reached the sea.
After the first eruptions to which it owed its origin, the central crater of Epomeo apparently remained inactive. All the later eruptions occurred either on the external flanks of the mountain or on radial fractures of the cone.[22] Trippiti, Lo Toppo, Montagnone and the Lago del Bagno (b, j, n, p) lie in one line, Vetta and Cremate (c, s) on another, and Garofoli and Vatoliere (d, e) on a third, all passing through a point near the town of Fontana, which occupies the centre of the old crater of Epomeo.
[49]Professor Mercalli points out that the lateral eruptions of Epomeo differ in one respect from those of Etna and Vesuvius. In these volcanoes the lava ascends to a considerable height in the central chimney, and by its own weight rends open the flanks of the cone. In Epomeo, it appears to traverse lateral passages at some depth, perhaps far below the level of the sea, and to rend the mountain by means of the elastic force of the aqueous vapour, etc., which it contains. It will be seen how important is the bearing of this difference on the occurrence of the Ischian earthquakes.
The eruptions that have taken place during the last three thousand years agree in several particulars. They either occurred suddenly, or, at any rate, were not preceded by a stage of moderate Strombolian activity; they were always accompanied by violent earthquakes; and all succeeded intervals of long repose. As the eruption of 1302 happened after at least a thousand years of rest, the lapse of six more centuries does not justify us in concluding that Epomeo is at last extinct.
We seem, on the contrary, to be drawing near another epoch of activity. During the four and a half centuries that followed the eruption of 1302, we have no record of Ischian earthquakes.[23] Then, suddenly, on the night of July 28-29, 1762, Casamicciola was visited by sixty-two shocks, some of which were very strong and damaged buildings. On March 18th, 1796, another severe shock took place, but destructive only in the neighbourhood of Casamicciola, where seven persons were killed. On February 2nd, 1828, the area of damage, though concentric with the [50]former, enlarged its boundaries; 30 persons were killed and 50 wounded. On March 6th, 1841, and during the night of August 15-16, 1867, further shocks injured houses at Casamicciola, but without causing any loss of life. Slight tremors occurred at various dates in 1874, 1875, 1879, and 1880, leading up to the disastrous earthquakes here described, those of March 4th, 1881, when 127 persons were killed, and July 28th, 1883, which resulted in the death of 2,313 persons and the wounding of many others.
The Ischian earthquakes have been fortunate in their investigators. In the spring of 1881, Dr. H.J. Johnston-Lavis, the chronicler for many years of Vesuvian phenomena, was residing in Naples. Impressed by a recent perusal of Mallet's report on the Neapolitan earthquake, and wishing to test the value of the methods explained in the last chapter, he crossed over to Ischia on March 5th; and to his unwearied inquiries extending over more than three weeks and lasting from thirteen to sixteen hours a day, we are indebted for most of what we know about the earthquake of 1881.
On March 4th, at 1.5 P.M., the great shock occurred abruptly, without any warning tremors. Its effects were aggravated by the faulty construction of the houses. The walls are of great thickness, loosely put together, and connected by mortar of the poorest quality. The chimneys and roofs also are massive, and the rafters are so slightly inserted in the walls that they were drawn out with the rocking of the houses. In such cases, the destruction was often so complete that no fissures were left available for measurement.
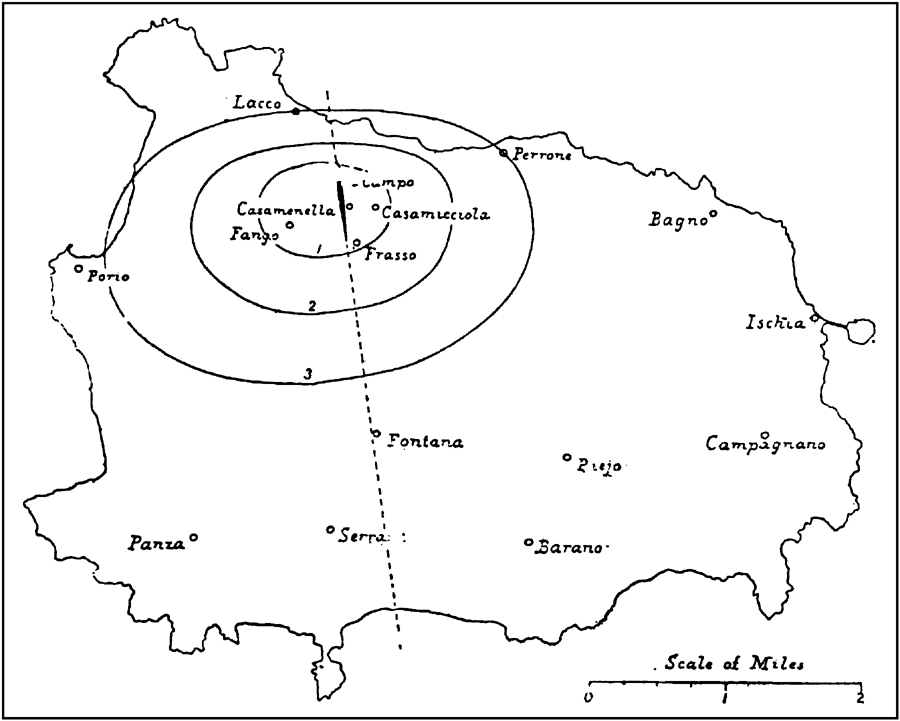
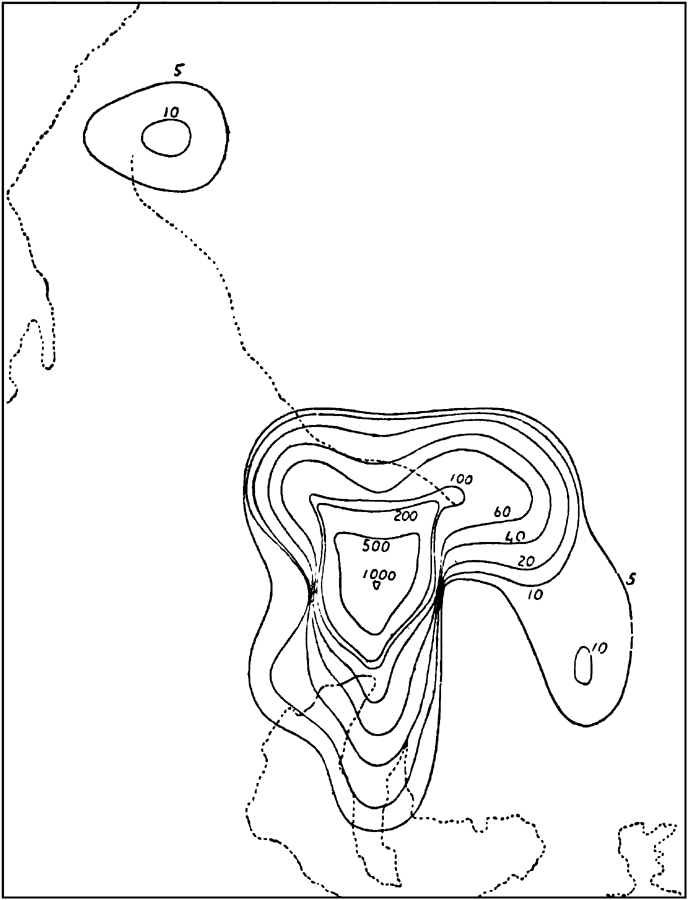
[51]The isoseismal lines as drawn by Dr. Johnston-Lavis are represented by the curves in Fig. 15. The isoseismal marked 1 bounds the area of complete destruction; it is about 1 mile long from east to west, 2/3 of a mile broad, and contains an area of not more than half a square mile. The next isoseismal (2) marks the area of partial, but still serious, destruction; this is nearly 2 miles long from east to west, 1¼ miles broad, and 2 square miles in area. Within the isoseismal 3, buildings were more or less slightly damaged. The course of this curve is somewhat doubtful, but, as [52]drawn, it is about 3 miles long, 2 miles wide, and 5 square miles in area.
Outside the last curve, the shock diminished rapidly in intensity. At Monte Tabor and Bagno, it was very slight; in the town of Ischia, only about half the people were conscious of any movement; and at Capella, a small village to the south, it was not felt at all. Again, the shock was perceptible, though only faintly, in the neighbourhood of Campagnano, at Serrara to the south of Epomeo, and at Panza near the south-west corner of the island. On the other hand, at Fontana, which occupies approximately the centre of the crater of Epomeo, there were evidences of a distinctly stronger shock. No house actually fell, and side walls were but little injured; but the roofs, which are of great weight, suffered considerable injury.
In the adjacent island of Procida, the shock was felt distinctly by many people, and by some, though slightly, at Monte di Procida, Misenum, and Bacoli, on the coast of Italy. No record whatever was given by the seismographs in the university of Naples and the observatory on Vesuvius. We have of course no means of estimating the exact size of the disturbed area, but in this respect, disastrous as the earthquake was in the neighbourhood of Casamicciola, it was clearly inferior to all but the very weakest earthquakes felt in the British Islands.
In determining the position of the epicentre, Mallet's method was closely followed. Fissures in buildings were used for the most part, in two out of [53]every three cases; and occasional measurements were made from objects overthrown, projected, or shifted, and also from the personal experiences of observers. The attempt to apply the method was, however, fraught with difficulties. The heterogeneous structure of the island was no doubt responsible for many divergent azimuths; the irregularity of the buildings both in form and material and their variety of site furnished other sources of error; even the smallness of the area was a disadvantage in lessening the number of trustworthy records.
Measurements were made at 55 places altogether, but in most cases they were the results of isolated observations, not the means of several at each place. On this account, I have not reproduced in Fig. 15 the azimuths shown in Dr. Johnston-Lavis's map of the earthquake. A large number of them clearly converge towards an area lying to the west of Casamicciola; and, from their arrangement, Dr. Johnston-Lavis concludes, though the evidence does not seem to me quite strong enough for the purpose, that they emanated from a fracture running from a little west of north to a little east of south.
This conclusion is, however, justified by other evidence. In the centre of the injured district, Dr. Johnston-Lavis has traced a meizoseismal band, in which the shock must have been nearly or quite vertical. "The damage inflicted on buildings included within this band was," he says, "very characteristic of the nature of the shock; the walls having received but slight injury, whilst almost every floor and ceiling had been totally destroyed. In fact," he adds, "many houses would have required no other repairs than the replacing of the divisions between [54]the different storeys." The shaded central area in Fig. 15 represents this band, passing in a nearly north and south direction from a point midway between Campo and the upper part of Lacco on the north, through the west part of Casamenella and Campo, to a point near Frasso on the south; the length of the band being thus about two-thirds of a mile.
If the central line of this band is produced towards the south, as indicated by the dotted line, it grazes the west side of Fontana, where, as we have seen, there was a second meizoseismal area, much smaller than the other and surrounded by a district in which houses were almost uninjured. That the shock in this town was vertical or nearly so, is shown by the nature of the damage (p. 52) and also by the testimony of the inhabitants. I will give Dr. Johnston-Lavis's explanation of this detached meizoseismal area when discussing the origin of the Ischian earthquakes; but the evidence seems to me to favour either the existence of two distinct foci or, more probably perhaps, the extension of the fissure to the south with an increased impulse beneath the centre of Epomeo.
At nine places, Dr. Johnston-Lavis was able to make measurements of the angle of emergence, in every case from fissures in buildings, and therefore liable to sources of error already referred to. On the other hand, owing to the small depth of the focus, there would probably be less general refraction of the wave-paths than in the Neapolitan earthquake. The depths indicated by these observations vary between [55]about 615 and 2,885 feet, a difference that is no greater than might be expected, as the size of the focus was no doubt comparable with that of the district in which observations were made. The mean depth Dr. Johnston-Lavis finds to be about 1,700 feet, or a little less than one-third of a mile.
The limited depth of the focus is also evident from the nature of the shock. It was only within the actual meizoseismal band that the shock was subsultory or vertical throughout; at a short distance from the epicentre, the movement was both subsultory and undulatory; while near the third isoseismal, and in most of the region outside, the movement was entirely undulatory or lateral. An observer at Perrone (which lies 1-2/3 miles east of the epicentre) gives the following account of the shock:—"I was standing on my balcony (this faces Casamicciola) admiring the scene ... when I felt the house rock, feeling at the same time as if something was rolling along beneath the ground. This movement was accompanied by a sound like this, Boob, boob—boob— — boob— — — boob— — — — boob. Both noise and movement seemed to come from Casamicciola.... In a few seconds, in the distance over the town arose a terrific cloud of white dust, so that I imagined the town on fire.... I felt hardly any, if any, subsultory movement, but as I leant upon the balcony rails, I was alternately pressed against them and then drawn away."
At Fontana, however, the undulatory shock was replaced by a vertical one. This was the universal experience, though one or two persons felt a slight [56]lateral movement immediately after. At Valle (near Barano) and Piejo, both places about a mile from Fontana, the vertical component was also perceptible.
The after-shocks were few and of slight intensity. Dr. Johnston-Lavis gives the following dates: March 7th, 12.5 A.M. and midday; March 11-12, 15-16, 17-18, 27 (?), April 5th and 6th, and July 18th, 8.30 P.M. The only shock of the series marked as strong occurred at midnight on March 15-16 at Casamicciola. The last of all, that of July 18th, consisted of a rumble and slight shock, and was most perceptible at Fango.
Undeterred by the experience of 1881 or by the warnings of seismologists, Casamicciola was rebuilt, only to suffer more complete disaster. On July 28th, 1883, at 9.25 P.M., occurred the most destructive earthquake of which we have any record in Ischia. The shock lasted about fifteen seconds, and before it was over clouds of dust were rising above the ruins of Casamicciola, Lacco, and Forio; 1,200 houses were destroyed, 2,313 persons were killed, nearly 1,800 in Casamicciola alone, and more than 800 seriously wounded. "No better idea," says Dr. Johnston-Lavis, "of the absolute destruction of buildings could be conceived than what was actually realised at Casamicciola and Campo. Looking, on the following Monday, over the field of destruction, I could discover (with few exceptions) the wall-stumps only remaining."
[57]Dr. Johnston-Lavis again spent about three weeks in the island, examining the effects of the new shock with equal zeal and wider experience. His monograph is now our chief work of reference on Ischian earthquakes. Inquiries were also made by several Italian seismologists, among others by Professor M.S. de Rossi, the organiser of earthquake-studies in the peninsula; by Professor L. Palmieri, the founder of the Vesuvian observatory; and especially by Professor G. Mercalli, whose valuable memoir supplements the report of Dr. Johnston-Lavis in some important particulars.
The interval between July 18th, 1881, when the last shock of that year was felt, and July 28th, 1883, was one of almost complete quiescence. Early in March 1882, a few slight shocks were noticed at Casamicciola. On July 24th, 1883, a watch hanging from a nail in a wall was seen to swing at 6 A.M. and 9 A.M., and, on the same morning, at about 8.30, a slight shock, accompanied by a rumbling sound, was felt at Casamicciola. Again, on the 28th, about a quarter of an hour before the great shock, one observer at Casamicciola states that an underground noise was heard, and that some persons in consequence left their houses.
Many assertions have been made with regard to variations witnessed a day or two before the shock in the hot springs, such as an increase of flow or temperature and changes in their volume and purity. Fumaroles are alleged to have burst out with violence, and even flames to have been seen. The statements, [58]though widely quoted, can hardly be said to rest on satisfactory evidence. On the other hand, Dr. Johnston-Lavis arrived in the island within twenty-four hours after the shock, and, before another day had elapsed, he had examined most of the places where the phenomena were said to have occurred, but could find no remarkable change nor any signs of such having taken place. It is also known, as he remarks, that the temperature of the Ischian springs and fumaroles sometimes varies considerably without any earthquake following, that of the water of Gurgitello occasionally changing by as much as 30° or 40°. We may therefore, I think, conclude that, except for one or two shocks and underground noises too slight to cause general alarm, there were no decisive heralds of the great earthquake.
The curves in Fig. 16 represent the isoseismal lines as drawn by Dr. Johnston-Lavis. As in the earthquake of 1881, they bound respectively the areas of complete destruction, partial destruction and slight damage to buildings, the course of the outer line being to a great extent conjectural owing to the small extent of land traversed by it. The first isoseismal is about 2½ miles long, 1½ miles broad, and 3 square miles in area; the second about 4 miles long, 3½ miles broad, and 11 square miles in area; and the third about 6½ miles long, 6 miles broad, and 30 square miles in area. The curve drawn by Professor Mercalli (Fig. 14) coincides nearly with the second of these lines.
At Fontana, the damage exceeded that in the [59]surrounding country, though the difference was of course less marked than on the previous occasion.
Outside Ischia, the shock was felt distinctly in all the island of Procida and in Vivara; on the mainland, [60]by some as far as Pozzuoli and by several persons in Naples, which is twenty miles from Casamicciola. The seismograph at the university of this city registered two small shocks, the first at 9.10 P.M., and the second and stronger at 9.25 P.M.; and De Rossi states that at about 9.30 P.M. the seismographs at Ceccano, Velletri, and Rome recorded a shock consisting of very slow undulations. There are again no materials for estimating the size of the disturbed area, but there can be no doubt that it was much less than that of a moderately strong British earthquake.
Owing to the limited size of the disturbed area, time-observations, even had they been available, would not have sufficed to determine the position of the epicentre, and both Dr. Johnston-Lavis and Professor Mercalli therefore had recourse to Mallet's method, the former relying chiefly, as before, on fissures in damaged buildings, and the latter on the overthrow or displacement of columns and other objects.
Dr. Johnston-Lavis measured the azimuth of the wave-paths at sixty-five places, and at about one-third of these was able to make two or more observations. The azimuths converge towards the same region as in 1881, but the area covered by their intersections is larger. The meizoseismal band of maximum vertical destruction indicated by shading in Fig. 16 is also of the same form and slightly greater extent, reaching from the upper part of Lacco to a little south of Frasso, and being therefore nearly a mile in length. The centre of maximum impulse was in the same position as in 1881, or possibly a little more to the south.
[61]Professor Mercalli's observations were made at forty-eight places, and in only six cases were they the same as those used by his predecessor. He also notices that most of the azimuths converge towards Casamenella, and intersect within an elongated area. This area runs in the same direction as Dr. Johnston-Lavis's meizoseismal band, but is less elongated, and situated a short distance farther to the south, though on the whole the agreement between the two areas is remarkably close.
There was again apparently a second epicentre at Fontana. In this town, according to Dr. Johnston-Lavis, there were two distinct types of damage. As in 1881, there was evidence of a vertical blow, the only one that absolutely ruined houses; but, in addition, there was another independent set of fissures, quite as widely distributed as the others, though evidently caused by a less violent movement. These indicated a wave-path with a low angle of emergence coming from between north and north-north-west, or almost exactly in the line of meizoseismal band. To the south of Fontana, however, there is a group of places, including Panza, Serrara, Barano, etc., where the azimuths diverged rather widely from the epicentre at Casamenella. These azimuths are twelve in number, and it is worthy of notice that they all intersected the crater of Epomeo, while half of them passed within a few hundred yards of Fontana.
Measurements of the angle of emergence were made by Dr. Johnston-Lavis at twenty-four places, and in [62]every case from fissured walls. The greater part of the diagram on which his results are depicted is reproduced in Fig. 17. The horizontal line, as in Fig. 13, represents the level of the sea, the longer vertical line one passing through the epicentre, and the shorter another through Fontana. The short lines on [63]the left of the former show the incipient wave-paths to places lying east of the epicentre; those on the right, with one exception, represent the wave-paths to places west of the same meridian. Small horizontal marks are inserted on the vertical lines to show the depth in tenths of a mile below the level of the sea.

Fig. 17.—Diagram of wave-paths at seismic vertical of Ischian earthquake of 1883. (Johnston-Lavis.)ToList
The six angles of emergence that would give the greatest depth below the epicentre were all measured at places in the south of the island close to the line joining Panza and Barano, and it will be noticed that five of these apparent depths are much greater than those obtained from the other wave-paths. Excluding these observations, the remaining eighteen give depths ranging from about 450 to about 3,350 feet, and a mean depth of 1,730 feet,[24] or nearly one-third of a mile, that is, almost exactly the same as the mean depth found from the earthquake of 1881.
The six exceptional angles of emergence come from the district of divergent azimuths to the south of Epomeo. Three of the corresponding azimuths pass within one-quarter of a mile from the centre of Fontana, and none of the other three more than three-quarters of a mile from the same point. Though disbelieving in a subsidiary focus below this town, Dr. Johnston-Lavis has calculated its mean depth, supposing it to exist, and found it to be about 1,560 feet below the sea level, a result which is remarkably close to the calculated mean depth of the focus near Casamenella.
[64]In the meizoseismal band, preliminary tremor and rumbling sound were alike absent. So sudden, indeed, was the onset of the earthquake, that the survivors generally found themselves beneath the ruins of their houses before they were conscious of any shock. The destruction, practically instantaneous, was wrought by four or five vertical blows, so powerful that, according to some observers, Casamicciola seemed to jump into the air. Then followed undulations, not noticed by all, that appeared to come from every direction. The shock lasted altogether fifteen seconds or more,[25] and was accompanied by a rumbling noise, in the midst of which were detonations as of thunder or of great blows given upon an empty barrel.
In the immediate neighbourhood of the meizoseismal area, at Perrone, Pennella, and Lower Lacco, the subsultory movement was still the more prominent; but, farther away, as at Panza, Testacchio, Barano, Ischia, and Bagno, the subsultory motion was followed by distinctly horizontal undulations, while outside the island of Ischia only slow undulatory movements were perceptible.
The dotted areas in Fig. 16 indicate the sites of the only landslips of importance that were precipitated by the earthquake of 1883. Two of these occurred [65]on the north slope of Epomeo, and the third on the west flank of Monte Rotaro. The materials of the Epomean landslips had evidently been separated for some time by shallow fissures from the adjoining rock, for the surfaces of the fissures were discoloured by fumarolic action. Immediately after the earthquake a cloud of dust was seen to rise from the spots; the masses, already detached laterally, were merely set in motion by the shock; and they continued to slide down during the following days either through the action of the after-shocks or of the heavy rains that followed.
All over the island, however, fissures and minor landslips occurred. At two places on the north coast the steep cliffs of incoherent tufa were so much damaged that, according to Dr. Johnston-Lavis, "large quantities of their materials were thrown into the sea. The water then sorted out the pieces of pumice, which in many cases were of very large size, and were seen floating about in the neighbourhood for some days," giving rise to the supposition that a submarine eruption had taken place to the north of the island.
The after-shocks in 1883 were much more numerous than in 1881. Between 9.25 P.M. on July 28th and noon on August 3rd, twenty-one slight shocks were recorded at Casamicciola. At 2.15 P.M. on August 3rd, a violent shock occurred that caused further damage at Forio, and even at places so far from the epicentre as Fiaiano, Barano, and Fontana, and increased the displacements of the landslips on [66]Epomeo. This shock was also registered at the observatory on Vesuvius.
After this the shocks became less frequent and slighter, twelve being felt at Casamicciola during the remainder of the year, and six in the first half of 1884. Several shocks and rumbling noises were also observed in other parts of the island. Among them may be mentioned noises heard at Fontana on August 12th and 15th, and a slight shock at the same place on August 17th; also on September 4th, at 10.30 and 10.40 A.M., slight shocks at Barano, Serrara, and Forio. On March 27th, 1884, at 2.7 P.M., another strong shock occurred; strongest at Serrara, where the shock was subsultory and accompanied by noise; and less strong, though still subsultory, at Ciglio, Panza, Forio, Fiaiano, and Casamicciola, and very slight at Ischia. The series seems to have ended during the following summer, with a slight shock at Casamicciola on July 21st, and a stronger one on July 23rd, felt from Casamicciola on the north to Serrara on the south.
Most of the after-shocks must have originated in the neighbourhood of Casamicciola, but it is worthy of notice that more than one centre was in action. Several were recorded at Ischia only. Others, as mentioned above, affected chiefly the south part of the island, and especially the small towns of Serrara and Fontana.
After the eruption of 1302, there succeeded a period of comparative repose in Ischia. The revival of activity dates from 1762, and, since that year, there [67]have been four great earthquakes, namely, those of 1796, 1828, 1881, and 1883. In every respect but that of increasing intensity, these earthquakes were apparently identical; each, as Professor Mercalli says, was merely a replica on a different scale of those that preceded it. The principal features in which they resemble one another, and differ from the average tectonic earthquake, are the coincidence of the epicentres, the small depth of the foci, and the sudden onset of the principal shock.
1. Coincidence of Epicentres.—In Fig. 14, which is copied from Professor Mercalli's map, are shown the areas in which buildings were seriously damaged by these four earthquakes. The curves for 1796, 1828, and 1881 are approximately concentric. In 1796, the shock was disastrous only to the west of Casamicciola; in 1828, according to Covelli, "the ground most injured was not precisely the region of Casamicciola, but that which lies between the district called Fango and that known as Casamenella, situated to the west of Casamicciola, and a short distance from it."[26] The epicentres may have varied slightly in size, but, in position, it is clear that all four were nearly or quite coincident. The meizoseismal bands in 1881 and 1883 were also similar in form and elongated in the same direction.
In the last two earthquakes there was, as we have seen, very distinct evidence of a secondary meizoseismal area surrounding Fontana, and it is remarkable that this was also noticeable in the earthquake of 1828. "Besides the centre of vibration in the district of Fango," says Covelli, "another less powerful centre [68]showed itself in the locality of Fontana; this made itself felt more heavily than in surrounding localities; as if another centre of movement had taken place from that part, independent of the former."
2. Small Depth of the Foci.—Mallet's method, as noted above, cannot be trusted to yield accurate estimates of the focal depth, or to indicate more than its order of magnitude. But it is remarkable that the depths calculated by Dr. Johnston-Lavis for the last two earthquakes are both only a little less than a third of a mile, and it is probable that the actual depth did not differ very greatly from this amount. The nature of the shock, vertical or nearly so close to the epicentre and horizontal at a short distance from it, is merely personal testimony of the same character as fissures in masonry, and of course points to the same result.
But the most conclusive evidence on which we have to rely is the extraordinary intensity of the shock at the centre of a very small distributed area. In Great Britain, an earthquake felt over a district of equal size would hardly at the centre exceed the trembling produced in a station platform by a passing train. The curves in Fig. 18 show how the rate of decline in intensity depends on the depth of the focus. They are drawn on the supposition that the intensity at any point on the surface varies inversely as the square of its distance from the focus; the curves a, b, c corresponding to foci situated at depths [69]of one-third of a mile, one mile, and two miles respectively, and the figures below the horizontal line denoting the distance in miles from the epicentre. Thus, the rapid decline of intensity from the epicentre outwards shows that, in each of the four great Ischian earthquakes, the depths of the focus must have been very small.
3. Suddenness of the Shocks.—In 1796, we have no record of preparatory shocks, but the evidence is scanty; in 1828 and 1881, none are mentioned; in 1883, one or two tremors and underground noises, possibly of seismic origin, gave warning to a few. Fore-shocks, for all practical purposes, were conspicuous by their absence.
Still more remarkable is the sudden advent of the great shocks. There were no preliminary tremors or rumbling sound, no animals showed signs of uneasiness and no birds fluttered screaming from trees or ground. The shock of 1828, says Covelli, "was announced by three powerful blows coming almost vertically, from below upwards;" and the same words apply equally well to the earthquakes of 1881 and 1883. The destruction of houses in every case was practically instantaneous, and coincident with the first vibration.
In all respects, tectonic earthquakes differ widely from the Ischian shocks. The epicentres of successive earthquakes are rarely coincident, but show a distinct tendency to migration along certain lines; the decline in intensity outwards from the epicentre is nearly always very gradual, and therefore indicative of a comparatively deep-seated focus; they are almost invariably preceded either by a series of slight shocks and rumbling sounds, or, in an unstable [70]district, by a marked increase in their frequency. Distinctions, so great as these are, evidently remove the Ischian shocks from the category of tectonic earthquakes.
On the other hand, the Ischian earthquakes possess several features which connect them closely with true volcanic earthquakes.
1. They originate beneath the northern slope of Epomeo—a volcano that we have no reason to consider absolutely extinct, but rather as one subject to eruptions at long intervals of time—in a region as yet unoccupied by parasitic craters, but having the same relation to the central cone of Epomeo as those in which the recent craters of Monte Rotaro, Montagnone and Cremate are situated.
2. In both the earthquakes of 1881 and 1883, the epicentre is an elongated band, the axis of which, if produced, would pass through the centre of the old crater of Epomeo. Along the line of this band, occur the fumaroles of Monte Cito and Ignazio Verde and the thermal springs of the Rita and Capitello. These facts, as Professor Mercalli suggests, lead us to believe that the foci of the earthquakes coincide with a radial fracture of the volcano, the course of which, as traced by him, is represented by the continuous line in Fig. 14.[27]
3. Except in their relations with actual eruptions, [71]the Ischian earthquakes resemble closely the true volcanic earthquakes which from time to time shake the flanks of Etna. These are marked by great intensity of the shock at the centre of a comparatively small disturbed area, epicentres often elongated radially to the cone, frequent repetition with similar characters in the same districts; and as a rule they precede by a short interval, but sometimes accompany or follow, volcanic eruptions.[28]
Two other phenomena may be referred to as probably indicating some connection between Ischian earthquakes and the structure and history of Epomeo.
We have seen that, in the three earthquakes of 1828, 1881, and 1883, there is distinct evidence of a second meizoseismal area at Fontana, within which the shock was mainly subsultory. Dr. Johnston-Lavis, though recognising the possibility of the existence of two epicentres, prefers another explanation.[29] But the wide extension of the southern boundary of the area of destruction in 1883, and the limitation of several of the after-shocks to the south [72]of the island, seem to me to favour the existence of a second focus beneath the crater of Epomeo, though, it may be, not entirely detached from the chief focus beneath Casamenella.
Again, as Professor Mercalli remarks, all historic eruptions on the flanks of Epomeo were accompanied by very violent earthquakes; while, previously to 1302, only one disastrous earthquake, so far as known, occurred in the island without being attended by an eruption. It should be noticed also that the principal shocks during the recent revival of activity (i.e., since 1762) show a continual increase in intensity, whether this be measured by the damage to buildings, the loss of life, or the extent of the area of destruction (Fig. 14).
It therefore seems legitimate to conclude that, in the recent Ischian earthquakes, we have merely so many unsuccessful attempts to force a new volcanic eruption. The passages once existing through Epomeo and its parasitic craters having become blocked, the highly heated magma beneath is compelled to find a new outlet. Its tension slowly increasing, the crust above is at last rent, or an incipient rent is enlarged, the fluid rock is injected almost instantaneously with great force into the open fissure, and its sudden arrest by the containing walls is the ultimate cause of an earthquake. With the expansion of the magma, its tension is at once correspondingly reduced, and some time must elapse before it can again reach the critical point at which a further rupture, resulting in a second shock, takes place.[30]
[73]Thus, with each great Ischian earthquake, we are, I believe, advancing a step nearer the time, which may be close at hand or may be very remote, when the fracture will at last reach the surface, and above the site of Casamenella a new parasitic cone will rise, from which, as from Cremate in 1302, a stream of lava may flow down towards the sea.
1. Baldacci, L.—"Alcune osservazioni sul terremoto avvenuto all' Isola d'Ischia il 28 luglio 1883." Ital. Com. Geol. Boll., vol. xiv., 1883, pp. 157-166.
2. Daubrée, A.—"Rapport sur le tremblement de terre ressenti à Ischia le 28 juillet, 1883; causes probables des tremblements de terre." Paris, Acad. Sci., Compt. Rend., vol. xcvii., 1883, pp. 768-778.
3. Du Bois, F.—"The Earthquakes of Ischia." Japan Seism. Soc. Trans., vol. vii., pt i., 1883-84, pp. 16-42.
4. —— "Farther Notes on the Earthquakes of Ischia." Ibid., vol. viii., 1885, pp. 95-99.
5. Johnston-Lavis, H.J.—Monograph of the Earthquakes of Ischia (1885).
6. Mercalli, G.—Vulcani e fenomeni vulcanici in Italia (vol. iii. of Geologia d'Italia, by G. Negri, A. Stoppani, and G. Mercalli), 1883, pp. 46-50, 331-332.
7. —— L'Isola d'Ischia ed il terremoto del 28 luglio 1883 (Milano, 1884).
8. Palmieri, L., E A. Oglialoro.—"Sul terremoto dell' Isola d'Ischia della sera del 28 luglio 1883." Napoli, R. Accad. Atti, vol. i., 1884, pp. 1-28.
[74]9. Rossi, M.S. de.—"Il terremoto di Casamicciola del 4 marzo 1881." Bull. del Vulc. Ital., anno viii., 1881, pp. 5-12. (In the same volume are brief notices by different writers on pp. 22, 38-42, 52-53, 67-68, 70-74.)
10. —— "Raccolta di fatti, relazioni, bibliografie sul terremoto di Casamicciola del 28 luglio 1883, con brevi osservazioni." Bull. del Vulc. Ital., anno xi., 1884, pp. 65-172.
11. —— "Intorno all' odierna fase dei terremoti in Italia e segnatamente sul terremoto in Casamicciola del 4 Marzo 1881." Ital. Soc. Geogr. Boll., 1881.
12. Serpieri, A.—"Sul terremoto d'Ischia il 28 luglio 1883." Scritti di Sismologia, Pte. ii., pp. 207-216.
13. —— "Sul terremoto dell' Isola d'Ischia il 28 luglio 1883." Ibid., pp. 217-232.
[21] The shaded areas indicate the principal trachytic masses, the broken lines represent the boundaries of the craters that are still recognisable, and the dotted lines the boundaries of the areas within which buildings were damaged by the earthquakes of 1796, 1828, 1881, and 1883 (according to Mercalli). The continuous curved line shows the position of the radial fracture with which the earthquakes were probably connected. The trachytic masses and craters are denoted by the following tables:—
| a. Epomeo. | k. Marecocco. |
| b. Trippiti. | l. Zale. |
| c. Vetta. | m. Rotaro. |
| d. Garofoli. | n. Montagnone. |
| e. Vatoliere. | p. Bagno. |
| f. Campagnano. | q. Tabor. |
| g. Vezza. | r. P. Castiglione. |
| h. Imperatore. | s. Cremate. |
| i. C. St. Angelo. | t. Arso. |
| j. Lo Toppo. | u. Porto d'Ischia. |
[22] It is possible that Monte Campagnano may form an exception to this statement.
[23] Shocks were felt in the island in 1559 and 1659, but one at least was of external origin.
[24] Prof. Mercalli, from the five estimates of the angle of emergence which he considered most reliable, found the mean depth to be about 3,280 feet.
[25] Professor de Rossi estimated the mean duration as not much exceeding ten seconds. Dr. Johnston-Lavis, on the other hand, considers the general estimate of fifteen seconds as far too low. In one case, at Casamicciola, he ranks it as high as thirty-one seconds.
[26] Quoted from the useful translation of Covelli's memoir given by Dr. Johnston-Lavis.
[27] Baldacci supposes that the thermal springs and fumaroles of Forio, Stennecchia, Montecito, Casamicciola, and Castiglione lie along a tangential fracture starting from Forio and passing by Casamicciola to near Punta di Castiglione. Mercalli, however, argues forcibly against this inference.
[28] Professor Mercalli adds, as a fourth point of contact between Ischian earthquakes and volcanic phenomena, the changes in the fumaroles and hot springs which preceded or accompanied or followed the earthquakes of 1828, 1881, and 1883.
[29] "Fontana," he says, "occupies the centre of the great crater of Epomeo..., and therefore lies immediately over the ancient chimney, which in all probability is filled by an old plug of consolidated trachyte, which must descend to the igneous reservoir. Any mass of igneous matter, that might determine the further rupture of a collateral fissure, would result in the conduction of any changes of pressure or vibrations, along the column of highly elastic trachyte; whilst the same earth-waves would be annulled or absorbed by the inelastic tufas surrounding it, so that the blow would be struck perpendicularly to the surface, and in a small area with well defined limits. The undulatory sensations, after the principal local shock, were those that arrived from the great centre of impulse beneath Casamenella."
[30] The above paragraph is a summary of the reasoning stated with admirable clearness by Dr. Johnston-Lavis. It should be mentioned that the late Professor Palmieri, relying on the extremely limited disturbed area, dissented from this view; but his difficulty is met by supposing the focus to be small as well as shallow, a supposition that is supported by the shortness of the meizoseismal band, as well as by the elongation of the isoseismal lines in the direction perpendicular to this band.
In most countries the principal seismic districts are of limited extent. Thus, in central Japan, the east coast is frequently visited by earthquakes, while the west coast is relatively undisturbed. Of the earthquakes felt in the kingdom of Greece during the years 1893-98, 63 per cent. were observed in Zante, and were for the most part confined to that island. In the interior of the Iberian peninsula—in Leon and in New and Old Castile—destructive earthquakes are practically unknown; while the littoral regions of central and southern Portugal, Andalusia, and Catalonia are noted for their disastrous shocks.
During the eighteenth century seismic activity was chiefly concentrated in Portugal, and culminated in the great Lisbon earthquake of 1755. In the following century the seat of disturbance was transferred from the west to the south of the peninsula; Portugal remained throughout in comparative repose, while Almeria experienced destructive shocks in 1804, 1860, and 1863, and Murcia in 1828-29 and 1864, leading up to the Andalusian earthquakes of 1884-85, described in the present chapter.
The preparation for the principal earthquake of [76]December 25th, 1884, was unusually indistinct. For a day or two before, shocks were felt here and there in Andalusia, but so weak were they that they passed almost unperceived. During the night of December 24-25, one slight shock was noticed at Colmeñar (Fig. 19) and another at Zafarraya. On the 25th, a faint movement of the ground was noticed at Malaga, and a few weak tremors at Periana; and shortly after came the great shock at about 8.50 P.M. mean time of Malaga, or about 9.8 P.M. Greenwich mean time.
This earthquake was investigated by no fewer than three official committees. The first in the field was nominated by the Spanish Government on January 7th, 1885, and consisted of four members, the President being Señor M.F. de Castro, the director of the Geological Survey of Spain. The report of this commission was presented to the Minister of Agriculture, etc., on March 12th. Early in February a French Commission, appointed by the Academy of Sciences, proceeded to the scene of the disaster. With Professor F. Fouqué as chief, and MM. Lévy, Bertrand, Barrois, Offret, Kilian, Bergeron, and Bréon as members, this committee resolved itself after a time into one for studying the geology of the central area; and, of their voluminous report of more than 700 quarto pages (published in 1889), only 55 are immediately concerned with the earthquake. At the beginning of April, Professors Taramelli and Mercalli, sent by the Italian Government, arrived in Andalusia; and their memoir, read a few months later before the Reale Accademia dei Lincei, forms by far the most valuable contribution to our knowledge of the earthquake.
[77]The meizoseismal area (see Figs. 19 and 20) lies in a mountainous district, almost equidistant from the cities of Malaga and Granada. In this area, which contains nearly 900 square miles, the shock was disastrous to all but well-built houses. Whole villages were overthrown. In the surrounding zone many buildings escaped serious damage, and only a few were completely destroyed. It is estimated by the Spanish Commission that, in the province of Granada, 3,342 houses were totally, and 2,138 partially, ruined; in the province of Malaga, 1,057 houses were totally, and 4,178 partially, ruined; while in the two provinces together 6,463 houses were damaged; making a total of 17,178 buildings more or less seriously injured.
As usual in the South of Europe, bad construction and narrow streets were largely responsible for the loss of property, houses that were regularly built and made of good materials being only slightly injured. But, in this case, the great slope of the ground, the bad quality of the foundations, and the nature of the underlying rocks were contributing factors. Many buildings also had been damaged by previous shocks, and their ruin was only completed by the earthquake of 1884.
The total loss of life is variously estimated. According to the Spanish Commission, 690 persons were killed and 1,426 wounded in the province of Granada, while 55 were killed and 59 wounded in that of Malaga, making a total of 745 persons killed and 1,485 wounded. The Italian seismologists, having additional materials at their disposal, raise [78]the total figures to 750 persons killed and 1,554 severely wounded. Careful inquiries were also made on this subject by the conductors of the newspaper El Defensor de Granada. In Granada alone, they reckon that 828 persons were killed and 1,164 wounded.
From the table given in the Italian report, it appears that 330 persons were killed at Alhama, 118 at Arenas del Rey, 102 at Albuñuelas, 77 at Ventas de Zafarraya, and 40 at Periana; the percentage of mortality being 9 at Arenas del Rey, about the same at Ventas de Zafarraya, and 3 or 4 at Alhama, Albuñuelas and Periana. Comparing these latter figures with the death rates of 71 per cent. at Montemurro, caused by the Neapolitan earthquake, and of about 45 per cent. at Casamicciola, by the Ischian earthquake of 1883, it will be seen that the loss of life during the Andalusian earthquake was comparatively small—an exemption which is attributed by the Italian commissioners to the absence of inhabited places from the immediate neighbourhood of the epicentre, and to the fact that the destructive vibrations occurred towards the end of the shock, thus allowing opportunity for escape.
Fig. 19 shows the principal isoseismal lines as drawn by the Italian commissioners. The meizoseismal area, which included all places at which the shock was disastrous, is bounded by an ellipse (marked 1 on the map) 40 miles long from east to west, 28 miles wide, and about 886 square miles in area. The next isoseismal (2) includes the places in [79]which some buildings were ruined, but not as a rule completely, and in which there was no loss of life. Its bounding line is also elliptical, the longer axis being about 71 miles long and running nearly east and west. Towards the south this zone is interrupted by the sea. It will be noticed that these isoseismals are not concentric, the second extending [80]much farther to the west and south-west than in the opposite direction. A third isoseismal (not shown in the map) encloses the district in which the shock was "very strong," or just capable of producing cracks in the walls of houses. It is similar in form to the second isoseismal, reaching as far as Estepone to the south-west, Osuna, Cordova, and Seville to the west, Jaen to the north, while towards the east it stops short of Almeria.
The French Commission have also published a map of the earthquake, and, though the work of an experienced seismologist like Professor Mercalli is probably more trustworthy, it is interesting to compare his isoseismal lines with those obtained by his French colleagues, which are reproduced in Fig. 20. The curves in this figure are drawn so as to include the places that were, respectively, ruined, seriously damaged, and slightly damaged, by the shock. They should therefore correspond with the lines in Fig. 19. It will be seen that they differ considerably in form, but at the same time they present certain points of agreement, such as the east and west elongation of the meizoseismal area, and the great extension of the two outer isoseismals towards the west and south-west The greatest difference is to be found in the eastern portion of the third isoseismal, which, according to the Italians, extends beyond the limits included in Fig. 20, and, according to the French, is bayed back by the great masses of the Sierra Nevada.
Outside Andalusia the earthquake was sensibly felt to the north as far as Madrid and Segovia, to the west at Huelva, Cárceres and Lisbon, and to the east at Valencia and Murcia. Towards the [81]south, the greater part of the disturbed area was cut off by the Mediterranean, and there are no records forthcoming from the opposite coast of Africa. The total area disturbed by the earthquake is roughly estimated by the French Commission at about 154,000 square miles, and by the Italian Commission at about 174,000 square miles; but, as the shock was [82]strong enough to stop clocks and ring bells at Madrid, it is evident that even the greater of these values is too small.
Far beyond the limits of the disturbed area, however, the long slow waves sped over the surface, disturbing magnetographs and other delicate instruments. More than a century before, the great Lisbon earthquake of 1755 had caused oscillations in Scottish lakes, and on other occasions the effects of remote earthquakes had been witnessed at isolated places. But, in 1884, the concurrent registration of the Andalusian earth-waves at distant observatories attracted general attention, and in part suggested the world-wide network of seismological stations, the foundation of which was laid before another decade had passed.
In Italy, probable records of the earthquake were obtained at two observatories, but, owing to the approximate times given, their connection with it is not established. At Velletri, near Rome, Professor Galli's seismodynamograph registered a very slight movement at 10 P.M., and at Rome itself Professor de Rossi found a tromometer making unusual oscillations at 10.15 P.M.[31]
The most interesting records, however, are those furnished by the magnetographs at Lisbon, Parc Saint-Maur (near Paris), Greenwich, and [83]Wilhelmshaven. At Lisbon, the records are extremely clear. The curves of the declination, horizontal force and vertical force magnets, as seen in Fig. 21, are abruptly broken at 8.33 P.M. (Lisbon time, or 9h. 9m. 45s., G.M.T.). The disturbances, which are greatest on the declination curve and least on the vertical force curve, lasted in all three for about 12 minutes, and are quite distinct from the ordinary magnetic perturbations. At Parc Saint-Maur, the magnetographs seem to be ill-adapted to act as seismographs, for only a slight mark was discovered on a re-examination of the curves, beginning at 9.24 P.M. (Paris time, or 9h. 14m. 39s., G.M.T.) At Greenwich, Mr. W. Ellis writes, there was "a small simultaneous disturbance of the declination and horizontal force magnets, occurring at 9h. 15m.... Both magnets were at this time set into slight vibration, the extent of vibration in the case of declination being about 2' of arc, and in horizontal force equivalent to .001 of the whole horizontal force nearly." Of the three instruments at Wilhelmshaven, only one showed any movement at the time of the earthquake. The declination magnet was undisturbed, the horizontal force curve was accidentally interrupted, but the vertical force curve indicated a very perceptible shock. Beginning at 9.52 P.M. (Wilhelmshaven mean time, or 9h. 29m. 29s., G.M.T.), the curve was broken for four minutes, for the rapid swinging of the needle could not be registered until the motion [84]became fainter. Further disturbances also occurred at 9.59, 10, 10.2, and 10.5 P.M.[32]
The innermost isoseismal being too large, and the time-records too inaccurate, to give the position of the epicentre, both Commissions resorted to observations of the direction, Professor Fouqué and his colleagues depending chiefly on the oscillation of hanging lamps, and Professors Taramelli and Mercalli on the fall or displacement of statues and other objects, and all avoiding as far as possible the evidence of fissures in buildings.
The Italian observers point out that, among the divergent directions visible at any place, there is generally one more distinctly marked than the others, and this, they consider, corresponds to the movement coming almost directly from the centre of disturbance. Plotting these directions (36 in number), they find that they converge as a rule within the triangle formed by joining Ventas de Zafarraya, Alhama, and Jatar, while a large number of them traverse the elliptical area, whose boundary is represented by the dotted line in Fig. 19. This area is about 9 miles long and 2½ miles wide, its longer axis runs nearly [85]east and west, and its centre coincides with the western focus of the ellipse which forms the boundary of the meizoseismal area. It lies, moreover, close to Ventas de Zafarraya and Arenas del Rey, the two places where the seismic death-rate was highest, while its major axis almost coincides with the line joining them.
The evidence of hanging lamps collected by the French Commission was more consistent than that of the fallen objects. At every place, the plane in which the lamps oscillated was nearly constant, the deviations being generally attributable to irregularities in the mode of suspension. The azimuths again intersect within an elliptical area, which, according to the Commission, differs little from the central region of the earthquake (Fig. 20). It Is clear, however, from the map accompanying the French report, that the majority converge towards a narrow band extending east and west from near Arenas del Rey to near Ventas de Zafarraya, and therefore agreeing closely with the epicentral area as determined by Professors Taramelli and Mercalli.[33]
If the depth of the seismic focus amounts to several miles, one of the most serious objections to Mallet's method lies in the varying refractive power of the different strata traversed by the earth-waves (p. 28). [86]At present we have no way of meeting this objection, and all calculations of the depth of the focus are therefore more or less doubtful. A difficulty in practice has also been urged, depending on the widely differing inclinations of the fractures at any place; but the Italian observers found that the errors from this source were greatly reduced by avoiding all fissures in poorly-built houses, or which start from windows or other apertures, and selecting only those which occur in homogeneous walls directed towards the epicentre. The best angles of emergence thus measured by them are thirteen in number, all made at places lying within 5 and 23 miles from the centre of the epicentral area, and, with two exceptions, inside the meizoseismal zone (Fig. 19). The depths corresponding to the different wave-paths vary from 5.3 to 23.0 miles, the mean depth of the focus given by all thirteen observations being 7.6 miles.
The only estimate made by the French Commission—and it is one that they rightly regarded with considerable doubt—was based on a method devised by Falb. As the sound generally precedes the shock, Falb assumes that it travels with a greater velocity. If the velocities of both series of waves are known, and if they start at the same instant and from the same region, the interval that elapses between the arrivals of the sound and shock should give the distance traversed by them and consequently the depth of the focus. It is unnecessary to mention more than two of the serious objections to this method. The duration of the preliminary sound should increase rapidly with the distance from the focus, and of this there is not the slightest evidence. Moreover, the sound-vibrations that are first heard do not [87]necessarily come from the same part of the focus as those which cause the shock, but, as will be seen in Chapter VIII., probably from its nearer lateral margin. The French Commission, finding the average duration of the fore-sound near the epicentre to be 5 seconds, estimate the depth of the focus at about 7 miles—a result which agrees remarkably with that obtained from the angles of emergence, but which is not, on that account, entitled to credit.
In the nature of the shock, there was a singular uniformity throughout the whole disturbed area, the chief variation noticed being evidently dependent on the observer's distance from the epicentre.
For instance, in the meizoseismal area (Fig. 19), at Ventas de Zafarraya, a loud sound like thunder was first heard, and before it ceased there came a violent subsultory movement preceded by a very brief oscillation, then a pause of one or two seconds, and lastly a more intense and longer series of undulations, the whole movement lasting 12 seconds. At Cacin, three phases were distinguished, the first a slight undulatory movement coincident with the sound, followed immediately by the subsultory motion, a pause, and stronger undulations, the total duration being 15 seconds. The variations noticeable in this zone seem to have been apparent only, sensitive observers perceiving a tremulous motion before the vertical vibrations, and in the pause between them and the concluding undulations. In both phases, the intensity increased to a maximum and then gradually decreased. The movement at Ventas de Zafarraya [88]and Cacin is represented by Professors Taramelli and Mercalli by the curves a and b in Fig. 22.
In the second zone (Fig. 19), the same two phases were universally observed, but the subsultory movement was less pronounced or the movement was partly subsultory and partly undulatory, and occasionally both phases are described as undulatory. The motion near Malaga is represented by the curve c in Fig. 22.
Outside the ruinous zone, the first phase rapidly lost what remained of its subsultory form, and the pause between the two parts was noticeably longer than near the epicentre. Thus, at Seville and Cordova, two shocks were felt, separated by an interval of some seconds; the second according to some observers at Seville, terminating with vertical tremors. At Madrid, also, the two parts were perceived, the interval between them being 3 or 4 seconds in length; but, as a rule, outside Andalusia, only a single undulatory shock was felt, without any preliminary sound.
That the changes observed in the shock were merely an effect of less or greater distance, will be obvious from Fig. 23, in which the intensity at any moment is that represented by the distance of the corresponding point on the curve from the different [89]base-lines, the base-line a corresponding to a place near the epicentre, and b, c, d, etc., to places at gradually increasing distances. Thus, at a place corresponding to the base-line b, the intensity of the tremors during the intervening pause (represented by the short line PN) was so slight that they frequently escaped notice, while the preliminary tremors observed by some near the epicentre were altogether imperceptible. At the places corresponding to the base-lines c, d, e, f, the duration of the whole shock and of each part gradually diminished, while the interval between the two parts increased owing to the gradual extinction of the final vibrations of the first part and of the initial vibrations of the second. At the farthest of these places (f) the first part was so weak that it sometimes passed unobserved. Lastly, at a place corresponding to the base-line g, the first part was imperceptible to all observers, and the shock consisted of a single series of horizontal undulations.
Origin of the Double Shock.—If the double shock were observed at only a few places, we should naturally look for some local explanation of the peculiarity. The second shock, for instance, might be a subterranean echo, the earth-waves being reflected [90]at the bounding surface of two different kinds of rock. In the case of the Andalusian earthquake, such an explanation is precluded by the almost universal observation of the double shock, the greater intensity of the second part, and the longer period of its vibrations.
The Italian observers, who paid considerable attention to the double shock, give a more general explanation. They regard the two parts of the shock as corresponding in the main to longitudinal and transversal waves starting simultaneously from the same focus (see p. 13). The former vibrations would be vertical at the epicentre and would gradually become horizontal in spreading outwards; the latter would be horizontal at the epicentre and at a distance from it (e.g. at Seville) nearly vertical. Also, as the longitudinal waves travel more rapidly than others, the interval between the two parts of the shock would increase with the distance from the origin. Owing again, to the large size of the focus, the first part of the shock would at no place be instantaneous, and its later vibrations might coalesce with the earlier transverse vibrations, so that, within and near the meizoseismal area, the second part of the shock might be stronger than the first. A similar result might be produced in the same district if the transverse vibrations coincided with reflected longitudinal vibrations, and Professors Taramelli and Mercalli think that such reflection would occur from the old crystalline rocks of the Sierra de Almijara and possibly also from the calcareous and crystalline rocks to the south-west of Cartama.
Satisfactory as it seems to be in some respects, this explanation is open to serious objections, of which I [91]will mention only two. The first is that, though the pause between the two parts of the shock does increase with the distance, it does not increase rapidly enough; at Seville, it should be two or three minutes, instead of "some seconds" in length. A more fatal objection, however, is that, if the explanation were correct, every earthquake-shock should consist of two parts, and this is only the case with a small minority.
On the other hand, if the velocities of the waves composing each part were the same, the slight increase in the length of the interval is readily accounted for, as we have seen, by the gradual extinction of its weak terminal vibrations. But in any case, the long interval that elapsed between the beginnings of the two parts at a place so near the epicentre as Ventas de Zafarraya, shows that each part was due to a distinct impulse; and, judging from the directions of the respective movements, it would seem that the focus of the first impulse was situated at a greater depth than the focus of the second. Whether the epicentres corresponding to the two foci were coincident or more or less separate is not clear from the nature of the shock; but it is probable that they were nearly or quite detached, and that a second epicentre was situated near the eastern focus of the ellipse bounding the meizoseismal area.
In the Neapolitan earthquake, the sound was only heard in a district of about 3,300 square miles immediately surrounding the epicentres, while the whole area disturbed by the shock was not less than [92]39,000 square miles. A similar limitation was noticed in the Andalusian earthquake. According to the Spanish Commission, the sound was heard at only one place (Cordova) outside the provinces of Granada and Malaga; and its audibility was a rule confined to the area within which buildings were damaged by the shock. It was compared at different places to the noise of a passing train or a carriage heavily laden running on a paved road, of distant thunder, a great storm, or the discharge of heavy guns.
At every place where the sound was heard, it distinctly preceded the shock, frequently allowing time for escape from houses that were afterwards ruined. Its duration within the meizoseismal area was on an average about five or six seconds, rarely perhaps did it exceed ten seconds. At some places in the same area, it overlapped the beginning of the shock, but generally it was separated from the latter by a very short interval, estimated at a second. From this precedence of the sound, the Italian Commission conclude that the sound-waves travelled more rapidly than those which formed the shock, an inference that depends on the assumption that both waves started simultaneously from within precisely the same focal limits. A different explanation, not based on these assumptions, will be considered more fully in Chapter VIII, dealing with the recent earthquakes of Hereford and Inverness.
If, in a highly-civilised country, the time-records of an earthquake vary within wide limits, it is not surprising that those given for the Andalusian [93]earthquake should be wholly untrustworthy. Even the clocks in public buildings and railway stations differed by as much as 25 minutes in their indications. An interesting observation is, however, described in the French report and is worth repeating, though it does not lead to any accurate result. At the time of the principal shock, two telegraph-clerks were in communication, one at Malaga and the other at Velez-Malaga. The latter, surprised by the shock, suddenly stopped his message; and, about six seconds later, the arrival of the earth-waves at Malaga explained the interruption to his colleague. As, according to the French report, Velez-Malaga is 9 kms. (or about 5½ miles) nearer than Malaga to the mean epicentral point, it follows that the velocity of the earth-waves must have been about 1.5 kms., or nearly a mile, per second.[34]
The only observations of any real value in determining the velocity are those given by the stopped clock at the observatory of San Fernando (Cadiz) and by the magnetographs at Lisbon, Parc Saint-Maur, Greenwich, and Wilhelmshaven. Taking the times at Cadiz, Lisbon, Greenwich, and Wilhelmshaven at 9.18, 9.19, 9.25, and 9.29 P.M. respectively (Paris mean time) and the mean epicentral point as coinciding with Alhama, the French Commission estimates roughly the mean surface-velocity between Cadiz and Lisbon at 3.6 kms. per second, between Cadiz and Greenwich at 4.5 kms. per second, between Cadiz and Wilhelmshaven at 3.1 kms. per second, and between Greenwich and Wilhelmshaven at 1.6 kms. per [94]second. Dr. Agamennone, however, notices that the distances from Alhama are not correctly measured, and substitutes for the above figures 4.83, 3.43, 2.82, and 1.75 kms. per second respectively.
These results apparently show a decrease in the velocity with the outward spread of the earth-waves, but, as Dr. Agamennone again points out, a comparatively small error in the time at Cadiz would neutralise the apparent decrease. It is not to be supposed that the astronomical clock at this observatory was wrong by more than a second or two, but the behaviour of clocks during an earthquake is so irregular—some stopping at once, others staggering on for some seconds before arrest—that the Cadiz time may differ from the true time by several seconds.
Besides this possible error, there is also considerable uncertainty in the records from the magnetic observatories, owing to the slow rate at which the photographic paper travels. At Parc Saint-Maur this rate is only 10 mm. per hour, and at the other observatories about 15 mm. per hour. Allowing, therefore, for an error of half-a-minute in the time-record at Cadiz, of one minute in those of Lisbon, Greenwich, and Wilhelmshaven, and of two minutes in that at Parc Saint-Maur, and taking the mean epicentral point as determined by the Italian observers, Dr. Agamennone, applying the method of least squares, finds the probable value of the velocity of propagation to be 3.15 kms. (or nearly 2 miles) per second, with a possible error of .19 kms. per second. This result agrees closely with the value found for the long slow undulations of more recent earthquakes.
[95]Connection between Geological Structure and the Intensity of the Shock.—While a great part of the injury to buildings must be attributed to their faulty construction, the connection between the nature of the underlying rock and the amount of damage was very clearly marked. Other conditions being the same, houses built on alluvial ground suffered most of all; and the destruction was also great in those standing on soft sedimentary rocks such as clays and friable limestones. On the other hand, when compact limestones or ancient schists formed the foundation-rock, the amount of damage was conspicuously less than in other cases.
The members of both the French and the Italian Commissions agree in ascribing the peculiar form and relative positions of the isoseismal lines to geological conditions. To the east of the epicentre, the schists and crystalline limestones form a deep, uniform, and compact mass; while, to the west, the old crystalline rocks are covered by jurassic, cretaceous, and eocene formations, constituting a less homogeneous and less elastic mass, in which the intensity of the shock would fade off much more rapidly, with the result that the epicentre occupies the western focus of the elliptical boundary of the meizoseismal area (Fig. 19).[35]
That mountain-ranges have an important influence on the form of isoseismal lines is evident from both maps (Figs. 19 and 20), but especially from that [96]published by the French Commission (Fig. 20). The resistance offered by the Sierra Nevada to the propagation of the earth-waves is shown in the former map by the approximation of the first and second isoseismals at the east end, and in the latter by the great bay in the third isoseismal line. Whichever interpretation of the evidence is the more accurate, the action of the mountainous mass is clearly to lessen rapidly the intensity of the shock—an effect which is probably due to the abrupt changes in the direction and nature of the strata encountered normally by the earth-waves. On the opposite side of the epicentre, the waves meet the Sierra de Ronda obliquely. In traversing this range, the shock lost a great part of its strength, while it continued to be felt severely along its eastern foot, thus giving rise to the south-westerly extension of the third isoseismal in Fig. 20, and, though to a less extent, that of the second in Fig. 19.
Fissures, Landslips, etc.—The earthquake resulted in many superficial changes, such as fissures, landslips, and derangement of the underground water-system—all changes of the same order as the destruction of buildings—but, so far as known, in no fault-scarps or other external evidence of deep-seated movements.
Some of the fissures were of great length. One of the most remarkable occurred at Guevejar, a village built on the south-west slope of the Sierra de Cogollos. It was in the form of a horse-shoe, and was about two miles long, from ten to fifty feet wide, and of great depth. In its neighbourhood, innumerable small cracks appeared, some [97]perpendicular and others parallel to the great fissure. The ground within, a bed of clay resting on limestone, also slid down towards the river. Houses near the centre of the fissured tract were shifted as much as thirty yards within the first month, and others near its extremity about ten feet; while the accumulation of the material at the south end of the fissure resulted in the formation of a small lake, of about 250 to 350 square yards in area and about 30 feet deep. All streams within the fissured zone disappeared, and the spring, which provided the drinking-water of the village, ceased to flow.
The underground water-system was generally affected throughout the central area. In some places, mineral springs disappeared; in others, new springs broke out or old ones flowed more abundantly. At Alhama, the increased flow was accompanied by a permanent rise in temperature from 47° to 50° C., and by a marked change in character.
Frequent after-shocks are a characteristic of the earthquakes of Southern Spain. After the Cordova earthquake of 1170, they continued for at least three years. The Murcian earthquake of 1828 was followed by 300 minor shocks during the next twenty-four hours, and for more than a year slight tremors were often felt. For some time after the great earthquake of 1884, the movements of the ground were extremely numerous in the immediate neighbourhood of the epicentre, farther away they were rarer and of less intensity, and outside the area of damaged buildings they were nearly absent.
[98]Thus, during the night of December 25-26, 110 after-shocks were counted at Jatar, from 14 to 17 at Alcaucin, Ventas de Huelma, Motril, Cacin, Durcal, Malaga, etc.; about 11 at La Mala and Albuñuelas; 9 at Velez-Malaga and Lenteje; and from 5 to 7 at Frigiliana, Riogordo, and Cartama. The strongest of these shocks occurred at 2.20 A.M., and, though none was violent, several helped to complete the ruin of many houses that had been damaged by the principal shock.
From this time, after-shocks occurred almost daily until the end of May, after which they became much less frequent. According to the list given in the Italian report, which closes at the end of January 1886, 237 shocks were felt, 23 up to the end of December, 30 in January 1885, 25 in February, 27 in March, 46 in April, and 43 in May. In June 1885, only three are recorded, and the average number during each of the following seven months lies between five and six. This list, however, does not include the very weak shocks,[36] for nearly all those contained in it were felt as far as Malaga or its neighbourhood.
The shocks varied considerably in intensity as well as in frequency, five of them being much more violent than the rest. One that occurred on December 30th was felt strongly in all the damaged area, two others on January 3rd and 5th caused fresh injury to buildings, a fourth, on February 27th, disturbed an area bounded roughly by the second [99]isoseismal of the principal earthquake (Fig. 19), while the fifth and strongest, that of April 11th, was felt over a large part of the zone beyond.
At places within and near the meizoseismal area, earth-sounds were sometimes heard without any sensible shock; occasionally, also, tremors were felt with no attendant sound; but, as a rule, the shocks were accompanied by sound, and in every such case, as in the principal earthquake, the sound preceded the shock, or at most was partly contemporaneous with it.
Several of the after-shocks resembled the principal earthquake in their division into two parts separated by an interval of rest or weaker movement from half a second to a second in length, though the whole duration of the shock itself in no case exceeded five or six seconds. Occasionally, the likeness was still closer, in the succession of sound, subsultory motion and concluding horizontal undulations.
The meizoseismal area and surrounding zones lie in the midst of the mountainous region that separates the basin of the Guadalquiver from that of the Mediterranean, the essential structure of which, according to the geologists of the French Commission, is outlined in Fig. 24. In this sketch-map, the lightly-shaded bands correspond to an upper series of crystalline schists, and the cross-shaded bands to the lower series of mica-schists and dolomites that form the anticlinal folds of the Sierra de Ronda, the Sierra de Mijas, and the Sierra Tejeda.
[100]In addition to the faulting and intense folding in the direction of their strikes, these rocks are also intersected by three nearly parallel transverse faults of post-Triassic age, which, aided by subsequent denudation, have cut up the whole range into a number of distinct sierras. They are represented by the broken lines in Fig. 24.
One of these faults, that which passes near Motril, traverses the meizoseismal area, whose boundary, as laid down by the French Commission, is indicated by the dotted line on the sketch-map.[37] In the neighbourhood of Zafarraya, the fault intersects the broken anticlinal fold of the Sierra Tejeda, and the epicentre is thus situated in one of the most disturbed tracts of the whole region. The evidence, both seismic and [101]geological, is insufficient to support any precise view as to the origin of the earthquake, but there can be little doubt that it was closely connected with movements along one or more of the system of faults that intersect not far from Zafarraya.
1. Agamennone, G.—"Alcune considerazioni sui different metodi fino ad oggi adoperati nel calcolare la velocità di propagazione del terremoto andaluso del 25 dicembre 1884." Roma, R. Accad. Lincei, Rend., vol. iii., 1894, pp. 303-310.
2. —— "Velocità superficiale di propagazione delle onde sismiche in occasione della grande scossa di terremoto dell' Andalusia del 25 dicembre 1884." Ibid., vol. iii., 1894, pp. 317-325.
3. Castro, M.F. de.—Terremotos de Andalucía: Informe de la comision nombrada para su estudio dando cuenta del estado de los trabajos en 7 de marzo de 1885. (Madrid, 1885; 107 pp.)
4. Fouqué, F., etc.—"Mission d'Andalousie: Études relatives au tremblement de terre du 25 décembre 1884, et à la constitution géologique du sol ébranlé par les secousses." Paris, Acad. Sci. Mém., vol. xxx., pp. 1-772.
5. Macpherson, J.—"Tremblements de terre en Espagne." Paris, Acad. Sci., Compt. Rend., vol. c., 1885, pp. 397-399.
6. Nogués, A.F.—"Phénomènes géologiques produits par les tremblements de terre de l'Andalousie, du 25 décembre 1884 au 16 janvier 1885." Ibid., pp. 253-256.
7. Rossi, M.S. de.—"Gli odierni terremoti di Spagna ed il loro eco in Italia." Bull. Vulc. Ital., anno xii., 1885, pp. 17-31.
8. Taramelli, T., and G. Mercalli.—"I terremoti Andalusi cominciati il 25 dicembre 1884." Roma, R. Accad. Lincei, Mem., vol: iii., 1885, pp. 116-222.
9. Paris, Acad. Sci., Compt. Rend., vol. c., 1885, pp. 24-27, 136-138, 196-197, 256-257, 598-601, 1113-1120, 1436 (the last three by F. Fouqué).
[31] These times correspond to about 9.10 and 9.25 P.M., Greenwich mean time. The earthquake stopped a clock at the Royal Observatory of San Fernando (Cadiz), at 8h. 43m. 54.5s. mean local time, corresponding to 9h. 8m. 44s., G.M.T.
[32] The earthquake is also said to have been registered at the observatory of Moncalieri, near Turin, but I have not been able to ascertain the time of occurrence. A movement felt at about 10.20 P.M. at Ramsbury, in Wiltshire, was attributed to the earthquake, though the time is about an hour too late. On December 26th, an astronomical clock was stopped at Brussels and its pillar displaced; and, on the evening of the same day, the large telescope at the observatory was also found to have been shifted. These effects, it is suggested, were caused by the Andalusian earthquake, but the connection between them seems to me very doubtful.
[33] The French observers have also applied a method depending on the time of occurrence of the shock. Joining places where the recorded times were the same, they notice that the perpendicular bisectors of these lines intersect within an area which agrees practically with that determined by the azimuths. The inaccuracy of the time-records must, however, lessen the significance of this result.
[34] Dr. Agamennone points out that, according to the Italian report, the difference in distance is 22 kms. (or 13¾ miles), leading to a velocity of about 3.6 kms., or 2.3 miles per second.
[35] It should be remembered that it is not improbable that there were two detached epicentres, coinciding roughly with the two foci of this curve.
[36] Only eight are recorded during the night of December 25-26. On several occasions during April and May 1885, groups of slight shocks were felt; but as their individual times are not given, they are regarded as equivalent to one shock each in the above totals.
[37] The boundary, as drawn in this figure, differs slightly from that given in Fig. 20.
The Charleston earthquake stands alone among the great earthquakes described in this volume, and indeed among nearly all great earthquakes, in visiting a region where seismic disturbances were almost unknown. Calabria and Ischia, the Riviera and Andalusia, Assam and the provinces of Mino and Owari in Japan, are all regions where earthquake-shocks are more or less frequent and occasionally of destructive violence. But, from the foundation of Charleston in 1680 until 1886, that is, for more than two centuries, it is probably not too much to say that few counties in Great Britain were so free from earthquakes as the State of South Carolina.[38]
The practical isolation of the earthquake of 1886 left its trace on the character of the investigation. Not only were the observers untrained, but the [103]investigators themselves were unprepared. For instance, the scale of intensity used in drawing the isoseismal lines was not adopted until after the first letters of inquiry were issued. On the other hand, nothing could exceed the energy and ability with which the epicentral tracts were examined by Mr. Earle Sloan and the collection of time-records made by Mr. Everett Hayden. To them, and to Major C.E. Dutton, whose valuable monograph supersedes all other accounts, we are indebted for the two chief additions to our knowledge resulting from the study of the Charleston earthquake. These are the determination of the double epicentre, and the measurement of the velocity with which the earth-waves travelled.
The land-area disturbed by the earthquake and the isoseismal lines are shown in Fig. 25, the small black oval area (which Includes Charleston) being that within which the greatest damage to buildings occurred. The chief part of the epicentre, however, lies from 12 to 15 miles to the west and north-west of Charleston, in a forest-clad district, containing only two villages and various scattered houses.
The city of Charleston, whose population between 1880 and 1891 increased from fifty to fifty-five thousand, is built on a peninsula between the Cooper River on the east and the Ashley River on the south-west. Originally, this was an irregular tract of comparatively high and dry land, intersected by numerous creeks, which, as the city grew, were filled up to the general level of the higher ground. It is on this [104]"made land" as a rule that the more serious damage to buildings occurred.
At 9.51 P.M. (standard time of the 75th meridian), the great earthquake occurred, and, one minute later, there was left hardly a building in the city that was not injured more or less seriously. "The destruction," as Major Dutton remarks, "was not of that sweeping and unmitigated order which has befallen other cities, and in which every structure built of material other than wood has been levelled completely to the earth in a chaos of broken rubble, beams, tiles, and planking, or left in a condition practically no better." The number of houses entirely demolished was not great, but several hundred lost a large part of their walls, and many were condemned as unsafe and afterwards pulled down. A board of inspectors, appointed to investigate the condition of the houses, reported that not one hundred out of fourteen thousand chimneys examined by them escaped damage, and that 95 per cent. of those injured were broken off at the roof. The total cost of the necessary repairs, it was estimated, would amount to about one million pounds.
According to the official records, 27 persons were killed in Charleston during the earthquake, but, by cold, exposure, etc., this number was brought up to not less than 83. The number of persons wounded was never ascertained.
In drawing the isoseismal lines (represented by the continuous curves in Fig. 25), Major Dutton made use of the well-known Rossi-Forel scale of seismic [105]intensity, a translation of which is given below.[39] The curves range from the highest degree, 10, corresponding to disastrous effects on buildings, down to the lowest but one, 2, which would be applied to a shock felt only by a small number of persons at rest. It is evident, I think, that these lines cannot be regarded as drawn with great accuracy. The number of records (nearly 4000, from about 1,600 places), great as it is, is hardly sufficient for the purpose; and many were collected from newspapers. The circulars of inquiry also contained no distinct questions corresponding to the different degrees of the scale employed, and therefore it is not always certain that the intensity recorded was the maximum observed. But, if the curves might have varied in detail with a larger and more accurate series of observations, they must represent in their main features the distribution of seismic intensity throughout the disturbed area. One [106]point of importance is the partial earthquake-shadow in the region of the Appalachian Mountains shown by the southward incurving of the isoseismals 4, 5, and 6, and especially by the first two of these lines. Another is the close grouping of the isoseismals in the State of Mississippi, illustrating a rapid fading of [107]intensity as the earth-waves crossed the unconsolidated materials of the Mississippi delta.
Owing to the short distance between the epicentre and the sea-coast, it is impossible to make more than a rough estimate of the extent of the disturbed area. Even when the boundary lies on land, it traverses some districts which are thinly populated and others where the inhabitants are unobservant, and unlikely to notice the slow oscillations which were alone perceptible at great distances. The shock was, however, felt at Boston (800 miles from the epicentre), La Crosse on the upper Mississippi (950 miles to the north-west), at several places in Cuba (between 700 and 710 miles), and in Bermuda (950 miles). To the south, the limits are unknown, there being no report from Yucatan, the nearest point of which is distant about 930 miles. If we assume the disturbed area to have a mean radius of 950 miles, then it must have covered no less than 2,800,000 square miles. And, that this estimate is not excessive, will be evident from the fact that the land-area disturbed (including parts of the great lakes and inlets in the sea-coast) amounted to about 920,000 square miles.
The preparation for the earthquake seems to have begun about three months before. During June, and even earlier, slight but undoubted tremors are said to have been felt in Charleston, but no record of them was kept until about 8 A.M. on August 27th, when a decided earthquake occurred at Summerville, a village twenty-two miles to the north-west. The shock and sound were simultaneous, the shock a single jolt or [108]heavy jar, the sound loud and sudden; they were such as might have been caused by the firing of a heavy cannon or the explosion of a boiler or blast of gunpowder. At 4.45 A.M. on August 28th, the shock and sound were repeated, only more strongly, the former being distinctly felt as far as Charleston. During that day and the next, there were several other shocks at Summerville, and then rest and quiet succeeded until the evening of August 31st.
At 9.51 P.M. (to take one of the best descriptions), the attention of an observer in Charleston was "vaguely attracted by a sound that seemed to come from the office below, and was supposed for a moment to be caused by the rapid rolling of a heavy body, as an iron safe or a heavily-laden truck, over the floor. Accompanying the sound there was a perceptible tremor of the building, not more marked, however, than would be caused by the passage of a car or dray along the street. For perhaps two or three seconds the occurrence excited no surprise or comment. Then by swift degrees, or all at once—it is difficult to say which—the sound deepened in volume, the tremor became more decided, the ear caught the rattle of window-sashes, gas-fixtures, and other movable objects; the men in the office ... glanced hurriedly at each other and sprang to their feet.... And then all was bewilderment and confusion.
"The long roll deepened and spread into an awful roar, that seemed to pervade at once the troubled earth and the still air above and around. The tremor was now a rude, rapid quiver, that agitated the whole [109]lofty, strong-walled building as though it were being shaken—shaken by the hand of an immeasurable power, with intent to tear its joints asunder and scatter its stones and bricks abroad....
"There was no intermission in the vibration.... From the first to the last it was a continuous jar, adding force with every moment, and, as it approached and reached the climax of its manifestation, it seemed for a few terrible seconds that no work of human hands could possibly survive the shocks. The floors were heaving under-foot, the surrounding walls and partitions visibly swayed to and fro, the crash of falling masses of stone and brick and mortar was heard overhead and without....
"For a second or two it seemed that the worst had passed, and that the violent motion was subsiding. It increased again and became as severe as before. None expected to escape. A sudden rush was simultaneously made to endeavor to attain the open-air and fly to a place of safety; but, before the door was reached all stopped short, as by a common impulse, feeling that hope was vain—that it was only a question of death within the building or without, of being buried beneath the sinking roof or crushed by the falling walls. The uproar slowly died away in seeming distance. The earth was still, and oh! the blessed relief of that stillness."
If somewhat sensational in form, this report gives an extremely vivid and generally accurate account of the great shock. Other observers in Charleston concur in dividing the movement into five phases. The preliminary tremors and murmuring sound lasted about twelve seconds, and, although they increased in strength, they were succeeded somewhat suddenly [110]by the violent oscillations of the second phase, followed by a third phase of much less intensity and a fourth of stronger oscillations, these three phases lasting altogether about fifty seconds. The fifth phase, in which the tremors died out rather rapidly, continued about eight seconds; so that the total duration of the earthquake was not less than seventy seconds. The variation of the intensity with the time is represented roughly by the curve in Fig. 26.
At Charleston, there were thus two decided maxima of intensity, nearly equal in strength, though the first seems to have been slightly more powerful than the second. As in the Andalusian earthquake, the intervening tremors were imperceptible at a distance from the epicentre, and the earthquake appeared in the form of two distinct shocks, separated by an interval the average duration of which was estimated at slightly less than half a minute. At most places, the first shock is described as the stronger, but the difference in intensity of the two parts could not have been great, for both were noticed at several places more than 600 miles from the epicentre.
Visible Earth-Waves.—Many persons in the meizoseismal area assert that they saw waves moving along the surface of the ground. At Charleston, according to an observer who was facing a street-lamp at the time, "the progress of the waves as they passed the [111]house, going towards the south-east, was plainly observed, although they travelled with incomparable swiftness. The shadow of each moving ridge cast from the gas-light was distinctly seen. The waves were not in long rollers, but had rather the appearance of 'ground-swells' in deep water," the height of which from crest to trough he estimated at not less than two feet. In the words of another observer, "The vibrations increased rapidly and the ground began to undulate like the sea. The street was well lighted, having three gas-lamps within a distance of 200 feet, and I could see the earth waves as they passed as distinctly as I have a thousand times seen the waves roll along Sullivan's Island beach. The first wave came from the south-west, and as I attempted to make my way ... I was borne irresistibly across from the south side to the north side of the street. The waves seemed then to come from both the south-west and north-west, and crossed the street diagonally, intersecting each other, and lifting me up and letting me down as if I were standing on a chop sea. I could see perfectly, and made careful observations, and I estimate that the waves were at least two feet in height."
For seismological purposes, it is unfortunate that the epicentral district should be one containing so few buildings and other objects that could preserve the effects of the shock. It is for the most part a barren, forest-clad region, in places swampy, with occasional scattered houses. But it is crossed by three lines of railway diverging from Charleston, [112]and the damage which they suffered supplements to some extent the defects arising from the scarcity of buildings. These railway lines are the South Carolina, the North-Eastern, and the Charleston and Savannah, denoted by the letters A, B, and C, respectively, in Figs. 28 and 29.[40] It will be convenient to follow Major Dutton, and trace the variation of intensity exhibited along each line.
For six miles along the South Carolina Railway (A) the damage to the line, though indicative of a strong shock, was of little consequence. In the first half of this distance no repairs were required, but at 3-2/3 miles the rails were bent and the joints between them opened; at 5 miles, the fish-plates were torn from their fastenings and the joints between the rails opened seven inches; and at nearly 6 miles the joints were again opened, and the road-bed depressed six inches. After this point, deflections of the line and elevations and depressions of the road-bed were no longer rare. Near the 9-mile point, the intensity of the shock seemed to increase most rapidly; lateral displacements of the line became more frequent as well as greater in amount. The distortions of the lines were probably greatest between 10 and 11 miles; here they were often displaced laterally, sometimes depressed or elevated, and occasionally twisted into S-shaped curves, while many hundred yards of the track were shoved bodily towards the south-east. "The buckling always took place when this lateral shoving encountered a rigid obstacle, usually a long rigid trestle. At the [113]north-western end of the trestle the accumulation of rails resulted in a sharp kink. Corresponding extensions of the track by the opening of the joints and shearing of the fish-plate bolts occurred some distance to the north-westward." At 11½ miles, the lines were again stretched and the joints opened by about seven inches; but, from this point for more than four miles, the sharp kinks revealing a sliding of the track were entirely absent, though there were still long slight flexures in the lines and changes of level in the road-bed. The railway in this section traverses a district which is partly a swamp and partly a rice-field; and thus it may be, as Major Dutton suggests, that the ground was less fitted to preserve the effects of the shock.[41] At about 18 miles, the line reaches higher and firmer ground; and, from here to Summerville (21-2/3 miles), there were many sinuous flexures. For six miles farther, violent distortions of the rails ceased to occur, the rate of decrease in intensity being most marked near the 23-mile point. The last flexure occurred at Jedburgh (27½ miles) at the south end of a long, heavy trestle (Fig. 27).
There is thus a certain symmetry in the damage to this line with respect to a point about 15 or 16 miles from the Charleston terminus. The changes of intensity are most rapid at distances of about 9 and 23 miles from the terminus. Also, on the [114]south-east side of the 16-mile point, the longitudinal displacements of the line are always to the south-east; on the other side, always to the north-west. Major Dutton therefore infers that the epicentre must be on a line drawn nearly through the 16-mile point at right angles to the railway.
Somewhat similar changes were noted along the North-Eastern Railway (B), the Charleston terminus of which is about three-quarters of a mile to the south-east of that of the South Carolina Railway. Slight flexures in the line occurred at distances of 1½ and 4 miles from the terminus, and at about 6 miles the road-bed was depressed, in one part by as much as 22 inches. At about 6⅓ miles, the joints between the rails were opened 14 inches, and there were slight sinuous flexures in the line near the 7-mile and 8-mile points. The indications of great intensity then rapidly increased, the rate of change being greatest near the 9-mile point. Here, there was a long lateral flexure with a shift of 4 inches eastward. Half-a-mile farther, the fish-plates were broken and the rails parted 8½ inches. A little beyond the 10-mile point, an embankment 15 feet high was pushed 4½ feet eastward along a chord of 150 feet. At the 12-mile point and beyond, fish-plates were broken, lines were bent and the joints opened; the road-bed was cut by a series of cracks, one of which was 21 inches wide, while the beginning of a long trestle was shifted 8⅓ feet to the west. From 12½ to 14½ miles, several buildings were damaged or destroyed by a movement which was clearly more vertical than horizontal. Near the 16-mile point, the ground was fissured and thrown into ridges, the rails being similarly bent in a vertical plane. Soon after this, the line reaches a [115]broad, sandy tract, and, though the thickness of the sand is probably not much more than 40 feet in any place, the disturbances diminish almost at once, and, for a distance of more than two miles, there was little damage done to the line. At Mount Holly Station (18 miles), the intensity was so slight that the houses suffered no injury more serious than the loss of chimneys. Half-a-mile farther, the ground becomes less sandy, and the effects of the shock more distinct. The lines were bent in places for about a quarter of a mile, after which they again pass into the sandy area with a decrease of damage, the last flexure being near the 21-mile point. The rate of change of intensity in this part of the line appears to have been greatest at a distance of about 19½ miles from the terminus, but the exact distance is obviously somewhat uncertain.
There is again a rough symmetry in the damage to the line, the central point being about 14 miles from the Charleston terminus. A line drawn through this point at right angles to the North-Eastern Railway (or rather to that part of it between the 9-mile and 19½-mile points) should pass through the epicentre. It meets the corresponding line for the South Carolina Railway in a point which is indicated in Figs. 27 and 28 by a small circle (W). Houses and other buildings are rare in the surrounding district; but, as the intensity of the shock diminished outwards in all directions, this point must mark approximately the position of the epicentre. As it is close to the Woodstock Station on the South Carolina Railway, it is called by Major Dutton the Woodstock epicentre.
The Charleston and Savannah Railway (C) uses the same lines as the North-Eastern for the first seven [116]miles from Charleston, and then turns off in a south-westerly direction. For 4½ miles from the junction the signs of disturbance were few and unimportant. The railway then crosses the Ashley River, the banks of which slid towards one another and jammed the drawbridge; but for four miles farther there was no serious damage done to the lines. At about 16½ miles the effects of the shock became rapidly more apparent. For nearly 1½ mile the entire railroad was deflected into an irregular curve, the displacement being greatest at the bridge, where it crosses the Stono River. Here, it was as much as 37 inches to the south. After Rantowles Station (18 miles), there were many displacements, both lateral and vertical. At 18½ miles, a long southward deflection began, the amount of which reached 25 inches at the 19-mile point, 50 inches half-a-mile farther on, and was still greater at 20-2/3 miles. For two miles more, sinuous flexures were continuous, but, at the 22-2/3-mile point, they rapidly disappeared, the railroad passing on to higher and firmer ground. Between 25 and 27 miles, there were occasional slight flexures in the line or depressions of the railroad; but, after the 27¼-mile point, they seldom occur, and, when they do, are of little consequence.
Some of the effects described in the last paragraph may, as Major Dutton suggests, be due to the varying nature of the surface-rocks. It is important to notice, however, that disturbances of the lines were exceedingly rare in the section that lies nearest to the Woodstock epicentre, and that they increase in violence for some distance from that region, the maximum intensity being reached a mile or two to the west of Rantowles Station. This points clearly [117]to the existence of a second focus. Unfortunately, there are very few houses or other objects in the neighbourhood, and the position of the corresponding epicentre cannot be determined accurately. Major Dutton places it in the position indicated by a small circle (R), and calls it the Rantowles epicentre from its vicinity to the station of that name.
If the meizoseismal area had been a thickly populated one, the evidence of ruined and damaged houses would have provided materials for the construction of isoseismal lines surrounding the two epicentres. It is difficult, as it is, to gauge the equality of the effects on objects so different as railway-lines and buildings; and the isoseismals shown in Figs. 28 and 29 can therefore lay no claim to accuracy.
Fig. 28 shows the epicentral isoseismals as they are drawn by Mr. Earle Sloan. They do not correspond to the degrees of any definite scale of seismic intensity; but they may be taken as representing the impressions of a very careful observer, who traversed the district immediately after the occurrence of the earthquake, and who, when drawing these lines, was biassed by no preconceived theory.
Major Dutton, relying chiefly on Mr. Sloan's written notes, interprets the evidence differently, and obtains the series of curves shown in Fig. 29. In this case, also, the isoseismals correspond to no expressed standard of intensity. They are intended merely to represent the forms of the curves, and, by their less or greater distance apart, the more or less rapid rate at which the intensity varied.
The chief difference between the two maps concerns the form of the Woodstock isoseismals. Major Dutton draws them approximately circular, [118]leaving the map blank towards the north, where hardly any evidence was forthcoming. Mr. Sloan attributes the scantiness of effects here to a diminution of intensity, and makes the lines curve [119]in towards the epicentre. They certainly must do so in crossing the North-Eastern Railway; and the somewhat southerly trend of Mr. Sloan's curves to the east of this railway seems to me to furnish the better representation of the distinctly greater intensity in that region.

Fig. 28.—Epicentral isoseismal lines of Charleston earthquake according to Mr. Sloan. (Dutton.)ToList

Fig. 29.—Epicentral isoseismal lines of Charleston earthquake according to Major Dutton. (Dutton.)ToList
[120]More important, however, than this divergence of opinion is the agreement in one respect between the two sets of curves. Both show a marked expansion around the points known as the Woodstock and Rantowles epicentres, especially about the former, and a contraction in the intermediate region. The evidence of these isoseismals therefore confirms that of the damaged railway lines, and establishes Major Dutton's inference that there were two distinct foci, the epicentres of which were about thirteen miles apart.
In the last chapter, it was shown that the double shock of the Andalusian earthquake could be due only to two distinct impulses taking place either within the same focus or, more probably, in two detached foci. Similar reasoning applies to the Charleston earthquake. The double maximum or double shock was observed in no less than fourteen States. Moreover, the interval between the two maxima at Charleston appears from Fig. 26 to have been about 34 seconds in length. Thus, the duplication of the shock cannot have been a merely local phenomenon, nor can it have resulted from the separation into two parts of the earth-waves proceeding from a single disturbance. Each maximum must therefore be connected with a distinct impulse.
Combining this inference with Major Dutton's discovery of the double focus, no doubt can remain as to the origin of the repeated shock. It is clear, also, that the impulse at the Woodstock focus was the stronger of the two; for the isoseismals spread out [121]more widely round the corresponding epicentre, and there was no rapid decline of intensity from that point, such as might be associated with a weaker disturbance within a shallow focus.
Again, since the earlier part of the shock is almost uniformly described as the stronger, it follows that the Woodstock focus was the first in action. A curious fact recorded by Major Dutton supports this inference. In Charleston, four clocks were stopped by the shock, the errors of which at the time were certainly less than eight or nine seconds. The planes in which their pendulums oscillated are shown by the lines lettered A, B, C, and D in Fig. 30, the broken lines W and R representing respectively the directions from Charleston of the Woodstock and Rantowles epicentres. Clock A stopped at 9h. 51m. 0s., B at 9h. 51m. 15s., C at 9h. 51m. 16s., and D (which had been reset to the second earlier in the day) at 9h. 51m. 48s. Now, if the plane of oscillation coincided nearly with the direction of the shock, the only effect would be a temporary change in the period of oscillation; but if it was at right angles to the direction of the shock, the clock might be stopped by the point of the pendulum catching behind the graduated arc in front of which it oscillated. The planes of the first three clocks, it will be seen, were approximately at right angles to the direction of the Woodstock epicentre, and B and C were indeed stopped in the [122]manner just described; while the plane of shock D was nearly perpendicular to the direction of the Rantowles epicentre. As the pendulums of B and C might make a few staggering oscillations before their final arrest, Major Dutton assigns 9h. 51m. 12s. as the epoch of the first maximum at Charleston; and, as the interval between the two maxima was about 34 seconds, this would give about 9h. 51m. 46s. for the epoch of the second maximum—a time which agrees very closely with that given by clock D. Thus, clocks A, B, and C must have been stopped by the Woodstock vibrations, and clock D about half-a-minute later by those coming from the Rantowles focus.
Two methods of estimating the depth of the seismic focus have been described in the preceding pages—namely, Mallet's, depending on the angle of emergence, and Falb's, based on the interval between the initial epochs of the sound and shock. To these, Major Dutton adds a third method, in which he relies on the rate at which the intensity of the shock varies with the distance from the epicentre.
Dutton's Method of determining the Depth of the Focus.—If the seismic focus is either a point or a sphere, and the initial impulse equal in all directions, and if the intensity of the shock diminishes inversely as the square of the distance from the focus, then the continuous curve in Fig. 31 will represent the variation of intensity along a line passing through the epicentre E. The form of the curve on these assumptions does not depend in any way on the [123]initial intensity of the impulse; it is governed solely by the depth of the focus. The deeper the focus, the flatter becomes the curve, as we have seen in discussing the Ischian earthquakes (p. 68). In all directions from the epicentre, the intensity at first diminishes slowly; but the rate of change of intensity with the distance soon becomes more rapid, until it is a maximum at the points C, C; after which it again diminishes and dies out very slowly when the distance becomes great. It will be evident from Fig. 18 that the deeper the focus the greater also is the distance EC of the points where the intensity of the shock changes most rapidly. It may be easily shown, indeed, that this distance always bears to the depth of the focus the constant ratio of 1 to √3, or about 1 to 1.73.[42]
Now, if a series of isoseismals could be drawn corresponding to intensities which differ by constant amounts, we should have a series of circles like those surrounding the Woodstock epicentre in Fig. 29, the distance between successive lines at first decreasing gradually until it is a minimum at the dotted circle and afterwards gradually increasing. This dotted circle is obviously that which passes through all [124]points where the intensity of the shock changes most rapidly. Major Dutton calls it the index-circle and, when its radius is known, the depth of the focus is at once obtained by multiplying the radius by 1.73.
In 1858, Mallet proposed a method which bears some resemblance to the above,[43] but depending only on the intensity of the longitudinal waves. Major Dutton claims for his method that the effects of the longitudinal and transverse waves are not separated, that it takes account of the "total energy irrespective of direction or kind of vibration."
Objections to Dutton's Method.—I have described this method somewhat fully, though it seems to me open to more serious objections than Mallet's first method which it is intended to replace.
We have, in the first place, no reason for supposing that the focus is either a point or a sphere, or that the initial impulse is uniform in all directions. If [125]the earthquake were caused by fault-slipping, both assumptions would be untrue, and it is for those who employ the method to prove their validity.
But of greater consequence is the fact that, if the method were correct, all earthquakes originating at the same depth must have index-circles of equal radii. If the depth of the focus were, say, ten miles, then the index-circle must have a radius of about six miles, whether the initial disturbance be of extreme violence or so weak that it is not felt at the surface at all, much less so far as six miles from the epicentre. The law of the inverse square is of course only true for a perfectly elastic and continuous medium, and the real curve of intensity is not that of the continuous line in Fig. 31, but something of the form represented by the dotted line. In this case, the rate of change of intensity is greatest at some point C', nearer than C to the epicentre, and the application of Major Dutton's rule would give a point F', nearer the surface than F, for the focus. Thus, assuming that the method can be applied in practice—and the test involved is one so delicate that it would be difficult to apply except with refined measurements—then all that we can assert is that the calculated depth is certainly less than the true depth.
Dutton's Estimate of the Depth of the Seismic Foci.—In applying the method, the chief difficulty is to obtain a series of isoseismal lines corresponding to equidistant degrees of intensity. As already pointed out, those given in Fig. 29 are merely diagrammatic; but the index-circle of the Woodstock focus, represented by the dotted line, is made to pass through the places where the rate of change of intensity was [126]found to be greatest. The radius of this circle being very nearly seven miles, it follows that the resulting depth of the Woodstock focal point would be about twelve miles. Major Dutton regards this estimate as probably correct within two miles.
In the neighbourhood of the Rantowles epicentre, the isoseismals in both Figs. 28 and 29 are elongated in form. The index-circuit, as it would be called in such a case, cannot be drawn completely, but its radius parallel to the shorter axis of the curves is about 4½ miles, and the resulting depth of the Rantowles focal point would be nearly eight miles.
The recognition of the double epicentre is, from a geological point of view, the most important fact established by the investigation of the Charleston earthquake. But of equal interest, from a physical point of view, is the estimate of the velocity of the earth-waves, which is probably more accurate than that determined for any previous shock. Owing to the existence of the standard time system in the United States, the exact time is transmitted once a day to every town and village within reach of a telegraph line; and the effect of small errors in the observations is considerably lessened by the great distance traversed by the earth-waves, sixty good reports coming from places more than 500 miles from the epicentre, and ten from places more than 800 miles distant.
The total number of time-records collected is 316, but of these 130 had to be rejected, either because they were obviously too early or too late, or [127]because they were only given to the nearest five-minutes' interval. There remain 186 observations which are divided by Major Dutton into four classes according to their probable value.
In an earthquake of such great duration (about 70 seconds at Charleston), it is necessary in the first place to select some special phase of the movement as that to which the records mainly refer, and then to determine as accurately as possible the time of occurrence of this phase at the origin.
There can be little doubt as to which phase should be chosen. The shock began with a series of tremors, which passed somewhat abruptly into the oscillations that formed the first and stronger maximum. These were clearly felt all over the disturbed area, and, as the beginning of the first maximum at places near the epicentre and the beginning of the shock at distant stations were probably due to the same vibrations, this particular phase may be fairly selected as that to which the time-measurements refer.
The time of this phase at the origin can only be ascertained from the time at which it reached Charleston, and our knowledge of this depends chiefly on the evidence of stopped clocks. How unreliable this may be is well known. Clocks may indeed be stopped at almost any phase of the movement; and, whenever stopped clocks can be compared with really good personal observations, they almost invariably show a later time. At Charleston three good clocks were stopped by the vibrations from the Woodstock focus, two of them being in close agreement (p. 121); and, allowing for a few oscillations before their final arrest, Major Dutton places the time of arrival of the selected phase at [128]Charleston at 9h. 51m. 12s. P.M. The evidence of these clocks is also supported by that of other observations, which show that 9.51 was certainly the nearest minute to the time of arrival, and favour a somewhat later instant much more strongly than one a little earlier.
Now, the distance of Charleston from the Woodstock epicentre is sixteen miles, and from the corresponding focus (with the calculated value of its depth) twenty miles. A first estimate of the velocity gives a value of a little more than three miles a second, and the time at the Woodstock focus may therefore be taken as 9h. 51m. 6s. with a probable error of a few seconds.[44]
Proceeding to the observations at a distance, we find them, even after all rejections, to be very different in value. They were therefore divided into groups consisting of observations which are as nearly as possible homogeneous.
The first group contains five records from places between 452 and 645 miles from the Woodstock epicentre. They give the time to within 15 seconds, obtained from an accurately kept clock, or from a clock or watch that was compared with such within a few hours of the earthquake. The resulting velocity is 3.236 ± .105 miles (or 5205 ± 168 meters) per second.[45]
[129]In the second group there are eleven observations (between distances of 438 and 770 miles) which satisfy the same conditions as those in the first group, except that the time is only given to the nearest minute or half-minute. The velocity obtained from them is 3.226 ± .147 miles (or 5192 ± 236 metres) per second.
The third group included all but the above records and those obtained from stopped clocks. They are 125 in number (between distances of 80 and 924 miles), but it is uncertain whether they correspond to the selected phase of the movement, and the errors of the clocks and watches used were unknown. They give a mean velocity of 3.013 ± .027 miles (or 4848 ± 43 metres) per second.
In the fourth group, we have the evidence of 45 stopped clocks (at places between 20 and 855 miles), which apparently give a velocity of 2.638 ± .105 miles (or 4245 ± .168 metres) per second. At six places, however, the times indicated by stopped clocks can be compared with good personal observations; and these show that the time of traverse from the origin obtained from the former is on an average 1.28 times the time of traverse obtained from the latter. If a similar correction be made for all the stopped clocks, the corrected velocity of the earth-waves would be from 3.17 to 3.23 miles (or 5100 to 5200 metres) per second.
In obtaining the mean value of the velocity from all the observations, those of the fourth group are omitted, and the weights of the first three groups are [130]taken inversely as the squares of the probable errors—that is, as 2: 1: 4. The resulting mean velocity is 3.221 ± .050 miles (or 5184 ± 80 metres) per second; and, though it does not follow that all other estimates are erroneous (for the velocity may vary with the strength of the earthquake and with other conditions), it is probable that this result is more nearly accurate than any other previously obtained.
Fissures and Sand-Craters.—In point of size, there was nothing remarkable about the fissures in the ground produced by the Charleston earthquake. The largest were only a few hundred yards long, and, except near the river-banks, they rarely exceeded an inch in width. They seem, however, to have been unusually abundant; for, within an area of nearly 600 square miles surrounding the two epicentres, they were almost universal, and over a much wider area they still occurred in great numbers, though with somewhat less continuity.
From many of these fissures water was ejected, carrying with it large quantities of sand and silt, and so abundantly that every stream-bed, even though generally dry in summer, was flooded. By the passage of the water, some part of the fissures was often enlarged into a round hole of considerable size, ending in a craterlet at the surface. Certain belts within the fissured area contained large numbers of these craterlets, of all sizes up to twenty feet or more in diameter. One near Ten-Mile Hill was twenty-one feet across. In this district, they were apparently larger and more numerous than elsewhere; many [131]acres of ground being covered with sand, which, close to the orifices, was two feet or more in depth.
Here and there, the water was ejected with considerable violence, as was manifest from the heights to which it spurted. The testimony of witnesses on this point is of course doubtful, for the earthquake occurred after nightfall, but in a few places the branches and leaves of trees overhanging the orifices were smirched with sand and mud up to a height of fifteen or twenty feet.
Effects on Human Beings.—It is interesting to notice the behaviour of different races under the influence of a violent earthquake, and perhaps no greater contrast could be observed than between the calmness exhibited by the Japanese in the presence of disaster and the wild fear merging into helpless panic that characterised the residents, and especially the negroes, of Charleston. "As we dashed down the stairway," says a writer already quoted (p. 108), "and out into the street, from every quarter arose the shrieks, the cries of pain and fear, the prayers and wailings of terrified women and children, commingled with the hoarse shouts of excited men.... On every side were hurrying forms of men and women, bareheaded, partially dressed, some almost nude, and all nearly crazed with fear and excitement.... A few steps away, under the gas-lamp, a woman lies prone and motionless on the pavement, with upturned face and outstretched limbs, and the crowd which has now gathered in the street passes her by, none pausing to see whether she is alive or dead ... no one knows which way to turn, or where to offer aid; many voices are speaking at once, but few heed what is said."
[132]Between the selfish rush for safety here described and the calm interest of the most distant observers, Major Dutton records nearly every possible variety of mental effects, the actions resulting from which may be roughly classified as follows:
A. No persons leave their rooms.
B. Some persons leave their houses.
C. Most persons run into the streets, which are full of excited people.
D. People rush wildly for open spaces and remain all night out-of-doors.
In the map of the isoseismal lines (Fig. 25), the dotted curves bound the areas in which the effects corresponding to the three highest degrees of the above scale were observed. The curve for the first degree (A) coincides of course with the isoseismal line of intensity 2.
It will be seen that there is a certain rough correspondence between these curves and the isoseismal lines. The curve D and the isoseismal 8 are close together; in other words, people thought it wiser to camp out-of-doors for the night if the shock was strong enough to damage buildings slightly. The curve C and the isoseismal 6 are similarly connected; that is, if the movement made pictures swing, etc., people rushed into the streets. On the whole, the curve B and the isoseismal 3 roughly coincide, or, if the shock was not strong enough to make doors and windows rattle, some persons left their houses and public meetings were dispersed.
Feeling of Nausea.—A feeling of nausea was experienced by many persons at the time of the earthquake, somewhat rarely it appears in the neighbourhood of the epicentre and even outside the isoseismal [133]7, but more frequently beyond these limits, and perceptible as far as the broken line in Fig. 25. The most distant places at which it was noticed are Blue Mountain Creek (New York) and Dubuque (Iowa), which are respectively 823 and 886 miles from Charleston.
As Summerville lies six miles to the north-west of the Woodstock epicentre and Charleston 16 miles to the south-east, it is probable that many of the after-shocks were unfelt and a still greater number unrecorded. In Charleston, seven shocks, all much slighter than the principal shock, were felt during the night of August 31—September 1, and thirty before the end of September. Of these, the shock of September 3rd, at 11 P.M., was the strongest, but those which occurred on September 1st, 2nd, 21st, and 27th were also described as severe, and the remainder as moderate or slight. For weeks after the great shock, curious sensations were distinctly perceptible during the still hours of the night "as though the crust of the earth were resting on a gelatinous mass in constant motion." The last shock felt in Charleston seems to have been one recorded on March 18th, 1887.
At Summerville, many shocks occurred that were scarcely perceptible in Charleston, and those noticed in both places were usually stronger, and the motion more nearly vertical, at Summerville. "The peculiar characteristic of all of them was the deep, solemn, powerful boom, like the report of a heavy cannon, usually accompanied by a quick, short jar. Sometimes it was prolonged into a heavy roar or rumble, [134]as if many reports were delivered in a volley. The number of them was never recorded." On September 3rd, Mr. W.J. McGee, of the United States Geological Survey, arrived at Summerville. During the evening of that day, detonations were heard at intervals, averaging perhaps half-an-hour, accompanied occasionally by very slight spasmodic tremors of an instant's duration. They were much like peals of thunder at a distance of half-a-mile or more, though rather more muffled. "It was my impression," Mr. McGee remarks, "that the sound was sometimes about as grave as the ear can perceive, resembling somewhat the tremulous roar sometimes accompanying combustion in locomotives." These sounds continued, but with diminishing frequency, throughout the remainder of the year and as late as July 1st, 1887.
Major Dutton's valuable monograph is a record of the earthquake-phenomena. He offers no theory as to the cause of the shock, and is therefore in no way responsible for the account given in the remaining part of this chapter.
That there were two seismic foci he has shown, I think, conclusively; and my object is now to trace out briefly the probable nature of the movements that produced the double shock.
Referring to Figs. 28 and 29, it will be seen that, according to both Mr. Sloan and Major Dutton, the isoseismals surrounding the Rantowles epicentre are distorted along a line which runs from a few degrees east of north to a few degrees west of south. Their oval form is in all probability connected with a [135]focus elongated in about the same direction. Near the Woodstock epicentre, the isoseismals are drawn differently in the two maps, and in neither case do they offer any sure guide as to the form of the seismic focus. If, however, we follow Mr. Sloan's interpretation of the evidence, and suppose the earthquake to have been fault-formed, then it is probable that in this region the fault bends round slightly towards the east.
The only other evidence on this point is that afforded by the regions of defective intensity, real or apparent, along the three railway-lines diverging from Charleston. One of these occurred near Mount Holly Station on the North-Eastern Railway (B, Figs. 28 and 29), another for four miles starting from the 11½-mile point on the South Carolina Railway (A), and a third along the Charleston and Savannah Railway (C) over a distance of four miles from the Ashley River. In the first two cases, Major Dutton suggests that the less amount of damage was due to the nature of the soil traversed by the railway; but it is on the softer ground that the effects of an earthquake-shock are generally the more disastrous. On the whole, it seems to me probable that the three tracts referred to are really regions of less intensity, and it is worthy of notice that they lie along a nearly straight line.
To show the bearing of these remarks, let CD (Fig. 32) represent the section of a fault and EF that of the surface of the earth, and suppose the rock-mass A to slip slightly and suddenly downwards. Then the particles of A at the surface of the fault will, by impulsive friction, be drawn sharply upwards, and those of B correspondingly downwards; so that the [136]earth-waves in the two rock-masses will start in opposite phases of vibration. Along the line of fault, every particle of rock, being urged upwards and downwards almost equally, will remain practically at rest. Thus, regions of defective intensity may arise from partial interference by the spreading of either earth-wave in the adjoining rock-mass.
If this be the correct explanation, the path of the originating fault may be taken as that indicated by the broken line in Fig. 28, a line which is nearly parallel to the chief branches of the isoseismal curves.[46] As both epicentres lie on the west side of this line, the fault must hade or slope in this direction. The distortion of the Woodstock isoseismals towards the north-west confirms the latter inference, for the intensity of the shock is greater on the side towards which the fault hades.
From the comparative absence of earthquakes in South Carolina, we may infer that the fault is one subject to displacements at wide intervals of time. The gradually increasing stress along its surface was relieved at one or two points in or near the Woodstock focus on August 27th and 28th, and perhaps during the preceding months. But the first great slip [137]took place suddenly in that focus, and spread gradually southwards—for there was no interruption in the movement—until about half-a-minute later it reached the Rantowles focus, where the second great slip occurred. Eight or ten minutes afterwards there was another slip—in what part of the fault is uncertain—and this was followed at irregular intervals by many small movements gradually diminishing in frequency and in focal area. Within a year from the first disturbance, the fault-system attained once more its usual condition of rest.
1. Dutton, C.E.—"The Charleston Earthquake of August 31st, 1886." Amer. Geol. Survey, Ninth Annual Report, pp. 209-528.
2. Nature, vol. xxxv., 1887, pp. 31-33; vol. lxiii., 1901, pp. 165-166.
[38] The authorities for this statement are Mallet's Catalogue of Recorded Earthquakes (Brit. Assoc. Rep., 1852, pp. 1-176; 1853, pp. 117-212; 1854, pp. 1-326), which closes with the year 1842, and Fuchs' Statistik der Erdbeben von 1865-1885. According to Mallet, there was an earthquake in S. Carolina in November 1776, and the New Madrid earthquake of December 16th, 1811, was felt at Charleston. Fuchs records two earthquakes at Charleston on May 12th, 1870, and December 12th, 1876; and two in S. Carolina on December 12th and 13th, 1879.
[39] 1. Recorded by a single seismograph, or by some seismographs of the same pattern, but not by several seismographs of different kinds, the shock felt by an experienced observer.
2. Recorded by seismographs of different kinds; felt by a small number of persons at rest.
3. Felt by several persons at rest; strong enough for the duration or direction to be appreciable.
4. Felt by several persons in motion; disturbance of movable objects, doors, windows; creaking of floors.
5. Felt generally by every one; disturbance of furniture and beds; ringing of some bells.
6. General awaking of those asleep; general ringing of bells; oscillation of chandeliers, stopping of clocks; visible disturbance of trees and shrubs; some startled persons leave their dwellings.
7. Overthrow of movable objects, fall of plaster, ringing of church bells, general panic, without damage to buildings.
8. Fall of chimneys, cracks in the walls of buildings.
9. Partial or total destruction of some buildings.
10. Great disasters, ruins, disturbance of strata, fissures in the earth's crust, rock-falls from mountains.
[40] In order to simplify these figures, the rivers, most of the inlets, and other details are omitted. Small figures are added along the railway lines to denote the distance in miles from the stations in Charleston.
[41] If this were so, the decrease in intensity would be only apparent; but it may have been real, and a possible explanation on this supposition is given later on (p. 135).
[42] If c be the depth of the focus, a the intensity at unit distance from the focus, and y the intensity on the surface at distance x from the epicentre, then
y = a / (c² + x²)
The inclination of the curve at any point is given by
dy / dx = -2ax / (c² + x²)²,
and this is a maximum when
d²y / dx² or (3x² - c²) / (c² + x²)³
is zero, which is satisfied when c = x √3
[43] British Association Report, 1858, pp. 101-103.
[44] The above time would have to be increased by one second if the depth of the focus were very small, and diminished by one second if it were as great as 23 miles; the difference in either case being less than the probable error.
[45] The method employed is as follows: Let t0 be the computed time (9h. 51m. 6s.) at the focus, x seconds the error in this estimate, t the reported time at a given place, D its distance from the focus in miles, and y the number of seconds required to travel one mile; then, assuming that y does not vary with the distance, we have x + Dy = t + t0. An equation of this form is obtained from each observation, and the method of least squares is then applied to determine the most probable values of x and y.
[46] This seems to me the more probable course. It is possible, however, that the fault-line may pass from Mount Holly Station to the east of the Woodstock epicentre as shown in Fig. 28, and then to the west of the Rantowles epicentre, the fault changing its direction of hade in the intermediate district.
Few earthquakes have aroused a more widespread interest than those which struck the thronged cities of the Riviera on February 23rd, 1887. The first and greatest of the shocks occurred at about 6.20 A.M., the second nine minutes later, and the third, intermediate in strength, at about 8.51 A.M.[47] All three shocks were of destructive violence, the damage wrought by them extending along the coast and for a short distance inland from Nice to beyond Savona. Most of the injury to property and nearly all the loss of life were, however, concentrated on the eastern side of the frontier; and it therefore fell to the lot of the Italian Government to provide for the scientific investigation of the earthquakes, as well as to meet the wants of those deprived of home and support. Professors Taramelli and Mercalli, who two years before had studied the earthquakes in Andalusia, were again nominated, the former to examine the geology of the central regions, and the latter to report on the seismic phenomena. Their joint memoir forms one of the most complete accounts that we possess of any earthquake, and is the chief authority for the description given in this chapter. Another valuable monograph [139]is that prepared by Professor A. Issel, of Genoa, who received an independent appointment from the same Ministry. A third official commission was also sent to estimate the amount of damage caused by the earthquakes in the Italian towns and villages. In France, the destruction of property was much less serious, and attention was confined chiefly to the records of the shock provided by magnetographs and other instruments in distant observatories. In Switzerland, the effects remarked were merely those due to the evanescent vibrations of a remote earthquake; but many interesting records were collected by the permanent seismological commission established in that country.
Owing to variations in the nature, foundation, and site of buildings, there is always great diversity in the destructive effects of an earthquake. In one and the same town, most of the houses may be razed to the ground, while in their midst may be found some that are shattered but still standing, and others perhaps that are practically unharmed. The stronger after-shocks often complete the ruin of the partially damaged houses; though in such cases the real loss is as a rule comparatively small.
The close succession of the two strong after-shocks of February 23rd made it impossible as a rule to separate their effects from those due to the first shock; but it has been roughly estimated that about one-quarter of the total damage was caused by the two after-shocks together. To them also [140]must be referred in part the comparatively small number of wounded, many persons buried beneath the ruins having no doubt perished from subsequent falls before they could be extricated.
Taking all three shocks together, the total loss to property, according to Professor Mercalli, must be valued at about 22 million francs in Italy alone. For the province of the Alpes Maritimes in France, full details are wanting, but the loss there cannot fall far short of three million francs. The total amount of damage must therefore be placed at about a million pounds. From the figures given by the official commissions, it appears that the earthquakes were most disastrous at Diano Marina and Diano Castello; while other places, such as Oneglia, Bussana, Baiardo, Pompeiana, and Vallecrosia, suffered only a little less severely. At Mentone about 155 houses, and at Nice about 61 houses, were rendered uninhabitable, and many others were badly injured.
In Italy, 633 persons were killed, 432 seriously wounded, and 104 slightly wounded; in France, 7 persons were killed and 30 seriously wounded, the number of persons slightly wounded being unknown. The majority of the deaths occurred in two or three places. Thus, at Diano Marina, 190 persons were killed and 102 wounded; at Baiardo, 220 were killed and 60 wounded; at Bussana, there were 53 killed and 27 wounded. The death-rates were, however, comparatively small, amounting for the above places to not more than 8½, 14, and 6½ per cent., respectively; figures which only slightly exceed those obtained for places in the meizoseismal area of the Andalusian earthquake.
[141]Though the damage can hardly be regarded as excessive, it was nevertheless largely due to the peculiar architecture prevalent in the Riviera. Arches in the walls are common even in the upper storeys, and, in Oneglia and Diano Marina, if not also in other places, the floors are nearly always brick arches abutting against the walls and without other lateral support. Professor Mercalli believes that, in private houses, more than 90 per cent. of the dead bodies were crushed beneath these fallen arches. The height of the buildings is also great in proportion to the foundation and to the thickness of the walls; and the main walls are interrupted by numerous apertures, from the corners of which nearly all the fissures sprang. In some of the coast towns, the houses are built of rounded stones gathered from the beach, or of rubble with stones of all shapes and sizes, bound by cement of the poorest quality. Lastly, as much of the damage due to previous earthquakes had been badly repaired, it is evident that the destructiveness of the Riviera earthquakes must to a great extent be referred to preventable causes.
The occurrence of the principal shock shortly after six on the morning of Ash Wednesday must also have increased the death-rate; for many persons, after a night of amusement, had lain down for a short time and were sleeping heavily; while others had already risen and were collected in the churches; the circumstances in either case rendering escape more difficult.
Taking account, however, of this accidental increase in the number of victims, Professor Mercalli considers that the earthquake of 1887 was the most disastrous [142]of all those which have visited either the Riviera or northern Italy in the last three centuries; though, during the nineteenth century, there were three Italian earthquakes of far greater destructive power, but all confined to the southern part of the peninsula—namely, the Neapolitan earthquakes of 1805 and 1857, and the Ischian earthquake of 1883.
It is difficult, as usual, to specify the exact moment when the first earthquake of the 1887 series took place; but it is evident that the preparation for the great shock was very brief. At Oneglia, it is alleged that faint shocks and sounds were observed many times, chiefly at night, during the month preceding February 23rd; though they were not at the time supposed to be of seismic origin. A slight shock is also reported from Diano at about midnight on February 21-22.
The first undoubted shock occurred on February 22nd, at about 8.30 P.M., or ten hours before the principal earthquake. Though very slight, it was felt throughout the Riviera and in part of Piedmont. Another shock, also weak, took place at about 11 P.M.; and a third, sensible only in the eastern part of the Ligurian Apennines, on February 23rd, at about 1 A.M.; at which time the tide-gauge at Genoa recorded some abnormal oscillations. An hour later, a more important, though by no means a strong, shock occurred; this was perceptible all over the Riviera, in Piedmont, and in Corsica; in other words, it disturbed a region agreeing closely with the central area of the disastrous shock. At [143]about 5 A.M., a fifth shock, somewhat weaker than the preceding, was felt over the same area, concurrently, or nearly so, with another abnormal oscillation of the tide-gauge at Genoa; while a sixth shock was noticed at several places a few minutes before the great shock.
During the night of February 22-23, nervous persons in many towns and villages were agitated without apparent reason. Birds and animals, more sensitive than human beings to faint tremors, were more distinctly affected, especially for some minutes before the earthquake. Horses refused food, were restless or tried to escape from their stables, dogs howled, birds flew about and uttered cries of alarm. As these symptoms were noticed at more than one hundred and thirty places within the Italian part of the central area, there can be little doubt that they were caused by microseismic movements for the most part insensible to man.
The only complete map of the isoseismal lines is that drawn by Professor Mercalli.[48] In this map, reproduced in Fig. 33, the continuous curves represent the principal isoseismal lines; the dotted curves define the disturbed areas of two of the stronger after-shocks.
The meizoseismal area, bounded by the curve marked 1 in Fig. 33, is also shown on a larger scale in Fig. 34. At the places denoted by small circles in the latter figure, the principal shock was [144]"disastrous," some of the houses in each being either totally or partially ruined. At those marked by a small cross, the shock was "almost ruinous"; in other words, numerous houses were damaged, but in no case was the injury of a serious character. The meizoseismal area is thus a narrow band, skirting the Riviera coast from Mentone to Albissola, a distance of 106 miles, and extending inland for not more than from nine to twelve miles. The greatest intensity, corresponding to [145]the ruin of many houses with considerable loss of life, was reached at only a few places between Bussano and Diano Marina, all lying within a littoral band about twenty miles in length and three to three and a half miles in width. If, however, the epicentre had lain on land, the area would have been much greater, Professor Mercalli estimates about four times greater, than its actual amount.
The curve marked 2 (Fig. 33) bounds the "almost ruinous" zone; its expansion towards the north and contraction towards the west, north-west, and east, being its most noteworthy features. The next zone, that of slight damage, is contained between the isoseismals 2 and 3, the latter curve probably grazing the north end of Corsica. Beyond this lies the "strong" zone, in which the shock was generally felt without causing any damage to buildings. Its boundary (marked 4) passes near Marseilles, Como, and Parma, and includes nearly the whole of Corsica; towards the north-west, in the valley of Aosta, it curves in towards the isoseismal 3.
In the outermost zone of all the shock was "slight," and towards the margin was only just perceptible. The boundary, which of course defines that of the disturbed area, reaches as far north as Basle and Dijon, to Perpignan on the west, Trento, Venice, and Pordenone on the east, and to the south as far as Tivoli (near Rome) and the northern end of Sardinia. In eastern Switzerland, it shows a marked curve inwards; possibly, as Professor Mercalli suggests, from the vibrations having to cross the northern Apennines in a direction nearly at right angles to their axis. Except for this bay, [146]however, the curve differs little from a circle, the centre of which lies in the sea, a little to the south of Oneglia, close to the position assigned by other evidence to the epicentre. The radius of this circle being about 264 miles, it follows that the disturbed area must have contained about 219,000 square miles—by no means a large amount for so strong an earthquake.
It is evident, from the form of the meizoseismal area shown in Fig. 33, that a mere fringe of it lies upon land, and that the epicentre must be situated some distance out at sea. Other facts may be mentioned which point to the same conclusion. There were, for instance, no purely vertical movements observed, even in the districts where the damage done by the shock was greatest. Nor were any large landslips to be seen in those areas; there were no lasting changes in the underground water-system; and in general, as Professor Mercalli remarks, all the superficial distortions of the ground which are so characteristic of the epicentral area of a great earthquake were conspicuous by their absence. There is evidence, again, of some disturbance of the sea-bed in the death and flight of fishes from great depths and in the seismic sea-waves recorded by the tide-gauges at Genoa and Nice. These phenomena will be described in a later section, but reference should be made here to an interesting observation at Oneglia on the occurrence of some of the stronger after-shocks. Persons on the coast, it is said, saw the sea curling and moving, and immediately afterwards the shock was felt.
[147]In determining the position of the epicentre, Professor Mercalli had recourse as usual to observations on the direction of the shock, especially those derived from the oscillation of lamps or other suspended objects, the projection or fall of bodies free to move, fractures, etc., in damaged houses, and the stopping of pendulum clocks. Such observations were made at 120 places—72 in the western Riviera and the Alpes Maritimes, and 48 at Piedmont, Lombardy, and Tuscany.
At many of these places the movement was extremely complicated. In nearly all parts of the area most strongly shaken, for instance, the direction of the shock changed more than once; and it was therefore necessary to select whenever possible the principal direction of the shock at each place. In some towns, such as Oneglia, Mentone, Antibes, Cuneo, etc., the shock had two dominant directions, and these appeared to be sensibly at right angles to one another; an inclination which, as Professor Mercalli suggests, may be due in part to the approximation of the real directions to those of the principal walls of the houses in which the observations were made.
Most of the lines of direction, when plotted on the map, converge towards an area lying between the meridians of Oneglia and San Remo, and between nine and fifteen miles from the coast. For places near the epicentre, the most trustworthy, in Mercalli's opinion, are those made at Oneglia, Mentone, Taggia, Bordighera, Castel Vittorio, Nice, and Genoa; and the points in which these lines Intersect one another are Indicated by small crosses on the map of the meizoseismal area (Fig. 34). All of them lie at sea at distances between six and fifteen miles to the [148]south of Oneglia. The most probable position of the principal epicentre is that marked by the small circle A, which is situated about fifteen miles south of Oneglia.
[149]There are, however, several lines of direction which can have no connection with this epicentre. Besides the east and west lines at Nice, Mentone, and Antibes, there are others at the same places which run north and south or nearly so. Professor Mercalli believes that they were due to vibrations coming from a second focus lying to the south of Nice, and there are also several lines of direction at more distant places which converge towards the neighbourhood of the corresponding epicentre.
This conclusion receives unexpected support from some of the best time-records. At the railway-stations of Loano and Pietra Ligure, the times of occurrence were given as 6h. 20m. 5s. and 6h. 20m. respectively—estimates which are probably accurate to within a few seconds; for, at the moment of the shock, the officer who brought the exact time along the railway-line from Genoa was at Loana, and had just passed through Pietra Ligure. On the other hand, the estimates for Mentone and Nice—namely, 6h. 18m. 35s. and 6h. 19m. 43s., if not equally exact, cannot err by many seconds, certainly not by so much as one minute. Since the distances of Loana and Pietra Ligure from the principal epicentre are 31 and 32 miles, and those of Mentone and Nice 28 and 37 miles, it is therefore clear that the vibrations which arrived first at Nice and Mentone must have come from a local focus, where the impulse preceded that at the principal focus by several seconds.
Inaccurate as are all the methods of determining the depth of focus, it seems probable, as Professor [150]Issel argues, that the principal Riviera focus was situated at a considerable distance from the surface. In no part of the meizoseismal area was the shock a really violent one; yet its intensity must have faded very slowly outwards, for it was strong enough to stop clocks at places in Switzerland and elsewhere not less than 250 miles from the origin.
Professor Mercalli regards Mallet's method with greater favour than most seismologists. He points to the gradual increase in the angle of emergence from the outer zones disturbed by the Riviera earthquake towards the meizoseismal area, where several good observations were made from fissures in walls parallel to the dominant direction of the shock. The angles of emergence which he considers as most trustworthy are those of 35° at Taggia, 40° at Oneglia, and about 30° at Bordighera. The corresponding depths for the focus are 10.4, 10.4, and 11.6 miles, giving an average of about 10¾ miles.
There are no similar observations forthcoming for the depth of the secondary focus near Nice and Mentone; but Professor Mercalli observes that it must have been shallower than the other, for the vertical component of the vibrations from this focus was much less sensible than that of the motion coming from the principal focus.
The Double Shock.—In the valuable collection of records made by Professors Taramelli and Mercalli there appears at first sight to be the utmost diversity in the evidence with regard to the nature of the shock. Thus, in the province of P. Maurizio alone, [151]the shock was described as subsultory first and then undulatory or vorticose at 25 places, undulatory and then subsultory at 22, undulatory and then subsultory and again undulatory or vorticose at 13, and subsultory first, then undulatory, and finally subsultory and vorticose at two places. It is clear that the shock was of considerable duration, not less than half-a-minute as a rule, and that there were several phases in the movement; and it would seem that one or more of these phases may have passed unnoticed owing to the alarm occasioned by the shock, and to the fact that most of the observers were asleep when the earthquake began. Defects of memory must also have an influence not to be neglected, for, even with the simple shocks felt in the British Isles, persons in the same or neighbouring places differ greatly in their testimony.
But, if we confine ourselves to the accounts of careful persons alone, the discrepancies to a large extent disappear. Indeed, all over the ruinous area (Fig. 33) the shock maintained a nearly uniform character. At Oneglia, for instance, there were two well-marked phases, the first of which began with a brief subsultory movement, followed by more horizontal undulations of longer period; a pause, lasting but for an instant, was succeeded by vibrations which, though not vertical, were highly inclined to the horizon; they continued throughout the second phase, but, towards the end, new undulations were superposed, and these, coming from different directions, resulted in an apparently vorticose movement. Professor Mercalli represents the motion diagrammatically by the curve a in Fig. 35. At Diano Marina, as will be seen from the curve b, the shock [152]again consisted of two phases, each beginning with a few subsultory vibrations and ending with horizontal undulations of much longer period. In the first phase, the undulations were marked by a dominant direction, but, towards the close of the second phase, there was no determinate direction, and the impression was again that of a vorticose shock. At Savona, the movement, which is represented by the curve c, must have lasted from twenty-five to thirty seconds. It also consisted of two phases, with subsultory vibrations and undulations in the same order; and it was noticed that the second part of the shock was much stronger than the first. According to some observers, the concluding movements were vorticose.
In the zone surrounding the ruinous area, the vertical component of the motion was observed to diminish with the intensity; but, in other respects as well as in duration, the shock retained the same general form. At Genoa, Turin, Acqui, Alessandria, Antibes, and other places, two distinct phases were [153]perceived, occasionally separated by a brief pause, the first being invariably the weaker. At some places, the observers speak of two shocks at about 6.20 A.M., separated by an interval of a few seconds; and this division was noticeable as far as Salò on the shore of Lake Garda and Vicenza in Venetia. Only in Switzerland and other districts near the boundary of the disturbed area did the weaker part of the shock become insensible, the other consisting of horizontal oscillations, remarkable for their slowness and regularity, and lasting for as much as twenty or thirty seconds.
We may thus conclude, with Professor Mercalli, that the earthquake resulted from the almost immediate succession of two distinct shocks, in each of which the nearly vertical vibrations were more marked at the beginning, while the slower undulations predominated towards the close, those of the second phase generally becoming vorticose through the superposition of movements coming from different directions. The second part of the shock in all of the more carefully written accounts is described as the stronger, especially as regards the subsultory vibrations in the meizoseismal area; except in the immediate neighbourhood of Nice, where the second phase was generally regarded as the weaker, or at any rate as not stronger than the first.
Origin of the Double Shock.—These observations show, not only that the principal earthquake consisted of two distinct shocks, but also that the shocks originated in different foci. For, if the vibrations of both had started from one focus, the second shock would have been everywhere the stronger; instead of which there was a small area near Nice where the [154]intensity of the first was the greater. This points clearly to the existence of another focus situated not far from Nice; and it is evident that the greater intensity of the first part in that district was due solely to the proximity of this focus, for, still farther to the west, at Antibes, the second part was again the stronger.
There is thus a striking agreement in the inferences drawn from observations on the direction, time of occurrence, and nature of the shock. In the face of such concurring testimony, little doubt can remain as to the existence of two foci, one to the south of Oneglia and the other to the south of Nice, the initial impulse at the latter being decidedly the weaker, and preceding that at the eastern focus by an interval of some seconds, long enough at any rate for the resulting vibrations to reach the Oneglia focus and to spread beyond it before the vibrations from that focus started on their outward journey.
Seismographic Records.—In 1887, the Riviera and the districts adjoining it were unprovided with accurately constructed seismographs. The observatories at Alessandria, Milan, Monza, Parma, Florence, and other places in Italy contained seismoscopes and other pendulums, and these all registered the fact that an earthquake had occurred, and in many cases traced a series of elliptical or elongated curves. A record of the shock was also given by a Cecchi seismograph at Perpignan in France, but the distance from the epicentre was too great to allow details to be shown. The most valuable record was that obtained from a Cecchi seismograph at the observatory of Moncalieri, near Turin, about ninety miles north of the principal epicentre.
[155]In this seismograph, the pendulums are provided with pointers, the tips of which touch vertical sheets of paper attached to the sides of an upright rectangular box. When an earthquake occurs, this box is made to descend slowly with a uniform velocity, while the moving pointers trace curves upon the smoked paper. The north-and-south component of the horizontal motion is inscribed on the sheet of paper facing west, and the east-and-west component on the paper facing south.
During the principal Riviera earthquake, the former pendulum furnished an indistinct record, while the other traced the diagram reproduced in Fig. 36. The movement, as here represented, began at about 6h. 21m. 50s. A.M. (mean time of Rome) with a series of small tremors, which lasted for about twelve seconds. Then followed some large oscillations, always in a nearly east-and-west direction, which at 6h. 22m. 21s. gave place to a second series of tremors similar to those at the beginning of the shock, but of greater amplitude. These continued for at least twelve seconds, at the end of which time the motion of the smoked paper ceased. The total duration of the movement at Moncalieri cannot therefore have been less than forty-three seconds.
[156]Interesting as this record is, it is doubtful how far it represents accurately the movement of the ground. The Moncalieri instrument was erected before the modern type of seismograph was designed, in which some part remains steady, or very nearly steady, during the complicated movements of the ground that take place in an earthquake. It will be noticed that the curve in Fig. 36 shows no sign of the division of the shock into two distinct parts, and this may perhaps be due to the swinging of the pendulum itself; in which case, the curve described by the pointer would be the resultant of the oscillations of the ground and the proper motion of the pendulum.
The sounds that preceded and accompanied the Riviera earthquake have attracted but little study, although they seem to have been widely observed. No attempt was made to define the limits of the area over which they were audible; but Professor Mercalli states that in the two outer zones (Fig. 33) the sound generally passed unobserved. It was, however, heard near Piacenza in Lombardy and Reggio in Emilia, places which are about 115 and 140 miles from the principal epicentre.
In the area in which the shock was most violent, the sound resembled that of trains and vehicles in motion; while, outside this area it generally appeared to be like the hissing of a violent wind. In only a few places was it compared to detonations, the crashes of artillery or distant thunder. Some observers describe the sound as appearing at first [157]as if a strong wind were rising, and then as the roaring of a heavy railway-train passing.
Nearly all the observers, who were awake at the beginning of the earthquake, agree in asserting that the sound distinctly preceded any movement of the ground. From this, as in the case of the Andalusian earthquake, Professor Mercalli infers that the sound-vibrations travelled with the greater velocity; but, as will be shown in Chapter VIII., the general precedence of the sound admits of another and more probable explanation.
If the Andalusian earthquake first drew general attention to the distant spread of unfelt earth-waves, the Riviera earthquake showed that this was no isolated phenomenon. We know now that the propagation of such waves is only limited by the surface of the earth, but in 1887 some doubt was felt at first as to the nature of the disturbance, whether it was magnetic or mechanical in its origin.
In 1884, the only observatories at which magnetographs were disturbed were those of Lisbon, Parc Saint-Maur (near Paris), Greenwich, and Wilhelmshaven. In 1887, the magnetographs registered the Riviera earthquake at these and several other observatories, the distribution of which is shown in Fig. 37. In this sketch-map, the position of the principal epicentre is represented by the small cross, while the nearly circular line shows the boundary of the disturbed area.

Fig. 37.—Distribution of observatories at which magnetographs were disturbed by the Riviera earthquake.ToList
Three of the observatories, those of Nice, Lyons, [158]and Perpignan, lie inside this area. At Nice (which is thirty-seven miles from the principal epicentre), M. Perrotin states that the magnetograph curves show nothing of any interest, except a notable magnetic perturbation on the vertical force curve, the time of which, however, is not stated.[49] At Lyons (211 miles), the declination, horizontal force and vertical force, magnets were all disturbed at 6h. 25m. 47s. A.M., and Perpignan (264 miles), all three magnets, but especially those for the [159]declination and horizontal force, were set abruptly oscillating at 6h. 25m. 20s.
Elsewhere in France, the disturbances were noticed at the observatories of Parc Saint-Maur and Montsouris, near Paris (about 447 miles), and at Nantes (538 miles). At Parc Saint-Maur, all three curves show a very clear trace of the earthquake at 6h. 25m. 35s., the oscillations lasting several minutes, and at Montsouris they also began at the same time. At Nantes, the perturbations were so slight that they escaped notice on a first examination.
In Austria, disturbances were observed at Pola (295 miles) and Vienna (506 miles), beginning at 6h. 28m. 35s. and 6h. 30m. 35s., respectively. They reached Brussels (522 miles) at 6h. 29m. 27s., and Utrecht (600 miles) at 6h. 28m. 38s.[50] At Wilhelmshaven (690 miles), only the vertical force magnet was affected, the oscillations beginning at 6h. 30m. 35s., and lasting for fourteen minutes. At 6h. 27m. 55s., the declination and horizontal force magnets of Greenwich observatory (642 miles) were set vibrating, but no similar disturbances were revealed by the vertical force curve or by the two earth-current registers. At Kew (652 miles), the horizontal force magnetograph was moved by the earthquake at about 6h. 29m. 55s. The curves at Stonyhurst and Falmouth show no sign of any disturbance, nor do those at Pawlovsk in Russia, or Seville. At Lisbon (951 miles), however, the three curves indicate disturbances at 6h. 32m. 35s., but so feeble are they that they would have escaped discovery if the occurrence of the earthquake had been unknown.
[160]The effects registered on the magnetograms are quite different from those which correspond to ordinary magnetic perturbations; but they are not unlike those produced by the action of the momentary currents which are used for making the hour-marks, except that the earthquake-oscillations lasted several minutes (see Fig. 21). In each case, then, the magnetic bars must have received a succession of several or many impulses.
Now, the effect of these impulses on each magnet must depend on the relations which exist between the period of oscillation of the magnet, the rate of damping of such oscillations, and the interval between the successive impulses. Also, the apparent commencement of the phenomena may be delayed if two impulses of contrary sense should follow one another before the bar is perceptibly displaced. It is therefore to be expected, as M. Mascart points out, that the disturbances of the three instruments need not be of the same order of magnitude, that with different forms of apparatus the effects may be very variable, and that the deflection of one instrument may precede that of another at one and the same place.
In all the magnetographs, the record is made on photographic paper, which travels so slowly that the time of a movement can only be ascertained to the nearest minute. As the disturbances on the French curves were apparently almost simultaneous, and as no two of the others differed in time of occurrence by more than five minutes, there is thus some colour for M. Mascart's contention that the magnetic apparatus registered, not the movements of the ground, but the passage of electric currents [161]produced in the ground at a certain epoch of the earthquake.[51]
On the other hand, it is important to notice that, in the central part of the disturbed area, at Nice, two, if not all three, of the magnetographs were unaffected at the time of the earthquake.
At first sight, this fact seems equally opposed to a mechanical explanation of the disturbance. But, when the vibrations are very rapid, as they are in the neighbourhood of the epicentre, the magnetic bars, owing to their mode of suspension, have not sufficient time to be sensibly deflected in the brief interval between successive phases of the impulse. The magnetograms of the Montsouris observatory show, for instance, hardly any perceptible trace of disturbance during the passage of railway trains along two adjacent lines. The farther, however, the earth-waves travel from the origin, the longer becomes the period of their vibrations. In Switzerland, they were remarkable for their slowness, even to the unaided senses. Thus, at places more or less remote from the Riviera, the magnets would receive impulses at intervals approximating to their own periods of vibration, and they would then oscillate freely for some time.
Again, notwithstanding some variations, it will be [162]remarked that on the whole the retardation of the initial epoch of the disturbances increases with the distance from the epicentre. It thus seems clear, I think, that the cause of the disturbances must be sought in the shock itself; although their initial epochs at different places are too roughly defined for ascertaining the velocity with which the earth-waves travelled.
The Riviera earthquake, owing to its submarine origin, was marked by certain phenomena that were absent from the other earthquakes described in this volume.
Nature of the Earthquake at Sea.—At the time of the earthquake, several vessels were close to the epicentral area. One, about three miles off Diano Marina, was shaken twice at about 6.20 A.M., and so violently that it seemed as if the masts would be broken off. Another, about ten miles south of P. Maurizio, also experienced two shocks, a few minutes apart, as if each time it had struck the bottom. These observations are chiefly interesting in showing that the double shock was felt at sea as well as on land. As transverse vibrations are not propagated through water, it follows that the second part of the shock cannot, as some maintain, have been composed of transverse vibrations.
Destruction of Fishes.—During the days immediately following the earthquake, a large number of deep-sea fishes were found dead or half-dead either in shallow water or stranded on the beach, especially in the neighbourhood of Nice. Among them were numerous specimens, mostly dead and floating, of [163]Alepocephalus rostratus, a typical deep-sea form, several of Pomatomus telescopium, Scopelus elongatus, and S. humboldti, and many of Dentex macrophthalmus and Spinax niger. The death and flight of these fishes must have been due to a sudden shock, almost like that caused by the explosion of dynamite, and communicated simultaneously to the whole surface of their bodies.
Seismic Sea-Waves.—Immediately after the earthquake, the sea retired a short distance, variously estimated at from ten to thirty metres, laying bare some rocks that were usually immersed. At P. Maurizio, the surface was lowered by a little more than a metre; and after a few minutes it rose to nearly a metre above its original level, returning to it after a series of continually-decreasing oscillations. At San Remo, a fall of about the same amount took place, the sea returning after five minutes, and a ship anchored in the harbour broke from her moorings. Again, at Antibes, the sea was suddenly lowered by about a metre, so that ships afloat in the harbour were aground for some instants, and then returned with some impetuosity to its original level.
The evidence of eye-witnesses is confirmed by that of the tide-gauges at Nice and Genoa, the curves of which are reproduced in Figs. 38 and 39. At Nice, the first arrest of the curve in its usual course occurred [164]at 6.30 A.M.;[52] the sea-level sank somewhat abruptly, and after a few marked oscillations gradually returned to its normal position at 7.50 A.M. At Genoa, the shock caused the writing-pen of the tide-gauge to dent the paper on which the record is made, and soon afterwards the curve shows a series of irregular oscillations, about eight taking place every hour, and gradually decreasing until they ceased to be perceptible about two hours after the principal earthquake.
Connection between Geological Structure and the Intensity of the Shock.—As with the Andalusian earthquake, faulty construction and defective materials were responsible for much of the damage caused by the Riviera earthquake. But, if we may judge from the sharp local variations in its amount, the nature of the surface-rocks must have exerted a still more potent influence. At Cervo, for example, the injury to property amounted to less than £3 per head of the population; at Diano Marina, only two or three [165]miles to the west, it rose to £22 per head. The death-rate at Cervo was about one-tenth, and at Diano Marina about 8½ per cent. Again, at Mentone, the damage must have been considerable, for about 155 houses were rendered uninhabitable; while Monte Carlo, only a few miles farther west, escaped almost unharmed. Now, Mentone and Diano Marina are for the most part built on clay or alluvial deposits, and Monte Carlo on a foundation of limestone.
Even within the limits of a single town, variations no less striking were perceptible. In Mentone, the greatest damage occurred to houses of two storeys built on alluvial soil in the low-lying parts near the sea and in the valleys. The effect of the foundation in this part was well shown in the case of two equally well-built houses not more than 300 yards apart. One in the valley, with doubtful foundations, was very much shattered; the other, built on rock, was uninjured. The large hotels, especially those on high ground, suffered least, few of them having their main walls seriously damaged. These buildings rise to heights of from four to six storeys, and of necessity have a firm and solid foundation.
Professors Taramelli and Mercalli have made a careful study of the subject of this section. The general conclusions at which they arrive are that the intensity of the shock was greatest at places built on pliocene conglomerates, beds of clay superposed on compact old rocks, patches of alluvium, miocene formations of some thickness formed of repeated alternations of strata of incoherent marls and limestones or compact sandstones, beds of chalk, or somewhat rotten dolomite.
The shock was also more destructive on the [166]summits of isolated hills and ridges and on the steep slopes of mountains. The influence of the form of the ground was, however, subordinate to that exerted by the nature of the subsoil. Thus, at Mentone, as we have seen, and also at Nice and Genoa, houses built on rock in elevated positions suffered much less than those situated on the plains below that are composed of sand and recent alluvium.
Observations of the Earthquake in Railway-Tunnels.—Observations made in mines at various times and places have proved that an earthquake is felt less strongly in deep workings, if felt at all, than on the surface of the ground. In the railway-tunnels of the Riviera, as Professor Issel has shown, the same result was established during the earthquake of 1887.
On the line which runs northward from Genoa to Piedmont, a tunnel more than five miles in length pierces the hilly ground between Ponterosso and Ronco, the greatest thickness of rock above being about a thousand feet. At the time of the earthquake, the tunnel was not everywhere opened out to its full width, and men were at work in different sections. Outside, the shock was strong enough to damage buildings. Inside, at about 200 yards from the south end, only a feeble shock was felt; at 1,350 and 1,625 yards, some bricks were seen to fall from the facing, but the shock was not otherwise perceived, and only a few yards farther nothing unusual was noticed by the men at work.
Again, in an unfinished tunnel, about three-quarters of a mile long, between the harbour of Genoa and the eastern railway-station, the vibrations were very slightly felt. Even in the tunnels traversed by the coast railway from [167]Genoa to Nice—that is, in those situated within the meizoseismal area—the shock was either very weak or not felt at all, and not one of the tunnels suffered the slightest injury.
To men at work inside a long tunnel, the conditions for observing earthquakes are somewhat imperfect, but these facts, nevertheless, bring out very clearly the inferior intensity of the shock at some depth below the surface.
While the unfelt earth-waves of the great earthquake were still wending their way over the zone that surrounds the disturbed area, the central regions were again shaken, at 6.29 A.M., by a shock strong enough to produce fresh ruins in the stricken towns along the coast. Nearly two and a half hours of quiet followed, broken only by a few subterranean rumblings in the central part of the meizoseismal area. Then, at 8.51 A.M., occurred another shock, short and sharp, and inferior in strength only to the principal earthquake. Both of these after-shocks were felt in Western Switzerland; indeed, they were perceptible nearly as far as the great shock; the second, however, a little farther than the first, for it alone was noticed at such places as Vicenza, Forlì, and Florence. The shock at 6.29 was usually described as long and its vibrations as undulatory only; that at 8.51 as rather subsultory than undulatory and of very brief duration. The latter, however, was followed after an interval of a few seconds by another shock so weak that it generally passed unobserved. Both shocks were preceded by a rumbling sound.
[168]During the next two days, tremors and earth-sounds were frequent in the Riviera; once an hour, on an average, the greater part of the meizoseismal area was shaken by vibrations more or less slight. But, between one shock and another, at Diano Marina and Alassio, and even as far as Nice, it only required attention from a careful observer to perceive an almost continual throbbing of the ground.
Only one of these shocks, that of February 24th, at 2.10 A.M., was strong enough to cause slight damage to buildings. It disturbed an area, not exceeded by any of the later shocks, the boundary of which, shown by the dotted line A in Fig. 33, extends to the north and east as far as Piacenza and Spezia, while to the west it includes Cannes. The centre of the curve so drawn lies on land, but, as the shock was not felt in Corsica, there is no evidence as to the southerly extension of the disturbed area; and it is probable, as Professor Mercalli suggests, that the shock originated in the eastern or Oneglia focus of the great earthquake.
After February 25th, slight shocks were felt during the next fortnight, at the rate of three or four a day, until March 11th, when the last after-shock resulting in slight damage occurred at about 3.12 P.M. The boundary of its disturbed area, represented in Fig. 33 by the dotted line B, passes a little to the east of Savona, and then through Alessandria, Moncalieri, and Marseilles. The shock, however, was not observed in Corsica, so that the exact position of the epicentre is unknown; but Professor Mercalli believes it to coincide with the western or Nice epicentre of the principal earthquake. At the [169]moment of the shock, the sea was observed from Alassio to curl and to rise slightly, while the tide-gauge at Nice, which had traced a continuous curve earlier in the day, showed a characteristic notch about 3.7 P.M.
Of the remaining after-shocks, only two attained any notable degree of strength. One, on May 20th at about 8.15 A.M., disturbed an area nearly concentric with that of the great earthquake, and with a boundary coinciding nearly with the isoseismal 2 in Fig. 33. Again, on July 17th at 11.30 P.M., occurred a shock felt over an area nearly as large as that disturbed on February 24th at 2.10 A.M., and situated in the same part of the country.
Altogether, during the year following the Riviera earthquake, Professor Mercalli records 190 after-shocks, most of them slight or only just felt. With the exception of the first two (on February 23rd), none was observed outside the isoseismal 4 of the principal earthquake (Fig. 33); and, of the rest, only the four whose dates are given above disturbed an area of more than one-eighth of that of the great shock. Some of them, like the shock of March 11th, were stronger in the western part of the meizoseismal area; but the majority affected most the eastern portion and seem to be closely associated with the Oneglia focus.
From February 26th to April 20th, Professor Rumi made observations on the after-shocks by means of the Foucault pendulum erected at Genoa for demonstrating the rotation of the earth. In nearly every case, the oscillations took place along a north-east and south-west line, or in the same direction as the first great shock—a resemblance which supports [170]the inference that many of the after-shocks originated within the Oneglia focus.
Recent Movements in the Riviera.—The earliest movements that resulted in the great range of the Maritime Alps and the Ligurian Apennines date from pre-Carboniferous times, when the central crystalline massifs in part emerged. At the end of the Liassic epoch, the secondary formations of the district were uplifted, and it was at this time that the range assumed its characteristic curved form. Later still, at the close of the Eocene period, an elevation of more than 9000 feet took place, for upper Eocene beds are found at this height in the Maritime Alps.
Since that time, other important movements have occurred. Pliocene deposits have been found in the Riviera at an altitude of 1,800 feet. Recent soundings in the Gulf of Genoa have also shown that all the valleys of the Riviera between Nice and Genoa are continued far below the level of the sea to depths of not less than 3000 feet. Thus, at the end of the Pliocene or beginning of the Quaternary period, there was an elevation of nearly 5000 feet, accompanied or followed by the erosion of the valleys which, later on, during the Quaternary period, were submerged about 3000 feet. Even in still more recent times, probably in the Palæolithic age, minor movements continued. Traces of recent elevation, varying in amount from a few feet to sixty feet or more, occur at the Balzi Rossi in the Alpes Maritimes, near Bergeggi, and in Genoa; [171]while evidences of submergence are to be found near Monaco, at Beaulieu and at Diano Marina. It is important to notice that the great movements dating from the end of the Eocene period are almost confined to the Maritime Alps and the western portion of the Riviera. In the parts of Piedmont lying to the north of Cuneo and in the eastern Riviera, they produced hardly any sensible effect.
Seismic History of the Riviera.—The movements just referred to are those which, in course of time, have become sensible to the eye. They represent the sum of a long-continued series of displacements that may once have been on a large scale, but are now comparatively small. The earthquakes that occur in the Riviera show, however, that the final stage has not yet been reached. Their epicentres indicate the regions in which slips are still taking place, and the magnitude of these slips is roughly measured by the intensity of the resulting shocks.
The map in Fig. 40 is one of a series drawn by Professor Mercalli to represent the distribution of seismic activity in Piedmont and the Riviera. It corresponds to the period from 1801 to 1895. The whole area is divided into a number of seismic districts, each of which is distinguished by a particular degree of activity. In estimating this quantity, Professor Mercalli takes intensity as well as frequency into account. Thus, the lowest degree, represented by the lightest tint of shading, corresponds to one or two strong earthquakes with a few moderate or slight shocks; the eighth and highest to four or five ruinous or disastrous earthquakes followed by trains of after-shocks. The map shows very clearly that, during the last century, the [172]seismic activity was greatest in the Maritime Alps and the western Riviera—that is, in the very districts in which the recent mountain-making movements have been most conspicuous.[53]
In all these districts, Professor Mercalli distinguishes several well-marked seismic centres, to each of which he traces the origin of two or more earthquakes. In the districts with which we are at present concerned, those of the Alpes Maritimes and the western Riviera, the most important centres are [173]situated near Oneglia (in the sea), near Taggia, in the valleys of the Vesubia and Tinea (near Nice), and in the sea to the south of Nice. To the first of these centres belongs the disastrous earthquake of February 23rd, 1887, as well as its after-shocks on February 24th, May 20th, July 17th, and September 30th of the same year, also the ruinous earthquakes of 1612 and 1854, and several others of a lesser degree of intensity. All of these were longitudinal earthquakes, the axes of their meizoseismal areas being parallel to the neighbouring mountain-ranges. A few miles to the west of Oneglia lies the Taggia centre, with which were connected the disastrous earthquake of 1831, the violent earthquake of 1874, and other strong or very strong shocks. These were for the most part transversal earthquakes, their axes being perpendicular to those of the Oneglia centre.
Some of the strongest earthquakes in this region originated in a centre lying to the north of Nice in the valleys of the Vesubia and Tinea. Among them may be mentioned the ruinous earthquakes of 1494, 1556, 1564, and 1644, and probably also the disastrous earthquake of 1227. A fourth centre, and one of considerable interest, is that which lies at sea, a short distance to the south of Nice, and nearly along the continuation of the valleys above-mentioned. This is the secondary centre of the earthquake of 1887, and probably also of that of December 29th, 1554. It is occasionally in action apart from the Oneglia centre, as on November 27th, 1771, June 19th, 1806, and December 21st, 1861; but such shocks, though rather strong, never reach a high degree of intensity.
[174]Origin of the Earthquakes of 1887.—The most important feature in the principal earthquake of 1887 is its origination in two distinct foci, which are sometimes in action almost simultaneously, but more often separately. The earthquakes belonging to the two foci differ greatly in intensity and number, and the stronger part of the shock in 1887 originated in the focus associated with the more disastrous and more frequent earthquakes.
The existence of two foci would of course give rise to a meizoseismal area elongated in the direction of the line joining them. It is clear, however, that the Oneglia focus was also extended in the same direction; for, in the after-shock of February 24th, the isoseismals drawn by Professor Mercalli are parallel to this line; and this was also the case in the shock of March 11th. As both foci were under the sea, it is difficult to locate them with precision; but it seems very probable that they occupy portions of a submarine fault that runs parallel or nearly so to the Apennine axis between the meridians of Oneglia and Nice.
A brief period of preparation is a characteristic of the Riviera earthquakes. In 1887, two at least of the preliminary shocks on February 23rd (those of about 2 and 5 A.M.) originated in the Oneglia focus. At 6.20 A.M. the first and weaker movement took place in the western focus; and, a few seconds after the resulting vibrations reached the eastern focus, the second and greater slip took place there. The occurrence of seismic sea-waves is probably evidence of the formation of a small, though sensible, fault-scarp in the same region. To relieve the additional stresses thus brought into action along the fault-surface, [175]numerous small slips took place in different parts, some as far to the west as the Nice focus, but the greater number probably within or close to the focus in the neighbourhood of Oneglia.
1. Bertelli, T.—"Osservazioni fatte in occasione di una escursione sulle Riviera Ligure di ponente dopo i terremoti ivi seguiti nell' anno 1887." Boll. Mens. dell' Oss. di Moncalieri, vol. viii., 1888, Nos. 6, 7, 8.
2. Charlon, E.—"Note sur le tremblement de terre du 23 février 1887." Bull. del Vulc. Ital., anno xiv., 1887, pp. 18-23.
3. Denza, F.—Alcune notizie sul terremoto del 23 febbraio 1887 (Turin).
4. Issel, A.—"Il terremoto del 1887 in Liguria." Boll. del R. Com. Geol. d'Italia, anno 1887, supplemento, pp. 1-207.
5. Mercalli, G.—I terremoti della Liguria e del Piemonte. (Naples, 1897, 146 pp.)
6. Oddone, E.—"I dati sismici della Liguria in rapporto alla frequenza ed alla periodicità." Boll. della Soc. Sismol. Ital., vol. ii., 1896, pp. 140-151.
7. Offret, A.—"Sur le tremblement de terre du 23 février 1887. Discussion des heures observés dans la zone épicentrale." Paris, Acad. Sci., Compt. Rend., vol. civ., 1887, pp. 1150-1153.
8. ——. "Tremblements de terre du 23 février 1887. Heures de l'arrivée des secousses en dehors de l'épicentre." Ibid., pp. 1238-1242.
9. Rossi, M.S. de.—"Relazione sui terremoti del febbraio 1887." Bull. del Vulc. Ital., anno xiv., 1887, pp. 5-17.
10. ——. "Bibliografia: Sul terremoto ligure del 23 febbraio 1887." Ibid., pp. 60-62, 107-112, 115-128.
11. Taramelli, T., and G. Mercalli.—"Il terremoto ligure del 23 febbraio 1887." Annali dell' Uff. Centr. di Meteor. e di Geodin., vol. viii., parte iv., 1888. (Roma, 298 pp.)
[176]12. Uzielli, G.—Le commozioni telluriche e il terremoto del 23 febbraio 1887 (Turin).
13. Nature, vol. xxxv., 1887, pp. 438, 462, 534-535; vol. xxxvi., 1887, pp. 4, 151-152.
14. Paris, Acad. Sci. Compt. Rend., vol. civ., 1887, pp. 556-557, 606-612, 634-635, 659-667, 744-745, 757-758, 759-760, 764-766, 822-823, 830-835, 884-890, 950-951, 1088-1089, 1243-1245, 1350-1352, 1416-1419; vol. cv., 1887, pp. 202-203; vol. cviii., 1889, p. 1189; vol. cix.; 1889, pp. 164-166, 272-274, 660.
[47] The above times and all others in this chapter are given in Rome mean time, which is 50m. earlier than Greenwich mean time.
[48] Professor Uzielli has also published a map of the isoseismal lines for the Italian part of the disturbed area.
[49] It seems doubtful whether this movement was connected with the earthquake. M. Offret does not include Nice in his list of observatories at which magnetographs were disturbed.
[50] This is the time given by M. Offret. According to M. Mascart, it should be 6h. 25m. 40s.
[51] In order to test the truth of this explanation, M. Moureaux suspended a bar of copper at the Parc Saint-Maur observatory by two threads in the same way as the horizontal force-magnet. The direction of this bar was also registered photographically, and it remained unmoved during the Verny earthquake of July 12th, 1889, and the Dardanelles earthquake of October 25th, 1889, while one or more of the magnets were disturbed. The experiment, however, was ineffective; for, in order that the magnet may rest in a horizontal position, its centre of gravity must be at unequal distances from the two points of support.
[52] The hour-marks in Fig. 38 refer to Paris mean time, and those in Fig. 39 to Genoa mean time.
[53] In the seventeenth century, the maximum seismic activity was manifested in the neighbourhood of Nice, and in the eighteenth century in Piedmont.
Although several years have elapsed since the occurrence of the greatest of Japanese earthquakes, the final report that will embody the labours of all its investigators is yet to be written. Several important contributions to it, however, have already been made. Professor Koto, in an admirable memoir, has traced the course of the great fault-scarp and discussed the origin of the earthquake; Professor Omori, with equal care and thoroughness, has investigated the unrivalled series of after-shocks; Mr. Conder studied the damaged buildings from an architect's point of view; Professor Tanakadate and Dr. Nagaoka devoted themselves to a re-determination of the magnetic elements of the central district,[54] while, by the compilation of his great catalogue of Japanese earthquakes during the years 1885-92, Professor Milne has provided the materials for a further analysis of the minor shocks that preceded and followed the principal earthquake.
The part of Japan over which the earthquake was [178]sensibly felt is shown in Fig. 41. The small black area in the centre is that in which the shock was most severe and the principal damage to life and property occurred. The other bands, more or less darkly shaded according to the greater or less intensity of the shock, will be referred to afterwards. Fig. 45 represents the meizoseismal area on a larger scale; and, as the greater part of it lies within the two provinces of Mino and Owari, the earthquake is generally known among the Japanese themselves as the Mino-Owari earthquake of 1891.
[179]More than half of the meizoseismal area occupies a low flat plain of not less than 400 square miles in extent. On all sides but the south, the plain, which is a continuation of the depression forming the Sea of Isé, is surrounded by mountain ranges, those to the west, north, and north-east being built up mainly of Palæozoic rocks, and those on the east side of granite. A network of rivers and canals converts what might otherwise have been unproductive ground into one of the most fertile districts in Japan. A great garden, as it has been aptly termed, the whole plain is covered with rice-fields, and supports a population of about 787 to the square mile—a density which is exceeded in only six counties of England. As a rule, the soil is a loose, incoherent, fine sand, with but little clayey matter; and it is, no doubt, to its sandy nature that the disastrous effects of the earthquake were largely due. In the northern half of the district, the meizoseismal area is much narrower, and here it crosses a great mountain-range running from south-west to north-east and separating the river-systems of the Japan sea from those of the Pacific. To the north, the meizoseismal area terminates in another plain, in the centre of which lies the city of Fukui, where the destructiveness of the earthquake was only inferior to that experienced in the provinces of Mino and Owari. There is also a detached portion of the area lying to the east of Lake Biwa, but it is uncertain whether the exceptional intensity there was due to the nature of the ground or to the occurrence of a secondary or sympathetic earthquake in its immediate neighbourhood.
The general plan of the geological structure of the central district is represented in Fig. 42. The thick line, partly continuous and partly broken, shows the course of the great fault, to the growth of which the earthquake chiefly owed its origin; while the thin continuous lines represent the changing direction of strike of the Palæozoic rocks which surround the Mino-Owari plain, and the arrowheads the direction of the dip. It will be seen that the direction of the strike forms an S-shaped curve, and it is clear that [181]the present torsion-structure of the district could not have been produced without the formation of many fractures at right angles and parallel to the lines of strike. Professor Koto points out that the regular and parallel valleys of the rivers Tokuno-yama, Neo, Mugi, and Itatori, indicated by broken lines in Fig. 42, have probably been excavated along a series of transverse fractures running from north-west to south-east; while fractures which are parallel to the line of strike may be responsible for the zigzag course of the valleys.
The great earthquake occurred at 6.37 A.M., practically without warning, and in a few seconds thousands of houses were levelled with the ground. Within the whole meizoseismal area there was hardly a building left undamaged. The road from Nagoya to Gifu, more than twenty miles in length, and formerly bordered by an almost continuous succession of villages, was converted into a narrow lane between two long drawn-out banks of débris. "In some streets," says Professor Milne, "it appeared as if the houses had been pushed down from the end, and they had fallen like a row of cards." Or, again, a mass of heaped-up rubbish might be passed, "where sticks and earth and tiles were so thoroughly mixed that traces of streets or indications of building had been entirely lost." At Gifu, Ogaki, Kasamatsu, and other towns, fires broke out after the earthquake. In Kasamatsu the destruction was absolutely complete; nothing was left but a heap of plaster, mud, tiles, and charred timbers. At Ogaki, not more than thirty [182]out of 8000 houses remained standing, and these were all much damaged. Within the whole district, according to the official returns, 197,530 buildings were entirely destroyed, 78,296 half destroyed, and 5,934 shattered and burnt; while 7,279 persons were killed, and 17,393 were wounded.
Next to buildings, the embankments which border the rivers and canals suffered the most serious damage, no less than 317 miles of such works having to be repaired. Railway-lines were twisted or bent in many places, the total length demolished being more than ten miles. In cuttings, twenty feet or more in depth, both rails and sleepers were unmoved; it was on the plains that the effects of the earthquake were most marked. The ground appeared as if piled up into bolster-like ridges between the sleepers, and in many places the sleepers had moved end-ways. When the line crossed a small depression in the general level of the plain, the whole of the track was bowed, as if the ground were permanently compressed at such places. "Effects of compression," says Professor Milne, "were most marked on some of the embankments, which gradually raise the line to the level of the bridges. On some of these, the track was bent in and out until it resembled a serpent wriggling up a slope.... Close to the bridges the embankments had generally disappeared, and the rails and sleepers were hanging in the air in huge catenaries."
The land area disturbed by the earthquake and the different isoseismal lines are shown in Fig. 41. The "most severely shaken" district, that in which [183]the destruction of buildings and engineering works was nearly complete, contains an area of 4,286 square miles, or about two-thirds that of Yorkshire. This is indicated on the map by the black portion. Outside this lies the "very severely shaken" district, 17,325 square miles in area, extending from Kobe on the west to Shizuoka on the east, in which ordinary buildings were destroyed, walls fractured, embankments and roads damaged, and bridges broken down. The third or "severely shaken" district contains 20,183 square miles; and in this some walls were cracked, pendulum clocks stopped, and furniture, crockery, etc., overthrown. Tokio and Yokohama lie just within this area. In the fourth region the shock was "weak," the motion being distinctly felt, but not causing people to run out-of-doors; and in the fifth it was "slight," or just sufficient to be felt. These two regions together include an area of 51,976 square miles.
Thus, the land area disturbed amounts altogether to 93,770 square miles—i.e., to a little more than the area of Great Britain. According to Professor Omori, the mean radius of propagation was about 323 miles, and the total disturbed area must therefore have been about 330,000 square miles, or nearly four times the area of Great Britain. Considering the extraordinary intensity of the shock in the central district, this can hardly be regarded as an over-estimate.
The isoseismal lines shown in Fig. 41 are not to be regarded as drawn with great accuracy; for there is no marked separation between the tests corresponding to the different degrees of the scale of intensity. The seismographs at Gifu and Nagoya [184]were thrown down within the first few seconds, and failed to record the principal motion. But a great number of well-formed stone lanterns and tombstones were overturned, and, from the dimensions of these, Professor Omori calculated the maximum horizontal acceleration necessary for overturning them at fifty-nine places within the meizoseismal area.[55] At five of these it exceeded 4000 millimetres per second per second, an acceleration equal to about five-twelfths of that due to gravity. Making use of these observations, Professor Omori has drawn two isoseismal lines within the central district, which are shown in Fig. 44. At every point of the curve marked 2, the maximum acceleration was 2000 millimetres per second per second, and of that marked 1, 800 millimetres per second per second. The dotted line within the curve marked 2 represents the boundary of the meizoseismal area, which, it will be observed, differs slightly from that given by Professor Koto (see Fig. 45). The difference, however, is apparently due to the standard of intensity adopted, Professor Koto's boundary agreeing rather closely with the curve marked 2 in Fig. 44.
Little has yet been made known with regard to the nature of the shock, and the published records of the accompanying sound are so rare that it seems as a rule to have passed unheard. The seismographs [185]at Gifu and Nagoya registered the first half-dozen vibrations, and were then buried beneath the fallen buildings. In the following table, the data from these two stations are therefore incomplete:—
| Gifu. | Nagoya. | Osaka. | Tokio (Imp. Univ.). | |
| Maximum horizontal motion | > 18 mm. | > 26 mm. | 30 mm. | > 35 mm. |
| Period of ditto | 2.0 secs. | 1.3 sec. | 1.0 sec. | 2.0 secs. |
| Maximum vertical motion | > 11.3 mm. | 6.2 mm. | 8 mm. | 9.5 mm. |
| Period of ditto | 0.9 sec. | 1.5 sec. | 1.0 sec. | 2.4 secs. |
If the period of the principal vibrations were known, the observations of Professor Omori on the overturning of bodies would enable us to determine the range of motion at different places. For instance, the maximum acceleration at Nagoya was found by these observations to be 2,600 millimetres per second per second, and if we take the period of the greatest horizontal motion to be the same as that of the initial vibrations—namely, 1.3 second, the total range (or double amplitude) would be 223 millimetres, or 8.8 inches. With the same period, and the maximum acceleration observed (at Iwakura and Konaki) of more than 4,300 millimetres per second per second, the total range would be greater than 14.5 inches.[56]
[186]In the meizoseismal area, many persons saw waves crossing the surface of the ground. At Akasaka, according to one witness, the waves came down the streets in lines, their height being perhaps one foot, and their length between ten and thirty feet. To the north of the same area, we are told that "the shoreline rose and fell, and with this rising and falling the waters receded and advanced." Even at Tokio, which is about 175 miles from the epicentre, the tilting of the ground was very noticeable. After watching his seismographs for about two minutes, Professor Milne next observed the water in an adjoining tank, 80 feet long and 28 feet wide, with nearly vertical sides. "At the time it was holding about 17 feet of water, which was running across its breadth, rising first on one side and then on the other to a height of about two feet." Still clearer is the evidence of the seismographs in the same city. Instead of a number of irregular waves, all the records show a series of clean-cut curves. The heavy masses in the horizontal pendulums were tilted instead of remaining as steady points. They were not simply swinging, for the period of the undulations differed from that of the seismograph when set swinging, and also varied in successive undulations. It was ascertained afterwards, by measurement with a level, that to produce these deflections, the seismograph must have been tilted through an angle of about one-third of a degree.
Direction of the Shock.—Shortly after the earthquake, Professor Omori travelled over the meizoseismal area and made a large number of observations on the directions in which bodies were overturned, taking care to include only those in which the [187]direction of falling would not be influenced by the form of the base, such as the cylindrical stone lanterns so frequently found in Japanese gardens. At some places these bodies fell in various directions, at others with considerable uniformity in one direction. For instance, at Nagoya, out of 200 stone lanterns with cylindrical stems, 119 fell between west and south, and 36 between east and north; the numbers falling within successive angles of 15° being represented in Fig. 43. The mean direction of fall is W. 30° S., coinciding with that in which the majority of the lanterns were overturned. Similar observations were made at forty-two other places within and near the meizoseismal area, and the resulting mean direction for each such place in the Mino-Owari district is shown by short lines in Fig. 44, the arrow indicating the direction towards which the majority of bodies at a given place were overturned. It will be seen from this map that the direction of the earthquake motion was generally at right angles, or nearly so, to that of [188]the neighbouring part of the meizoseismal zone, and that on both sides of it, the majority of overturned bodies at each place fell towards this zone.
The times of the great earthquake and of sixteen minor shocks on October 28th and 29th and November 6th were determined at the Central Meteorological [189]Observatory at Tokio, and at either two or three of the observatories of Gifu, Nagoya, and Osaka, each of which is provided with a seismograph and chronometer. The after-shocks referred to originated near a point about 6 miles west of Gifu, and the difference between the distances of Tokio and Osaka from this point is 89½ miles, of Tokio and Nagoya 147 miles, and of Tokio and Gifu 165 miles. The mean time-intervals between these three pairs of places were 67, 111, and 128 seconds respectively; and these give for the mean velocity for each interval 2.1 kilometres (or 1.3 mile) per second. Thus there appears in these cases to be no sensible variation in the velocity with the distance from the origin.
As might be expected, an earthquake of such severity was recorded by magnetometers at several distant observatories. Disturbances on the registers of Zikawei (China), Mauritius, Utrecht, and Greenwich have been attributed to the Japanese earthquake, but the times at which they commenced are too indefinite to allow of any determination of the surface-velocity of the earth-waves to great distances from the origin.
As in all disastrous earthquakes, the surface of the ground was scarred and rent by the shock. From the hillsides great landslips descended, filling the valleys with débris; and slopes which were formerly green with forest, after the earthquake looked as if they had been painted yellowish-white. Innumerable fissures cut up the plains, the general appearance of the ground, according to Professor Milne, being "as if gigantic ploughs, each cutting a trench from 3 to 12 feet deep, had been dragged up and down the river-banks." But by far the most remarkable feature of [190]the earthquake was a great rent or fault, which, unlike the fissures just referred to, pursued its course regardless of valley, plain, or mountain. Although at first sight quite insignificant in many places, and some time hardly visible to the untrained eye, Professor Koto has succeeded in tracing this fault along the[191] [192]surface for a distance of forty miles, and he gives good reasons for believing that its total length must be not less than seventy miles.
The general character of the fault-scarp changes with the surface features. On flat ground, where the throw is small, it cuts up the soft earth into enormous clods, or makes a rounded ridge from one to two feet high, so that it resembles, more than anything else, [193]the pathway of a gigantic mole (Fig. 46). When the throw is considerable—and in one place it reaches from 18 to 20 feet—the fault-scarp forms a terrace, which from a distance has the appearance of a railway embankment (Fig. 47). Or, again, where the rent traverses a mountain ridge or a spur of hills, "it caused extensive landslips, one side of it descending considerably in level, carrying the forest with it, but with the trees complicatedly interlocked or prostrate on the ground."
At its southern end, the fault was seen for the first time crossing a field near the village of Katabira. The field was broken into clods of earth, and swollen up to a height of 5½ yards, while a great landslip had descended into it from an adjoining hill. A little farther to the north-west, the ground was sharply cut by the fault, the north-east side having slightly subsided and at the same time been shifted horizontally through a distance of 3¼ to 4 feet to the north-west Adjoining fields were formerly separated by straight mounds or ridges running north and south and east and west, and these mounds were cut through by the fault and displaced, as shown in Fig. 48. From this point the fault runs in a general north-westerly direction, the north-east side being always slightly lowered with respect to the other and shifted to the north-west. Near Seki it takes a more westerly direction, and continues so to a short distance east of [194]Takatomi, where the north side is lowered by five feet, and moved about 1¼ feet to the west. At the north end of Takatomi, a village in which every house was levelled with the ground, the fault is double, and the continuous lowering towards the north has converted a once level field into sloping ground. At this point, the small river Toba, flowing south, is partially blocked by the fault-scarp, and an area of about three-quarters of a square mile, on which two villages stand, was converted into a deep swamp (Fig. 49), so that, as the earthquake occurred at the time of the rice-harvest, the farmers were obliged to cut the grain from boats. After passing Takatomi, the fault again turns to the west-north-west, but, the throw being small, it resembles here the track of an enormous [195]mole. At Uméhara it crosses a garden between two persimmon trees, appearing on the hard face of the ground as a mere line; but the trees, which were before in an east-and-west line, now stand in one running north and south, without being in the least affected by the movement (Fig. 50). From here to Kimbara, where the fault enters the Neo valley, the north side is always depressed and shifted westwards by about 6½ feet.
It was in the Neo valley that the supreme efforts of the earthquake were manifested. Landslips were so numerous that the greater part of the mountain slopes had descended into the valley, the whole appearance of which had changed. "Unfamiliar obstacles," remarks Professor Koto, "made themselves apparent, and small hills covered with forest had come into sight which had not been seen before." But the ground was not only lowered and shifted by the fault; it was permanently compressed, plots originally 48 feet in length afterwards measuring only 30 feet. In fact, "it appears," in the words of Professor Milne, "as if the whole Neo valley had become narrower."
A few miles after entering the Neo valley, the throw of the fault reaches its maximum at Midori. But instead of the relative depression of the east side, which prevails throughout the rest of the line, that side is here about 20 feet higher than the other. It is, however, shifted as usual towards the north, by about 13 feet; and this displacement is rendered [196]especially evident by the abrupt break in the line of a new road to Gifu (Fig. 47). That the east side has really risen is clear, for, a little higher up, the river has changed from a shallow rapid stream 30 yards wide into a small lake of more than twice the width, and so deep that a boatman's pole could not reach the bottom. At Itasho, about a mile north of Midori, both sides are nearly on the same level, the fault appearing like a mole's track; and seven miles farther, at Nagoshima, the east side is relatively depressed by more than a yard, and at the same time shifted about 6½ feet to the north.
At Nogo, the main Neo valley turns off at right angles to the east, and the fault continues its course up a side valley, the east side, with respect to the other, being continually depressed and shifted towards the north. It was traced by Professor Koto through Fujitani (Fig. 46), where there were many unmistakable evidences of the violence of the shock, as far as the eastern shoulder of Haku-san; and here, after following the fault for 40 miles, the lateness of the season compelled him to return. There can be no doubt, however, that it runs as far as Minomata; and it is probable, from the [197]linear extension of the meizoseismal area, that it does not entirely die out before reaching the city of Fukui, 70 miles from its starting-point at Katabira.
For some hours after the earthquake, shocks were so frequent in the meizoseismal area that the ground in places hardly ever ceased from trembling. Without instrumental aid, detailed record was of course impossible; but fortunately the buried seismographs at Gifu and Nagoya were uninjured, and in about seven hours both were once more in working order. To the energy by which this result was accomplished, we owe our most valuable registers of the after-shocks of a great earthquake.
Until the end of 1893—that is, in little more than two years—the total number of shocks recorded at Gifu was 3,365, and at Nagoya 1,298. None of these approached the principal earthquake in severity. Nevertheless, of the Gifu series, 10 were described as violent and 97 strong; while of the remainder, 1,808 were weak, 1,041 feeble, and 409 were sounds alone without any accompanying shock. The slight intensity of most of the shocks is also evident [198]from the inequality in the numbers recorded at Gifu and Nagoya, from which it appears that nearly two-thirds were imperceptible more than about 25 miles from the chief origin of the shocks. Only 70 of the after-shocks during the first two years were registered at Osaka, and not more than 30 at Tokio.
Distribution of After-shocks in Time.—The decline in frequency of the after-shocks was at first extremely rapid, the numbers recorded at Gifu during the six days after the earthquake being 303, 147, 116, 99, 92, and 81, and at Nagoya 185, 93, 79, 56, 30, and 31; in fact, half of the shocks up to the end of 1893 occurred by November 23rd at Gifu, and by November 6th at Nagoya. The daily numbers at these two places are represented in Fig. 51, in which the crosses correspond to the numbers at Gifu, and the dots to those at Nagoya; and the curves drawn through or near the marks represent the average daily number of shocks from October 29th to November 20th. It will be seen that these curves are hyperbolic in form, the change from very rapid to very gradual decline in frequency taking place from five to ten days after the great earthquake. Fig. 52 illustrates the distribution in time of the after-shocks at Gifu to the end of 1893, the ordinates in these cases representing the number of shocks during successive months.[57]
[199]A similar rapid and then gradual decline in frequency characterises the strong and weak shocks recorded at Gifu. Of the ten violent shocks, only one occurred after the beginning of January 1892; and of the 97 strong shocks, only three after April 1892. But at the commencement of the series, feeble shocks (i.e., shocks that could just be felt) and earth-sounds without any accompanying movement were comparatively rare, and did not become really prominent until two months had elapsed. Of the 308 after-shocks recorded in 1893, none could be described as strong, only 10 were weak, while 263 were feeble shocks and 35 merely earth-sounds.
The last two diagrams show at a glance that the decline in frequency of after-shocks is very far from being uniform. Some of the fluctuations are due to the occurrence of exceptionally strong shocks, each of which is followed by its own minor train of after-shocks.[58] Others seem to be periodic, and possibly owe their origin to external causes unconnected with the earthquake.[59]
[200]Method of representing the Distribution of After-shocks in Space.—The maps in Figs. 54-57 show the distribution of the after-shocks in space during four successive intervals of two months each. They are founded on Professor Milne's great catalogue of Japanese earthquakes, which give, among other data, the time of occurrence and the position of the epicentre for every shock until the end of 1892. For the latter purpose, the whole country is divided by north-south and east-west lines into numbered rectangles, each one-sixth of a degree in length and breadth; and the position of an epicentre is denoted by the number of the rectangle in which it occurs. The area included within the maps is bounded by the parallels 34° 40' and 36° 20' lat. N., and by the meridians 2° 10' and 3° 50' long. W. of Tokio, so that ten rectangles adjoin each side of the map. The number of epicentres lying within each rectangle having been counted, curves are then drawn through the centres of all rectangles containing the same number of epicentres, or through points which divide the line joining the centres of two rectangles in the proper proportion. Taking, for example, the curve marked 5, if the numbers in two consecutive rectangles are 3 and 7, the curve bisects the line joining their centres; if the numbers are 1 and 6, the line joining their centres is divided into five equal parts, and the curve passes through the first point of division reckoned from the centre of the rectangle in which six epicentres are found. Thus the meaning of the curve marked, say, [201]5 may be stated as follows:—If any point in the curve be imagined as the centre of a rectangle whose sides are directed north-south and east-west, and are respectively one-sixth of a degree of latitude and longitude in length; then the number of epicentres within this rectangle is at the rate of 5 for the time considered.
Preparation for the Great Earthquake.—At first sight, there appears to have been but little direct preparation for the great earthquake. Except for a rather strong shock on October 25th, at 9.14 P.M., it occurred without the warning of any preliminary tremors. But a closer examination of the evidence shows, as we should indeed expect, that there was a distinct increase in activity for many months beforehand. The region had become "seismically sensitive." Of the hundred rectangles included in the maps in Figs. 53-57, there are thirteen lying along the meizoseismal area of the earthquake of 1891, in which nearly all the after-shocks originated. During the five years 1885-89, 53 out of 125 earthquakes (or 42 per cent.) had their epicentres lying within the thirteen rectangles; or, in other words, the average frequency in one of the rectangles of the meizoseismal area was five times as great as in one of those outside it. In 1890 and 1891 (until October 27th), the percentage in the thirteen rectangles rose to 61, and the average frequency in one of them to ten times that of one of the exterior rectangles.
The curves in Fig. 53 illustrate the distribution of epicentres during the latter interval. It will be seen that they follow roughly the course of the meizoseismal area southwards to the Sea of Isé, and that to the south-east they continue for several miles the short [202]branch of the meizoseismal area which surrounds the southern end of the fault-scarp.
Thus, the preparation for the great earthquake is shown, first, by the increased frequency of earthquakes originating within its meizoseismal area; and, secondly, by the uniformity in the distribution of epicentres throughout the same region, the marked [203]concentration of effort which characterises the after-shocks being hardly perceptible during the years 1890-91.
Distribution of After-shocks in Space.—We have seen that the after-shocks were subject to a fluctuating decline in frequency, rapid at first, and more gradual afterwards. It is evident, from Figs. 54-57, that a [204]similar law governs the area within which the after-shocks originated. During the first two months, epicentres occur over nearly the whole of the meizoseismal area, but afterwards they are confined to a smaller district, which slowly, though not continually, decreases in size.
[205]The most important feature in the distribution of the epicentres is the central region of extraordinary activity; but there are also districts of minor and more short-lived activity near the three extremities of the meizoseismal band. The seat of chief seismic action shifts slightly from one part to another of the epicentral region, especially about the end of 1891, as [206]will be seen by comparing the innermost curves of Figs. 54 and 55. Thus, with the decline in frequency of the after-shocks and the decrease in their sphere of action, there took place concurrently a gradual but oscillating withdrawal of that action to a more or less central region of the fault.
[207]Sound Phenomena of After-shocks.—While comparatively few observers seem to have noticed any noise with the principal earthquake, many of the after-shocks were accompanied by sounds. Professor Omori describes them as belonging to two types. They were either rushing feeble noises like that of wind, or loud rumbling noises like those of thunder, the discharge of a gun, or the fall of a heavy body. In the Neo valley, sounds of the second type were most frequent and distinct, but they either occurred without any shock at all, or the attendant tremor was very feeble; while, on the other hand, severe sharp shocks were generally unaccompanied by distinctly audible sounds.
It is remarkable, also, that sounds were less frequently heard with the early than with the later after-shocks. In November 1891, the percentage of audible shocks was 17, and from December to the following April always lay between 10 and 12. In May the percentage suddenly rose to 39, and until the end of 1892 was always greater than 32, while in November 1892, it rose as high as 49. This, of course, agrees with Professor Omori's observation that sounds attended feeble shocks more often than strong ones.
The distribution of the audible after-shocks in space is shown in Fig. 58. These curves are drawn in the same way as those in Figs. 53-57, but they represent the percentages, not the actual numbers, of shocks accompanied by sound. It will be noticed that all three groups of curves lie along the meizoseismal area, or the continuation of the south-east branch; while the axis of the principal group of curves lies to the west of the central regions in which most after-shocks originated.

Fig. 58.—Distribution of Audible After-shocks in Space (November 1891-December 1892). (Davison.)ToList
[208]The explanation of these peculiarities is no doubt connected with the comparative inability of the Japanese people to perceive the deep sounds which in Europe are always heard with earthquake shocks. The sounds are rarely heard by them more than a [209]few miles from the epicentre.[60] We may therefore conclude that slight after-shocks originated nearer the surface than strong ones, that the mean depth of the foci decreased with the lapse of time, and that the axes of the systems of curves in Fig. 58 mark out approximately the lines of the growing faults. The separation of the two westerly groups of curves appears to show that the main branch of the meizoseismal area is connected with a fault roughly parallel to that traced by Professor Koto, but of which no scarp (if it existed) could be readily distinguished among the superficial fissures produced by the great shock.
So great and sudden a displacement as occurred along the fault-scarp could hardly take place without affecting the stability of adjoining regions of the earth's crust, and we should naturally expect to find a distinct change in their seismic activity shortly after October 28th. In Fig. 59 two such regions are shown, bounded by the straight dotted lines. The district in which the principal earthquake and its after-shocks originated is enclosed within the undulating dotted lines. The continuous lines inside all three districts are the curves corresponding to 10 and 5 epicentres for the years 1885-92. Not far from the axes of the outer groups of curves there are [210]probably transverse faults, approximately parallel to the great fault-scarp and the main branch of the meizoseismal band, and distant from them about 45 and 55 miles respectively.
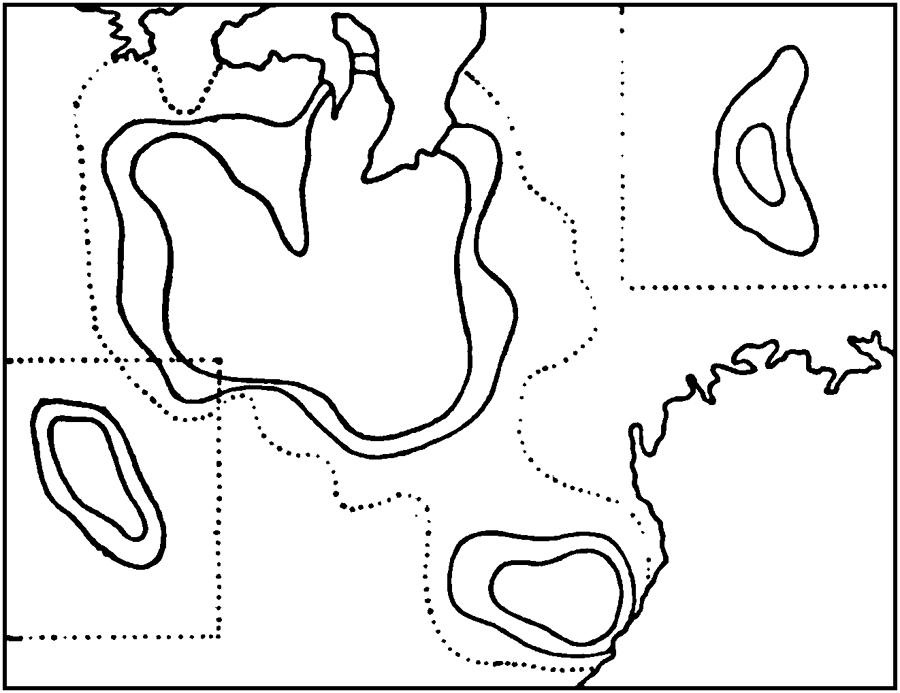
Fig. 59.—Map of Adjoining Regions in which Seismic Activity was affected by the Great Earthquake. (Davison.)ToList
In the district represented in the north-east corner of Fig. 59, 29 earthquakes originated between January 1st, 1885, and October 27th, 1891, and 30 between October 28th, 1891, and December 31st, 1892, 7 of the latter number occurring in November 1891. In the south-west district, the corresponding figures before and after the earthquake are 20 and 36, 8 of the latter occurring in November 1891. Thus, in the north-east district, for every shock in the interval before the earthquake there were six in an equal time afterwards, and at the rate of 10 during November 1891; and in the south-west district, for every shock before the earthquake there were 10 afterwards, and at the rate of 16 during November 1891.
Now, it is unlikely that the gradual increase of stress should be so nearly proportioned everywhere to the prevailing conditions of resistance as to give rise to a marked and practically simultaneous change in seismic activity over a large area; whereas the [211]paroxysmal occurrence of a strong earthquake might alter the surrounding conditions with comparative rapidity, and so induce a state of seismic excitement in the neighbourhood. It therefore seems very probable that the increased activity in the two districts here described was a direct consequence of the occurrence of the great earthquake.
The preponderance of preliminary earthquakes within the meizoseismal area and the outlining of the fault-system by the frequency curves of 1890-91 (Fig. 53) point to the previous existence of the originating fault or faults, and to the earthquake being due, not to the formation of a new fracture, as has been suggested, but to the growth of an old fault.
The last severe earthquake in the Mino-Owari plain occurred in 1859, so that for more than thirty years there had been but little relief to the gradually increasing stresses. Now, the distribution of stress must have been far from uniform throughout the fault-system, and also the resistance to displacement far from proportional to the stresses at different places. At certain points, therefore, the effective stress would be greater than elsewhere, and it would be at these points that fault-slips would first occur. Such slips tend to remove the inequalities in effective stress. Thus, the function of the slight shocks of 1890 and 1891 was, briefly, to equalise the effective stress over the whole fault-system, and so to clear the way for one or more great slips throughout its entire length.
As to which side of the fault moved during the [212]great displacement, or whether both sides moved at once, we have no direct evidence but as regards the neighbourhood of Midori, and there the conditions were exceptional. Professor Koto thinks that it was probably the rock on the north-east side that was generally depressed and always shifted to the north-west But the disturbance in reality seems to have been more complicated. That this was the case, that displacement occurred along more than one fault, is probable from the branching of the meizoseismal area, the isolation of the audibility curves of the after-shocks (Fig. 58), and the sudden increase in seismic activity both to the north-east and south-west of the epicentre. The detached portion of the meizoseismal area near Lake Biwa may also point to a separate focus. The whole region, indeed, was evidently subjected to intense stresses, and the depression on the north-east side of the fault-scarp can hardly fail to have been accompanied by other movements, especially along a fault running near the western margin of the main branch of the meizoseismal area.
The later stages of the movements are somewhat clearer. From a study of the after-shocks, we learn that the disturbed masses began at once to settle back towards the position of equilibrium. At first the slips were numerous and took place over the whole fault-system, but chiefly at a considerable depth, where no doubt the initial displacement was greatest. After a few months, stability was nearly restored along the extremities of the faults; slips were confined almost entirely to the central regions, while a much larger proportion of them took place within the superficial portions of the faults.
[213]The official records bring down the history to the end of 1893. Since that time more than one strong shock has been felt in the Mino-Owari plain; but the stage of recovery from the disturbances of 1891 is probably near its end, and we seem rather to be entering on a period in which the forces are once more silently gathering that sooner or later will result in another great catastrophe.
1. Conder, J.—"An Architect's Notes on the Great Earthquake of October 1891." Japan Seismol. Journ., vol. ii., 1893, pp. 1-91.
2. Davison, C.—"On the Distribution in Space of the Accessory Shocks of the Great Japanese Earthquake of 1891." Quart. Journ. Geol. Soc., vol. liii., 1897, pp. 1-15.
3. —— "On the Effect of the Great Japanese Earthquake of 1891 on the Seismic Activity of the Adjoining Districts." Geol. Mag., vol. iv., 1897, pp. 23-27.
4. —— "On the Diurnal Periodicity of Earthquakes." Phil. Mag., vol. xiii., 1896, pp. 463-476, especially pp. 466-468.
5. —— "On Earthquake-Sounds." Phil. Mag., vol. xlix., 1900, pp. 31-70—especially pp. 49-53, 60-61.
6. Koto, B.—"The Cause of the Great Earthquake in Central Japan, 1891." Journ. Coll. Sci. Imp. Univ. Japan, vol. v., 1893, pp. 295-353.
7. Masato, H.—"Report on Earthquake Observations in Japan." Cent. Meteor. Obs. of Japan (Tokio, 1892), pp. 16-18, 41, and map 30.
8. Milne, J.—"A Note on the Great Earthquake of October 28th, 1891." Japan Seismol. Journ., vol. i., 1893, pp. 127-151; Brit. Assoc. Rep., 1892, pp. 114-128.
9. —— "A Catalogue of 8,331 Earthquakes recorded in Japan between 1885 and 1892." Japan Seismol. Journ., vol. iv., 1895, pp. 1-367—especially pp. 134-234, 303-353.
10. —— "On Certain Disturbances in the Records of Magnetometers and the Occurrence of Earthquakes." Brit. [214]Assoc. Rep., 1898, pp. 226-251—especially pp. 227, 232, 234, 241, and 245.
11. Milne, J., and W.K. Burton.—"The Great Earthquake in Japan." Journ. Coll. Sci. Imp. Univ. Japan, vol. v., 1893, pp. 295-352.
12. Omori, F.—"On the After-shocks of Earthquakes." Journ. Coll. Sci. Imp. Univ. Japan, vol. vii., 1894, pp. 111-200; abstract in Japan Seismol. Journ., vol. iii., 1894, pp. 71-80.
13. —— "A Note on the Great Mino-Owari Earthquake of October 28th, 1891." Pub. Earthquakes Inves. Com. in Foreign Languages, No. 4, Tokio, 1900, pp. 13-24.
14. —— "Sulla velocità di propagazione e sulla lunghezza delle onde sismiche." Ital. Soc. Sismol. Boll., vol. i., 1895, pp. 52-60—especially pp. 52-57.
15. —— "Sull' intensità e sull' ampiezza del movimento nel gran terremoto giapponese del 28 ottobre 1891." Ital. Soc. Sismol. Boll., vol. ii., 1896, pp. 189-200.
16. —— "Note on the After-shocks of the Mino-Owari Earthquake of Oct. 28th, 1891." Pub. Earthquakes Inves. Com. in Foreign Languages, No. 7, Tokio, 1902, pp. 27-32.
17. —— "Note on the relation between Earthquake Frequency and the Atmospheric Pressure." Tokyo Phys.-Math. Soc. Reports, vol. ii., 1904, No. 8.
18. Tanakadate, A., and H. Nagaoka. "The Disturbance of Isomagnetics attending the Mino-Owari Earthquake of 1891." Journ. Coll. Sci. Imp. Univ. Japan, vol. v., 1893, pp. 149-192.
[54] I have not referred to the results of this survey, for, though changes in all the magnetic elements (especially in horizontal intensity) have taken place between 1887 and 1891-92, these changes cannot be ascribed with confidence to the earthquake in the absence of a thorough knowledge of the secular variation.
[55] From the formula a = xg / y, where a is the maximum horizontal acceleration, g the acceleration due to gravity, y the height of the centre of gravity, and x its horizontal distance from the edge about which the body was overturned.
[56] These estimates are made, on the supposition of simple harmonic motion, from the formula 2a = αt² / (2π²), where 2a is the total range or double amplitude, a the maximum acceleration, and t the period of the vibration.
[57] Professor Omori finds that the mean daily number of earthquakes y during the month x (reckoned from November 1891) may be approximately represented by the equation—
y = 16.9 / (x + 0.397);
or, taking the semi-daily earthquake numbers during the five days between October 29th and November 2nd, 1891, by the equation—
y = 440.7 / (x + 2.314),
where y denotes the number of earthquakes observed during the twelve hours denoted by x, the time being measured from the first half of October 29th. It is interesting to notice that, taking account of the mean annual frequency of earthquakes in ordinary years, the number of shocks observed at Gifu during the two years 1898-99 should, according to the latter formula, be 163; the actual number recorded was 160.
[58] The last violent shock before the end of 1893 occurred on September 7th, 1892, and its effects on the frequency of after-shocks is shown by the daily numbers recorded at Gifu during the first fortnight in September. These are—2, 2, 2, 3, 5, 5, 28 (on September 7th), 8, 8, 5, 4, 3, 2, 4, 3.
[59] The periodicity of after-shocks is discussed in the papers numbered 4, 12, 16, and 17 at the end of this chapter. In these, the existence of diurnal and other periods is clearly established. Professor Omori also shows that the mean daily barometric pressure is subject to fluctuations with maxima occurring on an average every 5½ days, and that earthquakes are least frequent on the days of the barometric maxima and minima, and more frequent in the days immediately preceding and following them.
[60] Of the Japanese earthquakes of 1885-92 originating beneath the land, twenty-six per cent. were accompanied by a recorded sound; but less than one per cent. of those originating beneath the sea and not more than ten miles from the coast.
Among the earthquakes described in this volume, the Hereford and Inverness earthquakes hold but a minor place. The damage to buildings, though unusual for this country, was slight when compared with that caused by the preceding shocks; there was no loss of life, not a single person was injured by falling masonry. The interest of the earthquakes lies entirely in the detailed study rendered possible by numerous observations of the shock and sound,[61] and in the bearing of this evidence on the general theory of the origin of earthquakes.
The principal earthquake of this series occurred at 5.32 A.M. on December 17th, and was preceded by at least nine minor shocks (the first of which was felt at about 11 or 11.30 P.M. on December 16th), and followed by two others on the same day, and by a third and last on July 19th, 1897. The accounts [216]of these preliminary movements will be found on a later page, as their bearing will be more fully apparent after the discussion of the principal shock.
On the map in Fig. 60, the continuous curves represent isoseismal lines corresponding to the degrees 8, 7, 6, 5, and 4 of the Rossi-Forel scale. The isoseismal 8, which is the most accurately drawn of the series, is [217]an elongated oval, 40 miles long, 23 miles broad, and containing an area of 724 square miles. The longer axis is directed W. 44° N. and E. 44° S. Within this curve, there are 73 places where buildings are known to have been damaged, 55 places being in Herefordshire, 17 in Gloucestershire, and one in Worcestershire.
The most important damage occurred in the city of Hereford, which, in 1901, contained 4,565 inhabited houses. Here, no fewer than 218 chimneys had to be repaired or rebuilt. The Cathedral was slightly injured. The finial of a pinnacle of the Lady Chapel was thrown down, a fragment of a stone fell from one of the arches in the south transept, and the three pinnacles of the western front were fractured. Several churches suffered to a similar extent, while, at the Midland Railway Station, all the seven chimney-stacks were shattered. At Dinedor, Fownhope, Dormington, Withington, and a few other villages, the damage was also relatively greater than elsewhere, these places all lying within a small oval about 8½ miles long, which surrounds, not the centre, but rather the north-west focus, of the isoseismal 8.
The isoseismal 7, which includes places where the shock was strong enough to overthrow ornaments, vases, etc., is also very nearly an ellipse, whose axes are 80 and 56 miles in length, and whose area is 3,580 square miles. Its longer axis, running from W. 42° N. to E. 42° S., is practically parallel to that of the inner curve. Next in succession comes the isoseismal 6, surrounding those places where the shock was strong enough to make chandeliers, pictures, etc., swing; but, as most of the observers seem to have slept in darkened rooms, the number of [218]determining points for this curve is less than usual, and its course is therefore laid down with a somewhat inferior degree of accuracy. The error, however, is probably small, and we may therefore regard the isoseismal 6 as another ellipse, 141 miles long, 116 miles broad, and containing an area of 13,000 square miles. Its longer axis is again nearly parallel to those of the preceding isoseismals.
The next two isoseismals are nearly circular in form. It will be noticed that large portions of them, and especially of the isoseismal 4, traverse the sea. In these parts, the paths of the curves are to some extent conjectural. In drawing them, the chief guides are their trend before leaving the land and the known intensity along the neighbouring coastlines. The isoseismal 5 bounds the area within which the shock was perceptible as a sensible displacement and not merely a quiver. Its dimensions are 233 miles from north-west to south-east, and 229 miles from south-west to north-east, and its area 41,160 square miles. The isoseismal 4, which includes places where the shock was strong enough to make doors, windows, etc., rattle, is 356 miles from north-west to south-east, and 357 miles from south-west to north-east, and 98,000 square miles in area; its centre coincides nearly with that of the small oval area in the neighbourhood of Hereford, where the damage to buildings was relatively greater than elsewhere.
Outside the isoseismal 4, the earthquake was observed at several places. The shock was certainly felt at Middlesbrough, 12½ miles from the curve, and probably at Killeshandra (in Ireland), 65 miles distant. Thus, if we consider the boundary of the [219]disturbed area to coincide with the isoseismal 4, its area would be 98,000 square miles, or 1-2/3 that of England and Wales; if it were a circle concentric with the isoseismal 4, and passing through Middlesbrough, its area would be 115,000 square miles, or nearly twice that of England and Wales; while, if it passed through Killeshandra, its area would be 185,000 square miles, or more than three times the area of England and Wales.[62]
Position of the Originating Fault.—The form, directions, and relative positions of the isoseismal lines furnish important evidence with regard to the originating fault. We conclude in the first place that its mean direction is parallel to the longer axes of the three innermost isoseismal lines—that is, north-west and south-east, or, more accurately, W. 43° N. and E. 43° S.[63] In this case, the elongated forms of the isoseismal lines cannot be attributed to variations in the nature of the surface rocks. The district embraced contains about 13,000 square miles, and it is improbable that the axes of the three isoseismals should retain their parallelism over so large an area, if these variations had any considerable effect. Moreover, in the same district, an earthquake occurred in 1863, whose meizoseismal area was elongated from [220]north-east to south-west, or almost exactly perpendicular to the direction in 1896.
Secondly, it will be noticed (Fig. 60) that the isoseismal lines are not equidistant from one another. On the north-east side, they are separated by distances of 20, 34, 55, and 51 miles; and on the south-west side by distances of 13¼, 25, 60, and 77 miles. It follows from this that the fault-surface must hade or slope towards the north-east; for, near the epicentre, the intensity is greatest and dies out more slowly on the side towards which the fault hades.
If we could ascertain any one place through which the fault passed, its position would thus be completely determined. Unfortunately, there is no decisive evidence on this point. There are, however, several places to the south-west of Hereford where the intensity of the shock was distinctly less than in the surrounding district, and it is possible that this was due to their neighbourhood to the fault-line (see p. 135). If so, the originating fault must have extended from a point about a mile and a half west of Hereford for a distance of about 16 miles to the south-east; and a fault in this position would certainly satisfy all the details of the seismic evidence.
Throughout the disturbed area, considerable variations were observed in the nature of the shock. These changes were due to the mere size of the focus, to its elongated form and, as will be seen, to its discontinuity, and also to the distance of the place of observation from the epicentre.
At places near the epicentre, rapid changes in the [221]direction of the shock were observed owing to the large angle subtended by the focus; while, at considerable distances, this angle being small, the changes of direction were imperceptible. A further variation with the distance was an increase in the period of the vibrations. Close to the epicentre, the general impression was that of crossing the wake of a steamer in a very short rowing-boat, or of riding in a carriage without springs. At distances of a hundred miles or more, the movement is described as being of a pleasant, gentle, undulating character, like that felt during the rocking of a ship at anchor or in a carriage with well-appointed springs.
The most remarkable feature of the shock, however, was its division into two distinct parts or series of vibrations, separated by an interval, lasting two or three seconds, of absolute rest and quiet. And this was no mere local phenomenon. With the exception of a narrow band that will be referred to presently, records of the double shock come from nearly all parts of the disturbed area, even from districts so remote as the Isle of Man and the east of Ireland. The two parts differed in intensity, in duration, and in the period of their constituent vibrations. For instance, at Oaklands (near Chard), a shivering motion was first felt, and then, after about three or four seconds, a distinct rocking from side to side. At Exeter, there was a sudden tremor lasting about two seconds, followed, after two or three seconds, by another and more severe shaking lasting four or five seconds. Again, at West Cross (near Swansea), an undulatory movement for about four seconds was followed soon after by a tremulous shock. At Liverpool, the durations of the first part, interval, and [222]second part were respectively estimated at about six, two, and four seconds.
As a first result of the observations, then, it appears that in the south-east half of the disturbed area, the second part of the shock was the stronger, of greater duration and consisted of longer-period vibrations (as at a, Fig. 61); while, in the north-west half, the same features characterised the first part of the shock (b, Fig. 61). A closer examination of the records shows, however, that the boundary between the two portions of the disturbed area was not a straight line, but slightly curved, the concavity facing the south-east. The broken line on the map (Fig. 60), which is hyperbolic in form, represents roughly the position of this curved boundary.[64]
Along this hyperbolic boundary-line, or rather within a narrow band of which it is the central line, the shock lost its double character, and was manifested as a single series of vibrations gradually [223]increasing in intensity and then dying away. Close to the edges of this band, careful observers were able to distinguish two maxima of intensity connected by a continuous series of tremors (c, Fig. 61). Thus, within the band, the two series of vibrations, which elsewhere were isolated, must have been superposed on one another; while, near the edges of the band, the concluding tremors of the first series overlapped the initial tremors of the second.
Origin of the Double Series of Vibrations.—The Hereford earthquake thus belongs to the same class as the Neapolitan, Andalusian, Charleston, and Riviera earthquakes. As in these cases, the hypothesis of a single focus is inadmissible. The division of the disturbed area into two regions of opposite relative intensity, duration, etc., is sufficient proof that a single series of vibrations was not duplicated by reflection or refraction, or by separation into longitudinal and transverse waves. It is equally conclusive against a repetition of the impulse within the same focus. We must therefore infer that the focus consisted of two nearly or quite detached portions arranged along a north-west and south-east line, and that the impulse at the north-west focus was the stronger of the two. The only question that remains to be decided is whether the impulses at the two foci were simultaneous or not.
Now, if the impulses occurred at the same instant, the waves from the two foci would travel with the same velocity, and would therefore coalesce along a straight band which would bisect at right angles the line joining the two epicentres. But we have already seen that this band is curved, and it thus follows that the two impulses were not simultaneous. Again, [224]since the concavity of the hyperbolic band faces the south-east, the waves from the north-west focus must have travelled farther than those from the south-east focus before the two met along the hyperbolic band; in other words, the impulse at the north-west focus must have occurred two or three seconds before the impulse at the other.
Position and Dimensions of the Two Foci.—There can be little doubt that the impulse at the north-west focus was responsible for the greater damage to buildings at Hereford, Dinedor, Fownhope, etc. The centre of its epicentral area must therefore lie about three miles south-east of Hereford. It is probable, also, that the corresponding centre of the other focus is similarly placed with respect to the south-east portion of the isoseismal 8—that is, about two or three miles north-east of Ross. These two points are eight or nine miles apart. Now, since, as we shall see, the mean surface-velocity of the earth-waves was about 3000 feet per second, and the mean duration of the quiet interval between the two series was 3½ seconds, the nearest ends of the two foci must have been separated by a distance of not less than two miles. Moreover, since the series of vibrations from the north-west or Hereford focus lasted a few seconds longer than that from the south-east or Ross focus, the former must have been about two miles longer than the latter, and we may therefore estimate their lengths at about eight and six miles respectively. Including the undisturbed intermediate portion, this would give a total length of focus of about 16 miles, a result we have already inferred from the dimensions of the isoseismal 8.
[225]Although no question was asked with regard to the direction of the shock, no fewer than 469 observers made notes on this point. As a general rule, their determinations are extremely rough, few referring to more than the eight principal points of the compass. Moreover, in any one place, the directions assigned to the shock are very varied. For instance, in the city and suburbs of Birmingham, eight observers give the direction along a north and south line, eight east and west, eleven north-west and south-east, and five north-east and south-west, while there are five other intermediate estimates. But, when these directions are plotted on a map of the district, it is seen at once that they are either nearly parallel or perpendicular to the roads in which the observers were living; that is, the apparent direction of the shock was at right angles to one of the principal walls of the house. This, of course, is a result to be anticipated, for, whatever be the direction of the earthquake-motion, a house tends to oscillate in a plane perpendicular to one or other of its walls.
It is extraordinary to how great a distance the direction of the shock is perceptible. Records come from Brighton (137 miles from the epicentre), Maldon in Essex (144 miles), Harrogate (147 miles), Douglas in the Isle of Man (167 miles), Dublin (176 miles), and Baltinglass in Co. Wicklow (180 miles).
Nevertheless, whatever the distance may be, the sense of direction must be most perceptible in those houses whose principal walls are at right angles [226]to the true direction of the earthquake-motion, and we should therefore expect to find the observations of direction most frequently made in such houses, or in others which approximate to this situation. Thus, the average of all the observations within a fairly small area should give a result not very far from the true direction of the shock; and, the smaller the area and the farther from the epicentre, the more reliable should be the result. Now, in Birmingham the mean direction of the shock is E. 39° degrees N., which differs only by 2° degrees from the line joining the city to the epicentre; in London it is E. 21° degrees S., the difference being again 2° degrees. In other cases, the observations from different counties are grouped together, and the mean direction is taken to correspond to the centre of the county. Yet, even then, there is often a close agreement between the mean direction of the shock and the direction of the county-centre from the epicentre; the difference being not more than two or three degrees in the counties of Buckingham, Devon, Stafford, Warwick, and York. In other cases, where the deviation exceeds this amount, either the number of observations is small or the county is near the epicentre and so subtends a large angle.
Two results of some importance follow from this analysis: (1) that while, with a few isolated observations, the "method of directions" is almost sure to fail, with a large number of observations closely grouped, the position of the epicentre may be determined with a fair approach to accuracy; and (2) that, at any rate outside a radius of forty miles, the earth-waves travelled in approximately straight lines outwards from the epicentre.
[227]Coseismal lines were defined by Mallet as long ago as 1849, but, owing to the difficulty of ascertaining the correct time, they have so far been of little service in the investigation of earthquakes. In the case of the Hereford earthquake, the distances traversed by the earth-waves are small; but, on the other hand, the time-records are numerous and frequently trustworthy to the nearest minute. Rejecting all estimates earlier than 5.32 A.M., and later than 5.36, as well as a number at 5.35, there remain fairly good observations from 381 places, and exceptionally accurate ones from 33 places. The latter were obtained from signalmen and other careful observers who were in possession of Greenwich time, or who compared their watches shortly afterwards with well-regulated watches.
With evidence so abundant, a new method of drawing coseismal lines becomes possible. According to this method, each place of observation is indicated on the map by a mark corresponding to the particular minute recorded. If the records were quite correct, there would be a central area occupied by the marks corresponding to 5.32 A.M., surrounded by a series of zones in which the times were respectively 5.33, 5.34, and 5.35. The curves separating these zones would be coseismal lines corresponding to the times 5.32½, 5.33½, and 5.34½.
Owing, however, to the inevitable inaccuracy of all the time-records, these different zones intrude on one another, and the coseismal lines have therefore to be drawn about half-way through the [228]overlapping regions, special weight being attributed to the apparently more accurate observations.
The coseismal lines obtained in this manner are represented by the continuous curves in Fig. 62. The isoseismals, which are added for the sake of comparison, are indicated by the dotted lines. It will be seen that the coseismal lines are elongated in the same direction as the isoseismals, but to a less extent, and this no doubt is due to the fact that the epoch selected by the majority of observers was [229]one not far from, and slightly preceding, that of the maximum intensity of the shock.
Now, the average distance between the two inner coseismals is 32¾ miles, between the two outer ones (so far as drawn) 35-1/6 miles, and between the first and third 67-1/6 miles. The mean surface-velocity between the two inner coseismals is therefore 2,882 feet per second, and between the two outer ones 3,095 feet per second. There is thus an apparent increase in the velocity with the distance, but the accuracy of the coseismal lines is unequal to establishing this as a fact. The mean surface-velocity of 2,955 feet per second between the first and third coseismals is probably, however, the most accurate estimate of the surface-velocity yet made in a slight earthquake.
Nature of the Sound.—The sound which accompanied the shock was of the same character as that heard during all great earthquakes. It is often described in such terms as a deep booming noise, a dull heavy rumble, a grating roaring noise, or a deep groan or moan; more rarely as a rustling or a loud hissing rushing sound. As a rule, it began faintly, increased gradually in strength, and then as gradually died away; and this no doubt is the reason why it sometimes appeared as if an underground train or waggon were approaching quickly, rushing beneath the observer, and then receding in the opposite direction. Occasionally, the sound was very loud, being compared to the noise of many traction-engines heavily laden passing close at hand, [230]or to a heavy crash or peal of thunder. But its chief characteristic was its extraordinary depth, as if it were almost too low to be heard. According to one observer, it was a low rumbling sound, much lower than the lowest thunder; and another compared it to the pedal notes of a great organ, only of a deeper pitch than can be taken in by the human ear, a noise more felt than heard. It will be seen presently how the sound, from its very depth, was inaudible to many persons.
A few observers described the sound in terms like those quoted above, but by far the larger number compared it to some more or less well-known type, and in many cases the resemblance was so close that the observer at first attributed it to the object of comparison. The descriptions, which present great varieties in detail, may be classified as follows: (1) One or several traction-engines passing, either alone or heavily laden, sometimes driven furiously past; a steam-roller passing over frozen ground or at a quicker pace than usual; heavy waggons driven over stone paving, on a hard or frosty road, in a covered way or narrow street, or over hollow ground or a bridge; express or heavy goods trains rushing through a tunnel or deep cutting, crossing a wooden bridge or iron viaduct, or a heavy train running on snow; the grating of a vessel over rocks, or the rolling of a lawn by an extremely heavy roller; (2) a loud clap or heavy peal of thunder, sometimes dull, muffled or subdued, but most often distant thunder; (3) a moaning, roaring, or rough, strong wind; the rising of the wind, a heavy wind pressing against the house; the howling of wind in a chimney, a chimney or [231]oil-factory on fire; (4) the tipping of a load of coal, stones, or bricks, a wall or roof falling, or the crash of a chimney through the roof; (5) the fall of a heavy weight or tree, the banging of a door, only more muffled, and the blow of a wave on the sea-shore; (6) the explosion of a boiler or cartridge of dynamite, a distant colliery explosion, distant heavy rock-blasting and the boom of a distant cannon; (7) sounds of a miscellaneous character, such as the trampling of many men or animals, an immense covey of partridges on the wing, the roar of a waterfall, the passage of a party of skaters, and the rending and settling together of huge masses of rock.
The total number of comparisons made was 1,264. Of these, 45.4 per cent. refer to passing waggons, etc., 15.0 per cent. to thunder, 15.5 to wind, 3.9 to loads of stones falling, 2.7 to the fall of a heavy body, 7.2 to explosions, and 10.3 per cent. to miscellaneous sounds.
Generally, the sound adhered throughout to one of the types mentioned above, and, if it varied at all, varied only in intensity. At some places, however, the character of the sound was observed to change. For instance, one person described it as like the rumbling of a train going over a bridge, with a terrific crash, such as is heard in a thunderstorm at the instant when the shock was strongest, the rumbling dying away afterwards for some seconds.
Inaudibility of the Sound to some Observers.—The total number of observers who give a detailed account of the earthquake is 2,681, and, of these, 59 per cent. state that they heard the sound, 23 per [232]cent. give no information, while 18 per cent. distinctly say that they heard no sound; that is, roughly, out of every five observers, three heard the sound, one made no reference to it, and one failed to hear the sound.
In a few cases, no doubt, this failure was due to the distance of the observer, but this is far from being a complete explanation; for, in Herefordshire, six out of 179, and in Gloucestershire 17 out of 227, observers heard no sound. Nor is the peculiarity a local one, for at Clifton two out of five observers who were awake did not hear the sound, at Birmingham four out of 23, and in London, eight out of 18. Even in the same house, it would happen that one observer would hear a sound as of a heavily-laden traction-engine passing, while to another it was quite inaudible.
Again, a large number of observers who heard the sound expressly state that they were unconscious of any while the shock lasted. The noise at first resembled the approach of a steam-roller or traction-engine up the street, it became gradually louder, and then ceased more or less suddenly as the shock began; while, to others in the same places, the sound continued to grow in loudness until the strongest vibrations were felt.
Even when observers in the same place agreed in hearing the sound, it presented itself to them under different aspects. Thus, at Hereford, a crash or bomb-like explosion was noticed by some, but not by all, observers; at Ledbury, the sound according to one began like a rushing wind and culminated in a loud explosive report, another heard a noise like distant thunder, which ended when the shock began, while a third heard no sound at all. At places more [233]distant from the epicentre, the same diversity, both in character and intensity, is manifested. Thus, at Birmingham, the accounts refer on the one hand to the distant approach of a train and the rising of the wind, on the other to the reports of large cannons and to a noise as if tons of débris had been hurled against the wall of the house; at Bangor, to muffled thunder, wind through trees, and a loud rumbling sound.
The first explanation of these apparent anomalies which presents itself is inattention on the part of the observers; but it is one that will not bear examination, though it may apply in some cases. The sound is too loud, at any rate near the epicentre, to escape notice, and it is generally heard before the shock begins to be felt. Moreover, as described in the last chapter, three out of every four earthquakes in Japan are unaccompanied by recorded sound, and the Japanese as a race cannot be accused of such constant inattention. The defect, it can hardly be doubted, is inherent to the observer, and not dependent on the conditions in which he is placed.
That the higher limit of audibility varies with different persons has long been known; and there can be no reason for doubting that there is a similar variability in the lower limit. Thus, to some observers, the sound remains inaudible throughout, however intently they may be listening. Again, it is found that, the deeper the sound, the greater must be the strength of the vibrations required to render them audible. As the vibrations which reach an observer increase in period, it may therefore happen that, sooner or later, the strength of some does not attain or exceed that limiting value, and, at that moment, [234]the sound will cease to be heard. Moreover, for vibrations of a given period, this limiting value varies for different persons. Thus, to one observer, the sound may become inaudible, while another may continue to hear it. Lastly, the vibrations which affect an observer at any moment are of various strength and period. One may hear all perhaps, while a second may be able to hear some and not others. Thus, to one observer, the sound may be like a rising wind, to another like a heavy traction-engine passing; one may hear the crashes which accompanied the strongest part of the shock, while a second may be deaf to the same vibrations; to one the sound may become continually louder and cease abruptly, to another it may increase to a maximum and then die away.
Sound-Area.—While the sound was a very prominent feature of the earthquake in and near the epicentral area, records at a great distance are naturally difficult to obtain, and, on this account, the number of stations for determining the boundary of the sound-area is too small to allow of it being accurately drawn. As a rule, however, it must lie between the isoseismals 5 and 4, but it is less nearly circular than either of these lines. Its length, from north-west to south-east, is 320 miles, its breadth 284 miles, and the area contained by it about 70,000 square miles, or roughly two-thirds that of the disturbed area.
Isacoustic Lines.—The dotted lines in Fig. 60 represent isacoustic lines—that is, lines which pass through all places where the percentage of observers who recorded their perception of the sound is the same. For instance, if we take any point in the line [235]marked 80 and describe a small circle with that point as centre, then 80 per cent. of the observers within that circle would hear the earthquake-sound. The isacoustic lines thus show how the audibility of the sound varies throughout the sound area. To draw the curves with a close approach to accuracy, the unit of area should be small and of constant dimensions; but, in the present case, owing to the comparative paucity of the observations, a smaller unit than the county would give unreliable results.[65] At the centre of each county, the sound audibility may be regarded as proportional to the percentage of the total number of observers within the county who distinctly heard the sound. To draw the curve marked 50, the centre of every county in which the average percentage is less than 50 is joined to the centres of those adjoining counties in which it is above 50, and these lines are then divided in the proper ratio so as to give a point where the percentage would be exactly 50. A number of points at which the percentage is 50 is thus obtained, and the curve drawn through them is the required isacoustic line. The percentage of audibility varies from 87 in Herefordshire to 23 in Essex and the east of Ireland, but the only isacoustic lines which can be completely drawn are those that correspond to the percentages between 80 and 50 inclusive.
The peculiar form of the isacoustic lines will be evident at a glance. They bear little relation to the isoseismal lines. Their greatest extensions are not along the axes of those lines, but in two directions which are a little east of north-east and south of [236]south-west. They lie indeed along a hyberbolic line which, towards the south-west, agrees closely with the curvilinear axis of the hyperbolic band represented by the broken line in Fig. 60. Towards the north-east, the coincidence is not so close, but this is chiefly owing to the magnitude of the northern counties, which causes a deflection of the isacoustic lines towards the north.
It will be remembered that the hyperbolic band is the area within which the vibrations from the two foci were superposed. Now, the sound accompanied each part of the shock, and ceased entirely during the interval between them. Also, the stronger series of vibrations was accompanied by the louder sound; but, while the difference in strength was considerable between the two parts of the shock, it was very slight between the two sounds. There is therefore no marked distortion of the isoseismal lines when crossing the hyperbolic band, while the isacoustic lines are completely diverted from their normal course.
Thus, the study of the isacoustic lines strongly confirms the conclusions at which we have arrived above (p. 223)—namely, that there were two distinct foci arranged in a north-west and south-east line, and that the impulse at the former focus occurred a few seconds earlier than that at the latter.[66]
[237]Variations in the Nature of the Sound throughout the Sound-area.—In one respect, the sound exhibited a marked uniformity all over the sound-area—namely, in its great depth; the word "heavy" being used in one out of every four accounts of the sound, whether close to the epicentre or near the boundary of the sound-area.
The type of comparison employed varies in different parts of the sound-area. As we recede from the origin, the sound becomes on the average less like thunder or explosions and more like wind. The references to passing waggons, etc., are so numerous that it is possible to draw curves, in the same way as isacoustic lines, which represent equal percentages of comparison to this type out of the total number of comparisons. The curves are somewhat incomplete, but it is noteworthy that those corresponding to the higher percentages cling to the extremities of the hyperbolic band, probably because the uninterrupted duration of the sound is greater there than elsewhere.
The effect of distance from the epicentre, however, is most noticeable in connection with changes in the character of the sound. It is only on the immediate neighbourhood of the origin that the explosive reports or crashes were heard in the midst of the rumbling sound. At a moderate distance, the sound before and after the shock became smoother, while the sound which accompanied the shock retained to a certain extent its rougher and more rumbling or grating character. Close to the boundary of the sound-area, the irregularities were still further smoothed away, and the only sound heard was like the low roll of distant thunder.
The explanation of these changes depends on the [238]fact that, as we recede from the epicentre, the vibrations of every period tend to become inaudible. The limiting vibrations of the whole series will be the first to be lost, especially those of the longest period. Thus, near the epicentre, sound-vibrations of many different periods will be heard, and the sound will be more complex than it is elsewhere. The greater the distance, the narrower are the limits with regard to period between which the audible vibrations lie, until, near the boundary of the sound-area, the sound becomes an almost monotonous deep growl of nearly uniform intensity.
Time-relations of the Sound and Shock.—The principal epochs to be compared are the beginning, the epoch of maximum intensity, and the end. The beginning of the sound preceded that of the shock in 82 per cent. of the observations on this epoch, coincided with it in 12, and followed it in 6 per cent.; the epoch of maximum intensity preceded that of the shock in 21 per cent. of the records, coincided with it in 73, and followed it in 6 per cent.; while the end of the sound preceded that of the shock in 22½ per cent., coincided with it in 27½, and followed it in 50 per cent. Thus, as a general rule, the beginning of the sound preceded that of the shock, the sound was loudest when the shock was strongest, and the end of the sound followed that of the shock. In other words, the duration of the sound was in most cases greater than that of the shock.
Of the twelve undoubted minor earthquakes, nine occurred before, and three after, the principal shock, the times of the first eleven lying between limits [239]about seven hours apart. With three exceptions, the records are insufficient to determine the positions of the epicentre with any approach to exactness.
The first occurred at about 11 or 11.30 P.M. on December 16th. The boundary of the disturbed area, which coincides nearly with that of the fifth shock (E, Fig. 63), is 97 miles long from north-west to south-east, 83 miles wide, and contains about 6,300 square miles. The focus was apparently situated between the two foci of the principal earthquake and partly coincided with them.
Then came three slight shocks (at about 1 A.M. on December 17th, 1.30 or 1.45 A.M., and 2 A.M.), about [240]which little is known except that they probably originated somewhere near the Ross focus.
The fifth shock (E, Fig. 63) occurred at about 3 A.M., and disturbed an area 104 miles in length, 79 miles in width, and about 6,400 square miles in area. Its boundary occupies approximately the position that would be taken by an isoseismal of intensity between 7 and 6 of the principal earthquake. We may therefore infer that this shock and the principal earthquake were caused by slips along the same fault and in about the same region of the fault. Also, as there is no evidence of discontinuity in the vibrations of the minor shock, it is probable that the focus was continuous, and occupied the space between the two foci of the principal earthquake, as well as part or the whole of both these foci.
The next four shocks occurred at about 3.30, 4, 5, and 5.20 A.M., and were more closely associated with the Ross than with the Hereford focus, and then followed the principal earthquake at 5.32 A.M.
A few minutes later, at 5.40 or 5.45 A.M., a very slight shock was felt, the focus of which was possibly situated in the central region between the two foci. The next, at about 6.15 A.M. (K, Fig. 63), disturbed an area 41 miles long, 27 miles broad, and containing about 870 square miles. Its focus must have coincided approximately with the Ross focus of the principal earthquake, and this was also the case probably with the last shock of all, which occurred on July 19th, 1897, at 3.49 A.M.
The greater part of the epicentral district is covered by a sheet of Old Red Sandstone (Fig. 64), but, just to the [241]north-east of the position laid down for the originating fault (indicated by the straight broken line), is the well-known Woolhope anticlinal, by which Silurian beds are brought to the surface. The anticlinal axis runs approximately north-west and south-east, and is thus roughly parallel to the earthquake-fault. Moreover, the thinning-out and occasional disappearance of some of the Silurian beds on the south-west side of the anticlinal (as compared with those on the north-east side) is suggestive of a north-west and south-east fault or rapid flexure at or [242]near the south-west junction of the Old Red Sandstone and the Silurian strata. If it be a fault, it must hade to the north-east, and would therefore satisfy two of the conditions determined by the seismic evidence. It would lie, however, about two miles too far to the north-east, being in fact to the north-east of the villages which suffered most from the earthquake.
But only a few miles to the south-east of the Woolhope anticlinal, and almost in the same line with it, there is a second anticlinal, that of May Hill. This is a triangular area, and is known to be bounded on all three sides by faults. The fault on the north-east side has an average north-west and south-east direction, and, if it were continued through the Old Red Sandstone towards the north-west, but bending at first a few degrees more to the west, it would pass through a point about 1½ miles west of Hereford. It is worthy of notice that both this fault and another nearly parallel to it, about half-a-mile farther north-east, stop, according to the Geological Survey map, at the points where they enter the Old Red Sandstone. The latter is an area which has never been investigated with thoroughness by modern stratigraphical methods, and in which it is difficult to trace faults. It therefore appears not improbable that the earthquakes were due to slips along a continuation of this fault.
Whether this be the case or not, however, it is clear that the earthquake-fault must pass between the anticlinal areas of Woolhope and May Hill, the former being on the north-east, and the latter on the south-west, side of the fault. At the Hereford focus, the fault must hade to the north-east; and, at the Ross focus, it is probable, from the distribution of places [243]where damage occurred to buildings, that it hades to the south-west If this be the case, the fault must change in hade between the two foci.
How long a time had elapsed since the last sign of growth in the earthquake-fault took place, it is impossible to say; but it must be many years in length. During this interval, the stresses tending to produce movement along the fault-service had been gradually increasing, until they were sufficient to overcome the resistance opposed to them. It is worthy of notice that the earliest perceptible movements were slight. Their function seems to have been to prepare the way for the great slips by equalising the difference between stress and resistance over a large area of the fault-surface. We cannot trace with accuracy the transference of the seat of movement from one part of the fault-surface to another. The first slip seems to have taken place chiefly in the region between the two foci of the principal earthquake; possibly it overlapped both of them partly. The next three slips were apparently in the neighbourhood of the Ross focus, and were followed by a fifth in the same area as the first. Then came a series of small movements that we cannot locate further than by saying that they were more closely connected with the Ross focus than the other.
In consequence of the preliminary slips within and near the Ross focus, the effective stress in that portion of the fault was diminished; and this may be the reason why the first great slip took place at the Hereford focus. The immediate result of such a movement would naturally be an increase of stress in and beyond the terminal regions, and the next slip might have been expected in an area partly [244]overlapping the Hereford focus, and either to the north-west or south-east of it. Instead of this, for a distance of two miles in the latter direction, there was not the least perceptible movement during the principal earthquake, and the second great slip occurred in the region beyond occupied by the Ross focus. This second slip, moreover, occurred within two or three seconds after the other; that is, before the earth-waves had time to travel from the Hereford to the Ross focus. In other words, the slip at the Ross focus was not a consequence of the slip at the Hereford focus; but both were due to a single generative effort.
Now, a section drawn parallel to the earthquake-fault and on the north-east side of it, would show an anticline near the Hereford focus and a corresponding syncline near the Ross focus, with an undisplaced portion in the intermediate region; while a parallel section on the other side of the fault would show a syncline near the Hereford focus, an anticline near the Ross focus, and again an undisplaced portion in the intermediate region. If further movements tending to accentuate such a structure were to occur (that is, if the anticlinals were to be made more anticlinal and the synclines more synclinal), there would therefore be two slips, one in each focus; while, along the fault-surface between, there would be practically no displacement. At any rate, the earlier stresses in that region may have been fully relieved by two slight preliminary slips (those causing the first and fifth minor earthquakes), and those resulting from the great displacements by the first after-slip which followed in about ten minutes.
Half-an-hour later, another slip took place at the [245]Ross focus, and by this the equilibrium of the rock-masses was almost completely restored; for we have no certain evidence of any further movements until seven months have elapsed (July 19th, 1897), when there was a final slip in the same region of the fault.
Between the north-east end of Loch Ness and the Moray Firth at Inverness, there lies a tract of land not more than seven miles in length, which is notable as one of those most frequently shaken by earthquakes in the British Islands. In the intensity of its shocks it is inferior to the south-east of Essex and the centre of Herefordshire, and, in mere number, to the celebrated village of Comrie in Perthshire. But, in the interest of its seismic phenomena, in the light which they cast on the development of the earth's crust, the neighbourhood of Inverness has no equal in Great Britain, and not many superiors in any part of the world.
For this importance from a seismological point of view, the district is indebted to the great fault which traverses Scotland along the line of the Caledonian Canal, and to the fact that this fault, although it dates from Old Red Sandstone times, has not yet finished growing. As results of its formation, we have the almost straight cliff along the south-east coast of Rossshire, and the long chain of lakes, beginning with Loch Dochfour and Loch Ness, and ending with Loch Oich, Loch Lochy, and Loch Linnhe. As evidences of its persistent though intermittent growth, we have the slight tremors and earth-sounds [246]occasionally observed at and near Fort William, and the much stronger shocks felt in the neighbourhood of Inverness.
During the nineteenth century there were three strong earthquake shocks in this district. The first and most severe occurred on August 13th, 1816, and was felt over the greater part of Scotland; the second on February 2nd, 1888; and the third and weakest on November 15th, 1890. This last shock was followed by several slighter ones, the series ending with a rather smart shock on December 14th. Between this date and the summer of 1901 no earthquakes seem to have been felt at or anywhere near Inverness.
The date of the first shock of 1901 is not quite certain. One is said to have been felt at Aldourie (see Fig. 66) some time in June, and a second at Dochgarroch in July. These may have been succeeded by others too slight to attract much notice, but the first to be generally observed occurred on September 16th at 6.4 P.M. A weak tremor, accompanied by a faint sound, was perceived over a nearly circular area about 12 miles in diameter, and with its centre about 1½ miles south of Dochgarroch. On the next day, at 11 P.M., a quivering lasting two seconds was felt at Inverness, and a weak tremor, accompanied by sound, at Dochgarroch at 1.15 A.M. on September 18th. Nine minutes later, at 1.24 A.M., occurred the principal earthquake, the shock of which would be called a strong one, even in Italy and Japan.
[247]In Inverness, the damage to buildings, though seldom serious, was by no means inconsiderable. One brick building used as a smithy was destroyed, several chimneys or parts of them fell, and many chimney-cans were displaced or overthrown. At Dochgarroch and other places within the meizoseismal area, walls were cracked, chimneys thrown down, and lintels loosened.
But, for this country, an unusual effect of the earthquake was a long crack made in the north bank of the Caledonian Canal near Dochgarroch Lochs. It occurred in the middle of the towing-path, and could be traced at intervals for a distance of 200 yards to the east of the Lochs, and 400 yards to the west, being often a mere thread, and in no place more than half-an-inch wide. Soon after its formation, however, the fissure was obliterated by heavy showers of rain.
The map (Fig. 65) shows the area over which the earthquake was perceptible. The isoseismal lines are drawn partly continuous and partly dotted—continuous where some confidence can be placed in their accuracy, and dotted where their course must be regarded as doubtful, owing to the rarity or absence of observations.
The innermost isoseismal (shown on a larger scale in Fig. 66) corresponds to the intensity 8 of the Rossi-Forel scale, and includes the places where the shock was strong enough to cause slight structural damage to buildings. It is elliptical in form, 12 miles long, [248]7 miles broad, and 67 square mile in area, with its centre at a point about 1½ mile east-north-east of Dochgarroch, and its longer axis running N. 33° E. and S. 33° W.
The remaining isoseismals are less accurately drawn, owing to the scarcity of observations made in the west of Scotland. Except towards the west, however, the course laid down for the isoseismal 7 [249]may be trusted. Its length is 53½ miles, width 35 miles, and area 1,500 square miles. Its longer axis is almost exactly parallel to that of the preceding isoseismal, but the distance between the two curves is 9 miles on the north-west, and 14 miles on the south-east, side. The isoseismal 6 is 105 miles long, 87 miles wide, and contains 7,300 square miles; and the isoseismal 5, 157 miles long, 143 miles wide, and about 17,000 square miles in area.
The isoseismal 4 may be regarded as the boundary of the disturbed area of the earthquake, for, so far as known, the shock was not noticed at any point outside it. Towards the north, it was felt at Wick, Castletown, and other intermediate places; towards the west at Tobermory in the island of Mull; and, towards the south, at Skelmorlie (in Ayrshire), Paisley, Belsyde (near Linlithgow), Gullane (near North Berwick), and Dunbar. Along the east coast of Scotland, between Wick and Dunbar, there are few places of any size where the shock was not felt. The disturbed area of the earthquake is thus 215 miles long from north-east to south-west, 198 miles wide, and contains about 33,000 square miles.
Position of the Originating Fault.—The only isoseismals which are drawn accurately enough to determine the earthquake-fault are the two inner ones, those marked 8 and 7; but these are sufficient for the purpose. It is clear, from the direction of their longer axes, that the average direction of the fault must be N. 33 degrees E. and S. 33 degrees W. Again, the isoseismals are farther apart towards the south-east than towards the north-west, implying that the fault hades to the south-east. Lastly, as the intensity of the shock is greater on the side towards which the [250]fault hades, it follows that the fault-line must lie a short distance (about a mile or so) on the north-west side of the centre of the isoseismal 8.
Now, the great fault alluded to above occupies almost exactly the position indicated by the seismic evidence. Its mean direction from Tarbat Ness to Loch Linnhe is N. 35° E. and S. 35° W., it hades to the south-east, and the fault-line passes through a point about three-quarters of a mile to the north-west of the centre of the isoseismal 8 (Fig. 66). There can be little doubt, therefore, that the earthquake was caused by a slip of this fault; and the evidence of the after-shocks, as will be seen, offers additional support to this conclusion.
The region in which the slip took place may be determined roughly from the position and form of the innermost isoseismal. Its centre must have been close to the point marked A in Fig. 66, which corresponds to a point about 1½ mile east-north-east of Dochgarroch. In a horizontal direction, its length must have been at least five or six miles; otherwise, the isoseismal 8 would have been less elongated. It must therefore have reached from about half-a-mile north-east of Loch Ness to about half-a-mile south-west of Inverness. Its width, measured along the dip of the fault-surface is unknown; but the small distance between the centre of the isoseismal and the fault-line shows that the principal movement took place at a depth which was probably under, rather than over, one mile.
We come now to the evidence afforded by the nature of the shock, in which there was but little variation throughout the disturbed area. At [251]Inverness, a gentle movement was first felt, followed by an extraordinary quivering, which increased in force for two or three seconds, and then decreased for two or three seconds; just as the quivering was about to cease, there was a distinct lurch or heave, after which the vibration was much more severe than before and lasted several seconds longer than the first part of the shock. Dalarossie lies about fourteen miles south-east of Inverness, and here the first indication was a loud sound, as of an express train, coming from the east, rushing close to, and then under, the house; this lasted for a few seconds, and towards the end of it the house vibrated. Then succeeded an interval of quietness for about a second, followed by a terrific burst or crash, not unlike the crash of a loud thunder peal, of about two seconds' duration, during which the house distinctly heaved up once and then sank back. After another brief interval of quietness, there was a low rumble, like the sound of a dying peal of thunder.
It will be noticed, in this account, that the two parts of the shock were no longer consecutive. There was a short interval of rest between them, the intermediate vibrations observed at Inverness being too weak to be felt at Dalarossie. Still farther away, the extinction became more marked. At Aberdeen, for instance, the shock consisted of two parts, the first a tremble, followed, after an interval of a few seconds, by a swinging movement of longer duration than the tremble.
In all parts of the disturbed area, the shock maintained the same character of division into two parts, the second of which was of greater duration and intensity than the first and consisted of vibrations [252]of longer period. A phenomenon of such wide occurrence was clearly not due to local influences. It must have been caused by two separate initial impulses, the stronger succeeding the other after an interval of a few seconds and taking place in nearly the same region of the fault.[67]
Outside the isoseismal 5, there are but few records of the earthquake-sound; but it was heard faintly at Skelmorlie (in Ayrshire), Belsyde (near Linlithgow), and Gullane (near North Berwick). Towards the north, it was not observed beyond Wick and Wathen (in Caithness). The boundary of the sound-area cannot be laid down with any approach to accuracy, but it must have included a district containing about 27,000 square miles.
Throughout the whole disturbed area, 84 per cent. of the observers heard the sound. The percentage varies in different counties, from 93 in Inverness-shire to 77 in the counties of Perth and Aberdeen; but the records in the more distant regions are too few to allow of the construction of isacoustic lines.
In its character, the sound resembled that usually heard with strong earthquakes, 39 per cent. of the observers having compared it to passing waggons, traction-engines, etc., 25 per cent. to thunder, 14 to wind, 8 to loads of stones falling, 3 to the fall of heavy bodies, 4 to explosions or the firing of heavy [253]guns, and 7 per cent. to miscellaneous sounds. The intensity of the sound gradually diminished outwards from the epicentre, and most rapidly near the isoseismal 7, which abounds approximately the area in which the sound was very loud from that in which it was distinctly fainter, and also includes nearly all the places at which loud explosive crashes were heard with the strongest vibrations.
In the time-relations of the sound and shock, the Inverness earthquake resembles the Hereford earthquake of 1896. The beginning of the sound preceded that of the shock in 72 per cent. of the records, coincided with it in 20, and followed it in 8 per cent.; the epoch of maximum intensity of the sound preceded that of the shock in 20 per cent. of the records, coincided with it in 73, and followed it in 7 per cent.; while the end of the sound preceded that of the shock in 15 per cent. of the records, coincided with it in 34, and followed it in 52 per cent.
Somewhat similar proportions hold over the greater part of the disturbed area, the percentages being nearly the same in the counties of Inverness, Ross, Nairn, Elgin, Banff, and the most distant counties. But in Aberdeenshire an exception occurs, the three epochs of sound and shock in most cases coinciding with one another. The majority of the observations in this county come from the southern part, and the line joining this district to the epicentre is nearly perpendicular to the line of the earthquake-fault. This result has an important bearing on the origin of the sound-vibrations. For, if the general precedence of the sound with respect to the shock were due to its superior velocity, the percentage of records in which the beginning of the sound preceded that of [254]the shock would vary only with the distance, and not with the direction from the origin. Indeed, with increasing distance from the origin, this percentage should continually approach 100; while that in which the end of the sound followed that of the shock should diminish to zero. There is, however, no trace of either tendency, the sound being heard after the shock at places close to the boundary of the sound-area. On the other hand, it the sound-vibrations were to start simultaneously, or nearly so, from all parts of the focus, but especially from its marginal regions, then, in the greater part of the disturbed area, the sound would be heard both before and after the shock; for the lateral margins of the focus would be the portions nearest to, and farther from, most observers; while, at places near the line through the epicentre at right angles to the earthquake-fault, the three principal epochs of the sound and shock should approximately coincide.
The inference that the sound-vibrations heard before and after the shock come from the margins of the focus is also supported by the observations on the relative duration of the sound and shock. If we take only those records which are free from doubt, in 78 per cent. of the total number, the duration of the sound was greater than that of the shock; while, in Aberdeenshire, according to 93 per cent. of the observers, the durations of sound and shock were equal.
We may imagine, then, that the slip within the seismic focus would be greatest in a central region, and that it would die outwards in all directions towards the edges. The friction arising from the slipping in the central region would produce chiefly [255]the comparatively large oscillations that formed the perceptible shock; the evanescent creep within the marginal regions would produce the small and rapid vibrations that were sensible only as sound.
While the seismic evidence enables us to determine the surface-position and the horizontal dimensions of the seismic focus, it unfortunately throws no light whatever on a point of some importance—namely, the direction of the movement which caused the earthquake. We cannot infer from it whether it was the rock on the south-east or north-west side of the fault that slipped or whether both sides slipped at once; nor, if that point had been settled, do we know if the movement of the displaced side was upward or downward. In the formation of the fault, however, it is clear that either the south-east side has been depressed or the north-west side elevated; and, as the bed of Loch Ness is below the level of the sea, that the former movement has predominated. If the displacements which gave rise to the earthquake were merely a continuation of the original series of movements—and this is, to say the least, a very probable view to take—then we may imagine that, for a distance of five or six miles, and at a depth of about a mile or less, there was a sudden sag downwards of the rock on the south-east side of the fault through a distance which perhaps in no part exceeded a fraction of an inch.
Fig. 66 is an attempt to represent roughly the displacement which caused the principal earthquake. The diagram makes no pretence to accuracy, and [256]the scale in the vertical direction is enormously greater, perhaps a hundred thousand times greater, than that in the horizontal direction. The straight line is supposed to represent a straight line drawn before the earthquake on the surface of the rock adjoining the fault on the south-east side and at a depth of about a mile, and the curve the form of the same line after the earthquake.
The effect of this great slip would obviously be to relieve the stress in the central region A, and to increase it suddenly in the parts denoted by the letters B and C. It is, therefore, in these parts especially that we should expect future slips to occur. Each slip would of course give rise to an after-shock, and would in like manner result in an increase of stress in its own terminal regions, though chiefly on the side remote from the centre A.
It is difficult to form any estimate of the total number of after-shocks. The list, compiled from the records of careful observers only, includes forty-six shocks and ten earth-sounds, the last of all occurring on November 21st. But the list is certainly incomplete. It contains, for instance, only one entry on [257]September 18th between 3.56 and 9 A.M.; whereas, during the same interval, no fewer than eighteen slight shocks were felt by one observer at Dochgarroch, while another near Aldourie estimates the number of shocks up to October 23rd at about seventy. The total number probably did not fall short of one hundred.
The majority were certainly very slight, and, at another time, would hardly have attracted any notice. There were, however, three of much greater importance than the rest. These occurred on September 18th at 3.56 and 9 A.M., and on September 30th at 3.39 A.M. The isoseismal lines of all three are elongated ovals, their longer axes are parallel to the fault, and their centres lie on the south-east side of the fault-line. The shocks were therefore evidently due to slips several miles in length along the fault. At present, we are concerned more with the position of their epicentres. These are indicated by the dots lettered B, C, D in Fig. 67; the dot marked A denoting the centre of the principal earthquake, and the continuous line the path of the fault.
Thus, within two and a half hours, the great slip was followed by one with its centre at B, near the south-west margin of the principal focus. About five hours later, the scene of action was suddenly transferred to a region with its centre at C on the north-east margin. Both slips affected a portion of the fault-surface several miles in length, and must therefore have increased the area of displacement, slightly towards the north-east and considerably towards the south-west. Only small movements occurred during the next twelve days until 3.39 A.M. [258]on September 30th, when another long slip took place, with its centre at D, still farther to the south-west, and therefore again extending the area and amount of displacement in this direction.
Turning now to the weaker after-shocks and earth-sounds, we find them affecting chiefly three regions of the fault. One of these is close to Dochgarroch, another near Inverness, and the third between Aldourie and Drumnadrochit; the effects of the slips in the last two districts being, as before, to extend the area of displacement a short distance (perhaps half a mile) to the north-east and not less than six miles to the south-west underneath Loch Ness.
The unequal division of the after-shocks between the two sides of the principal centre (A, Fig. 67) is [259]very marked. The positions of the epicentres of forty-four shocks and earth-sounds can be determined with more or less accuracy, and, of these, only ten lie to the north-east of the principal centre, while thirty-four lie to the south-west, six or seven of the latter being beneath Loch Ness.
One other point may be referred to before leaving these minor shocks. So far as regards the stronger shocks, there was a continual decrease in the depths of the seismic foci. This is shown by the progressive approach of their epicentres towards the fault-line; the distances in the three chief after-shocks being 1.7, 1.0, and 0.5 miles respectively; and in one of the latest shocks (that of October 13th at 4.24 P.M., E, Fig. 67) the distance is no more than one-tenth of a mile. The focus of this shock must, indeed, have been quite close to the surface near Dochgarroch. This constant diminution in the depth of the foci shows that the great slip was followed by a sudden increase of stress upwards as well as laterally, and explains why that slip did not leave any perceptible trace, either as fault-scarp or fissure, at the surface.
It is remarkable that, of the 56 recorded after-shocks, at least six were felt or heard only at Dalarossie and other places in the valley of the Findhorn, a valley which lies about 13 or 14 miles to the south-east of the great fault. That they had no connection with that fault is certain, for two of them were so strong that, if they were so connected, they could not have escaped the notice of one or more of the watchful observers between Drumnadrochit and [260]Inverness. The probable explanation of these after-shocks is that they were due to slips of a fault running along the Findhorn valley;[68] and that the great displacement near Inverness on September 18th led to a sudden increase of stress within the rocks for many miles around, which, at and near Dalarossie, was sufficient to precipitate the slips referred to.
At first sight, two earthquakes could hardly be more unlike than the Japanese earthquake of 1891 and the Inverness earthquake of 1901. In the rice-fields of central Japan, as we have seen, the roads for many leagues were edged with ruins, the fault-slip was prolonged up to the surface and visible as a scarp forty, if not seventy, miles in length, plots of ground were compressed and their boundaries altered, the hillsides were scored by landslips, places can now be seen from one another that formerly were hidden by a mountain ridge, and the total number of after-shocks within little more than two years amounted to above three thousand. On the other hand, when we examine the distribution of the after-shocks in space, we find that, though no part of the fault was exempt from slips, they favoured three regions in particular—one, the most important, a central region, yet not coincident with that in which the principal shock was most intense; and the other two surrounding the extremities of the fault. With [261]the lapse of time, the after-shocks on the whole became weaker and occurred less frequently, and the average depth of the foci gradually diminished. Moreover, in two districts distant forty-five and fifty-five miles from the fault, the frequency of the shocks during the month succeeding the earthquake was suddenly increased to ten and sixteen times the normal rate.
It is interesting to notice so close a similarity in character, subsisting with so vast a difference in the scale of intensity. The identity of the powers at work in shaping the structure of both islands Is manifest. In Japan, we see the mountain-making forces acting with violence and producing effects that are only too apparent to the eye. In Scotland, whatever may have happened in former geological epochs, the changes in surface-structure are now taking place with almost infinite slowness, and hundreds or thousands of years must elapse before Loch Ness makes any visible progress in its march towards the sea.
1. Davison, C.—The Hereford Earthquake of December 17, 1896. (Birmingham, 1899.)
2. —— "The Inverness Earthquake of Sept. 18, 1901, and its accessory shocks." Quart. Journ. Geol. Soc., vol. lviii., 1902, pp. 377-397.
[61] The study of the Hereford earthquake is based on 2,902 records, coming from 1,943 places; that of the Inverness earthquake on 710 records from 381 places.
[62] The disturbed area of the Hereford earthquake of 1896 was probably greater than that of any other British earthquake of the nineteenth century; that of the Pembroke earthquake of 1892 being more than 56,000 square miles, of the Pembroke earthquake of 1893 about 63,600 square miles, while that of the Essex earthquake of 1884 (a far stronger shock in the meizoseismal area) is estimated at about 50,000 square miles.
[63] The approximate circularity of the two outer isoseismals is due to the fact that the vibrations propagated to such great distances are those which start from the comparatively small central region of the focus.
[64] The above statement summarises the evidence of the majority of the observers in each portion of the disturbed area. In this, as in other similar cases, discrepancies in the observations are unavoidable; but it is important to notice that they are least frequent in the observations evidently made with the greatest care.
[65] Except in the case of Yorkshire, where the three Ridings are regarded as separate counties.
[66] The Derby earthquake of March 24th, 1903, was also a twin earthquake. The centres of the two foci were situated near Ashbourne and Wirksworth, above eight or nine miles apart, along a line running N. 33° E. and S. 33° W. The two parts of the shock coalesced along a rectilineal band about five miles wide running centrally across the lower isoseismals in a direction at right angles to their longer axes. The isacoustic lines are also elongated in the direction of this band. In this case, the impulses at the two foci must have taken place at the same instant. (Quart. Journ. Geo. Soc., vol. lx., 1904, pp. 215-232.)
[67] If the foci of the two impulses had been detached, there would, with so small an interval between the two parts, have been a variation in the nature of the shock like that observed during the Hereford earthquake.
[68] This part of Inverness-shire has not yet been mapped by the Geological Survey, but a fault is known to exist in the Findhorn valley near Drysachan Lodge, which lies about eleven miles down the valley from Dalarossie.
Very different from the shocks of Britain was the earthquake that overwhelmed so large a part of its great dependency on June 12th, 1897—an earthquake which, if it is not without a rival, is certainly one of the most disastrous and most widely-felt of which we possess any record. That it was of the first magnitude was evident at once in Calcutta from the extensive injury to buildings, and its investigation was undertaken without delay by the members of the Geological Survey of India. The four officers who were at the headquarters in Calcutta were despatched to the area of greatest damage, letters and circulars were distributed as widely as possible, a large number of observers were induced to co-operate by keeping records of the after-shocks, and, later on, during the cold weather of 1897-98, Mr. R.D. Oldham, one of the superintendents of the Survey, made a tour through the epicentral district. To him, moreover, fell the much harder task of discussing the very numerous observations collected by himself and others; and the least that can be said of the valuable report prepared by him is that it is worthy of a great subject. Professor Omori also spent several months in studying the earthquake on behalf of the Japanese Government; but the account, [263]which is written in his own language, unfortunately remains a sealed book to western seismologists.
[264]In Fig. 68, which shows the area disturbed by the earthquake, Mr. Oldham has drawn two series of curves. In the absence of detailed records of the intensity—records that could not have been obtained from some parts of the disturbed area, and would have been difficult to procure in sufficient number from others—he has represented by the dotted curves a group of isoseismals in the form which he believes they would have assumed had the earth-waves been propagated in a homogeneous medium. The first includes all places, such as Shillong and Goalpara, where the destruction of brick and stone buildings was practically universal; the second, those, like Darjiling, in which damage to buildings was universal and often serious; the third, places, like Calcutta, where the earthquake was strong enough to injure all or nearly all brick buildings. Inside the fourth isoseismal, the shock was strong enough to disturb furniture and loose objects, but not to cause more than slight damage; within the fifth, it was generally noticed; and, beyond this, and as far as the sixth isoseismal, the earthquake was perceived only by a small number of sensitive persons at rest. The approximation of the curves towards the east and south-east, Mr. Oldham believes to be partly real, and not due to imperfect information.
The continuous curves represent more closely the actual variation of intensity. The innermost curve A indicates the probable boundary of the epicentral tract, which is about 200 miles in length and more than 6000 square miles in area. This will be referred to afterwards in greater detail. The next [265]curve B bounds the region within which serious damage to brick houses was common. Its irregular course is closely connected with the geological structure of the country, and is due to the fact, of which we have already met with several examples, that earthquakes are more destructive to houses built on alluvial ground than to those founded on rock. The area included within this curve is not less than 145,000 square miles; and, if we include the parts from which reports were not obtainable, it must amount to about 160,000 square miles.
The curve C represents the boundary of the disturbed area, so far as known, for about one-third of the area lies in regions from which no information was procurable, while another third is inhabited by ignorant and illiterate tribes. But, notwithstanding this, the shock is known to have been felt over an area of at least 1,200,000 square miles. If we include the detached region to the west, near Ahmedabad, the portion of the Bay of Bengal in which the shock would have been felt had the sea been replaced by land, and a large part of Thibet or Western China, from which no reports have come, but in which the shock was certainly sensible, this estimate, great as it is, must be raised to about 1,750,000 square miles.[69]
Figures, such as those given above, convey but little [266]idea of the vastness of the area concerned. Transferring them to countries with which we are more familiar, we may say that the disturbed area was only a little less than half the size of Europe; the region in which serious damage occurred to masonry was more than twice as large as the whole of Great Britain; while, if the centre of the epicentral tract had been in Birmingham, nearly every brick and stone building between York and Exeter would have been levelled with the ground.
Few and slight were the forerunners of the greatest of modern earthquakes. Early in June, faint tremors were felt by sensitive persons at Shillong. Others at the same place heard a rumbling sound for ten or fifteen seconds before the shock began, and at Silchar birds were seen to rise suddenly from trees before the movement became sensible to man. Except for these almost imperceptible warnings, the earthquake broke abruptly over the whole district.
"At 5.15," writes one observer at Shillong, "a deep rumbling sound, like near thunder commenced, apparently coming from the south or south-west.... The rumbling preceded the shock by about two seconds ... and the shock reached its maximum violence almost at once, in the course of the first two or three seconds. The ground began to rock violently, and in a few seconds it was impossible to stand upright, and I had to sit down suddenly on the road. The shock was of considerable duration, and maintained roughly the same amount of violence from the beginning to the end. It produced a very distinct [267]sensation of sea-sickness.... The feeling was as if the ground was being violently jerked backwards and forwards very rapidly, every third or fourth jerk being of greater scope than the intermediate ones. The surface of the ground vibrated visibly in every direction, as if it was made of soft jelly; and long cracks appeared at once along the road.... The road is bounded here and there by low banks of earth, about two feet high, and these were all shaken down quite flat. The school building, which was in sight, began to shake at the first shock, and large slabs of plaster fell from the walls at once. A few moments afterwards the whole building was lying flat, the walls collapsed, and the corrugated iron roof lying bent and broken on the ground. A pink cloud of plaster and dust was seen hanging over every house in Shillong at the end of the shock.... My impression at the end of the shock was that its duration was certainly under one minute, and that it had travelled from south to north.... The violence of the shock may be imagined when it is stated that the whole of the damage done was completed in the first ten or fifteen seconds of the shock."
Other estimates of the duration are generally higher than that given above, ranging from three to five or even more minutes at Tura, Dhubri, Silchar, Calcutta, and other places. In some cases, it is possible that the immediately succeeding tremors were included as part of the great shock; but, in the central area, it is probable that the average duration of the shock did not differ much from three or four minutes.
In this district, the movement was most complicated. Changes of direction were frequently noticed. At Silchar, for instance, the earthquake began with [268]an undulatory movement from north to south, like the swinging of a suspension bridge; it closed with a motion like that of a boat tossed in a choppy sea, or by the crossing of great waves which, whatever their dominant direction may have been, certainly did not travel from north to south. The vertical component of the motion must have been considerable; for, at Shillong, loose stones lying on the roads were tossed in the air "like peas on a drum," But this was even less pronounced than the horizontal movement, the range of which was at least eight or nine inches, and during which people felt as if they were being shaken like a rat by a terrier. The period of these vibrations was estimated at about a second.
As they left the central region, the period of the waves lengthened, so that, at a distance, the shock no longer consisted of short jerks, but became a gentle rocking motion, causing in some people a sensation of nausea. At Calcutta, the undulations were regular and resembled the rolling of a mighty ship, the period being between one and two seconds. At Balasor, the motion was a long rolling one, such as would be felt on the deck of a ship in a fairly heavy sea; and, farther to the south as far as the limit of the disturbed area, the same undulatory movements were observed, gradually decreasing in intensity, and usually compared to the easy motion of a ship in a gentle sea.
Visible Earth-Waves.—A few examples have already been given of the observation of visible waves on the surface of the ground. They were seen at Charleston during the earthquake of 1886 (p. 110), and at Akasaka and other places in the meizoseismal area during the Japanese earthquake [269]of 1891 (p. 186). But they were more than usually prominent in the Indian earthquake; indeed, much of the difficulty experienced in standing during the shock seems to have been due to the passage of these surface-waves.
At Shillong, according to an observer quoted above (p. 266), the surface of the ground vibrated visibly in every direction, as if it were made of soft jelly. Another describes it as presenting "the aspect of a storm-tossed sea, with this difference that the undulations were infinitely more rapid than any seen at sea." Near Maimansingh, earth-waves were watched approaching, exactly like rollers on the sea-coast, and, as they passed, the observers had a difficulty in standing. At Nalbari, the rice in the fields could be seen rising and falling at intervals during the transit of the waves. In the Assam valley, near Mangaldai, there were seen "waves coming from opposite directions and meeting in a great heap and then falling back; each time the waves seemed to fall back the ground opened slightly, and each time they met, water and sand were thrown up to a height of about 18 inches or so." Even as far as Midnapur, the ground was "distinctly billowy," and at Allahabad a series of waves was observed to cross the ground from south-south-west to north-north-east.
It is obviously difficult to judge in any case of the magnitude of such waves. In the epicentral area, Mr. Oldham believes that, on an average, they were probably about thirty feet long and one foot in height, though some may have been both shorter and higher. These movements must have been comparatively slow, for their progress could be easily [270]followed by the eye; indeed, their rate, as one witness remarks, "though decidedly faster than a man could walk, was not so fast as he could run."
In his study of the Neapolitan earthquake, Mallet showed how the amplitude and maximum velocity of the vibrations could be determined roughly from the displacement, projection, or overthrow of various bodies by the earthquake. Somewhat similar methods were employed by Mr. Oldham in the absence of seismographs from the epicentral area. His results are of course only approximate, but they lead nevertheless to a conclusion of great value and interest.
Amplitude.—The best measure of the amplitude was obtained at the cemetery at Cherrapunji, situated near the southern margin of the epicentral area. Here were two oblong masonry tombs (Fig. 69), standing close together with their longer axes pointing north and south. Their inner sides were partially destroyed. "On the outer sides, they are almost intact, but the tombs have been driven bodily down into the ground, and on either side to east and west, there is a depression with a vertical side [271]parallel to the outer surface of the tomb and a smooth flat bottom over which the base of the tomb has slid.... The edge of the western depression has the grass growing undisturbed up to the edge of it, and along the edge small fragments of lime and plaster show that this was originally in contact with the edge of the tomb, which has now moved away to a distance of 18 inches. On the east the edge of the depression is raised and the grass and earth forced upwards by the thrust of the tomb against it; the breadth of this depression is 10 inches."
During the movement of the ground, the tombs, owing to their inertia, remained comparatively stationary, and the depressions were formed by the backward and forward movement of the ground against them. The movement on the east side was clearly arrested in some manner, and the range therefore cannot have been less than 10 inches. It may have been as much as 18 inches, and was probably, in Mr. Oldham's opinion, the mean of these two amounts—namely, 14 inches. This would give an amplitude of about 7 inches, a value which may be in excess of the average amount elsewhere in the district, as the cemetery is situated near the edge of a high sandstone scarp.
At Tura, also within the epicentral area, a range of not less than 10 inches was given by the sliding of a wooden house over the posts on which it rested. Six months after the shock, Mr. Oldham frequently noticed vacant spaces four or five inches across by the side of large boulders scattered over the Khasi hills, and he infers that "throughout the whole tract lying west of Shillong and Gauhati, as far as the hills extend, and probably over a large area of [272]the plains besides, the amplitude of the wave-motion was nowhere less than 3 inches, while in many places it was over 6 inches."
Maximum Velocity.—The most trustworthy measure of the maximum velocity are those obtained from the projection of bodies. Mr. Oldham selects the following as most deserving of notice:—At Goalpara, an obelisk surmounting a tomb was broken off and thrown to one side, giving a maximum velocity of not less than 11 feet per second. At Gauhati, the coping of a small gate-pillar was shot off and fell at a distance of 4 feet 4 inches from the centre of the pillar; in this case the maximum velocity must have exceeded 8 feet per second. The highest velocity, of more than 16 feet per second, was measured at Rambrai, where a small group of monoliths were shot out of the ground, one of them to a distance of 6½ feet. Lastly, at Silchar, a bullet was projected from the corner of a wooden post, acting as a rough form of seismometer, from which a maximum velocity of at least 1½ feet per second was deduced.
Maximum Acceleration.—Estimates of the maximum horizontal acceleration were made from 28 overthrown pillars by means of Professor West's formula (p. 184, footnote). The measures obtained at the same place show some variation, but Mr. Oldham considers as fair average values those of 14 feet per second per second at Goalpara, 12 at Gauhati, Shillong, and Sylhet, 10 at Cherrapunji, 9 at Dhubri, and 4 feet per second per second at Silchar.
Of the vertical component of the acceleration, not even the roughest numerical estimate can be formed. We know, however, that at Shillong, Gauhati, and [273]indeed throughout the epicentral area, stones were projected upwards, and this is evidence that the vertical component was greater than that of gravity—namely, 32 feet per second per second.
Violent as the shock was at the places just mentioned, it must have been still greater in certain parts of the epicentral area. At Dilma, in the Garo hills, the shock seems to have been strong enough to disable men; and, in the neighbourhood of the faults that will be described in a later section, forest trees were snapped in two. Fortunately, as Mr. Oldham remarks, there were in these districts no towns or populous settlements to feel the full power of the earthquake to destroy.
Anomalies in the above Measurements.—If the movements of the ground followed the law of simple harmonic motion, any two of the four elements (period, amplitude, maximum velocity, and maximum acceleration) would suffice to determine the others (p. 4). Applying the usual formulæ to the quantities obtained at Gauhati—namely, 8 feet per second for the maximum velocity and 12 feet per second per second for the maximum acceleration, it follows that the amplitude would be 5 feet and the period 4 seconds—values, which are evidently inadmissible. Or, taking the maximum vertical component at 32 feet per second per second, the corresponding values would be 2 feet and 1½ seconds, that of the amplitude being still too great. Again, at Rambrai, the maximum velocity was found to exceed 16 feet per second. The other elements are unknown, but, if the amplitude were one foot, Mr. Oldham shows that the maximum acceleration would be 256 feet per [274]second per second; or, taking the amplitude at the impossible amount of two feet, that the maximum acceleration would be 128 feet per second per second.
It follows, therefore, that only part of the high velocities at Rambrai and elsewhere can be due to the elastic waves provoked by the initial disturbances. The remaining portion must be attributed to a bodily displacement of the earth's crust within the epicentral area—a displacement of which the fault-scarps and other distortions of that region furnish ample evidence.
In the epicentral area, the sound that accompanied the earthquake was remarkable for its extraordinary loudness. At Shillong, the crash of houses falling within thirty yards was completely drowned by the roar of the earthquake.
The sound was generally compared to distant thunder, the passage of a train or cart, etc.; but, whatever the type may be, it always implies a sound of deep pitch, close to the lower limit of audibility—a continuous rumbling or rattling noise, as a rule gradually becoming louder and then dying away. There was the usual conflict in the evidence of different observers due to the depth of the sound. In Calcutta, which lies well within the sound-area, some persons asserted that they heard a rumbling noise; others were positive that the only noise was that caused by falling buildings and furniture. Some, again, noticed that the shock was preceded by a loud roar; while others were certain that there was no [275]sound of any kind until the earthquake had become severe.
As in the case of the disturbed area, it is impossible to define the boundary of the region over which the sound was heard. Like the shock, also, it seems to have been observed farther to the west than towards the east. Leaving out of account records that are possibly doubtful, the sound was heard for a distance of 330 miles to the west and south-west, and 290 miles to the east of the epicentral area—that is, allowing for the dimensions of that area, it must have been perceptible over a region measuring not less than 800 miles from east to west.
It is somewhat doubtful whether a more accurate estimate of the velocity is to be obtained from a violent earthquake or from one of moderate intensity. In the former case, the vast distances to which the shock is noticed lessen the effects of errors in the time-determinations, but this advantage is to a great extent compensated by the considerable duration of the shock and the consequent uncertainty whether all observers have timed the same phase of the movement. Also, in the Indian earthquake, there are further sources of error in the variety of standard times employed throughout the country and in the magnitude of the epicentral area.
Of the numerous time-records collected by Mr. Oldham, the best are those which were obtained from a few self-recording instruments, from the more busy telegraph offices, from the larger railway stations, and in some cases from private individuals. [276]All records were in the first place subjected to a rigid process of selection; a large number were rejected on various grounds, and those only were retained which bore internal evidence of accuracy, due either to the conditions of the reporter's occupation or to the care taken by him to ensure exactness. To guard against any unconscious bias in making the selection, this process was carried out before the distances were calculated, and even before the position of the epicentral area was known.
The boundary of this area is shown by the continuous line A in Fig. 68. Its greatest length being about 200 miles from east to west, it is necessary in the first place to fix upon an equivalent centre within it, which may be regarded for this special purpose as the point of departure of the earth-waves. The more natural course perhaps would be to assume this point to coincide with the centre of the area. But, as the rate at which the initial movement spread over that area would probably differ little from the velocity of the earth-wave, and as all the time-stations lie towards the west, Mr. Oldham regards a point near the western boundary of the area (in lat. 25° 45' N. and long. 90° 15' E.) as a sufficiently exact approximation to the position of the equivalent centre.
The nearest place at which good time-observations were made is Calcutta, distant 255.5 miles from the assumed centre. One is indicated on the recording tide-gauge by a sudden rise of the water, while the others were obtained from the central telegraph office, the terminal railway stations, and from two careful readings by interested observers. They vary from 4h. 27m. 0s. to 4h. 28m. 37s. P.M., all being liable to an error of half-a-minute. The arithmetic [277]mean for the beginning of the shock is 4h. 27m. 49s., and this is probably as accurate an estimate as the conditions allow.[70]
Bombay lies outside the disturbed area, 1208.3 miles from the equivalent centre; and, for the time of arrival in that city, we have to depend on the records of the barograph and the three magnetographs. The horizontal force magnet was set in motion two and a half minutes before the others, no doubt by the advance tremors. The times given by the barograph and the vertical force-instrument differ by only one minute, and the best result seems to be that obtained by taking their mean—namely, 4h. 35m. 43s., which is probably accurate to within a minute.
Assuming, then, that the time-interval between Calcutta and Bombay does not err by more than half-a-minute, it follows that the intervening velocity must lie between 2.8 and 3.2 kilometres per second, its probable value being 3 kilometres, or 2 miles, per second.
The remaining records, which are of less value than those obtained in these cities, fall into two groups, the first consisting of a number of stations along a line running north and south between Calcutta and Darjiling or within a hundred miles on either side of the same, and the second a long series of stations crossing Northern India in a nearly westerly direction. The observations made at the Burmese stations were unfortunately affected by an error arising from the retardation of the Madras [278]time-signals through frequent repetition along the line.
Individually, these records are not exact enough to be used in determining the velocity, but they may be employed collectively for the construction of the time-curve in Fig. 70. In this diagram, distances in hundreds of miles from the equivalent centre are represented along the horizontal line, and the time of occurrence in minutes past 4 P.M. along the perpendicular line. The small circles represent the observations at Calcutta and Bombay, the dots those at places lying nearly west of the origin, and the crosses those at places situated to the south or north-west. The continuous curve passes in an average manner through the series of points, and probably does not differ much from the true curve of the time of arrival of the shock at different places. The curve, it will be noticed, is at first concave, and afterwards convex, upwards; indicating that the times required to traverse successive equal distances at first increased, and then decreased. Thus, if the curve is an accurate representation of the facts, it would follow that the surface-velocity was subject to [279]a continual decrease outwards from the centre, until it was a minimum at a distance of about 280 miles, after which it increased.
The deviation of the curve from a straight line is, however, so slight that we cannot feel much confidence in this conclusion. If we join the points corresponding to Calcutta and Bombay by a straight line (drawn dotted in Fig. 70), it does not in any part vary from the continuous line by a distance equivalent to more than half-a-minute. Indeed, if a very few discordant records are excluded, and if less weight is given to those times which are multiples of five minutes, the straight line represents the mean quite as fairly as the curved line does; and that this is the more probable interpretation will appear from the observations on the unfelt earthquake described in the next section. We may therefore conclude that the earth-waves travelled along the surface at an approximately uniform rate of 3 kilometres per second, or about 120 miles a minute—a result which Mr. Oldham considers may be accepted as accurate to within five per cent.
If the two time-curves in Fig. 70 are continued to the right until they meet the time-scale, it will be seen that they intersect it near the point corresponding to 4.26 P.M., implying that this would be approximately the time at which the shock was felt within the epicentral area. This agrees closely with the observed times of about 4.25 at Parbatipur and Kuch Bihar, 4.26 at Siliguri, and 4.27 at Shillong and Goalpara; and it is probable that the error is not more than a quarter of a minute in defect or half-a-minute in excess. Thus, the time of arrival of the first sensible waves at the surface would lie between [280]4h. 25m. 45s., and 4h. 26m. 30s. P.M., Madras time, or between 11h. 4m. 45s. and 11h. 5m. 30s. A.M., Greenwich mean time.
Of the crowd of vibrations that agitate the ground during an earthquake, part only combine to form the perceptible shock. Some are insensible owing to their small amplitude, others to the slowness of the motion. An interesting observation belonging to the latter class was made by an engineer near Midnapur, a place which lies just within the area of damage. At the time of the earthquake, he was taking levels on a railway bank, and was about to take a reading when he noticed the bubble of the level oscillating. In five or ten seconds the shaking began and appeared to last three or four minutes; but, for more than five minutes after it had apparently ceased, the level showed that the ground continued to rock.
Again, in Burmah, at a place nineteen miles east of Tagaung and close to the border of the disturbed area, the water in a shallow tank, about 300 yards in length, was seen lapping up against the side in a manner that was at first attributed to elephants bathing. No shock was felt, but the shaking of the trees at the same time showed that the disturbance was due to the earthquake.
Far beyond the limits of the disturbed area, however, the earthquake was recorded by many of the delicate instruments which have been employed during the last few years for the registration of distant shocks. Among the more important of these instruments are long vertical pendulums, horizontal [281]pendulums of various forms, and magnetographs. In the vertical, and some of the horizontal, pendulums, especially in those used in the Italian observatories, the masses carried are heavy, and the movements of the ground are magnified by lightly-balanced levers ending in points which trace their records on bands of smoked paper driven by clockwork. In the other horizontal pendulums and in the magnetographs, the method of registration is photographic. The paper required for the mechanical records being inexpensive, a high velocity (half-an-inch or more per minute) can be given to it, and the resulting diagrams are open and detailed. The Italian instruments also respond more readily than the others to the earlier and slighter tremors: while the apparatus in which photographic methods are used are sometimes so violently disturbed by the later undulations that the spot of light fails to leave any trace on the photographic paper. It is therefore from the Italian observatories that the more interesting records come. One of these, given by a horizontal pendulum at Rocca di Papa near Rome, is reproduced in Fig. 71; while the curve of the bifilar pendulum at Edinburgh (Fig. 72) is a good example of those obtained by the photographic method of registration.[71]
All over Italy, from Ischia and Catania in the south to Pavia in the north, the different instruments employed began, one after the other, to write their [282]records of the movement as the unfelt earth-waves sped outwards from the centre. Italy passed, the tale was taken up by magnetographs at Potsdam and Wilhelmshaven, Pawlovsk (near St. Petersburg), Copenhagen, Utrecht, and Parc St. Maur (near Paris); by horizontal pendulums at Strassburg and Shide (in the Isle of Wight), and by a bifilar pendulum at Edinburgh. Shide is 4,891 miles from the centre of disturbance, but, as we shall see, the movement could be traced for a distance greater even than this.
In the more complete records, and especially in those given by the Italian apparatus, Mr. Oldham distinguishes three phases of motion. The first consists of rapid and nearly horizontal movements of the ground. In Italy, it begins at about 11.17 A.M.—that is, about 12½ minutes after the commencement of the shock at the epicentre (Fig. 71, a). Without any break in the movement, and after a further interval of about 8½ minutes, the second phase begins; the vibrations are similar to the preceding, but [283]they are larger and more open, and are accompanied by an unmistakable tilting of the surface of the ground (Fig. 71, b). Lastly, after the lapse of about twenty minutes more, the second phase gives place, without interruption, to the third (Fig. 71, c),[72] consisting of well-marked slow undulations, which have been aptly compared by Professor Milne to the movements caused by an ocean-swell. As they travelled across Europe, the surface of the ground was thrown into a series of flat waves, 34 miles in length, and 20 inches in maximum height, the complete period of each wave being 22 seconds. This phase is by far the longest of the three; in the more sensitive instruments, two or three hours elapsed before their traces ceased to show any sign of movement.
Knowing the distances of the different observatories [284]from the epicentre, and the times taken by each phase to reach them, we can form some idea of the rates at which they travelled. If the early tremors moved in straight lines, their mean velocity for the first phase was 9.0, and for the second 5.3, kilometres per second; but, if they moved along curved paths through the body of the earth, their mean velocities must have exceeded these amounts. For the first undulations of the third phase, the velocity would be 2.9 kilometres per second if they travelled along straight lines, and 3.0 kilometres per second if they were confined to the surface of the earth.
The existence of the second phase was noticed for the first time by Mr. Oldham in the records of the Indian earthquake, but he has since detected it in those of other shocks. He believes, in common with most seismologists, that the first phase corresponds to waves of elastic compression, or longitudinal waves, travelling through the body of the earth; and the second phase he attributes to waves of elastic distortion, or transversal waves, travelling in the same way, in which the particles move at right angles to the direction in which the wave travels, thus causing a slight tilting of the surface. It is probable that the waves of both phases move along curved, rather than straight, lines through the earth, that the curves are concave towards the surface, and that the velocity of the waves increases with the depth of their path below the surface.
On the other hand, the surface-velocity of the first undulations of the third phase is practically constant for all distances from the epicentre, and, in the case of the Indian earthquake, it agrees almost exactly with that obtained for the velocity within the [285]disturbed area, and as far as Bombay. It is therefore difficult to resist the conclusion that the third phase consists of undulations which travel along the surface of the earth. Diverging in two dimensions only, they fade away much more slowly than the vibrations of the other two phases.
We may thus imagine these surface-undulations speeding outwards from the epicentre in ever-widening circles until they have passed over a quarter-circumference of the earth, when they should begin to converge towards the antipodes. Here they should cross each other, and again spread out as circular waves, once more in their course passing the same observatories where they were first recorded, but in the opposite order. It has been reserved for the most violent earthquake of modern times to verify this interesting conclusion. Faint, but decided, are the traces of the second crossing. At Edinburgh, they occur at 2.6 P.M., at about the same time at Shide, at Leghorn 2.10, Catania 2.12¾, while at Ischia there are several movements between 2 and 3 P.M. At Rocca di Papa, near Rome, the time is slightly earlier, but the undulations, like those at the first crossing, have a complete period of about 20 seconds. The distances traversed by the waves are more than 20,000, instead of less than 5000 miles; but the mean velocity with which they travelled is almost exactly the same as at first—namely, 2.95 kilometres per second.
Earth-Fissures.—Among the superficial effects of the earthquake, none take a more important place [286]than the fissures formed in alluvial plains. Not only were they remarkably abundant, more so than in any other known earthquake, but they occurred over an unusually wide area. Wherever the necessary conditions prevailed, they were found to be numerous over a district bounded approximately by the isoseismal 1 (Fig. 68), and measuring about 400 miles from east to west, and about 300 miles from north to south; and they were present, though in smaller numbers, over an area nearly 600 miles long in an east-north-east and west-south-west direction. They were naturally more frequent near river-channels and reservoirs, on account of the absence of lateral support, and as a rule were parallel to the edge of the bank, a few hundred yards in length, and in width varying from some inches to four or five feet.
Fissures in such positions are formed with every violent earthquake, and even with some of those more moderate shocks that visit the British Islands (see p. 247). But an interesting point established by the Indian earthquake is that they also occurred at a distance from any water-channel or excavation, often running parallel to, and along either side of, a road or embankment. In other situations, they showed a distinct tendency to range themselves parallel to one another; and, in these cases, it is possible that their formation was connected with the passage of the visible surface-waves. In an account already quoted (p. 247), it is stated that these waves came from opposite directions and that, as they separated after meeting, the ground opened slightly.
Among the Khasi and Garo hills (see Fig. 75), wherever the alluvium of the plains runs up to the foot of the hills, another form of fissure, represented [287]in Fig. 73, was constantly noticed. Close to the junction, there was a sudden drop, as at a, of from one to five feet, the vertical face having the appearance of a fault, but distinguished from one by following the windings of the hills. Then came a depressed band b, from ten to twenty feet wide, and outside this a low rounded ridge c raised above its former level, and merging beyond at d into the undisturbed plain. When Mr. Oldham visited the district in March 1898, the natives had flooded the rice-fields, and the features described were clearly depicted by the gathering of the water in the depression and the isolation of the ridge.
The explanation of these peculiarities is evidently that given by Mr. Oldham. During the passage of repeated waves of compression, the thrust of the hill and plain against one another caused the heaping up of the alluvium in the ridge c; while the return movements resulted in the tearing of the alluvium away from the hillside, leaving the scarp a and the depression b.
Displacements of Alluvium.—Many other remarkable evidences of compression were observed. Telegraph posts, originally set up in a straight line, were displaced, occasionally as much as ten or fifteen feet; sometimes without any apparent connection with neighbouring river-channels. In one part of the Assam-Bengal Railway, for nearly half a mile, the whole embankment, including borrow-pits and trees [288]on either side, was shifted laterally without any sign of wrenching from the adjoining ground, the maximum distance amounting to 6¾ feet. As the displacement took place parallel to the only river-course in the neighbourhood, Mr. Oldham attributes it to the sliding of the surface-layers over some yielding bed beneath. Again, throughout large areas of Northern Bengal, Lower Assam, and Maimansingh, rice-fields, which had been carefully levelled so that they might be uniformly flooded, were thrown into gentle undulations, the crests of which were occasionally two or three feet above the hollows. The piers of bridges were also moved parallel to, as well as towards, the streams, showing that the displacements extended to the depth of the foundations.
The buckling of railway lines was often violent and took place over a large area. In the Charleston earthquake, every such bend was accompanied by a corresponding extension elsewhere (p. 113); but, in the Baluchistan earthquake of 1892, the neighbouring fish-joints were jammed up tight.[73] In the one case, there was merely local compression; in the other, a permanent displacement of the earth's crust. The distortion of the Indian lines seems to belong to the former class. Repairs were of course generally made without delay; but all the information that could be obtained on this point showed that the compression causing the crumpling of the lines was accompanied by a compensating expansion, generally at a distance of about 300 yards.
Sand-Vents.—Shortly after the earthquake, large quantities of water and sand issued from fissures in the ground. At Dhubri, "innumerable jets of water, [289]like fountains playing, spouted up to heights varying from 18 inches to quite 3½ or 4 feet. Wherever this had occurred, the land was afterwards seen to occupy a sandy circle with a depression in its centre. These circles ranged from 2 to 6 and 8 feet in diameter, and were to be seen all over the country. In some places, several were quite close together; in others they were at a distance of several yards." Near Maimansingh, they seem to have been almost as numerous, fifty-two, of four feet and less in diameter, being counted within an area 100 yards long and about 20 feet wide.
The sand and water were ejected from the vents with some force. A few observers estimated the height of the spouts at about 12 feet, but this probably refers to stray splashes. It is clear, however, that the sand and water were forced not only up to the surface, but even in a continuous stream to heights of from two to ten feet above it. In many districts, trunks of trees or lumps of coal and fossil resin were washed up with the water, and even, in one or two cases, pebbles of hard rock weighing as much as half-a-pound.
The origin of the sand-vents is to be sought in the presence of a water-bearing bed situated not far below the surface. In the central area, where there was a marked vertical component in the motion, this bed during the earthquake was compressed between those above and below it, and the resulting pressure was in places sufficient to force the water and sand, through the fissures formed by the earthquake, up to and beyond the surface. The gradual settling of the upper layer, cut up by the fissures, into the underlying quicksand, prolonged the process for some time after the shock was over; and, when the pressure was [290]at last relieved, some of the water was sucked back and so produced the crateriform hollows.
Rise of River-Beds, etc.—Over a large area, river-channels, tanks, wells, etc., were filled up, partly by the outpouring of the sand from vents, but chiefly, as shown by the forcing up of the central piers of bridges, by the elevation of the beds of the excavations. In the lowlands which lie between the Garo hills and the Brahmaputra, there were numerous channels from 15 to 20 feet in depth, the beds of which were pressed up until they became level with the banks, while a compensating subsidence took place close to the streams on either side. The general tendency of the earthquake was thus to obliterate the surface inequalities, so that, when the rivers rose later on, the district was extensively flooded.
Besides these deferred floods, there occurred immediately after the earthquake a sudden rise in many rivers, amounting to from two to ten feet, followed by a gradual decline to the former state in two or three days. At Gauhati, for instance, the river-gauge showed that, at about three-quarters of an hour after the earthquake, the water stood 7 feet 7 inches higher than on the morning of June 12th; at 7 A.M. on June 13th it had fallen to 5 feet 8 inches, and at the same time on the two following days to 2 feet 7 inches and 6 inches, showing that the water had returned nearly to its original level after the lapse of two and a half days.
In most of the large rivers, the rise of water was due to the formation of partial dams formed by the local elevation of the river-beds described above. As the barriers were composed of loose sand, they were gradually scoured away and the material was spread over the bottom so as to leave the water at a level [291]slightly higher than that which it maintained before the earthquake.
The distribution of landslips shows that their formation depends almost as much on local conditions as on the violence of the shock. The effect of the latter is manifested by their limitation to a certain central area. To the east of the North Cachar hills, few, if any, were to be seen; but, as far as Kohima, cracks or incipient landslips were formed on the hillsides. The Sylhet valley and a line to the west of Darjiling form the southern and western boundaries of the landslip area, which was therefore not less than 300 miles in length from east to west.
Within this area, however, local conditions asserted their superiority. Among the more important may be mentioned the constitution of the hills and the presence of a thick superficial layer of subsoil or rock with an inner bounding surface of weak cohesion, the slope of the hillsides, and their height from base to crest. Thus, though the epicentral area was situated chiefly to the south of the Brahmaputra valley (Fig. 75), the east and west range of the landslips was more extensive in the Himalayas on the north side than in the Garo and Khasi hills on the south. In many places, the steep sides of the Himalayan valleys exist always in a critical condition of repose, and the effect of the Indian earthquake was such that all along the north side of the Brahmaputra valley, the range is scarred by landslips, even to the east of Tezpur.
Again, along the southern edge of the Garo and Khasi hills, landslips were unusually prevalent. "Viewed from the deck of a steamer sailing up to [292]Sylhet," says Mr. Oldham, "the southern face of these hills presented a striking scene. The high sandstone hills facing the plains of western Sylhet, usually forest-clad from crest to foot, were stripped bare, and the white sandstone shone clear in the sun, in an apparently unbroken stretch of about 20 miles in length from east to west." At Cherrapunji, also, the deep valleys were so scored that, from a distance, there appeared to be more landslip than untouched hillside.
But in no part, probably, were landslips more strikingly developed than in the small valley of the Mahádeo, which forms an amphitheatre about four miles long from east to west, and a mile and a half across, lying to the south of the Bálpakrám and Pundengru hills. "Here," remarks Mr. Oldham, "everything combined to favour the formation of landslips. The hills were composed of soft sandstone, they were steep-sided, high, and narrow from side to side, and consequently were doubtless thrown into actual oscillation as a whole; while the range of motion of the wave particle was not less than eight inches near the edge of the precipices. The result ... has been to produce an indescribable scene of desolation. Everywhere the hillsides facing the valley have been stripped bare from crest to base, and the seams of coal and partings of shale could be seen running in and out of the irregularities of the cliffs with a sharpness and distinctness which recalled the pictures of the cañons of Colorado. At the bottom of the valley was a piled-up heap of débris and broken trees, while the old stream had been obliterated and the stream could be seen flowing over a sandy bed, which must have been raised many feet above the level of the old watercourse."
[293]In the sandstone districts of the area here considered, the landslips had some important secondary effects. Along the southern edge of the Garo and Khasi hills, great sand-fans spread over the fields, and the exposure of the hillsides formerly protected by forest left free scope for future denudation. Every stream of any size has in this way devastated many square miles of country. Among the hills themselves, more sand was brought down than the streams could carry away, and everywhere their beds were raised. "Ordinarily, the beds of these rivers, which are raging torrents when in flood, consist of a succession of deep pools separated by rocky rapids. After the rains of 1897, it was found that the pools had been filled up, and the rapids obliterated by a great deposit of sand, over which the rivers flowed in a broad and shallow stream."
A few valleys were for a short time barred across by landslips. In one, on the northern foot of the Garo hills, a landslip crossed the drainage channel and formed a shallow pond, which was not filled up by sand until the end of January 1898. Near Sinya, in the northern Khasi hills, an unusually large landslip formed a barrier, of which the remains are more than 200 feet above the level of the river-bed. Behind this, the water accumulated in a great lake until the beginning of September 1897, when the barrier burst and a flood of water rushed down the valley.
A curious effect of earthquakes strong enough to damage buildings is that pillars, monuments, etc., may be fractured and the upper part rotated over the [294]lower without being overthrown. Even in Hereford and the surrounding villages, several pinnacles and chimney-stacks were twisted by the earthquake of 1896. The interest of the phenomenon, which has been known, since 1755,[74] is mainly historical, for the endeavour to discover its cause was the origin of Mallet's views on the dynamics of earthquakes. Partly, also, it lies in the difficulty of finding a satisfactory explanation, or rather in deciding which of three or four possible explanations is the true one in any particular case.
The Indian earthquake offered exceptional opportunities for studying the phenomenon in the large number of examples observed and the variety of objects rotated. None could be more striking than the twisted monument to George Inglis, represented in outline in Fig. 74. Chhatak, where this is situated, lies close to the southern boundary of the epicentral area. The monument is an obelisk, built of broad flat bricks or tiles on a base of 12 feet square, and originally more than 60 feet high. It was split by the earthquake into four portions. The [295]two upper, about six and nine feet long, were thrown down; while the third, 22 feet high, remains standing, but is twisted through an angle of 30° with respect to the lowest part, which is unmoved. The upper of these two parts had evidently rocked on the lower, as the corners and edges were splintered, and below the fracture a slice of masonry about 15 inches thick, which was not bonded into the main mass, was split off by the pressure on its upper end. The plan of the parts still standing is shown in the lower part of Fig. 74.
The possible explanations of the phenomenon are at least three in number. According to the first, which was given by Mallet in 1846, the adhesion of the twisted portion to its base is not uniform, and the resultant resistance to motion is not in the same vertical plane as the wave-movement.[75] Some years later, Mallet offered another explanation. The body, he imagined, might be tilted on one edge by the earthquake, and, while still rocking, a second shock oblique to the first might twist it about that edge.[76] In 1880, Professor T. Gray suggested that the column might be tilted on one corner and then twisted round it by later vibrations of the same shock.[77]
None of these theories, Mr. Oldham argues, can give by itself a complete explanation of the phenomena observed in the central district of the Indian earthquake; and he therefore favours an extension of the second theory, which, though first proposed in 1882,[78] was thought out independently and in greater [296]detail by himself. When the focus is of considerable dimensions, the shock at neighbouring places is constantly varying in direction, owing to the arrival of vibrations from different parts of the focus. Thus, instead of the two separate shocks required by Mallet's second explanation, we have a number of closely successive impulses frequently changing in direction and giving rise to what is known in the South of Europe as a vorticose shock. And, instead of a single twist of the pillars about one centre only, we have a series of small twists round a number of different centres, accompanied in consequence by a much smaller displacement of the centre of gravity than would have occurred had the same rotation been accomplished in one operation.
The theory, it will be seen, accounts for the twisting of the pillar without overthrow, and for the splintering of the edges during the rocking of the column. It explains why in any district a number of similarly placed objects are generally twisted in the same direction. Moreover, a low column rocks to and fro more rapidly than a tall one similar in form and position, so that, at the instant when a later impulse comes from a different direction, two such columns might happen to be tilted on opposite edges, and would then be twisted in opposite directions. In certain cases, then, as occurred at several places during the Indian earthquake, an object may rotate in one direction, while others, similar in every respect but size, may be twisted in the opposite direction.
Frequency of After-Shocks.—For some days after the great earthquake, the after-shocks by their very [297]frequency and by their wide distribution baffled close inquiry. During the first 24 hours, hundreds were felt at all points of the epicentral area; indeed, it is not too much to say that for several days the ground was never actually at rest. At the Bordwar tea-estate, which is traversed by one of the great fractures to be described in the next section, the surface of a glass of water on a table was for a whole week in a constant state of tremor; and at Tura a hanging lamp was kept continually swinging for the first three or four days.
Most of these shocks were, of course, very slight; but, interspersed among them, were others of greater strength, and a few of considerable violence. One, on June 13th, about eight hours after the earthquake, was sensible beyond Allahabad—that is, for more than 520 miles from the epicentre; and another on the same day was felt in Calcutta, distant 255 miles. On June 14th, 22nd, and 29th, and again on August 2nd and October 9th, shocks were noticed in that city; but, after the latter date, the disturbed area of no shock reached to so great a distance.
To form any estimate of the total number of after-shocks is impossible, even for any one station. At first, lists were kept at isolated places, such as Shillong, Maimansingh, Dhubri, and a few others. Then, from July 15th, through Mr. Oldham's efforts, the records became more numerous until the end of the year, after which interest in the subject declined. Mr. Oldham's catalogue closes with the year 1898; but the register of a roughly-constructed seismograph, erected at Shillong in July 1897, continues to the present day.
Imperfect as all non-instrumental registers must be, [298]they nevertheless furnish some idea of the frequency of the after-shocks. Thus, until the end of June, 679 shocks were recorded at Rangmahal (North Gauhati), 135 at Maimansingh, 89 at Kuch Bihar, and 83 at Kaunia (omitting those on June 12th). Again, from August 1st to 15th, 182 were felt at Goalpara, 151 at Darangiri, 124 at Tura, 105 at Bijni, 94 at Lakhipur, 94 at Krishnai, 48 at Dhubri, 28 at Rangpur, and 12 at Kuch Bihar; while at Borpeta, 113 shocks were reported during the first nine days of August. Turning to the registers of longer duration, we find that at Maophlang (near Shillong) 1,194 shocks were felt by one observer from September 12th, 1897, to October 7th, 1898; at the neighbouring station of Mairang, 1,065 from September 7th, 1897, to December 31st, 1898; and at Tura, in the Garo hills, 1,145 shocks from July 21st, 1897, to December 31st, 1898. The total number of earthquakes registered by the seismograph at Shillong from August 1897 to the end of 1901 amounts to 1,274, and all of these were probably strong enough to arouse the observer from sleep. Outside the epicentral area, Mr. Oldham's list includes 88 shocks from June 12th to July 15th, about 950 from July 16th to December 31st (the period when the after-shocks were most carefully observed), and 296 shocks during the year 1898.
Geographical Distribution of After-Shocks.—When we endeavour to compare the lists of after-shocks at different places, we are at once met by two serious difficulties,—the imperfection of the records and the approximate character of the times of occurrence. Making every allowance, however, for these deficiencies, it is evident that very few of the [299]shocks felt at any one station were perceptible at its neighbours; in other words, that the shocks originated in a large number of foci scattered over a very wide area.
For instance, two of the most carefully kept registers of after-shocks are those compiled at Maophlang (near Shillong), and at Mairang, only 11 miles to the north-west. Now, between September 12th and September 28th, 1897 (both dates inclusive), 92 shocks were felt at Maophlang and 83 at Mairang. Of the former, 37 were described as smart, 45 slight, and 10 feeble; of the latter, 6 as smart, 9 slight, 65 feeble, and 3 very feeble. But, of the total number, only 20 were felt at both places at recorded times that were not more than fifteen minutes apart; 13 being described as smart—one at both places, one at Mairang alone, and the remaining 11 at Maophlang alone. When shocks occur so frequently, as in these cases, it is inevitable that, even if all were independent, some should coincide approximately in time of occurrence. It is therefore probable that only one in every eight shocks, and possibly only one in every twelve, was felt at both places.
The actual numbers of shocks felt within stated periods at different places are perhaps hardly comparable, owing to the obvious imperfection of the records and the probably varying standards adopted by the reporters. But there can be little doubt that certain districts were more subject to after-shocks than others, especially such places as North Guahati, Shillong, and neighbouring villages, Tura, Darangiri, Goalpara, Bijni, Borpeta, Kaunia, and Rangpur. On the other hand, they seem to have been unusually scarce at Dhubri and in the district to the north-west, [300]and they became rare at Gauhati long before they ceased to be frequent at Borpeta. In the plain to the south of the Garo and Khasi hills, they were also uncommon, the combined records for Sylhet and Sonamganj for August 1-15 giving only 20 shocks, and, neither to the east nor to the west of these places, is there any sign of greater frequency.
Sound-Phenomena of After-Shocks.—Many of the after-shocks were accompanied by sound, or else consisted of sound-vibrations only; and Mr. Oldham notices that such sounds were equally frequent both on the rocky ground of the hills and on alluvial plains nearly all the shocks that originated under the Borpeta plain being attended by distinctly audible rumblings.
During his tour in the epicentral area in the winter of 1897-98, Mr. Oldham had many opportunities for observing these earth-sounds. They were, he says, close to the lower limit of audibility, less a note than a rumble, and very like distant thunder, though sometimes they consisted of a rapid succession of short sounds, such as is caused by a cart when driven rapidly over a rough pavement. "As a rule, they began as a low, almost inaudible rumble, gradually increasing in loudness, though to a very varying degree, and then gradually dying out after having lasted anything from 5 to 50 seconds. It cannot be said that there was any connection between the duration and the loudness of the sounds, some of the most prolonged never becoming loud, and some of those which lasted a shorter period being as loud as ordinary thunder at a distance of two or three miles."
Mr. Oldham records an interesting fact in [301]connection with the distribution of the earth-sounds. At Naphak, in the Garo hills and about five miles south of Samin, 48 distinct rumbles were heard during 23 hours on January 21-23, 1898, only seven of them being accompanied by a perceptible shock. At Samin, which was visited next, they were much less frequent, not more than 8 or 10 a day, and most of them attended by tremors. At Damra, a few miles to the north-east, they again became frequent; while, in the Chedrang valley, very few were heard, and only a small proportion of them were unaccompanied by sensible shocks. In the next section, it will be seen that the most conspicuous fault-scarps known in the epicentral area pass close by Samin and along the Chedrang valley. Thus, though the statement perhaps requires further confirmation, it would appear that earth-sounds were more common where the surface of the ground had been merely bent than where fractures extended right up to the surface.
We come now to the important features which assign the Indian earthquake to a small class apart from nearly every other shock. Most earthquakes are due to movements that are entirely deep-seated. If strong enough, they may precipitate landslips or fissure the alluvial soil near river-channels. In the Neapolitan, Andalusian, and Charleston earthquakes, there were many such effects of the shock within the meizoseismal areas. In all three, however, the disturbances produced were superficial; no structural change, no fissuring that did not die out [302]rapidly downwards, was in any place perceptible. In the Riviera earthquake, the seismic sea-waves point to a small displacement of the ocean-bed; but it is only in the long fault-scarp of the central Japanese plain that we find a rival of the mountain-making movements that gave rise to the Indian earthquake.
The boundary of the epicentral area, to the growth of which these distortions contributed, is represented by the curve marked A in Fig. 68, and on a larger scale by the continuous line A in Fig. 75. A great part of the district is occupied by a group of hills known by various names locally, but which are conveniently included under the general term of the Assam range. To avoid the confusion of hill-shading, only the boundary of the range is indicated (by the broken line) in the map in Fig. 75. The Garo hills form the western part, and the Khasi and Jaintia hills the central and western parts, of the range as there depicted. They are formed chiefly of crystalline gneissic and granitic rocks and some metamorphic schists and quarzite, with cretaceous and tertiary rocks of varying thickness along its southern edge.
Three stages have been distinguished in the history of the range. During the earliest, an old land-surface was worn down by rain and rivers till they were almost incapable of producing any further change. Traces of this surface are still visible in the plateau character of the mass. It was then elevated, not uniformly, but along a series of faults, so that it now consists of a succession of ranges, the face of each range being a fault-scarp, and its crest the edge of an adjoining plateau sloping away from the [303]summit. With this elevation began the third and last stage. The streams were able to work again, and deep gorges were cut out of the range, so that in parts its original character was nearly effaced. But the retention of that character in other districts is [304]of course evidence of the comparatively recent date of the final elevation.
Owing to the great size of the epicentre and to the thickness of the forests which cover so much of its area, a comparatively small part of it could be traversed by Mr. Oldham during his tour in the winter of 1897-98. The positions of the more important structural changes are indicated in Fig. 75. Of these, the fault-scarps are represented by continuous straight lines, the Bordwar fracture by the dotted straight line, pools and lakes not due to faulting by black ovals, reported changes in the aspects of the hills by circles, and the principal stations of the revised trigonometrical survey by crosses.
Fault-Scarps.—The most important fault-scarp is that called by Mr. Oldham the Chedrang fault, after the stream which coincides roughly with a great part of its course. The longer straight line in Fig. 75 represents its position and general direction, and the sketch-map in Fig. 76 gives the plan of its southern half. From these, it will be seen that the fault follows on the whole a nearly straight path from south-south-east to north-north-west for not less than twelve miles, and that its throw, as indicated by the numbers to the right in Fig. 76; is very variable, being zero in some places, and in one as much as 35 feet or more. The upthrow is uniformly on the eastern side of the fault.
At its southern end, as mapped in Fig. 76, there is no perceptible throw at the surface, but various marks of violence are manifested in the fissuring of the hillside and the snapping of small trees. About a quarter of a mile from this point, the fault crosses a tributary stream, where the throw amounts to two feet, and the [305]same distance farther on it meets the Chedrang river, the bed of which it crosses many times in its short course.
Mr. Oldham describes the fault in detail, as observed by him in February 1898. Here, it will be sufficient to refer to its more important features, and to its effects on the superficial drainage of the district. At the spot marked a (Fig. 76) the river, after running on the west or down-throw side of the fault for nearly half a mile, meets the scarp, and is ponded back by it for about a quarter of a mile upstream. For the next half-mile, the river keeps to the upthrow side of the fault, the scarp of which blocks the tributary streams from the west, forming a number of small pools. At the last of these, the total throw is not less than 25 feet. A little farther on, the fault crosses the Chedrang and causes the waterfall at b, the height of which, owing to the fall of dislodged fragments, does not exceed nine feet. The fault then runs along the old and now dry bed of the river, while the stream itself flows in a depression on the down-throw [306]side. About a quarter of a mile below the waterfall, the fault crosses the river, and soon after enters a large sheet of water at c, half a mile long, from 300 to 400 yards wide, and with a maximum depth of 18 feet. At first, the pool spreads on both sides of the fault, but the inequalities due to the scarp are evidenced by soundings. At the point where the fault leaves the pool, its throw is reduced to nothing, and it is just here that the water attains its greatest depth. To the north the throw increases rather rapidly, to 25 feet in a quarter of a mile. But the peculiarity of this pool is that it is not, like the others mentioned above, dammed back by the fault-scarp. There is no barrier at its northern end, where the river escapes, except that formed by the gradually increasing throw of the fault. The pool is simply due to the reversal of the natural slope of the river-bed, caused by the formation of a roll or undulation in the ground on the upthrow side of the fault. Its recent origin is evident from the number of dead trees and bamboo clumps still standing in the water.
For a mile after the fault leaves the pool, its throw varies considerably. It rises, as already mentioned, from zero to 25 feet. A little farther on, the fault runs up the side of a spur, the throw increasing to 31 feet; and, in this part, the violence of the shock was shown by the dislodgment of blocks of granite as much as 20 feet in diameter, and by the overthrow or destruction of many trees. After crossing the spur, the fault returns to the neighbourhood of the river, and crosses its bed four times, forming pools (e, g) or waterfalls (d, f) according as the scarp occurs on the downstream or upstream side. The throw of the fault then changes considerably within little more than half a [307]mile, from 18 feet to zero and again to 20 feet, the undulation so formed producing a large pool (h) entirely on the upthrow side of the fault.
At the point marked i on the map, the river once more crosses the fault; but the bottom of the valley is filled with alluvium, and, instead of a waterfall, a large sandy delta spreads down the stream. The scarp is, however, readily traced on the east side of the river, a throw of 32 feet being measured. After this, the alluvium becomes of considerable thickness, and the continuation of the fault is marked by a short slope, which tilts over the trees when it traverses forest-land. Leaving the valley of the Chedrang, the fault crosses an open plain, and is followed with some difficulty to the neighbourhood of Jhira, where, owing to the thick bed of alluvium, it forms a gentle roll or undulation of the surface, crossing the main channel of the Krishnai to the north-east of Jhira. On the west side of this barrier a large sheet of water, a mile and a half in length, three-quarters of a mile wide, and 12 feet in depth, gathered over the village of Jhira. "On the east side of the Jhira lake," says Mr. Oldham, "there is ample evidence of change of level, for part of the dry land was formerly ... perpetually under water, and at one place the remains of an old irrigation channel can be seen.... At the northern end of the lake the drainage now makes its escape in a broad and shallow sheet of water over what was once high land covered with sal forest."
This is the last marked feature due to the Chedrang fault. Beyond the north of Jhira the throw rapidly diminishes, and perhaps dies out altogether before reaching the low hills lying to the north of that village.
[308]In several ways, this fault-scarp differs from that formed with the Japanese earthquake of 1891. Throughout its course the down-throw, wherever it is perceptible, is invariably to the west; in no place could any trace of horizontal shifting be detected; and the plane of the fault, when it traversed rock, is practically vertical.
Whether the scarp was formed by the elevation of the rock to the east of the fault, or by the depression of that to the west, or by both such movements at once, there is no decisive evidence; but there are very good reasons for believing the first alternative to be the true one. The undulations in the ground which gave rise to the large pools at c and h (Fig. 76) occur on the east side of the fault. Also, between the outlet of the lake at Jhira and the point where the Krishnai rejoins its original channel, the gradient of the river approaches that of a mountain stream, although the new bed consists of alluvium, and not of rock. Now, the alluvial plain of this district is raised so slightly above the sea-level that no subsidence great enough to have caused the existing gradient could have occurred without the depressed area being flooded with water. Though some movements may have taken place on the west side of the fault, it seems clear, then, that elevation of the rock on the east side was the predominant, if not the sole, cause of the fault-scarp.
As the Chedrang fault has been described somewhat fully, a brief reference to the rest will be sufficient The only other known scarp of any consequence lies about ten miles to the south of the Chedrang fault, and runs by the village of Samin, with an average course from E. 30° S. to W. 30° N. [309]Its total length does not exceed 2½ miles. The down-throw is uniformly to the north, and the throw, which amounts to ten feet near its centre, gradually diminishes to zero at either end. Several pools are formed along the course of the fault-scarp by the blocking of small streams.
The Bordwar Fracture.—In the map of the epicentral area (Fig. 75), this remarkable fracture is represented by a dotted straight line. It is apparently an incipient fault. Though traceable for a distance of about seven miles, at no point is there any decisive evidence of either vertical or horizontal displacement; and, even if some doubtful indications of a change of level should be real, the throw must certainly be less than one foot. Yet, in the immediate neighbourhood of the fracture, the violence of the shock was extreme. "Trees have been overthrown or killed as they stood; a huge mass of rock, dislodged from near the crest of the hills, has rolled down the slope, scoring the side of the hill. On the opposite side an equally large block has been dislodged, and in its downward course cleared a straight track down the hill; and on the summit a gap has been cleared by the overthrow of trees along the line of fracture." Being only a few inches in width where it has rent the solid rock, the fracture was difficult to follow in many parts of its course. But, through forest-clad land, its track was marked by "a well-defined band of about half a mile broad, in which overturned trees are much more abundant than on either side, and towards the centre of this band the overturned trees are not only more numerous, but many of the smaller ones, up to six inches in diameter, have been snapped across by the violence of the shock."
[310]Lakes and Pools not due to Faulting.—A few miles to the south of the Chedrang and Samin faults, and also of the Bordwar fracture, occurs a group of lakes or pools, represented on the map of the epicentral area (Fig. 75) by small black ovals. In the gradual increase in depth from either end, they resemble the two large sheets of water along the course of the Chedrang fault (c and h, Fig. 76), but they differ from them in having no direct connection with any apparent fault.
One of these pools lies in the valley of the Rongtham river, to the south of the Samin fault. It seemed, at first sight, to be nothing more than an ordinary pool, such as may be seen on any mountain stream. On the bottom, and close to the outlet, however, are coarse, partially rounded boulders, exactly resembling those farther down the river; and, as the old bed was followed up, these became coated with a slight deposit of sand and mud, pointing clearly to a change in the conditions under which they were formed. The water gradually deepened, until trees were met standing in the water, but killed by the recent submergence of their roots. The pool is nearly a quarter of a mile long, and its greatest depth (12 feet) occurs near the middle, just where the former stream, with an average depth of about a foot, was crossed by the track from Darangiri. Towards the upper end, the water shallows as gradually as it deepens at the other, and ends in a delta of boulders brought down by the stream above. As no fault could be discovered in the neighbourhood of the pool, it is evident that its formation was due to a bend of the river-bed, the maximum change of level, taking into account the river-slope, being not less than 24 feet.
[311]Similar features characterise the other pools that were examined, some of which are smaller, and others larger, than that described above. One, higher up the valley of the Rongtham, has a length of about 1½ mile and a maximum depth of 18 feet. Others of the same type, but of smaller size, were observed among the Khasi hills, about fifteen miles south of the Bordwar fissure; and it is probable that many others would have been found in the intermediate district, which Mr. Oldham was unable to visit.
Changes in the Aspects of the Hills.—There are, again, other facts of considerable interest which point to changes of level over a wide area; the places where they were noticed being indicated by small circles in Fig. 75. For instance, from Maophlang, near Shillong, a road leads to the neighbouring station of Mairang. Before the earthquake, only a short stretch of this road could be seen from the former place, as it rounded a spur about three miles away. Now, a much longer stretch is visible, and it can also be seen passing round the next, and previously hidden, spur. In this district the movements seem to have continued with the after-shocks; for, before the earthquake, the crest only of a ridge about a mile and a half to the west was visible; while, after it, a considerable portion could be seen, and much more some months later than immediately after the shock.
Again, from a spot near the southern end of the Chedrang fault, it used to be only just possible to see the Brahmaputra over an intervening hill; whereas, now, the whole width of the river has come into view.
Lastly, at Tura, which is 95 miles west of Maophlang, a battalion of military police were accustomed to signal by heliograph with another station, Rowmari, [312]15 miles farther to the west. This, formerly, could just be done by means of a ray which grazed a hill between the two places; it can now be done quite easily, and, in addition, a broad stretch of the plains east of the Brahmaputra is visible from the same spot.
Revision of the Trigonometrical Survey.—The movements described in the preceding pages are of course referred to points which may themselves have been displaced, and only a revision of the trigonometrical survey of the epicentral area and of part of the surrounding district could determine their absolute magnitude. During the cold weather of 1897-98, some of the triangles were re-measured by a member of the trigonometrical survey; but, as the time at his disposal was short, they were confined to the eastern part of the epicentral area, as the focus at that time was supposed to lie under the Khasi hills. The positions of some of these stations are indicated by crosses in Fig. 75; and in Fig. 77 the more important triangles are shown. In the revised work, all tower stations, consisting of brick towers built on alluvium, were omitted, as it could not be assumed that they had been undisturbed by displacements of the superficial beds.
In re-calculating the lengths of the sides, the side Rangsanobo-Taramun Tila was adopted as the initial base, and the height of Rangsanobo as the initial height; a choice which later experience showed to be unfortunate, for Taramun Tila probably lies just outside, and Rangsanobo within, the epicentral area. Of the 16 sides, whose old and new lengths were compared, only one was found to be apparently unchanged, two were shortened by an inch or two, while [313]the others were all lengthened by amounts varying from one to eight or nine feet, the numbers affixed to the sides in Fig. 77 denoting the calculated increases in feet. Assuming the new base-line to be unaltered by the earthquake movements, these changes imply the following displacements of the principal stations:—Thanjinath 6 feet, Mun 4, and Laidera 2, feet to the north; Mopen 5, Dinghei 9, Landau Modo 12, and Umter 11, feet to the north-west; and Mosingi 3, and [314]Mautherrican 5, feet to the west. At the same time, the height of most of the stations was found to be increased with reference to that of Rangsanobo: Mun by 2 feet, Thanjinath and Umter by 3, Mosingi by 4, Taramun Tila and Laidera by 6, Dinghei by 7, Landau Modo by 17, and Mautherrican by 24, feet; while the height of Mopen seems to have been diminished by 4 feet. Thus, at first sight, these calculations appear to indicate "a general elevation and extension of the hills, such as might follow on a bulging upwards of the surface due to the extension of a large mass of molten matter underground."
Unfortunately, as Mr. Oldham shows, a very different, and more probable, interpretation may be given of these results; for all the calculated changes are rendered uncertain by the choice of the two stations which form the ends of the new base-line. One at least may have been displaced by the structural movements within the epicentral area; and, moreover, the line joining them runs nearly north and south. As compression in this direction is to be expected, it is probable that this line was shortened; and the assumption that its length was unchanged would therefore lead to an apparent expansion of all the other sides.
The calculated changes seem to favour this explanation to a great extent. The sides joining Mopen, Rangsanobo, and Thanjinath run nearly east and west, and are apparently lengthened by 4.9 and 3.4 feet respectively; while, of the four sides joining these stations to Mosingi and Mun, lying next to the north, two are nearly or quite unchanged, and the others increased by 2.3 and 3.2 feet. Again, the estimated increase of the Mosingi-Mun line is 4.4 feet; while the [315]four sides joining these stations to the next northerly group are increased by small amounts—namely, 1.2, 2.6,-0.3, and 2.4 feet. Thus, the apparent expansion that should have occurred in these more or less northerly sides is lessened, or roughly compensated, probably by a compression of the whole region in a meridianal direction.
For a similar reason, the slight general upheaval of the hills indicated by the repeated calculations, must be regarded as doubtful, for it depends on the assumed fixity of the station of Rangsanobo, whereas it is more probable that it was the height of Taramun Tila that remained unchanged. Reducing the calculated heights of all the other stations by six feet (the assumed rise of the latter), it follows that, on the whole, the height of the Khasi hills underwent but little change, except at Mautherrican and Landau Modo, and the secondary stations of Mairang and Kollong Rock, near Maonoi. The apparent elevations of 24, 17, 11, and 15 feet at these places exceed the probable error of the observations; and it is worthy of notice that all four stations lie close to the edge of fault-scarps, while Landau Modo is not far from two of the pools formed by distortion of the surface unaccompanied by faulting.
If, then, the revised triangulation of the Khasi hills has failed to provide absolute measures of the displacements in the epicentral area, it has, nevertheless, proved that important movements, both horizontal and vertical, have taken place.
Distribution of the Structural Changes.—The boundary of the epicentral area, as drawn in Figs. 68 and 75, lays no claim to great accuracy; but its departure from the true line is probably in no place [316]considerable. It must evidently include all the districts where marked structural changes occurred, and must therefore extend east of Maophlang and west of Tura. Towards the north, these changes have been traced to the foot of the Garo hills, and there is some, though not very certain, evidence of alterations of level along the course of the Brahmaputra. The very large number of after-shocks recorded at Borpeta and Bijni also points to an extension of the epicentral area beyond these places. To the east, the course of the boundary becomes doubtful, but it must pass close to Gauhati and east of Shillong, and probably ends a short distance beyond Jaintiapur. The southern boundary must coincide nearly with the north edge of the alluvial plains of Sylhet, for there is no evidence of its intrusion into the plains. On the west side, the epicentral area includes the Garo hills and part of the alluvial plain to the west; and, from the large number of after-shocks felt at Rangpur and Kaunia, and the great violence of the shock at the former, we may infer that both places lie within the boundary-line. If, then, there is no great error in the mapping of this line, it follows that the epicentre was about 200 miles long from east to west, not less than 50, and possibly as much as 100, miles in maximum width, and contained an area of at least 6000 square miles.
Near the boundary, the permanent displacements must have been comparatively small; but they were certainly marked in the northern part of the Assam hills for a distance of 100 miles from east to west. At the limits of the latter area, as Mr. Oldham remarks, "the evidence points to the changes being of the nature of long, low rolls, the change of slope being [317]insufficient to cause any appreciable change in the drainage channels. Then comes a zone in which the surface changes are more abrupt, the slopes of the stream beds have been altered so as to cause conspicuous changes in the nature of the streams, but any fracture or faulting which may have taken place has died out before the surface was reached. And north of this, close to the edge of the hills, the rocks have been fractured and faulted right up to the surface."
Almost every feature of the great earthquake points to an origin very different from that of the others described in this volume. The suddenness with which the shock began, its unusual duration, and the occurrence of many maxima of intensity, are inconsistent with a simple fault-displacement. Again, the excessive velocities of projection at Rambrai and elsewhere, the existence of isolated fault-scarps and fractures, the local changes of level, the compression indicated by the revised trigonometrical survey, the wide area over which these structural changes took place, and the numerous distinct centres of subsequent activity, all these phenomena demonstrate the intense and complex character of the initial disturbances, as well as the widespread bodily displacement of the earth's crust within the epicentral area. There may, it is conceivable, have been a number of foci, nearly or quite detached from one another, and giving rise to a group of nearly concurrent shocks. Or—and this is a far more probable supposition—there may have been one vast deep-seated centre, from which off-shoots ran up towards the surface, each partaking [318]to a greater or less degree in the movement within the parent focus.
As Mr. Oldham points out, we have recently become acquainted with a structure exactly corresponding to that which is here inferred. The great thrust-planes, so typically developed in the Scottish Highlands, are only reversed faults which are nearly horizontal instead of being highly inclined; and they are accompanied by a number of ordinary reversed faults running upwards to the surface. In Fig. 78, the main features of a section drawn by the Geological Survey of Scotland are reproduced; T, T, representing thrust planes, and t, t, minor thrusts or faults. A great movement along one of the main thrust-planes would carry with it dependent slips along many of the secondary planes. Direct effects of the former might be invisible at the surface, except in the horizontal displacements that would be rendered manifest by a renewed trigonometrical survey; whereas the latter might or might not reach the surface, giving rise in the one case to fissures and fault-scarps, in the other to local changes of level, and in both to regions of instability resulting in numerous after-shocks.
The enormous dimensions of the parent focus will be obvious from the phenomena that have been [319]described above. Mr. Oldham has traced the probable form of the epicentre. It may in reality be neither so simple nor so symmetrical as is represented in Fig. 75, but there are good reasons for thinking that it does not differ sensibly either in size or form from that laid down. The part of the thrust-plane over which movement took place must therefore have been about 200 miles long, not less than 50 miles wide, and between 6000 and 7000 square miles in area. With regard to its depth, we have no decisive knowledge. It may have been about five miles or less; it can hardly have been much greater.
It is a strain on the imagination to try and picture the displacement of so huge a mass. We may think, if we will, of a slice of rock three or four miles in thickness and large enough to reach from Dover to Exeter in one direction and from London to Brighton in the other; not slipping intermittently in different places, but giving way almost instantaneously throughout its whole extent; crushing all before it, both solid rock and earthy ground alike; and, whether by the sudden spring of the entire mass or by the jar of its hurtling fragments, shattering the strongest work of human hands as easily as the frailest. Such a thrust might well be sensible over half a continent, and give rise to undulations which, unseen and unfelt, might wend their way around the globe.
1. Agamennone, G.—"Notizie sui terremoti osservati in Italia durante l'anno 1897 (Terremoto dell' India poco dopo il mezzogiorno del 12 giugno)." Ital. Sismol. Soc. Boll., vol. iii., pte. ii., 1897, pp. 249-293.
[320]2. —— "Il terremoto dell' India del 12 giugno 1897." Ibid., vol. iv., 1898, pp. 33-40.
3. —— "Eco in Europa del terremoto indiano del 12 giugno 1897." Ibid., vol. iv., 1898, pp. 41-67. (See also the same volume, pp. 167-172.)
4. Baratta, M.—"Il grande terremoto indiano del 12 giugno 1897." Ital. Soc. Geogr. Boll., vol. x., 1897, fasc. viii.
5. Cancani, A.—"I pendoli orizzontali del R. Osservatorio geodinamico di Rocca di Papa, ed il terremoto indiano del 12 giugno 1897." Ital. Sismol. Soc. Boll., vol. iii., 1897, pp. 235-240.
6. Heath, T.—"Note on the Calcutta Earthquake (June 12th, 1897) as recorded by the bifilar pendulum at the Edinburgh Royal Observatory." Edinb. Roy. Soc. Proc., 1897, pp. 481-488.
7. Oldham, R.D.—"Report on the Great Earthquake of 12th June 1897." Mems. Geol. Surv. of India, vol. xxix., 1899, pp. i.-xxx., 1-379, with 44 plates and 3 maps.
8. —— "List of After-shocks of the Great Earthquake of 12th June 1897." Ibid., vol. xxx., pt. i., 1900, pp. 1-102.
9. —— "On Tidal Periodicity in the Earthquakes of Assam." Journ. Asiat. Soc., vol. lxxi., 1902, pp. 139-153.
[69] According to some reports, the earthquake was felt in Italy. At Livorno, the first movements were registered by seismographs at 11.17 A.M. (G.M.T.), and tremors were noticed by some persons at rest at about 11.15 A.M. At Spinea, a sensible undulatory shock from south-east to north-west, and lasting about four seconds, was felt at the moment when all the seismographs were set in motion by the Indian earthquake. In spite of the great distance, the perception of the earthquake in Italy is not impossible, but the records seem to me to refer to local tremors rather than to the very slow evanescent oscillations of a very distant earthquake.
[70] All the times in this section are referred to Madras mean time, which is 5h. 20m. 59.2s. in advance of Greenwich mean time. In the next section it will be found convenient to use the latter standard.
[71] It may be useful to give references to works in English in which the principal instruments for registering distant earthquakes are described. For Cancani's vertical pendulum, see Brit. Assoc. Rep., 1896, pp. 46-47; Darwin's bifilar pendulum, Brit. Assoc. Rep., 1893, pp. 291-303, and Nature, vol. 1., 1894, pp. 246-249; Milne's horizontal pendulum, Seismology, pp. 58-61; Rebeur-Paschwitz's horizontal pendulum, Brit. Assoc. Rep., 1893, pp. 303-308.
[72] The beginnings of the second and third phases are shown more clearly in the record of the vertical pendulum at Catania, a record, however, that will not bear the reduction necessary for these pages.
[73] Geol. Mag., vol. x., 1893, pp. 356-360.
[74] Irish Acad. Trans., vol. xxi, 1848, p. 52.
[75] Irish Acad. Trans., vol. xxi., 1848, pp. 55-57.
[76] Neapolitan Earthquake of 1857, vol. i., 1862, pp. 376-378.
[77] Japan Seismol. Soc. Trans., vol. i., pt. II., 1880, pp. 33-35.
[78] Geol. Mag., vol. ix., 1882, pp. 257-265.
In this concluding chapter, I propose to give a summary of the results at which we have arrived from the study of recent earthquakes, and this can, I think, be done best by describing what may be regarded as an average or typical earthquake, though it may be convenient occasionally to depart slightly from such a course. Few shocks have contributed more to our knowledge than the majority of those described in this volume; but, on certain points, we gain additional information from the investigation of other earthquakes, and these are referred to when necessary for the purpose in view.
At the outset, we are met by a question of some interest and great practical importance—namely, whether there are any constant signs of the coming of great earthquakes by means of which their occurrence might be predicted and their disastrous effects mitigated.
Excluding the Ischian earthquakes, which belong to a special class, it is evident that there is generally some slight preparation for a great earthquake. For a few hours or days beforehand, weak shocks and tremors are felt or rumbling noises heard within the [322]future meizoseismal area. But, unfortunately, it has not yet been found possible to distinguish these disturbances from others of apparently the same character which occur alone, so that for the present they fail to serve as warnings.
In Japan, where the organisation of earthquake-studies is more complete than elsewhere, it is possible that a vague forecast might be made, if the distribution of the fore-shocks of the earthquake of 1891 should prove to be a general feature of all great earthquakes. It was at first supposed that this earthquake occurred without preparation of any kind; but a closer analysis of the records shows that during the previous two years there was a very decided increase in the seismic activity of the district, and also that the distribution of the epicentres marked out the future fault-scarp, and at the same time exhibited a tendency to comparative uniformity over the whole fault-region.
For the present, then, the only warning available is that given by the preliminary sound, which may precede the strongest vibrations by as much as five or ten or even more seconds. Though two or three seconds may elapse before its character is recognised, the fore-sound thus allows time for many persons to escape from their falling houses. Some races, however, are less capable of hearing the sound than others, and this may be one reason why Japanese earthquakes are so destructive of human life.
It is usual with some investigators to measure the intensity of an earthquake roughly by the extent of [323]its disturbed area. The depth of the seismic focus must of course have some influence on the size of this area, and this condition is only neglected because we have no precise knowledge of the depth in any case. Thus, Mr. Oldham regards the Indian earthquake of 1897 as rivalling the Lisbon earthquake of 1755, which is generally considered to hold the first place, because its disturbed area was not certainly exceeded by that of the latter.
That disturbed area is, however, an untrustworthy measure of intensity will be evident from the following table, in which the earthquakes described in this volume (omitting those of Ischia) are arranged as nearly as may be in order of intensity, beginning with the strongest:—
| Earthquake. | Disturbed Area in Sq. Miles. |
| Indian | 1,750,000 |
| Japanese | 330,000 |
| Neapolitan | 39,200 |
| Charleston | 2,800,000 |
| Riviera | 219,000 |
| Andalusian | 174,000 |
| Hereford | 98,000 |
| Inverness | 33,000 |
Here we see that the Charleston earthquake was perceptible over a greater area than the Indian earthquake, while the Neapolitan earthquake was inferior to that of Hereford in this respect. The explanation of course is that the boundaries of the disturbed areas are isoseismal lines corresponding to different degrees of intensity, the inhabitants of Great Britain and the United States being evidently more sensitive to weak tremors, or more observant, than [324]those of Italy, Spain, or Central Asia. The only disturbed areas that are bounded by isoseismals of the same intensity are the two last. Very roughly, then, we may say that the intensity of the Hereford earthquake was three times as great as that of the Inverness earthquake.
One of the first objects in the investigation of an earthquake is to determine the position and form of the epicentre. In a few rare cases, as in the Japanese and Indian earthquakes, when the fault-scarp is left protruding at the surface, only careful mapping is required to ascertain both data. But, in the great majority of earthquakes, the fault-slip dies out before reaching the surface and the position of the epicentre is then inferred by methods depending chiefly on the time of occurrence or on the direction or intensity of the shock.
At first sight, methods that involve the time of occurrence at different places seem to be of considerable promise. No scientific instruments are so widely diffused as clocks and watches; but, on the other hand, few are so carelessly adjusted. It is the exception, rather than the rule, to find a time-record accurate to the nearest minute; and, as small errors in the time may be of consequence, methods depending on this element of the earthquake are seldom employed. If, however, the number of observations is large for the size of the disturbed area, the construction of coseismal lines may define approximately the position of the epicentre. In the Hereford earthquake of 1896, the centre of the innermost [325]coseismal line (Fig. 62) is close to the region lying between the two epicentres.
The method of locating the epicentre by means of the intersection of two or more lines of direction of the shock was first suggested by Michell in 1760,[79] and has been employed by Mallet in investigating the Neapolitan earthquake, by Professors Taramelli and Mercalli in their studies of the Andalusian and Riviera earthquakes, as well as by other seismologists. The diversity of apparent directions at one and the same place caused its temporary neglect, until Professor Omori showed in 1894 that the mean of a large number of measurements gives a trustworthy result (p. 19). His interesting observations should reinstate the method to its former place among the more valuable instruments at the disposal of the seismologist.
No observations, however, are at present so valuable for the purpose in view as those made on the intensity of the shock. For many years, it has been the custom to regard the epicentre as coincident with the area of greatest damage to buildings; and, when the area is small, the assumption cannot be much in error. It is of course merely a rough way of obtaining a result that is generally given more accurately by means of isoseismal lines; but there are exceptional cases, such as the Neapolitan and Ischian earthquakes, when the destruction wrought by the earthquake furnishes evidence of the greater value.
A single isoseismal accurately drawn not only gives the position of the epicentre with some approach to exactness, but also by the direction of its longer axis determines that of the originating fault. When two [326]or three such lines can be traced, the relative position supplies in addition the hade of the fault (p. 219). The successful application of the method requires, it is true, a large number of observations, and these cannot as a rule be obtained except in districts that are somewhat thickly and uniformly populated, such as those surrounding the cities of Hereford and Inverness. In the Charleston earthquake, also, the position and form of the epicentres were deduced from the trend of isoseismal lines based on the damage to railway-lines and various structures within a sparsely inhabited meizoseismal area.
In a few cases, of which the Indian earthquake may be regarded as typical, a fourth method has recently been found of service. The numerous after-shocks which follow a great earthquake originate for the most part within the seismic focus of the latter; and, as they usually disturb a very small area, it is not difficult to ascertain approximately the positions of their epicentres. Some, as in the Inverness after-shocks of 1901, result from slips in the very margin of the principal focus; but, as a rule, the seat of their activity tends to contract towards a central region of the focus. Bearing in mind, then, that some of the succeeding shocks originate at and beyond the confines of the focus, and that others may be sympathetic shocks precipitated by the sudden change of stress, it follows that the shifting epicentres of the true after-shocks map out, in part at any rate, the epicentral area of the principal earthquake.
It is much to be regretted that we have no satisfactory method of determining so interesting an [327]element as the depth of the seismic focus. That it amounts to but a few miles at the most is certain from the limited areas within which slight shocks are felt or disastrous ones exhibit their maximum effects. Nor can we suppose that the rocks at very great depths are capable of offering the prolonged resistance and sudden collapse under stress that are necessary for the production of an earthquake.
The problem is evidently beyond our present powers of solution, and its interest is therefore mainly historical. All the known methods are vitiated by our ignorance of the refractive powers of the rocks traversed by the earth-waves. But, even if this ignorance could be replaced by knowledge, most of the methods suggested are open to objection. Falb's method, depending on the time-interval between the initial epochs of the sound and shock, is of more than doubtful value. Dutton's, based on the rate of change of surface-intensity, is difficult to apply, and in any case gives only an inferior limit to the depth. Time-observations have been employed, especially in New Zealand; but the uncertainty in selecting throughout the same phase of the movement, and the large errors in the estimated depth resulting from small errors in the time-records, are at present most serious objections. There remains the method devised by Mallet, and, though he claimed for it an exaggerated accuracy, it still, in my opinion, holds the field against all its successors. When carefully applied, as it has been by Mallet himself, by Johnston-Lavis and Mercalli, we probably obtain at least some conception of the depth of the seismic focus.
Professor Omori and Mr. K. Hirata have recently[80] [328]lessened the chief difficulty in the application of Mallet's method. They have deduced the angle of emergence from the vertical and horizontal components of the motion as registered by seismographs, instead of from the inclination of fissures in damaged walls. In two recent earthquakes recorded at Miyako in Japan, they find the angle of emergence to be 7.2° and 9° respectively, the corresponding depths of the foci being 5.6 and 9.3 miles. These are probably the most accurate estimates that we possess, and it will be noted that they differ little from the mean values obtained for the Neapolitan, Andalusian, and Riviera earthquakes—namely, 6.6, 7.6, and 10.8 miles.
In one respect, the earthquakes described above fail to represent the progress of modern seismology. They furnish no diagrams made by accurately constructed seismographs within their disturbed areas. The curve reproduced in Fig. 36, as already pointed out, is no exception to this statement. For another reason, the records that were obtained in Japan of the earthquake of 1891 are trustworthy for little more than the short-period initial vibrations; for, owing to the passage of the surface-waves, visible in and near the meizoseismal area, the Japanese seismographs registered the tilting of the ground rather than the elastic vibrations that traversed the earth's crust.
Notwithstanding this defect, personal impressions of an earthquake-shock give a fairly accurate, if incomplete, idea of its nature. Nearly all observers placed under favourable conditions agree that an earthquake begins with a deep rumbling sound, [329]accompanied, after the first second or two, by a faint tremor which gradually, and sometimes rapidly, increases in strength until it merges into the shock proper, which consists of several or many vibrations of larger amplitude and longer period, and during which the attendant sound is generally at its loudest; the earthquake dying away, as it began, with tremors and a low rumbling sound.
The vibrations that produce the sensible shock are by no means all that are present during an earthquake. The Indian earthquake, for instance, seemed to last about three or four minutes at Midnapur; but the movements of the bubble of a level showed that the ground continued to oscillate for at least five minutes longer (p. 280). Many of these unfelt waves are rendered manifest by seismographs, although there are still others that elude registration either from the extreme shortness or the great length of their periods.
[330]In Fig. 79 is shown the principal part of a diagram obtained at Tokio during the Japanese earthquake of June 20th, 1894 (p. 18), the curve representing the N.E.-S.W. component of the horizontal motion during the first 25 seconds of the record. The instrument employed is one specially designed for registering strong earthquakes, and is unaffected by very minute tremors. Those which formed the commencement of this earthquake lasted for about 10 seconds, as shown by ordinary seismographs, and the vibrations had attained a range of a few millimetres before they affected the instrument in question. For the first 2½ seconds, they occurred at the rate of four or five a second. The motion then suddenly became violent, and the ground was displaced 37 mm. in one direction, followed by a return movement of 73 mm., and this again by one of 42 mm., the complete period of the oscillation being 1.8 seconds. The succeeding vibrations were of smaller amplitude and generally of shorter period for a minute and a half, then dying out during the last three minutes as almost imperceptible waves with a period of two or more seconds.[81]
Though incomplete in some respects, this diagram illustrates clearly the division of the earthquake-motion into three stages—namely, the preliminary tremors, the principal portion or most active part of an earthquake, and the end-portion or gradually evanescent slow undulations. In all three stages, however, both tremors and slow undulations may be present; and, as the latter, owing to their long period, [331]are more or less insensible to human beings, the ripples of the final stage give the impression of a tremulous termination as described above. The duration of each stage varies considerably in different earthquakes. Thus, in a valuable study of 27 earthquakes recorded at Miyako, in Japan, during the years 1896-98, Messrs. Omori and Hirata show[82] that the duration of the preliminary stage varies from 0 to 26 seconds, with an average of about 10 seconds; that of the principal portion from 0.7 to 26 seconds, also with an average of about 10 seconds; and that of the end portion from 28 and 105 seconds, with an average of about one minute. The total apparent duration, however, depends on the instrument employed; one of the earthquakes, that of April 23rd, 1898, disturbing the seismograph at Miyako for two minutes; while, at Tokio, a horizontal pendulum designed by Professor Omori oscillated for at least two hours. The periods of both ripples and slow undulations, again, vary from one earthquake to another; but it is worthy of notice that the average period of the undulations is almost constant in all three stages of the motion, being 1.1, 1.3, and 1.3 seconds, respectively, for the east-west component of the horizontal motion, and 1.0 second throughout for the north-south component. For the ripples, the average period is .08 second in the preliminary stage, .10 second in the principal portion, and .08 second again in the end portion; those of the principal portion being slightly larger in amplitude, as well as longer in period, than the ripples of the first and third stages.
[332]Besides the ripples already mentioned, there are others of still smaller amplitude and shorter period that are sensible, but as a rule only just sensible, to us as sounds. All the known evidence points to the extraordinary lowness of the earthquake-sound. According to some observers, it seems as if close to their lower limit of audibility; while others, however intently they may listen, are unable to hear the slightest noise. In other words, the most rapid vibrations present in an earthquake do not recur at a rate of much more than about 30 to 50 per second; or, if they do, they are not strong enough to impress the human ear.
To most observers, the sound seems to increase and decrease in intensity with the shock, and so gradually and smoothly does this change take place that the sound is frequently mistaken for that of an underground train approaching the observer's house, passing beneath it, and receding in the opposite direction. Some persons, especially if situated within the meizoseismal area, hear also loud crashes in the midst of the rumbling sound and simultaneously with the strongest vibrations. At a moderate distance, say from 30 to 40 miles, the sound becomes more harsh and grating while the shock is felt; and, at a greater distance, even this change disappears, and nothing is heard but an almost monotonous sound like the low roll of distant thunder. The explanation of this is that the sound-vibrations are of different periods and varying amplitude, and the limiting vibrations tend to become inaudible with increasing distance, the lower on account of their [333]long period, the higher owing to their small amplitude.
The magnitude of the sound-area depends, even more than that of the disturbed area, on the personal equation of the observers. The lower limit of audibility varies not only in different individuals, but also in different races. In Great Britain, it is doubtful whether an earthquake ever occurs unaccompanied by sound; and in the meizoseismal area the noise is heard by nearly all observers. With Italians, the average lower limit of audibility is higher than with the Anglo-Saxon race; slight shocks frequently occur without noticeable sound, but with strong ones, the larger number of observers is sure to include one or more capable of hearing the rumbling noise. The Japanese are, however, seldom affected by the most rapid earthquake-vibrations, and the strongest shocks may be unattended by any recorded sound. The result is manifest in the size of the sound-area in different countries. In the Hereford earthquake, the sound-area contained 70,000 square miles; in the Neapolitan earthquake, about 3,300 square miles; while, in Japanese earthquakes, the sound is rarely heard more than a few miles from the epicentre.
Another effect of this personal equation of the observers is that the sound-vibrations apparently outrace those of longer period. The Italians, for instance, generally hear the sound that precedes the shock, and more rarely the weaker sound that follows it. In Japan, only the earlier sound-vibrations, if any, seem to be audible. In Great Britain, on the contrary, the fore-sound is perceptible to four, and the after-sound to three, out of every five observers; [334]and these proportions are maintained roughly to considerable distances from the epicentre. It follows, therefore, that the sound-vibrations and those which constitute the shock must travel with nearly, if not quite, the same velocity; and that the greater duration of the sound is due either to the prolongation of the initial movement or to the overlapping of the principal focus by the sound-focus. Neither alternative can be regarded as improbable, but observations made on British earthquakes point to the latter explanation as the true one.
It will be sufficient to refer to two phenomena in support of this statement. In the first place, the percentage of observers who hear the fore-sound varies with the direction from the epicentre. Thus, during the Inverness earthquake of 1901, the majority of observers in Aberdeenshire regarded the sound as beginning and ending with the shock; while, in counties lying more nearly along the course of the great fault, the sound was generally heard both before and after the shock (p. 253). In this case, then, the initial and concluding sound vibrations must have come chiefly from the margins of the seismic focus; and those from the margin nearest to an observer would be more sensible than those from the farther margin. Again, in slight earthquakes, such as the Cornwall earthquake of April 1, 1898,[83] the curves of equal sound intensity, while their axes are parallel to those of the isoseismal lines, are displaced laterally with respect to these curves, owing to the arrival of the strongest sound-vibrations from the upper margin of an inclined seismic focus.
When a fault-slip occurs, the displacement is [335]obviously greatest in the central region, and dies out gradually towards the margins of the focus. The phenomena described above show that the evanescent displacement within these margins generate sound-vibrations only; and that the greater slip within the central region produces also the more important vibrations that compose the shock. As the former are perceptible over a limited district, while the latter may be felt through half a continent, it is clear that the sound-area should bear no fixed relation in point of size to the disturbed area, but should be comparatively greater for a slight shock than for a strong one.
If we consider only the earthquakes here described, we see at once how great is the diversity in the estimated velocity of the earth-waves. On the one hand, we have a value as high as 5.2 kms. per sec. for the Charleston earthquake, and, at the other end of the scale, a value of 0.9 km. per sec. for the Hereford earthquake. Between them, and equally trustworthy, lie the estimates of 3.0 km. per sec. for the Indian earthquake, and 2.1 kms. per sec. for the Japanese earthquake and its immediate successors.
It is difficult to account entirely for such discordance. Errors of observation may be responsible for a small part of the differences. The initial strength of the disturbance appears to have some effect, and the nature of the rocks traversed must be a factor of consequence when the distances in question are not very great. In the Japanese and Hereford earthquakes, all three may have combined to produce the divergent results, the distance in these cases being only 275 and 142 kms. respectively.
[336]In the Indian and Charleston earthquakes, the distances are much greater (1944 and 1487 kms.), and the variety of rocks traversed must tend to give a truer average. In the former, the result obtained (3.0 kms. per sec.) agrees so closely with the velocity of the long-period undulations of distant earthquakes as to suggest that it was these waves that were timed at the stations west of Calcutta and disturbed the magnetographs at Bombay.[84]
Omitting, then, the Indian estimate, we find that, for the Japanese and Charleston earthquakes, the velocity increases with the distance as measured along the surface. To a certain extent, such a result might have been expected, had we assumed the earthquake-waves to travel along the chords joining the focus to very distant places of observation.
The wave-paths that penetrate the earth are straight lines, however, only when the conditions that determine the velocity are uniform throughout, and such uniformity we have no reason to expect. From what we know of the earth's interior, there can, indeed, be little doubt that the velocity of earthquake-waves increases with the depth below the surface, and that the wave-paths in consequence are curved lines with their convexity downwards. It would be out of place to state more than the principal result of the recent investigations by Dr. A. Schmidt[85] and Prof. P. Rudzki[86] [337]on this subject. These are based on the assumptions that the velocity increases with the depth below the surface, and that it is always the same at the same depth. From the focus of the earthquake, wave-paths diverge in all directions. Those which start horizontally curve upwards, and intersect the surface of the earth in a circle dividing the whole surface into two areas of very unequal size. Within the small area, the surface-velocity is infinite at the epicentre, and decreases outwards until it is least on the boundary-circle. In the larger region beyond, the surface-velocity increases with the distance from the epicentre, until, at the antipodes of that point, it is again infinite. But, as the depth of the focus is always slight compared with the radius of the earth, the small circular area surrounding the epicentre is practically negligible, and we may regard the surface-velocity of the waves that traverse the body of the earth as a quantity that continually increases with the distance from the epicentre.
How fully this interesting theoretical result has been confirmed is well shown in Mr. Oldham's recent and very valuable investigation on the propagation of earthquake-motion to great distances.[87] A study of the records of the Indian earthquake revealed the existence of three series of waves, the first two consisting in all probability of longitudinal and transversal waves travelling through the body of the earth, and the third of undulations spreading over its surface (pp. 282-285). Extending his inquiries to ten other earthquakes originating in six different centres, Mr. Oldham distinguishes the same three phases in their movements; the third phase being the most [338]constantly recorded, the second less so, while the first phase is the most frequently absent. With the exception of a few very divergent records, the initial times of these phases and the maximum epoch of the third phase are plotted on the accompanying diagram (Fig. 80), in which distances from the epicentre in degrees of arc are represented along the horizontal line and the time-interval in minutes along the perpendicular line. The dots near the two lower curves refer to the records of the heavily weighted Italian instruments, and the crosses to those of the light horizontal pendulums, which respond somewhat [339]irregularly to the motion of the first two phases (p. 282). In the third phase, there is less divergence between the indications of the two classes of instruments, and dots are used in each case for the initial, and crosses for the maximum epoch.
Of the smoothed curves drawn between these series of points, those marked A, B, and C represent the time-curves of the beginnings of the first, second, and third phases respectively, while D is the time-curve for the maximum of the third phase.
The concavity of the two lower lines towards the horizontal base-line shows that the surface-velocity of the corresponding waves increases rapidly with the distance, far more so than would be possible with rectilinear motion. The rates at which these waves travel through the earth therefore increase with the depth, and the wave-paths must in consequence be curved lines convex towards the centre of the earth.
If the time-curves A and B were continued backwards to the origin, their inclinations at that point to the horizontal line give the initial velocities of the corresponding waves, which prove to be about 5 and 3 kms. per sec. respectively. Now, according to recent experiments made by Mr. H. Nagaoka on the elastic constants of rocks,[88] the mean velocity of seven archaean rocks is 5.1 kms. per sec. for the longitudinal waves, and 2.8 kms. per sec. for the transversal waves—values which agree so closely with those obtained for the first two series of earthquake-waves as to leave little doubt with regard to their character.
The other time-curves, C and D, corresponding to the initial and maximum epochs of the third phase, [340]are practically straight lines. Some of the records are slightly discordant for the average curve, especially for the initial epoch; but it is often difficult to define the commencement of this phase with precision. At any rate, the observations show no distinct sign of an increase in the surface-velocity of these waves with the distance from the origin. It may therefore be concluded that they travel along the surface with velocities which are practically constant for each individual earthquake, the largest waves at the rate of about 2.9 kms. per sec., and the advance waves with a velocity of about 3.3 kms. per sec., rising occasionally to over 4.0 kms. per sec.
Changes of elevation have long been known as accompaniments of great earthquakes, though many of the earlier observations and measurements left much to be desired in accuracy and completeness. The Japanese earthquake of 1891, however, placed the reality of such movements beyond doubt, and revealed the existence of a fault-scarp, with a height in one place of 18 or 20 feet, and a length of at least 40, if not of 70, miles. In the Indian earthquake of 1897, the fault-scarps were shorter, though more pronounced in character, the largest known (the Chedrang fault) being about 12 miles long, and having a maximum throw at the surface of 35 feet. In some other recent earthquakes, also, remarkable fault-scarps have been developed. After the great shocks felt in Eastern Greece on April 20th and 27th, 1894, a fissure was traced for a distance of about 34 miles, running in an [341]east-south-east and west-north-west direction through the epicentral district, and varying in width from an inch or two to more than three yards. That it was a fault, and not an ordinary fissure, was evident from its great length, its uniform direction, and its independence of geological structure. The throw was generally small, in no place exceeding five feet.[89] Again, in British Baluchistan, after the severe earthquake of December 20th, 1892, a fresh crack was observed in the ground running for several miles in a straight line parallel to the axis of the Khojak range. It coincided almost exactly with a line of springs, and was clearly produced by a fresh slip along an old line of fault, for before the earthquake it had the appearance of an old road, and the natives assert that the ground has always cracked along this line with every severe shock. In 1892, the change in relative height of the two sides of the fault was small, in one place where it was measured being only two inches.[90]
But other changes, besides those in a vertical direction, occasionally take place; though, owing to their recent discovery, comparatively few examples are as yet known. While the throw of the Japanese fault varied greatly in amount, and once even in direction, there was also a constant shift towards the northwest of the ground on the north-east side of the fault, the displacement at one spot being as much as 13 feet. In the fault-scarp formed in 1894 in Eastern Greece, a similar shift took place, though to what extent is unknown. There is, moreover, evidence of actual compression of the earth's crust at right angles [342]to the fault-line. The Neo valley, traversed by the Japanese fault, was apparently narrower after the earthquake than it was before, and plots of ground were reduced from 48 to 30 feet in length—i.e., by nearly 40 per cent. In British Baluchistan, the formation of the fissure referred to above was accompanied both by compression perpendicular, and by shifting parallel, to the fault. The actual displacement in each direction is unknown, but the resultant was not less than 27 inches.
There can be no doubt that a fault-scarp is formed in the first place with great rapidity. So abrupt, indeed, were the structural displacements in the epicentral area of the Indian earthquake, that they contributed very materially to the intensity of the shock, giving rise to the excessive velocities observed at Rambrai and elsewhere (p. 273). The growth of the scarp does not, however, always cease with the first great earthquake, though it may take place in a contrary sense, as in the elevation connected with the Conception earthquake of 1835. The principal shock, according to Darwin, was followed during the few succeeding days "by some hundred minor ones (though of no inconsiderable violence), which seemed to come from the same quarter from which the first had proceeded; whilst, on the other hand, the level of the ground was certainly not raised by them; but, on the contrary, after an interval of some weeks, it stood rather lower than it did immediately after the great convulsion."[91]
A series of after-shocks, more or less long, is a [343]constant attendant on every great tectonic earthquake, and few are the earthquakes of any degree of strength that can be regarded as completely isolated. Even in those which visit this country, after-shocks are seldom absent. For instance, confining ourselves to the last few years, the Pembroke earthquake of 1892 was followed by 8 shocks, the Inverness earthquake of 1890 by at least 10, and possibly by 19 shocks, and that of the same district in 1901 by 15 well-defined after-shocks in addition to many others recorded by one observer. Of 300 Italian earthquakes strong enough to cause some damage to buildings, Dr. Cancani finds that every one was either preceded or followed, and chiefly followed, by its own train of minor shocks.
For some hours, and even for days, after a great earthquake, the shocks are so numerous that it is often impossible to keep count of them. Many local centres spring into activity in different parts of the epicentral area; and, though only the strongest shocks can be identified elsewhere, it is clear that as a rule the shocks felt at any one station are quite distinct from those observed at another.
The enormous number of after-shocks that follow some earthquakes can only be realised when they are subjected to continuous seismographic registration; and, even then, countless earth-sounds and the slightest tremors must escape detection. The shocks may, indeed, succeed one another so rapidly that one begins before another ends, and the result is an almost incessant tremulous motion rendered manifest by the quivering of water-surfaces or the swinging of chandeliers. Of the total number of after-shocks, we [344]may form some idea from recent records in Japan. After the Mino-Owari earthquake of 1891, 3,365 shocks were recorded within little more than two years at Gifu, and 1,298 at Nagoya, but neither of these figures includes the shocks felt within the first few hours. Of the Kumamoto earthquake of July 28th, 1889, the after-shocks recorded at Kumamoto until the end of 1893 amount to 922; and those of the Kagoshima earthquake of September 7th, 1893, recorded at Chiran until the end of January 1894, to 480. During the first 30 days, the numbers recorded were 1,746 at Gifu, 340 at Kumamoto, and 278 at Chiran; showing, as Professor Omori remarks, that the after-shocks diminish in frequency with the size of the disturbed areas,[92]—i.e., roughly with the initial intensity of the shocks.
Next to absolute number, the rapid decline in general frequency is the most marked characteristic of after-shocks. Professor Omori has shown that, excluding minor oscillations, it follows the law represented geographically by the curves in Fig. 51, and algebraically by the equation y = k / (h + x), where y is the frequency at time x and h and k are constants for one and the same earthquake. By means of this formula, it is possible to estimate roughly the interval of time that must elapse before the seismic activity of the central district resumes its normal value. For the Mino-Owari earthquake, this proves to be about forty years, for the Kumamoto earthquake about seven or eight years, and for the Kagoshima earthquake about three or four years.
[345]In a recent memoir on Italian after-shocks,[93] Dr. Cancani has urged that other factors besides initial intensity determine the duration of a seismic period, and prominently among these he places the depth of the seismic focus. When the depth is very small, the duration of the period is short, not much more than ten days; when the depth is moderate, the duration may extend to three months; and, when great, it may amount to several years.
The principal law that governs the distribution of after-shocks in time may be regarded as well-established. It is otherwise with regard to their distribution in space. This has been examined only in the cases of the Japanese earthquake of 1891 and the Inverness earthquake of 1901. So far as we can judge from the evidence which they furnish, after-shocks appear to be most numerous within and near the central portion of the seismic focus; though the area of maximum activity is subject to continual oscillation. In this region, also, there is evidence of a gradual decrease in the depths of the after-shock foci; while, near the extremities of the epicentral area, there occur districts of slightly greater frequency than elsewhere. With the lapse of time, there seems therefore to be a constant extension, both upwards and longitudinally, of the area over which the principal fault-slip took place.
In the introductory chapter, a brief sketch is given of the different causes to which earthquakes are assigned. With those due to rock-falls in subterranean channels, we need have little to do. The [346]shocks are invariably slight, and the part they play in the shaping of the earth's crust is insignificant. Volcanic earthquakes possess a higher degree of interest. They represent, no doubt, incipient or unsuccessful attempts to produce an eruption. They may be the forerunners of a great catastrophe.
Of far higher importance in the history of our globe is the third class of earthquakes, including all those connected with the manifold changes which the crust has undergone. In the slow annealing process, to which it has been subjected from the earliest times, the crust has been crumpled and fractured, elevated into the loftiest mountain ranges or depressed below the level of the sea. Every sudden yielding under stress is the cause of an earthquake. It is chiefly, perhaps almost entirely, in the formation of faults that this yielding is manifested. The initial fracturing may be the cause of one or many shocks, but infinitely the larger number must be referred to the slow growth of the fault, the intermittent slips, now in one part, now in another, which, after the lapse of ages, culminate in a great displacement. Of the length of time occupied in the formation of a single fault, we can make no estimate in years. The anticlinal fault of Charnwood Forest dates from a pre-carboniferous period. In 1893 it had not ceased to grow.[94]
Still less can we conceive, however faintly, the number of elemental slips that constitute the history of a single fault. We may think, if we please, of the 143 tremors and earth-sounds noted at Comrie in Perthshire during the last three months of 1839, of the 306 earthquakes felt in the Island of Zante during the year 1896, or the 1,746 shocks recorded at Gifu during [347]thirty days in 1891; but we shall be as far as ever from realising the vast number of steps involved in the growth of a fault, let alone a mountain-chain.
Yet, all over the land-surface of the globe, the crust is intersected by numberless faults, and hardly any portion is there in which some or many of these faults are not growing. One country, indeed, such as Great Britain, may have reached a condition of comparative stagnancy; the fault-slips are few and slight, and earthquakes in consequence are rare and generally inconspicuous. In another, like Eastern Japan and the adjoining ocean-bed, the movements are frequent, occasionally almost incessant, and few years pass without some great convulsion by which cities are wrecked and hundreds of human lives are lost. At such times, we magnify the rôle of earthquakes, and are in some danger of forgetting that, in the formation of a mountain-chain or continent, they serve no higher purpose than the creaking of a wheel in the complex movements of a great machine.
[79] Phil. Trans., vol. li., pt. ii., 1761, pp. 625-626.
[80] Journ. Sci. Coll. Imp. Univ., Tokyo, vol. xi., 1899, pp. 194-195.
[81] Journ. Coll. Sci. Imp. Univ., Tokyo, vol. vii., pt. v., 1894, pp. 1-4; Ital. Sismol. Soc. Boll., vol. ii., 1896, pp. 180-188.
[82] Journ. Coll. Sci. Imp. Univ., Tokyo, vol. xi., 1899, pp. 161-195.
[83] Quart. Journ. Geol. Soc., vol. lvi., 1900, pp. 1-7.
[84] There is no reason why the surface-undulations of the Indian earthquake should not have produced a sensible shock even as far as Italy. Taking their amplitude in that country at 508 mm. and their period at 22 sec. (p. 283), the maximum acceleration would be about 40 mm. per sec., corresponding to the intensity 2 of the Rossi-Forel scale. (Amer. Journ. Sci., vol. xxxv., 1888, p. 429.)
[85] Nature, vol. lii., 1895, pp. 631-633.
[86] Gerland's Beiträge zur Geophysik, vol. iii., pp. 485-518.
[87] Phil. Trans., 1900A, pp. 135-174.
[88] Publ. of Earthq. Inves. Com. in For. Langs. (Tokyo), No. 4, 1900, pp. 47-67.
[89] S.A. Papavasiliou, Paris, Acad. Sci., Compt. Rend., vol. cxix., 1894, pp. 112-114, 380-381.
[90] Geol. Mag., vol. x., 1893, pp. 356-360.
[91] Geol. Soc. Trans., vol. v., 1840, pp. 618-619.
[92] The disturbed areas of these earthquakes contained, respectively, 221,000, 39,000, and 30,000 square miles.
[93] Boll. Sismol. Soc. Ital., vol. viii., 1902, pp. 17-48.
[94] Roy. Soc. Proc., vol. lvii., 1895, pp. 87-95.
Typographical errors corrected in text:
End of Project Gutenberg's A Study of Recent Earthquakes, by Charles Davison

*** END OF THIS PROJECT GUTENBERG EBOOK A STUDY OF RECENT EARTHQUAKES ***

***** This file should be named 25062-h.htm or 25062-h.zip *****
This and all associated files of various formats will be found in:
        http://www.gutenberg.org/2/5/0/6/25062/

Produced by Jeannie Howse, Henry Craig and the Online
Distributed Proofreading Team at http://www.pgdp.net (This
file was produced from images generously made available
by The Internet Archive)


Updated editions will replace the previous one--the old editions
will be renamed.

Creating the works from public domain print editions means that no
one owns a United States copyright in these works, so the Foundation
(and you!) can copy and distribute it in the United States without
permission and without paying copyright royalties.  Special rules,
set forth in the General Terms of Use part of this license, apply to
copying and distributing Project Gutenberg-tm electronic works to
protect the PROJECT GUTENBERG-tm concept and trademark.  Project
Gutenberg is a registered trademark, and may not be used if you
charge for the eBooks, unless you receive specific permission.  If you
do not charge anything for copies of this eBook, complying with the
rules is very easy.  You may use this eBook for nearly any purpose
such as creation of derivative works, reports, performances and
research.  They may be modified and printed and given away--you may do
practically ANYTHING with public domain eBooks.  Redistribution is
subject to the trademark license, especially commercial
redistribution.


*** START: FULL LICENSE ***

THE FULL PROJECT GUTENBERG LICENSE
PLEASE READ THIS BEFORE YOU DISTRIBUTE OR USE THIS WORK

To protect the Project Gutenberg-tm mission of promoting the free
distribution of electronic works, by using or distributing this work
(or any other work associated in any way with the phrase "Project
Gutenberg"), you agree to comply with all the terms of the Full Project
Gutenberg-tm License (available with this file or online at
http://gutenberg.org/license).


Section 1.  General Terms of Use and Redistributing Project Gutenberg-tm
electronic works

1.A.  By reading or using any part of this Project Gutenberg-tm
electronic work, you indicate that you have read, understand, agree to
and accept all the terms of this license and intellectual property
(trademark/copyright) agreement.  If you do not agree to abide by all
the terms of this agreement, you must cease using and return or destroy
all copies of Project Gutenberg-tm electronic works in your possession.
If you paid a fee for obtaining a copy of or access to a Project
Gutenberg-tm electronic work and you do not agree to be bound by the
terms of this agreement, you may obtain a refund from the person or
entity to whom you paid the fee as set forth in paragraph 1.E.8.

1.B.  "Project Gutenberg" is a registered trademark.  It may only be
used on or associated in any way with an electronic work by people who
agree to be bound by the terms of this agreement.  There are a few
things that you can do with most Project Gutenberg-tm electronic works
even without complying with the full terms of this agreement.  See
paragraph 1.C below.  There are a lot of things you can do with Project
Gutenberg-tm electronic works if you follow the terms of this agreement
and help preserve free future access to Project Gutenberg-tm electronic
works.  See paragraph 1.E below.

1.C.  The Project Gutenberg Literary Archive Foundation ("the Foundation"
or PGLAF), owns a compilation copyright in the collection of Project
Gutenberg-tm electronic works.  Nearly all the individual works in the
collection are in the public domain in the United States.  If an
individual work is in the public domain in the United States and you are
located in the United States, we do not claim a right to prevent you from
copying, distributing, performing, displaying or creating derivative
works based on the work as long as all references to Project Gutenberg
are removed.  Of course, we hope that you will support the Project
Gutenberg-tm mission of promoting free access to electronic works by
freely sharing Project Gutenberg-tm works in compliance with the terms of
this agreement for keeping the Project Gutenberg-tm name associated with
the work.  You can easily comply with the terms of this agreement by
keeping this work in the same format with its attached full Project
Gutenberg-tm License when you share it without charge with others.

1.D.  The copyright laws of the place where you are located also govern
what you can do with this work.  Copyright laws in most countries are in
a constant state of change.  If you are outside the United States, check
the laws of your country in addition to the terms of this agreement
before downloading, copying, displaying, performing, distributing or
creating derivative works based on this work or any other Project
Gutenberg-tm work.  The Foundation makes no representations concerning
the copyright status of any work in any country outside the United
States.

1.E.  Unless you have removed all references to Project Gutenberg:

1.E.1.  The following sentence, with active links to, or other immediate
access to, the full Project Gutenberg-tm License must appear prominently
whenever any copy of a Project Gutenberg-tm work (any work on which the
phrase "Project Gutenberg" appears, or with which the phrase "Project
Gutenberg" is associated) is accessed, displayed, performed, viewed,
copied or distributed:

This eBook is for the use of anyone anywhere at no cost and with
almost no restrictions whatsoever.  You may copy it, give it away or
re-use it under the terms of the Project Gutenberg License included
with this eBook or online at www.gutenberg.org

1.E.2.  If an individual Project Gutenberg-tm electronic work is derived
from the public domain (does not contain a notice indicating that it is
posted with permission of the copyright holder), the work can be copied
and distributed to anyone in the United States without paying any fees
or charges.  If you are redistributing or providing access to a work
with the phrase "Project Gutenberg" associated with or appearing on the
work, you must comply either with the requirements of paragraphs 1.E.1
through 1.E.7 or obtain permission for the use of the work and the
Project Gutenberg-tm trademark as set forth in paragraphs 1.E.8 or
1.E.9.

1.E.3.  If an individual Project Gutenberg-tm electronic work is posted
with the permission of the copyright holder, your use and distribution
must comply with both paragraphs 1.E.1 through 1.E.7 and any additional
terms imposed by the copyright holder.  Additional terms will be linked
to the Project Gutenberg-tm License for all works posted with the
permission of the copyright holder found at the beginning of this work.

1.E.4.  Do not unlink or detach or remove the full Project Gutenberg-tm
License terms from this work, or any files containing a part of this
work or any other work associated with Project Gutenberg-tm.

1.E.5.  Do not copy, display, perform, distribute or redistribute this
electronic work, or any part of this electronic work, without
prominently displaying the sentence set forth in paragraph 1.E.1 with
active links or immediate access to the full terms of the Project
Gutenberg-tm License.

1.E.6.  You may convert to and distribute this work in any binary,
compressed, marked up, nonproprietary or proprietary form, including any
word processing or hypertext form.  However, if you provide access to or
distribute copies of a Project Gutenberg-tm work in a format other than
"Plain Vanilla ASCII" or other format used in the official version
posted on the official Project Gutenberg-tm web site (www.gutenberg.org),
you must, at no additional cost, fee or expense to the user, provide a
copy, a means of exporting a copy, or a means of obtaining a copy upon
request, of the work in its original "Plain Vanilla ASCII" or other
form.  Any alternate format must include the full Project Gutenberg-tm
License as specified in paragraph 1.E.1.

1.E.7.  Do not charge a fee for access to, viewing, displaying,
performing, copying or distributing any Project Gutenberg-tm works
unless you comply with paragraph 1.E.8 or 1.E.9.

1.E.8.  You may charge a reasonable fee for copies of or providing
access to or distributing Project Gutenberg-tm electronic works provided
that

- You pay a royalty fee of 20% of the gross profits you derive from
     the use of Project Gutenberg-tm works calculated using the method
     you already use to calculate your applicable taxes.  The fee is
     owed to the owner of the Project Gutenberg-tm trademark, but he
     has agreed to donate royalties under this paragraph to the
     Project Gutenberg Literary Archive Foundation.  Royalty payments
     must be paid within 60 days following each date on which you
     prepare (or are legally required to prepare) your periodic tax
     returns.  Royalty payments should be clearly marked as such and
     sent to the Project Gutenberg Literary Archive Foundation at the
     address specified in Section 4, "Information about donations to
     the Project Gutenberg Literary Archive Foundation."

- You provide a full refund of any money paid by a user who notifies
     you in writing (or by e-mail) within 30 days of receipt that s/he
     does not agree to the terms of the full Project Gutenberg-tm
     License.  You must require such a user to return or
     destroy all copies of the works possessed in a physical medium
     and discontinue all use of and all access to other copies of
     Project Gutenberg-tm works.

- You provide, in accordance with paragraph 1.F.3, a full refund of any
     money paid for a work or a replacement copy, if a defect in the
     electronic work is discovered and reported to you within 90 days
     of receipt of the work.

- You comply with all other terms of this agreement for free
     distribution of Project Gutenberg-tm works.

1.E.9.  If you wish to charge a fee or distribute a Project Gutenberg-tm
electronic work or group of works on different terms than are set
forth in this agreement, you must obtain permission in writing from
both the Project Gutenberg Literary Archive Foundation and Michael
Hart, the owner of the Project Gutenberg-tm trademark.  Contact the
Foundation as set forth in Section 3 below.

1.F.

1.F.1.  Project Gutenberg volunteers and employees expend considerable
effort to identify, do copyright research on, transcribe and proofread
public domain works in creating the Project Gutenberg-tm
collection.  Despite these efforts, Project Gutenberg-tm electronic
works, and the medium on which they may be stored, may contain
"Defects," such as, but not limited to, incomplete, inaccurate or
corrupt data, transcription errors, a copyright or other intellectual
property infringement, a defective or damaged disk or other medium, a
computer virus, or computer codes that damage or cannot be read by
your equipment.

1.F.2.  LIMITED WARRANTY, DISCLAIMER OF DAMAGES - Except for the "Right
of Replacement or Refund" described in paragraph 1.F.3, the Project
Gutenberg Literary Archive Foundation, the owner of the Project
Gutenberg-tm trademark, and any other party distributing a Project
Gutenberg-tm electronic work under this agreement, disclaim all
liability to you for damages, costs and expenses, including legal
fees.  YOU AGREE THAT YOU HAVE NO REMEDIES FOR NEGLIGENCE, STRICT
LIABILITY, BREACH OF WARRANTY OR BREACH OF CONTRACT EXCEPT THOSE
PROVIDED IN PARAGRAPH F3.  YOU AGREE THAT THE FOUNDATION, THE
TRADEMARK OWNER, AND ANY DISTRIBUTOR UNDER THIS AGREEMENT WILL NOT BE
LIABLE TO YOU FOR ACTUAL, DIRECT, INDIRECT, CONSEQUENTIAL, PUNITIVE OR
INCIDENTAL DAMAGES EVEN IF YOU GIVE NOTICE OF THE POSSIBILITY OF SUCH
DAMAGE.

1.F.3.  LIMITED RIGHT OF REPLACEMENT OR REFUND - If you discover a
defect in this electronic work within 90 days of receiving it, you can
receive a refund of the money (if any) you paid for it by sending a
written explanation to the person you received the work from.  If you
received the work on a physical medium, you must return the medium with
your written explanation.  The person or entity that provided you with
the defective work may elect to provide a replacement copy in lieu of a
refund.  If you received the work electronically, the person or entity
providing it to you may choose to give you a second opportunity to
receive the work electronically in lieu of a refund.  If the second copy
is also defective, you may demand a refund in writing without further
opportunities to fix the problem.

1.F.4.  Except for the limited right of replacement or refund set forth
in paragraph 1.F.3, this work is provided to you 'AS-IS' WITH NO OTHER
WARRANTIES OF ANY KIND, EXPRESS OR IMPLIED, INCLUDING BUT NOT LIMITED TO
WARRANTIES OF MERCHANTIBILITY OR FITNESS FOR ANY PURPOSE.

1.F.5.  Some states do not allow disclaimers of certain implied
warranties or the exclusion or limitation of certain types of damages.
If any disclaimer or limitation set forth in this agreement violates the
law of the state applicable to this agreement, the agreement shall be
interpreted to make the maximum disclaimer or limitation permitted by
the applicable state law.  The invalidity or unenforceability of any
provision of this agreement shall not void the remaining provisions.

1.F.6.  INDEMNITY - You agree to indemnify and hold the Foundation, the
trademark owner, any agent or employee of the Foundation, anyone
providing copies of Project Gutenberg-tm electronic works in accordance
with this agreement, and any volunteers associated with the production,
promotion and distribution of Project Gutenberg-tm electronic works,
harmless from all liability, costs and expenses, including legal fees,
that arise directly or indirectly from any of the following which you do
or cause to occur: (a) distribution of this or any Project Gutenberg-tm
work, (b) alteration, modification, or additions or deletions to any
Project Gutenberg-tm work, and (c) any Defect you cause.


Section  2.  Information about the Mission of Project Gutenberg-tm

Project Gutenberg-tm is synonymous with the free distribution of
electronic works in formats readable by the widest variety of computers
including obsolete, old, middle-aged and new computers.  It exists
because of the efforts of hundreds of volunteers and donations from
people in all walks of life.

Volunteers and financial support to provide volunteers with the
assistance they need, is critical to reaching Project Gutenberg-tm's
goals and ensuring that the Project Gutenberg-tm collection will
remain freely available for generations to come.  In 2001, the Project
Gutenberg Literary Archive Foundation was created to provide a secure
and permanent future for Project Gutenberg-tm and future generations.
To learn more about the Project Gutenberg Literary Archive Foundation
and how your efforts and donations can help, see Sections 3 and 4
and the Foundation web page at http://www.pglaf.org.


Section 3.  Information about the Project Gutenberg Literary Archive
Foundation

The Project Gutenberg Literary Archive Foundation is a non profit
501(c)(3) educational corporation organized under the laws of the
state of Mississippi and granted tax exempt status by the Internal
Revenue Service.  The Foundation's EIN or federal tax identification
number is 64-6221541.  Its 501(c)(3) letter is posted at
http://pglaf.org/fundraising.  Contributions to the Project Gutenberg
Literary Archive Foundation are tax deductible to the full extent
permitted by U.S. federal laws and your state's laws.

The Foundation's principal office is located at 4557 Melan Dr. S.
Fairbanks, AK, 99712., but its volunteers and employees are scattered
throughout numerous locations.  Its business office is located at
809 North 1500 West, Salt Lake City, UT 84116, (801) 596-1887, email
business@pglaf.org.  Email contact links and up to date contact
information can be found at the Foundation's web site and official
page at http://pglaf.org

For additional contact information:
     Dr. Gregory B. Newby
     Chief Executive and Director
     gbnewby@pglaf.org


Section 4.  Information about Donations to the Project Gutenberg
Literary Archive Foundation

Project Gutenberg-tm depends upon and cannot survive without wide
spread public support and donations to carry out its mission of
increasing the number of public domain and licensed works that can be
freely distributed in machine readable form accessible by the widest
array of equipment including outdated equipment.  Many small donations
($1 to $5,000) are particularly important to maintaining tax exempt
status with the IRS.

The Foundation is committed to complying with the laws regulating
charities and charitable donations in all 50 states of the United
States.  Compliance requirements are not uniform and it takes a
considerable effort, much paperwork and many fees to meet and keep up
with these requirements.  We do not solicit donations in locations
where we have not received written confirmation of compliance.  To
SEND DONATIONS or determine the status of compliance for any
particular state visit http://pglaf.org

While we cannot and do not solicit contributions from states where we
have not met the solicitation requirements, we know of no prohibition
against accepting unsolicited donations from donors in such states who
approach us with offers to donate.

International donations are gratefully accepted, but we cannot make
any statements concerning tax treatment of donations received from
outside the United States.  U.S. laws alone swamp our small staff.

Please check the Project Gutenberg Web pages for current donation
methods and addresses.  Donations are accepted in a number of other
ways including checks, online payments and credit card donations.
To donate, please visit: http://pglaf.org/donate


Section 5.  General Information About Project Gutenberg-tm electronic
works.

Professor Michael S. Hart is the originator of the Project Gutenberg-tm
concept of a library of electronic works that could be freely shared
with anyone.  For thirty years, he produced and distributed Project
Gutenberg-tm eBooks with only a loose network of volunteer support.


Project Gutenberg-tm eBooks are often created from several printed
editions, all of which are confirmed as Public Domain in the U.S.
unless a copyright notice is included.  Thus, we do not necessarily
keep eBooks in compliance with any particular paper edition.


Most people start at our Web site which has the main PG search facility:

     http://www.gutenberg.org

This Web site includes information about Project Gutenberg-tm,
including how to make donations to the Project Gutenberg Literary
Archive Foundation, how to help produce our new eBooks, and how to
subscribe to our email newsletter to hear about new eBooks.