The Project Gutenberg EBook of Response in the Living and Non-Living, by
Jagadis Chunder Bose

This eBook is for the use of anyone anywhere at no cost and with
almost no restrictions whatsoever.  You may copy it, give it away or
re-use it under the terms of the Project Gutenberg License included
with this eBook or online at www.gutenberg.org


Title: Response in the Living and Non-Living

Author: Jagadis Chunder Bose

Release Date: August 3, 2006 [EBook #18986]

Language: English

Character set encoding: ISO-8859-1

*** START OF THIS PROJECT GUTENBERG EBOOK RESPONSE IN LIVING AND NON-LIVING ***


Produced by Bryan Ness, Laura Wisewell and the Online
Distributed Proofreading Team at http://www.pgdp.net
Transcriber’s note: Four likely printer errors have been corrected; these are on pages 46, 115, 176 and 186, marked like this. The inconsistent hyphenation of “break-down”, “electro-motive” and “vibration-head” is as in the original. Some of the illustrations had to be moved up or down a few paragraphs from their position in the original; the hyperlinked page numbers in the List of Illustrations point to the original locations, but the hyperlinked figure numbers point to where the figures are now.
RESPONSE IN THE LIVING
AND NON-LIVING
BY
JAGADIS CHUNDER BOSE, M.A.(Cantab.), D.Sc.(Lond.)
PROFESSOR, PRESIDENCY COLLEGE, CALCUTTA
WITH ILLUSTRATIONS
LONGMANS, GREEN, AND CO.
39 PATERNOSTER ROW, LONDON
NEW YORK AND BOMBAY
1902
All rights reserved
‘The real is one: wise men call it variously’
Rig Veda
To my Countrymen
This Work is Dedicated
PREFACE
I have in the present work put in a connected and a more complete form
results, some of which have been published in the following Papers:
- ‘De la Généralité des Phénomènes Moléculaires produits par l’Electricité sur la matière Inorganique et sur la
matière Vivante.’ (Travaux du Congrès International
de Physique. Paris, 1900.)
- ‘On the Similarity of Effect of Electrical Stimulus on Inorganic
and Living Substances.’ (Report, Bradford
Meeting British Association, 1900.—Electrician.)
- ‘Response of Inorganic Matter to Stimulus.’ (Friday
Evening Discourse, Royal Institution, May 1901.)
- ‘On Electric Response of Inorganic Substances. Preliminary
Notice.’ (Royal Society, June 1901.)
- ‘On Electric Response of Ordinary Plants under Mechanical
Stimulus.’ (Journal Linnean Society, 1902.)
- ‘Sur la Réponse Electrique dans les Métaux, les Tissus
Animaux et Végétaux.’ (Société de Physique, Paris,
1902.)
- ‘On the Electro-Motive Wave accompanying Mechanical
Disturbance in Metals in contact with Electrolyte.’
(Proceedings Royal Society, vol. 70.)
- ‘On the Strain Theory of Vision and of Photographic Action.’
(Journal Royal Photographic Society, vol. xxvi.)
These investigations were commenced in India, and I take this
opportunity to express my grateful acknowledgments to the Managers of
the Royal Institution, for the facilities offered me to complete them at
the Davy-Faraday Laboratory.
J. C. Bose.
Davy-Faraday Laboratory, Royal Institution,
London: May 1902.
CONTENTS
| CHAPTER I
THE MECHANICAL RESPONSE OF LIVING SUBSTANCES | PAGE |
| Mechanical response—Different kinds of
stimuli—Myograph—Characteristics of response-curve: period, amplitude,
form—Modification of response-curves | 1 |
| | |
| Conditions for obtaining electric response—Method of injury—Current of
injury—Injured end, cuproid: uninjured, zincoid—Current of response in
nerve from more excited to less excited—Difficulties of present
nomenclature—Electric recorder—Two types of response, positive and
negative—Universal applicability of electric mode of response—Electric
response a measure of physiological activity—Electric response in
plants | 5 |
| CHAPTER III
ELECTRIC RESPONSE IN PLANTS—METHOD OF NEGATIVE VARIATION | |
| Negative variation—Response recorder—Photographic
recorder—Compensator—Means of graduating intensity of
stimulus—Spring-tapper and torsional vibrator—Intensity of stimulus
dependent on amplitude of vibration—Effectiveness of stimulus dependent
on rapidity also | 17 |
| CHAPTER IV
ELECTRIC RESPONSE IN PLANTS—BLOCK METHOD | |
| Method of block—Advantages of block method—Plant response a
physiological phenomenon—Abolition of response by anæsthetics and
poisons—Abolition of response when plant is killed by hot water | 27 |
| CHAPTER V
PLANT RESPONSE—ON THE EFFECTS OF SINGLE STIMULUS AND OF SUPERPOSED
STIMULI | |
| Effect of single stimulus—Superposition of stimuli—Additive
effect—Staircase effect—Fatigue—No fatigue when sufficient interval
between stimuli—Apparent fatigue when stimulation frequency is
increased—Fatigue under continuous stimulation | 35 |
| CHAPTER VI
PLANT RESPONSE—ON DIPHASIC VARIATION | |
| Diphasic variation—Positive after-effect and positive response—Radial
E.M. variation | 44 |
| CHAPTER VII
PLANT RESPONSE—ON THE RELATION BETWEEN STIMULUS AND RESPONSE | |
| Increased response with increasing stimulus—Apparent diminution of
response with excessively strong stimulus | 51 |
| CHAPTER VIII
PLANT RESPONSE—ON THE INFLUENCE OF TEMPERATURE | |
| Effect of very low temperature—Influence of high
temperature—Determination of death-point—Increased response as
after-effect of temperature variation—Death of plant and abolition of
response by the action of steam | 59 |
| CHAPTER IX
PLANT RESPONSE—EFFECT OF ANÆSTHETICS AND POISONS | |
| Effect of anæsthetics, a test of vital character of response—Effect of
chloroform—Effect of chloral—Effect of formalin—Method in which
response is unaffected by variation of resistance—Advantage of block
method—Effect of dose | 71 |
| CHAPTER X
RESPONSE IN METALS | |
| Is response found in inorganic substances?—Experiment on tin, block
method—Anomalies of existing terminology—Response by method of
depression—Response by method of exaltation | 81 |
| CHAPTER XI
INORGANIC RESPONSE—MODIFIED APPARATUS TO EXHIBIT RESPONSE IN METALS | |
| Conditions of obtaining quantitative measurements—Modification of the
block method—Vibration cell—Application of stimulus—Graduation of the
intensity of stimulus—Considerations showing that electric response is
due to molecular disturbance—Test experiment—Molecular voltaic cell
| 91 |
| CHAPTER XII
INORGANIC RESPONSE—METHOD OF ENSURING CONSISTENT RESULTS | |
| Preparation of wire—Effect of single stimulus | 100 |
| CHAPTER XIII
INORGANIC RESPONSE—MOLECULAR MOBILITY: ITS INFLUENCE ON RESPONSE | |
| Effects of molecular inertia—Prolongation of period of recovery by
overstrain—Molecular model—Reduction of molecular sluggishness
attended by quickened recovery and heightened response—Effect of
temperature—Modification of latent period and period of recovery by the
action of chemical reagents—Diphasic variation | 104 |
| CHAPTER XIV
INORGANIC RESPONSE—FATIGUE, STAIRCASE, AND MODIFIED RESPONSE | |
| Fatigue in metals—Fatigue under continuous stimulation—Staircase
effect—Reversed responses due to molecular modification in nerve and in
metal, and their transformation into normal after continuous
stimulation—Increased response after continuous stimulation | 118 |
| CHAPTER XV
INORGANIC RESPONSE—RELATION BETWEEN STIMULUS AND
RESPONSE—SUPERPOSITION OF STIMULI | |
| Relation between stimulus and response—Magnetic analogue—Increase of
response with increasing stimulus—Threshold of response—Superposition
of stimuli—Hysteresis | 131 |
| CHAPTER XVI
INORGANIC RESPONSE—EFFECT OF CHEMICAL REAGENTS | |
| Action of chemical reagents—Action of stimulants on metals—Action of
depressants on metals—Effect of ‘poisons’ on metals—Opposite effect of
large and small doses | 139 |
| CHAPTER XVII
ON THE STIMULUS OF LIGHT AND RETINAL CURRENTS | |
| Visual impulse: (1) chemical theory; (2) electrical theory—Retinal
currents—Normal response positive—Inorganic response under stimulus of
light—Typical experiment on the electrical effect induced by light | 148 |
| CHAPTER XVIII
INORGANIC RESPONSE—INFLUENCE OF VARIOUS CONDITIONS ON THE RESPONSE TO
STIMULUS OF LIGHT | |
| Effect of temperature—Effect of increasing length of exposure—Relation
between intensity of light and magnitude of
response—After-oscillation—Abnormal effects: (1) preliminary negative
twitch; (2) reversal of response; (3) transient positive twitch on
cessation of light; (4) decline and reversal—Résumé | 158 |
| | |
| Effect of light of short duration—After-oscillation—Positive and
negative after-images—Binocular alternation of vision—Period of
alternation modified by physical condition—After-images and their
revival—Unconscious visual impression. | 170 |
| CHAPTER XX
GENERAL SURVEY AND CONCLUSION | 181 |
| | 193 |
ILLUSTRATIONS
| FIG. | | PAGE |
|---|
| 1. | Mechanical Lever Recorder | 3 |
| 2. | Electric Method of Detecting Nerve Response | 6 |
| 3. | Diagram showing Injured End of Nerve Corresponds to
Copper in a Voltaic Element | 8 |
| 4. | Electric Recorder | 11 |
| 5. | Simultaneous Record of Mechanical and Electrical Responses | 13 |
| 6. | Negative Variation in Plants | 19 |
| 7. | Photographic Record of Negative Variation in Plants | 20 |
| 8. | Response Recorder | 21 |
| 9. | The Compensator | 22 |
| 10. | The Spring-tapper | 23 |
| 11. | The Torsional Vibrator | 24 |
| 12. | Response in Plant to Mechanical Tap or Vibration | 25 |
| 13. | Influence of Suddenness on the Efficiency of Stimulus | 26 |
| 14. | The Method of Block | 28 |
| 15. | Response in Plant completely Immersed under Water | 29 |
| 16. | Uniform Responses in Plant | 36 |
| 17. | Fusion of Effect under Rapidly Succeeding Stimuli in
Muscle and in Plant | 36 |
| 18. | Additive Effect of Singly Ineffective Stimuli on
Plant | 37 |
| 19. | ‘Staircase Effect’ in Plant | 37 |
| 20. | Appearance of Fatigue in Plant under Shortened Period of Rest | 39 |
| 21. | Fatigue in Celery | 40 |
| 22. | Fatigue in Cauliflower-stalk | 41 |
| 23. | Fatigue from Previous Overstrain | 41 |
| 24. | Fatigue under Continuous Stimulation in Celery | 42 |
| 25. | Effect of Rest in Removal of Fatigue in Plant | 43 |
| 26. | Diphasic Variation in Plant | 46 |
| 27, 28. | Abnormal Positive Responses in Stale Plant transformed
into Normal Negative Under Strong Stimulation | 48, 49 |
| 29. | Radial E.M. Variation | 50 |
| 30. | Curves showing the Relation between Intensity of
Stimulus and Response in Muscle and Nerve | 52 |
| 31. | Increasing Responses to Increasing Stimuli (Taps) in
Plants | 52 |
| 32. | Increasing Responses to Increasing Vibrational Stimuli
in Plants | 53 |
| 33. | Responses to Increasing Stimuli in Fresh and Stale
Specimens of Plants | 54 |
| 34. | Apparent Diminution of Response caused by Fatigue
under Strong Stimulation | 57 |
| 35. | Diminution of Response in Eucharis Lily at Low Temperature | 61 |
| 36. | Records showing the Difference in the Effects of Low
Temperature on Ivy, Holly, and Eucharis Lily | 62 |
| 37. | Plant Chamber for Studying the Effect of Temperature
and Anæsthetics | 64 |
| 38. | Effect of High Temperature on Plant Response | 64 |
| 39. | After-effect on the Response due to Temperature
Variation | 66 |
| 40. | Records of Responses in Eucharis Lily during Rise and
Fall of Temperature | 67 |
| 41. | Curve showing Variation of Sensitiveness during a
Cycle of Temperature Variation | 68 |
| 42. | Record of Effect of Steam in Abolition of Response
at Death of Plant | 69 |
| 43. | Effect of Chloroform on Nerve Response | 72 |
| 44. | Effect of Chloroform on the Responses of Carrot | 74 |
| 45. | Action of Chloral Hydrate on Plant Responses | 75 |
| 46. | Action of Formalin on Radish | 75 |
| 47. | Action of Sodium Hydrate in Abolishing the Response
in Plant | 78 |
| 48. | Stimulating Action of Poison in Small Doses in Plants | 79 |
| 49. | The Poisonous Effect of Stronger Dose of KOH | 79 |
| 50. | Block Method for obtaining Response in Tin | 83 |
| 51. | Response To Mechanical Stimulation in a Zn-Cu Couple | 85 |
| 52. | Electric Response in Metal by the Method of Relative
Depression (Negative Variation) | 88 |
| 53. | Method of Relative Exaltation | 89 |
| 54. | Various Cases of Positive and Negative Variation | 90 |
| 55. | Modifications of the Block Method for Exhibiting
Electric Response in Metals | 93 |
| 56. | Equal and Opposite Responses given by Two Ends of
the Wire | 95 |
| 57. | Top View of the Vibration Cell | 96 |
| 58. | Influence of Annealing in the Enhancement of
Response in Metals | 101 |
| 59. | Uniform Electric Responses in Metals | 102 |
| 60. | Persistence of After-effect | 105 |
| 61. | Prolongation of Period of Recovery after Overstrain | 106 |
| 62. | Molecular Model | 107 |
| 63, 64. | Effects of Removal of Molecular Sluggishness in
Quickened Recovery and Heightened Response in
Metals | 109, 110 |
| 65. | Effect of Temperature on Response in Metals | 111 |
| 66. | Diphasic Variation in Metals | 113 |
| 67. | Negative, Diphasic, and Positive Resultant Response in
Metals | 115 |
| 68. | Continuous Transformation from Negative to Positive
through Intermediate Diphasic Response | 116 |
| 69. | Fatigue in Muscle | 118 |
| 70. | Fatigue in Platinum | 118 |
| 71. | Fatigue in Tin | 119 |
| 72. | Appearance of Fatigue due to Shortening the Period
of Recovery | 120 |
| 73. | Fatigue in Metal under Continuous Stimulation | 121 |
| 74. | ‘Staircase’ Response in Muscle and in Metal | 122 |
| 75. | Abnormal Response in Nerve converted into Normal
under Continued Stimulation | 124 |
| 76, 77. | Abnormal Response in Tin and Platinum converted
into Normal under Continued Stimulation | 125 |
| 78. | Gradual Transition from Abnormal to Normal Response
in Platinum | 126 |
| 79. | Increase of Response in Nerve after Continuous
Stimulation | 127 |
| 80, 81. | Response in Tin and Platinum Enhanced after
Continuous Stimulation | 127, 128 |
| 82. | Magnetic Analogue | 132 |
| 83, 84. | Records of Responses to Increasing Stimuli in Tin | 134, 135 |
| 85. | Ineffective Stimulus becoming Effective by Superposition | 135 |
| 86. | Incomplete and Complete Fusion of Effects | 136 |
| 87. | Cyclic Curve for Maximum Effects showing Hysteresis | 137 |
| 88. | Action of Poison in Abolishing Response in Nerve | 139 |
| 89. | Action of Stimulant on Tin | 141 |
| 90. | Action of Stimulant on Platinum | 142 |
| 91. | Depressing Effect of KBr on Tin | 143 |
| 92. | Abolition of Response in Metals by ‘Poison’ | 143 |
| 93. | ‘Molecular Arrest’ by the Action of ‘Poison’ | 145 |
| 94. | Opposite Effects of Small and Large Doses on the
Response in Metals | 146 |
| 95. | Retinal Response to Light | 150 |
| 96. | Response of Sensitive Cell to Light | 152 |
| 97. | Typical Experiment on the E.M. Variation Produced
by Light | 154 |
| 98. | Modification of the Photo-sensitive Cell | 155 |
| 99. | Responses in Frog’s Retina | 156 |
| 100. | Responses in Sensitive Photo-cell | 157 |
| 101. | Effect of Temperature on the Response to Light
Stimulus | 159 |
| 102. | Effect of Duration of Exposure on the Response | 159 |
| 103. | Responses of Sensitive Cell to Increasing Intensities
of Light | 161 |
| 104. | Relation between the Intensity of Light And Magnitude
of Response | 162 |
| 105. | After-oscillation | 163 |
| 106. | Transient Positive Increase of Response in the Frog’s
Retina on the Cessation of Light | 164 |
| 107. | Transient Positive Increase of Response in the
Sensitive Cell | 165 |
| 108. | Decline under the Continuous Action of Light | 166 |
| 109. | Certain After-effects of Light | 168 |
| 110. | After-effect of Light of Short Duration | 172 |
| 111. | Stereoscopic Design for the Exhibition of Binocular
Alternation of Vision | 176 |
| 112. | Uniform Responses in Nerve, Plant, and Metal | 184 |
| 113. | Fatigue in Muscle, Plant, and Metal | 185 |
| 114. | ‘Staircase’ Effect in Muscle, Plant, and Metal | 186 |
| 115. | Increase of Response after Continuous Stimulation in
Nerve and Metal | 186 |
| 116. | Modified Abnormal Response in Nerve and Metal
Transformed into Normal Response after Continuous
Stimulation | 187 |
| 117. | Action of the same ‘Poison’ in the Abolition of Response
in Nerve, Plant, and Metal | 189 |
RESPONSE
IN THE
LIVING AND NON-LIVING
CHAPTER I
THE MECHANICAL RESPONSE OF LIVING SUBSTANCES
- Mechanical response
- —Different kinds of stimuli
- —Myograph
- —Characteristics of response-curve: period, amplitude, form
- —Modification of response-curves.
One of the most striking effects of external disturbance on certain
types of living substance is a visible change of form. Thus, a piece of
muscle when pinched contracts. The external disturbance which produced
this change is called the stimulus. The body which is thus capable of
responding is said to be irritable or excitable. A stimulus thus
produces a state of excitability which may sometimes be expressed by
change of form.
Mechanical response to different kinds of stimuli.—This reaction under
stimulus is seen even in the lowest organisms; in some of the amœboid
rhizopods, for instance. These lumpy protoplasmic bodies, usually
elongated while creeping, if mechanically jarred, contract into a
spherical form. If, instead of mechanical disturbance, we apply salt
solution, they again contract, in the same way as before. Similar
effects are produced by sudden illumination, or by rise of temperature,
or by electric shock. A living substance may thus be put into an
excitatory state by either mechanical, chemical, thermal, electrical, or
light stimulus. Not only does the point stimulated show the effect of
stimulus, but that effect may sometimes be conducted even to a
considerable distance. This power of conducting stimulus, though common
to all living substances, is present in very different degrees. While in
some forms of animal tissue irritation spreads, at a very slow rate,
only to points in close neighbourhood, in other forms, as for example in
nerves, conduction is very rapid and reaches far.
The visible mode of response by change of form may perhaps be best
studied in a piece of muscle. When this is pinched, or an electrical
shock is sent through it, it becomes shorter and broader. A responsive
twitch is thus produced. The excitatory state then disappears, and the
muscle is seen to relax into its normal form.
Mechanical lever recorder.—In the case of contraction of muscle, the
effect is very quick, the twitch takes place in too short a time for
detailed observation by ordinary means. A myographic apparatus is
therefore used, by means of which the changes in the muscle are
self-recorded. Thus we obtain a history of its change and recovery from
the change. The muscle is connected to one end of a writing lever. When
the muscle contracts, the tracing point is pulled up in one direction,
say to the right. The extent of this pull depends on the amount of
contraction. A band of paper or a revolving drum-surface moves at a
uniform speed at right angles to the direction of motion of the writing
lever. When the muscle recovers from the stimulus, it relaxes into its
original form, and the writing point traces the recovery as it moves now
to the left, regaining its first position. A curve is thus described,
the rising portion of which is due to contraction, and the falling
portion to relaxation or recovery. The ordinate of the curve represents
the intensity of response, and the abscissa the time (fig. 1).
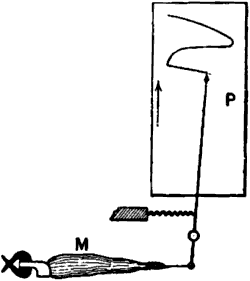
Fig. 1.—Mechanical Lever Recorder
The muscle M with the attached bone is securely held at one end, the
other end being connected with the writing lever. Under the action of
stimulus the contracting muscle pulls the lever and moves the tracing
point to the right over the travelling recording surface P. When the
muscle recovers from contraction, the tracing point returns to its
original position. See on P the record of muscle curve.
Characteristics of the response-curve: (1) Period, (2) Amplitude, (3)
Form.—Just as a wave of sound is characterised by its (1) period, (2)
amplitude, and (3) form, so may these response-curves be distinguished
from each other. As regards the period, there is an enormous variation,
corresponding to the functional activity of the muscle. For instance, in
tortoise it may be as high as a second, whereas in the wing-muscles of
many insects it is as small as 1/300 part of a second. ‘It is probable
that a continuous graduated scale might, as suggested by Hermann, be
drawn up in the animal kingdom, from the excessively rapid contraction
of insects to those of tortoises and hibernating dormice.’[1]
Differences in form and amplitude of curve are well illustrated by
various muscles of the tortoise. The curve for the muscle of the neck,
used for rapid withdrawal of the head on approach of danger, is quite
different from that of the pectoral muscle of the same animal, used for
its sluggish movements.
Again, progressive changes in the same muscle are well seen in the
modifications of form which consecutive muscle-curves gradually undergo.
In a dying muscle, for example, the amplitude of succeeding curves is
continuously diminished, and the curves themselves are elongated.
Numerous illustrations will be seen later, of the effect, in changing
the form of the curve, of the increased excitation or depression
produced by various agencies.
Thus these response records give us a means of studying the effect of
stimulus, and the modification of response, under varying external
conditions, advantage being taken of the mechanical contraction produced
in the tissue by the stimulus. But there are other kinds of tissue where
the excitation produced by stimulus is not exhibited in a visible form.
In order to study these we have to use an altogether independent method,
the method of electric response.
CHAPTER II
ELECTRIC RESPONSE
- Conditions for obtaining electric response
- —Method of injury
- —Current of injury
- —Injured end, cuproid: uninjured, zincoid
- —Current of response in nerve from more excited to less excited
- —Difficulties of present nomenclature
- —Electric recorder
- —Two types of response, positive and negative
- —Universal applicability of electric mode of response
- —Electric response a measure of physiological activity
- —Electric response in plants.
Unlike muscle, a length of nerve, when mechanically or electrically
excited, does not undergo any visible change. That it is thrown into an
excitatory state, and that it conducts the excitatory disturbance, is
shown however by the contraction produced in an attached piece of
muscle, which serves as an indicator.
But the excitatory effect produced in the nerve by stimulus can also be
detected by an electrical method. If an isolated piece of nerve be taken
and two contacts be made on its surface by means of non-polarisable
electrodes at A and B, connection being made with a galvanometer, no
current will be observed, as both A and B are in the same
physico-chemical condition. The two points, that is to say, are
iso-electric.
If now the nerve be excited by stimulus, similar disturbances will be
evoked at both A and B. If, further, these disturbances, reaching A and
B almost simultaneously, cause any electrical change, then, similar
changes taking place at both points, and there being thus no relative
difference between the two, the galvanometer will still indicate no
current. This null-effect is due to the balancing action of B as against
A. (See fig. 2, a.)
Conditions for obtaining electric response.—If then we wish to detect
the response by means of the galvanometer, one means of doing so will
lie in the abolition of this balance, which may be accomplished by
making one of the two points, say B, more or less permanently
irresponsive. In that case, stimulus will cause greater electrical
disturbance at the more responsive point, say A, and this will be shown
by the galvanometer as a current of response. To make B less responsive
we may injure it by means of a cross-sectional cut, a burn, or the
action of strong chemical reagents.
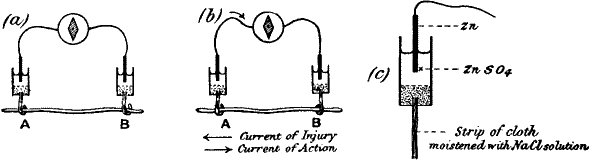
Fig. 2.—Electric Method of Detecting Nerve Response
(a) Iso-electric contacts; no current in the galvanometer.
(b) The end B injured; current of injury from B to A: stimulation gives rise to
an action current from A to B.
(c) Non-polarisable electrode.
Current of injury.—We shall revert to the subject of electric response;
meanwhile it is necessary to say a few words regarding the electric
disturbance caused by the injury itself. Since the physico-chemical
conditions of the uninjured A and the injured B are now no longer the
same, it follows that their electric conditions have also become
different. They are no longer iso-electric. There is thus a more or less
permanent or resting difference of electric potential between them. A
current—the current of injury—is found to flow in the nerve, from
the injured to the uninjured, and in the galvanometer, through the
electrolytic contacts from the uninjured to the injured. As long as
there is no further disturbance this current of injury remains
approximately constant, and is therefore sometimes known as ‘the current
of rest’ (fig. 2, b).
A piece of living tissue, unequally injured at the two ends, is thus
seen to act like a voltaic element, comparable to a copper and zinc
couple. As some confusion has arisen, on the question of whether the
injured end is like the zinc or copper in such a combination, it will
perhaps be well to enter upon this subject in detail.
If we take two rods, of zinc and copper respectively, in metallic
contact, and further, if the points A and B are connected by a strip of
cloth s moistened with salt solution, it will be seen that we have a
complete voltaic element. A current will now flow from B to A in the
metal (fig. 3, a) and from A to B through the electrolyte s. Or
instead of connecting A and B by a single strip of cloth s, we may
connect them by two strips s s′, leading to non-polarisable electrodes
E E′. The current will then be found just the same as before, i.e. from
B to A in the metallic part, and from A through s s′ to B, the wire W
being interposed, as it were, in the electrolytic part of the circuit.
If now a galvanometer be interposed at O, the current will flow from B
to A through the galvanometer, i.e. from right to left. But if we
interpose the galvanometer in the electrolytic part of the circuit, that
is to say, at W, the same current will appear to flow in the opposite
direction. In fig. 3, c, the galvanometer is so interposed, and in
this case it is to be noticed that when the current in the galvanometer
flows from left to right, the metal connected to the left is zinc.
Compare fig. 3, d, where A B is a piece of nerve of which the B end is
injured. The current in the galvanometer through the non-polarisable
electrode is from left to right. The uninjured end is therefore
comparable to the zinc in a voltaic cell (is zincoid), the injured being
copper-like or cuproid.[2]
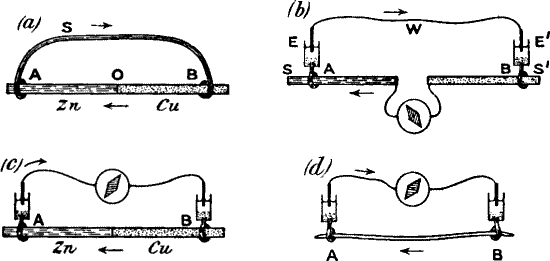
Fig. 3.—Diagram showing the Correspondence between
injured (B) and uninjured (A) contacts in Nerve, and Cu and Zn in a
Voltaic Element
Comparison of (c) and (d) will show that the injured end of B in
(d) corresponds with the Cu in (c).
If the electrical condition of, say, zinc in the voltaic couple (fig. 3,
c) undergo any change (and I shall show later that this can be caused
by molecular disturbance), then the existing difference of potential
between A and B will also undergo variation. If for example the
electrical condition of A approach that of B, the potential difference
will undergo a diminution, and the current hitherto flowing in the
circuit will, as a consequence, display a diminution, or negative
variation.
Action current.—We have seen that a current of injury—sometimes known
as ‘current of rest’—flows in a nerve from the injured to the
uninjured, and that the injured B is then less excitable than the
uninjured A. If now the nerve be excited, there being a greater effect
produced at A, the existing difference of potential may thus be reduced,
with a consequent diminution of the current of injury. During
stimulation, therefore, a nerve exhibits a negative variation. We may
express this in a different way by saying that a ‘current of action’ was
produced in response to stimulus, and acted in an opposite direction to
the current of injury (fig. 2, b). The action current in the nerve is
from the relatively more excited to the relatively less excited.
Difficulties of present nomenclature.—We shall deal later with a method
by which a responsive current of action is obtained without any
antecedent current of injury. ‘Negative variation’ has then no meaning.
Or, again, a current of injury may sometimes undergo a change of
direction (see note, p. 12). In view of these considerations it is
necessary to have at our disposal other forms of expression by which the
direction of the current of response can still be designated. Keeping in
touch with the old phraseology, we might then call a current ‘negative’
that flowed from the more excited to the less excited. Or, bearing in
mind the fact that an uninjured contact acts as the zinc in a voltaic
couple, we might call it ‘zincoid,’ and the injured contact ‘cuproid.’
Stimulation of the uninjured end, approximating it to the condition of
the injured, might then be said to induce a cuproid change.
The electric change produced in a normal nerve by stimulation may
therefore be expressed by saying that there has been a negative
variation, or that there was a current of action from the more excited
to the less excited, or that stimulation has produced a cuproid change.
The excitation, or molecular disturbance, produced by a stimulus has
thus a concomitant electrical expres sion. As the excitatory state
disappears with the return of the excitable tissue to its original
condition, the current of action will gradually disappear.[3] The
movement of the galvanometer needle during excitation of the tissue thus
indicates a molecular upset by the stimulus; and the gradual creeping
back of the galvanometer deflection exhibits a molecular recovery.
This transitory electrical variation constitutes the ‘response,’ and its
intensity varies according to that of the stimulus.
Electric recorder.—We have thus a method of obtaining curves of
response electrically. After all, it is not essentially very different
from the mechanical method. In this case we use a magnetic lever
(fig. 4, a), the needle of the galvanometer, which is deflected by the
electromagnetic pull of the current, generated under the action of
stimulus, just as the mechanical lever was deflected by the mechanical
pull of the muscle contracting under stimulus.
The accompanying diagram (fig. 4, b) shows how, under the action of
stimulus, the current of rest undergoes a transitory diminution, and how
on the cessation of stimulus there is gradual recovery of the tissue, as
exhibited in the return of the galvanometer needle to its original
position.
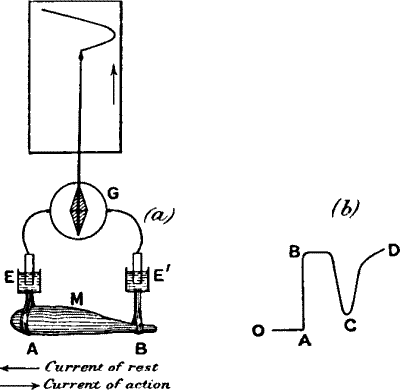
Fig. 4.—Electric Recorder
(a) M muscle; A uninjured, B injured ends. E E′ non-polarising
electrodes connecting A and B with galvanometer G. Stimulus produces
‘negative variation’ of current of rest. Index connected with
galvanometer needle records curve on travelling paper (in practice,
moving galvanometer spot of light traces curve on photographic plate).
Rising part of curve shows effect of stimulus; descending part,
recovery.
(b) O is the zero position of the galvanometer; injury produces a
deflection A B; stimulus diminishes this deflection to C; C D is the
recovery.
Two types of response—positive and negative.—It may here be added that
though stimulus in general produces a diminution of current of rest, or
a negative variation (e.g. muscles and nerves), yet, in certain cases,
there is an increase, or positive variation. This is seen in the
response of the retina to light. Again, a tissue which normally gives a
negative variation may undergo molecular changes, after which it gives a
positive variation. Thus Dr. Waller finds that whereas fresh nerve
always gives negative variation, stale nerve sometimes gives positive;
and that retina, which when fresh gives positive, when stale, exhibits
negative variation.
The following is a tabular statement of the two types of response:
I. Negative variation.—Action current from more excited to less
excited—cuproid change in the excited—e.g. fresh muscle and nerve,
stale retina.
II. Positive variation.—Action current from less excited to more
excited—zincoid change in the excited—e.g. stale nerve, fresh
retina.[4]
From this it will be seen that it is the fact of the electrical response
of living substances to stimulus that is of essential importance, the
sign plus or minus being a minor consideration.
Universal applicability of the electrical mode of response.—This mode
of obtaining electrical response is applicable to all living tissues,
and in cases like that of muscle, where mechanical response is also
available, it is found that the electrical and mechanical records are
practically identical.
The two response-curves seen in the accompanying diagram (fig. 5), and
taken from the same muscle by the two methods simultaneously, clearly
exhibit this. Thus we see that electrical response can not only take the
place of the mechanical record, but has the further advantage of being
applicable in cases where the latter cannot be used.
Electrical response: A measure of physiological activity.—These
electrical changes are regarded as physiological, or characteristic of
living tissue, for any conditions which enhance physiological activity
also, pari passu, increase their intensity. Again, when the tissue is
killed by poison, electrical response disappears, the tissue passing
into an irresponsive condition. Anæsthetics, like chloroform, gradually
diminish, and finally altogether abolish, electrical response.
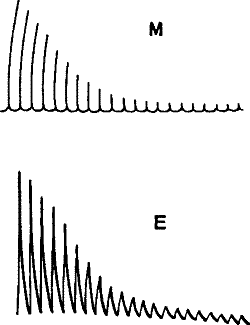
Fig. 5.—Simultaneous Record of the Mechanical (M) and
(E) Electrical Responses of the Muscle of Frog. (Waller.)
From these observed facts—that living tissue gives response while a
tissue that has been killed does not—it is concluded that the
phenomenon of response is peculiar to living organisms.[5] The response
phenomena that we have been studying are therefore considered as due to
some unknown, super-physical ‘vital’ force and are thus relegated to a
region beyond physical inquiry.
It may, however, be that this limitation is not justified, and surely,
at least until we have explored the whole range of physical action, it
cannot be asserted definitely that a particular class of phenomena is by
its very nature outside that category.
Electric response in plants.—But before we proceed to the inquiry as to
whether these responses are or are not due to some physical property of
matter, and are to be met with even in inorganic substances, it will
perhaps be advisable to see whether they are not paralleled by phenomena
in the transitional world of plants. We shall thus pass from a study of
response in highly complex animal tissues to those given under simpler
vital conditions.
Electric response has been found by Munck, Burdon-Sanderson, and others
to occur in sensitive plants. But it would be interesting to know
whether these responses were confined to plants which exhibit such
remarkable mechanical movements, and whether they could not also be
obtained from ordinary plants where visible movements are completely
absent. In this connection, Kunkel observed electrical changes in
association with the injury or flexion of stems of ordinary plants.[6]
My own attempt, however, was directed, not towards the obtaining of a
mere qualitative response, but rather to the determination of whether
throughout the whole range of response phenomena a parallelism between
animal and vegetable could be detected. That is to say, I desired to
know, with regard to plants, what was the relation between intensity of
stimulus and the corresponding response; what were the effects of
superposition of stimuli; whether fatigue was present, and in what
manner it influenced response; what were the effects of extremes of
temperature on the response; and, lastly, if chemical reagents could
exercise any influence in the modification of plant response, as
stimulating, anæsthetic, and poisonous drugs have been found to do with
nerve and muscle.
If it could be proved that the electric response served as a faithful
index of the physiological activity of plants, it would then be possible
successfully to attack many problems in plant physiology, the solution
of which at present offers many experimental difficulties.
With animal tissues, experiments have to be carried on under many great
and unavoidable difficulties. The isolated tissue, for example, is
subject to unknown changes inseparable from the rapid approach of death.
Plants, however, offer a great advantage in this respect, for they
maintain their vitality unimpaired during a very great length of time.
In animal tissues, again, the vital conditions themselves are highly
complex. Those essential factors which modify response can, therefore,
be better determined under the simpler conditions which obtain in
vegetable life.
In the succeeding chapters it will be shown that the response phenomena
are exhibited not only by plants but by inorganic substances as well,
and that the responses are modified by various conditions in exactly
the same manner as those of animal tissues. In order to show how
striking are these similarities, I shall for comparison place side by
side the responses of animal tissues and those I have obtained with
plants and inorganic substances. For the electric response in animal
tissues, I shall take the latest and most complete examples from the
records made by Dr. Waller.
But before we can obtain satisfactory and conclusive results regarding
plant response, many experimental difficulties will have to be
surmounted. I shall now describe how this has been accomplished.[7]
CHAPTER III
ELECTRIC RESPONSE IN PLANTS—METHOD OF NEGATIVE VARIATION
- Negative variation
- —Response recorder
- —Photographic recorder
- —Compensator
- —Means of graduating intensity of stimulus
- —Spring-tapper and torsional vibrator
- —Intensity of stimulus dependent on amplitude of vibration
- —Effectiveness of stimulus dependent on rapidity also.
I shall first proceed to show that an electric response is evoked in
plants under stimulation.[8]
In experiments for the exhibition of electric response it is preferable
to use a non-electrical form of stimulus, for there is then a certainty
that the observed response is entirely due to reaction from stimulus,
and not, as might be the case with electric stimulus, to mere escape of
stimulating current through the tissue. For this reason, the mechanical
form of stimulation is the most suitable.
I find that all parts of the living plant give electric response to a
greater or less extent. Some, however, give stronger response than
others. In favourable cases, we may have an E.M. variation as high as
·1 volt. It must however be remembered that the response, being a
function of physiological activity of the plant, is liable to undergo
changes at different seasons of the year. Each plant has its particular
season of maximum responsiveness. The leaf-stalk of horse-chestnut, for
example, exhibits fairly strong response in spring and summer, but on
the approach of autumn it undergoes diminution. I give here a list of
specimens which will be found to exhibit fairly good response:
Root.—Carrot (Daucus Carota), radish (Raphanus sativus).
Stem.—Geranium (Pelargonium), vine (Vitis vinifera).
Leaf-stalk.—Horse-chestnut (Æsculus Hippocastanum), turnip (Brassica
Napus), cauliflower (Brassica oleracea), celery (Apium graveolens),
Eucharis lily (Eucharis amazonica).
Flower-stalk.—Arum lily (Richardia africana).
Fruit.—Egg-plant (Solanum Melongena).
Negative variation.—Taking the leaf-stalk of turnip we kill an area on
its surface, say B, by the application of a few drops of strong potash,
the area at A being left uninjured. A current is now observed to flow,
in the stalk, from the injured B to the uninjured A, as was found to be
the case in the animal tissue. The potential difference depends on the
condition of the plant, and the season in which it may have been
gathered. In the experiment here described (fig. 6, a) its value was
·13 volt.
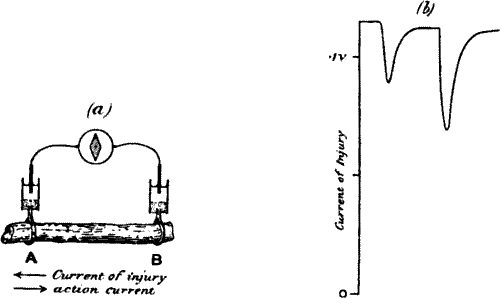
Fig. 6.—(a) Experiment for Exhibiting Electric
Response in Plants by Method of Negative Variation. (b) Responses in
Leaf-stalk of Turnip to Stimuli of Two Successive Taps, the Second being
Stronger.
A and B contacts are about 2 cm. apart, B being injured. Plant is
stimulated by a tap between A and B. Stimulus acts on both A and B, but
owing to injury of B, effect at A is stronger and a negative variation
due to differential action occurs.
A sharp tap was now given to the stalk, and a sudden diminution, or
negative variation, of current occurred, the resting potential
difference being decreased by ·026 volt. A second and stronger tap
produced a second response, causing a greater diminution of P.D. by
·047 volt (fig. 6, b). The accompanying figure is a photographic
record of another set of response-curves (fig. 7). The first three
responses are for a given intensity of stimulus, and the next six in
response to stimulus nearly twice as strong. It will be noticed that
fatigue is exhibited in these responses. Other experiments will be
described in the next chapter which show conclusively that the response
was not due to any accidental circumstance but was a direct result of
stimulation. But I shall first discuss the experimental arrangements and
method of obtaining these graphic records.
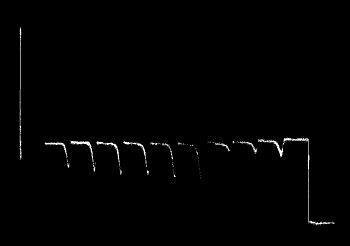
Fig. 7.—Record of Responses in Plant (Leaf-stalk of
Cauliflower) by Method of Negative Variation
The first three records are for stimulus intensity 1; the next six are
for intensity twice as strong; the successive responses exhibit fatigue.
The vertical line to the left represents ·1 volt. The record is to be
read from right to left.
Response recorder.—The galvanometer used is a sensitive dead-beat
D’Arsonval. The period of complete swing of the coil under experimental
conditions is about 11 seconds. A current of 10-9 ampere produces a
deflection of 1 mm. at a distance of 1 metre. For a quick and accurate
method of obtaining the records, I devised the following form of
response recorder. The curves are obtained directly, by tracing the
excursion of the galvanometer spot of light on a revolving drum
(fig. 8). The drum, on which is wrapped the paper for receiving the
record, is driven by clockwork. Different speeds of revolution can be
given to it by adjustment of the clock-governor, or by changing the size
of the driving-wheel. The galvanometer spot is thrown down on the drum
by the inclined mirror M. The galvanometer deflection takes place at
right angles to the motion of the paper. A stylographic pen attached to
a carrier rests on the writing surface. The carrier slides over a rod
parallel to the drum. As has been said before, the galvanometer
deflection takes place parallel to the drum, and as long as the plant
rests unstimulated, the pen, remaining coincident with the stationary
galvanometer spot on the revolving paper, describes a straight line. If,
on stimulation, we trace the resulting excursion of the spot of light,
by moving the carrier which holds the pen, the rising portion of the
response-curve will be obtained. The galvanometer spot will then return
more or less gradually to its original position, and that part of the
curve which is traced during the process constitutes the recovery. The
ordinate in these curves represents the E.M. variation, and the abscissa
the time.
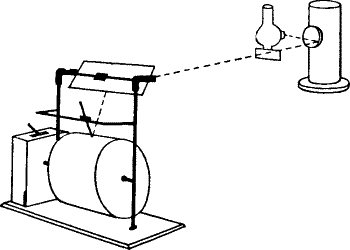
Fig. 8.—Response Recorder
We can calibrate the value of the deflection by applying a known E.M.F.
to the circuit from a compensator, and noting the deflection which
results. The speed of the clock is previously adjusted so that the
recording surface moves exactly through, say, one inch a minute. Of
course this speed can be increased to suit the particular experiment,
and in some it is as high as six inches a minute. In this simple manner
very accurate records may be made. It has the additional advantage that
one is able at once to see whether the specimen is suitable for the
purpose of investigation. A large number of records might be taken by
this means in a comparatively short time.
Photographic recorder.—Or the records may be made photographically. A
clockwork arrangement moves a photographic plate at a known uniform
rate, and a curve is traced on the plate by the moving spot of light.
All the records that will be given are accurate reproductions of those
obtained by one of these two methods. Photographic records are
reproduced in white against a black background.
Compensator.—As the responses are on variation of current of injury,
and as the current of injury may be strong, and throw the spot of light
beyond the recording surface, a potentiometer balancing arrangement may
be used (fig. 9), by which the P.D. due to injury is exactly
compensated; E.M. variations produced by stimulus are then taken in the
usual manner. This compensating arrangement is also helpful, as has been
said before, for calibrating the E.M. value of the deflection.
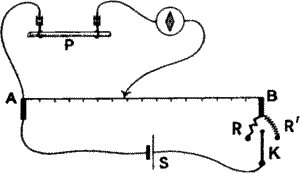
Fig. 9.—The Compensator
A B is a stretched wire with added resistances R and R′. S is a storage
cell. When the key K is turned to the right one scale division =
·001 volt, when turned to the left one scale division = ·01 volt. P is
the plant.
Means of graduating the intensity of stimulus.—One of the necessities
in connection with quantitative measurements is to be certain that the
intensity of successive stimuli is (1) constant, or (2) capable of
gradual increase by known amounts. No two taps given by the hand can be
made exactly alike. I have therefore devised the two following methods
of stimulation, which have been found to act satisfactorily.
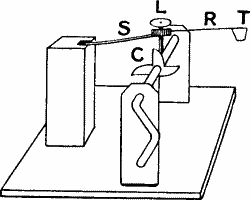
Fig. 10.—The Spring-tapper
The spring-tapper.—This consists (fig. 10) of the spring proper (S),
the attached rod (R) carrying at its end the tapping-head (T). A
projecting rod—the lifter (L)—passes through S R. It is provided with
a screw-thread, by means of which its length, projecting downwards, is
regulated. This fact, as we shall see, is made to determine the height
of the stroke. (C) is a cogwheel. As one of the spokes of the cogwheel
is rotated past (L), the spring is lifted and released, and (T) delivers
a sharp tap. The height of the lift, and therefore the intensity of the
stroke, is measured by means of a graduated scale. We can increase the
intensity of the stroke through a wide range (1) by increasing the
projecting length of the lifter, and (2) by shortening the length of
spring by a sliding catch. We may give isolated single taps or superpose
a series in rapid succession according as the wheel is rotated slow or
fast. The only disadvantage of the tapping method of stimulation is that
in long-continued experiment the point struck is liable to be injured.
The vibrational mode of stimulation to be presently described labours
under no such disadvantage.
The electric tapper.—Instead of the simple mechanical tapper, an
electromagnetic tapper may be used.
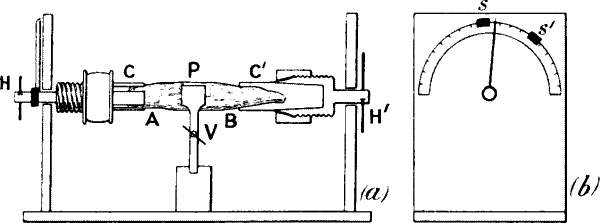
Fig. 11.—The Torsional Vibrator
Plant P is securely held by a vice V. The two ends are clamped by
holders C C′. By means of handles H H′, torsional vibration may be
imparted to either the end A or end B of the plant. The end view (b)
shows how the amplitude of vibration is predetermined by means of
movable stops S S′.
Vibrational stimulus.—I find that torsional vibration affords another
very effective method of stimulation (fig. 11). The plant-stalk may be
fixed in a vice (V), the free ends being held in tubes (C C′), provided
with three clamping jaws. A rapid torsional vibration[9] may now be
imparted to the stalk by means of the handle (H). The amplitude of
vibration, which determines the intensity of stimulus, can be accurately
measured by the graduated circle. The amplitude of vibration may be
predetermined by means of the sliding stops (S S′).
Intensity of stimulus dependent on amplitude of vibration.—I shall now
describe an experiment which shows that torsional vibration is as
effective as stimulation by taps, and that its stimulating intensity
increases, length of stalk being constant, with amplitude of vibration.
It is of course obvious that if the length of the specimen be doubled,
the vibration, in order to produce the same effect, must be through
twice the angle. I took a leaf-stalk of turnip and fixed it in the
torsional vibrator. I then took record of responses to two successive
taps, the intensity of one being nearly double that of the other. Having
done this, I applied to the same stalk two successive torsional
vibrations of 45° and 67° respectively. These successive responses to
taps and torsional vibrations are given in fig. 12, and from them it
will be seen that these two modes of stimulation may be used
indifferently, with equal effect. The vibrational method has the
advantage over tapping, that, while with the latter the stimulus is
somewhat localised, with vibration the tissue subjected to stimulus is
uniformly stimulated throughout its length.
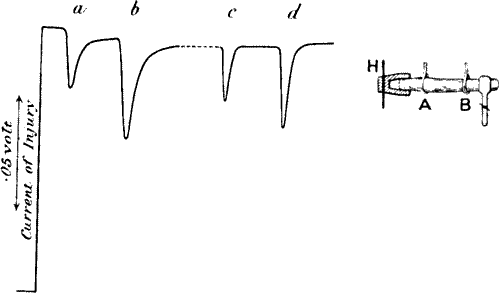
Fig. 12.—Response in Plant to Mechanical Tap or
Vibration
The end B is injured. A tap was given between A and B and this gave the
response-curve a. A stronger tap gave the response b. By means of
the handle H, a torsional vibration of 45° was now imparted, this gave
the response c. Vibration through 67° gave d.
Effectiveness of stimulus dependent on rapidity also. In order that
successive stimuli may be equally effective another point has to be
borne in mind. In all cases of stimulation of living tissue it is found
that the effectiveness of a stimulus to arouse response depends on the
rapidity of the onset of the disturbance. It is thus found that the
stimulus of the ‘break’ induction shock, on a muscle for example, is
more effective, by reason of its greater rapidity, than the ‘make’
shock. So also with the torsional vibrations of plants, I find response
depending on the quickness with which the vibration is effected. I give
below records of successive stimuli, given by vibrations through the
same amplitude, but delivered with increasing rapidity (fig. 13).
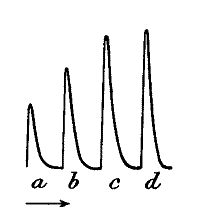
Fig. 13.—Influence of Suddenness on the Efficiency of
Stimulus
The curves a, b, c, d, are responses to vibrations of the same
amplitude, 30°. In a the vibration was very slow; in b it was less
slow; it was rapid in c, and very rapid in d.
Thus if we wish to maintain the effective intensity of stimulus constant
we must meet two conditions: (1) The amplitude of vibration must be kept
the same. This is done by means of the graduated circle. (2) The
vibration period must be kept the same. With a little practice, this
requirement is easily fulfilled.
The uniformity of stimulation which is thus attained solves the great
difficulty of obtaining reliable quantitative values, by whose means
alone can rigorous demonstration of the phenomena we are studying become
possible.
CHAPTER IV
ELECTRIC RESPONSE IN PLANTS—BLOCK METHOD
- Method of block
- —Advantages of block method
- —Plant response a physiological phenomenon
- —Abolition of response by anæsthetics and poisons
- —Abolition of response when plant is killed by hot water.
I shall now proceed to describe another and independent method which I
devised for obtaining plant response. It has the advantage of offering
us a complementary means of verifying the results found by the method of
negative variation. As it is also, in itself, for reasons which will be
shown later, a more perfect mode of inquiry, it enables us to
investigate problems which would otherwise have been difficult to
attempt.
When electrolytic contacts are made on the uninjured surfaces of the
stalk at A and B, the two points, being practically similar in every
way, are iso-electric, and little or no current will flow in the
galvanometer. If now the whole stalk be uniformly stimulated, and if
both ends A and B be equally excited at the same moment, it is clear
that there will still be no responsive current, owing to balancing
action at the two ends. This difficulty as regards the obtaining of
response was overcome in the method of negative variation, where the
excitability of one end was depressed by chemical reagents or injury, or
abolished by excessive tempera ture. On stimulating the stalk there was
produced a greater excitation at A than at B, and a current of action
was then observed to flow in the stalk from the more excited A to the
less excited B (fig. 6).
But we can cause this differential action to become evident by another
means. For example, if we produce a block, by clamping at C between A
and B (fig. 14, a), so that the disturbance made at A by tapping or
vibration is prevented from reaching B, we shall then have A thrown into
a relatively greater excitatory condition than B. It will now be found
that a current of action flows in the stalk from A to B, that is to say,
from the excited to the less excited. When the B end is stimulated,
there will be a reverse current (fig. 14, b).
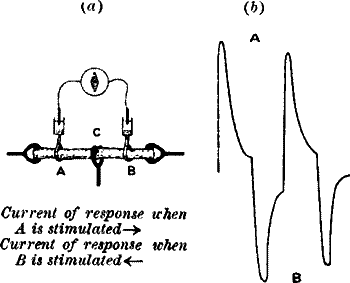
Fig. 14.—The Method of Block
(a) The plant is clamped at C, between A and B.
(b) Responses obtained by alternately stimulating the two ends.
Stimulation of A produces upward response; of B gives downward
response.
We have in this method a great advantage over that of negative
variation, for we can always verify any set of results by making
corroborative reversal experiments.
By the method of injury again, one end is made initially abnormal, i.e.
different from the condition which it maintains when intact. Further,
inevitable changes will proceed unequally at the injured and uninjured
ends, and the conditions of the experiment may thus undergo unknown
variations. But by the block method which has just been described,
there is no injury, the plant is normal throughout, and any
physiological change (which in plants will be exceedingly small during
the time of the experiment) will affect it as a whole.
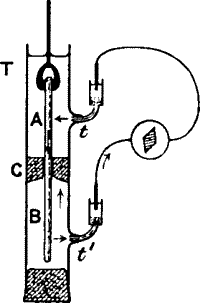
Fig. 15.—Response in Plant (from the Stimulated A to
Unstimulated B) Completely Immersed Under Water
The leaf-stalk is clamped securely in the middle with the cork C, inside
the tube T, which is filled with water, the plant being completely
immersed. Moistened threads in connection with the two non-polarisable
electrodes are led to the side tubes t t′. One end of the stalk is
held in ebonite forceps and vibrated. A current of response is found to
flow in the stalk from the excited A to the unexcited B, and outside,
through the liquid, from B to A. A portion of this current, flowing
through the side tubes t t′, produces deflection in the galvanometer.
Plant response a physiological or vital response.—I now proceed to a
demonstration of the fact that whatever be the mechanism by which they
are brought about, these plant responses are physiological in their
character. As the investigations described in the next few chapters will
show, they furnish an accurate index of physiological activity. For it
will be found that, other things being equal, whatever tends to exalt or
depress the vitality of the plant tends also to increase or diminish its
electric response. These E.M. effects are well marked, and attain
considerable value, rising sometimes, as has been said before, to as
much as ·1 volt or more. They are proportional to the intensity of
stimulus.
It need hardly be added that special precautions are taken to avoid
shifting of contacts. Variation of contact, however, could not in any
case account for repeated transient responses to repeated stimuli, when
contact is made on iso-electric surfaces. Nor could it in any way
explain the reversible nature of these responses, when A and B are
stimulated alternately. These responses are obtained in the plants even
when completely immersed in water, as in the experimental arrangement
(fig. 15). It will be seen that in this case, where there could be no
possibility of shifting of contact, or variation of surface, there is
still the usual current of response.
I shall describe here a few crucial experiments only, in proof of the
physiological character of electric response. The test applied by
physiologists, in order to discriminate as to the physiological nature
of response, consists in finding out whether the response is diminished
or abolished by the action of anæsthetics, poisons, and excessively high
temperature, which are known to depress or destroy vitality.
I shall therefore apply these same tests to plant responses.
Effect of anæsthetics and poisons.—Ordinary anæsthetics, like
chloroform, and poisons, like mercuric chloride, are known to produce a
profound depression or abolish all signs of response in the living
tissue. For the purpose of experiment, I took two groups of stalks, with
leaves attached, exactly similar to each other in every respect. In
order that the leaf-stalks might absorb chloroform I dipped their cut
ends in chloroform-water, a certain amount of which they absorbed, the
process being helped by the transpiration from the leaves. The second
group of stalks was placed simply in water, in order to serve for
control experiment. The narcotic action of chloroform, finally
culminating in death, soon became visually evident. The leaves began to
droop, a peculiar death-discolouration began to spread from the mid rib
along the venation of the leaves. Another peculiarity was also observed.
The aphides feeding on the leaves died even before the appearance of the
discoloured patches, whereas on the leaves of the stalks placed in water
these little creatures maintained their accustomed activity, nor did any
discolouration occur. In order to study the effect of poison, another
set was placed in water containing a small quantity of mercuric
chloride. The leaves here underwent the same change of appearance, and
the aphides met with the same untimely fate, as in the case of those
subjected to the action of chloroform. There was hardly any visible
change in the appearance of the stalks themselves, which were to all
outer seeming as living as ever, indications of death being apparent
only on the leaf surfaces. I give below the results of several sets of
experiments, from which it would appear that whereas there was strong
normal response in the group of stalks kept in water, there was
practically a total abolition of all response in those anæsthetised or
poisoned.
Experiments on the effect of anæsthetics and poisons. A batch of ten
leaf-stalks of plane-tree was placed with the cut ends in water, and
leaves in air; an equal number was immersed in chloroform-water; a third
batch was placed in 5 per cent. solution of mercuric chloride.
Similarly a batch of three horse-chestnut leaf-stalks was put in water,
another batch in chloroform-water, and a third batch in mercuric
chloride solution.
I. Leaf-stalk of Plane-tree
The stimulus applied was a single vibration of 90°.
|
A. After 24 hours in
water |
B. After 24 hours in
chloroform water |
C. After 24 hours in
mercuric chloride |
[All leaves standing up
and fresh—aphides
alive] |
[Leaves began to droop
in 1 hour and bent over
in 3
hours—aphides dead] |
[Leaves began to droop
in 4 hours. Deep
discolouration
along the veins. Aphides dead] |
|
Electric response |
|
Electric response |
|
Electric response |
| (1) |
21 |
dns. |
(1) |
1 |
dn. |
(1) |
0 |
dn. |
| (2) |
31 |
" |
(2) |
1 |
" |
(2) |
0·25 |
" |
| (3) |
26 |
" |
(3) |
2 |
" |
(3) |
0·25 |
" |
| (4) |
15 |
" |
(4) |
0 |
" |
(4) |
0 |
" |
| (5) |
17 |
" |
(5) |
1 |
" |
(5) |
0·25 |
" |
| (6) |
23 |
" |
(6) |
1·5 |
" |
(6) |
0·25 |
" |
| (7) |
30 |
" |
(7) |
2 |
" |
(7) |
0 |
" |
| (8) |
27 |
" |
(8) |
1 |
" |
(8) |
0·25 |
" |
| (9) |
29 |
" |
(9) |
1 |
" |
(9) |
0·25 |
" |
| (10) |
17 |
" |
(10) |
0·5 |
" |
(10) |
0·5 |
" |
| Mean response 23·6 |
Mean 1 |
Mean 0·15 |
II. Leaf-stalk of Horse-chestnut |
| (1) |
15 |
dns. |
(1) |
0·5 |
dn. |
(1) |
0 |
dn. |
| (2) |
17 |
" |
(2) |
0·5 |
" |
(2) |
0 |
" |
| (3) |
10 |
" |
(3) |
0 |
" |
(3) |
0 |
" |
| Mean 14 |
Mean 0·3 |
Mean 0 |
These results conclusively prove the physiological nature of the
response.
I shall in a succeeding chapter give a continuous series of
response-curves showing how, owing to progressive death from the action
of poison, the responses undergo steady diminution till they are
completely abolished.
Effect of high temperature.—It is well known that plants are killed
when subjected to high temperatures. I took a stalk, and, using the
block method, with torsional vibration as the stimulus, obtained strong
responses at both ends A and B. I then immersed the same stalk for a
short time in hot water at about 65° C., and again stimulated it as
before. But at neither A nor B could any response now be evoked. As all
the external conditions were the same in the first and second parts of
this experiment, the only difference being that in one the stalk was
alive and in the other killed, we have here further and conclusive proof
of the physiological character of electric response in plants.
The same facts may be demonstrated in a still more striking manner by
first obtaining two similar but opposite responses in a fresh stalk, at
A and B, and then killing one half, say B, by immersing only that half
of the stalk in hot water. The stalk is replaced in the apparatus, and
it is now found that whereas the A half gives strong response, the end B
gives none.
In the experiments on negative variation, it was tacitly assumed that
the variation is due to a differential action, stimulus producing a
greater excitation at the uninjured than at the injured end. The block
method enables us to test the correctness of this assumption. The B end
of the stalk is injured or killed by a few drops of strong potash, the
other end being uninjured. There is a clamp between A and B. The end A
is stimulated and a strong response is obtained. The end B is now
stimulated, and there is little or no response. The block is now removed
and the plant stimulated throughout its length. Though the stimulus now
acts on both ends, yet, owing to the irresponsive condition of B, there
is a resultant response, which from its direction is found to be due to
the responsive action of A. This would not have been the case if the end
B had been uninjured. We have thus experimentally verified the
assumption that in the same tissue an uninjured portion will be thrown
into a greater excitatory state than an injured, by the action of the
same stimulus.
CHAPTER V
PLANT RESPONSE—ON THE EFFECTS OF SINGLE STIMULUS AND OF SUPERPOSED
STIMULI
- Effect of single stimulus
- —Superposition of stimuli
- —Additive effect
- —Staircase effect
- —Fatigue
- —No fatigue when sufficient interval between stimuli
- —Apparent fatigue when stimulation frequency is increased
- —Fatigue under continuous stimulation.
Effect of single stimulus.—In a muscle a single stimulus gives rise to
a single twitch which may be recorded either mechanically or
electrically. If there is no fatigue, the successive responses to
uniform stimuli are exactly similar. Muscle when strongly stimulated
often exhibits fatigue, and successive responses therefore become
feebler and feebler. In nerves, however, there is practically no fatigue
and successive records are alike. Similarly, in plants, we shall find
some exhibiting marked fatigue and others very little.
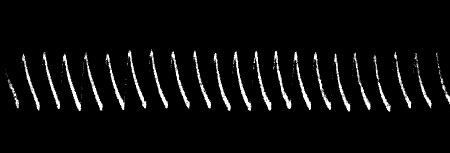
Fig. 16.—Uniform Responses (Radish)
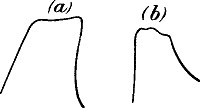
Fig. 17.—Fusion of Effect of Rapidly Succeeding Stimuli
(a) in muscle; (b) in carrot.
Superposition of stimuli.—If instead of a single stimulus a succession
of stimuli be superposed, it happens that a second shock is received
before recovery from the first has taken place. Individual effects will
then become more or less fused. When the frequency is sufficiently
increased, the intermittent effects are fused, and we find an almost
unbroken curve. When for example the muscle attains its maximum
contraction (corresponding to the frequency and strength of stimuli) it
is thrown into a state of complete tetanus, in which it appears to be
held rigid. If the rapidity be not sufficient for this, we have the
jagged curve of incomplete tetanus. If there is not much fatigue, the
upper part of the tetanic curve is approximately horizontal, but in
cases where fatigue sets in quickly, the fact is shown by the rapid
decline of the curve. With regard to all these points we find strict
parallels in plant response. In cases where there is no fatigue, the
successive responses are identical (fig. 16). With superposition of
stimuli we have fusion of effects, analogous to the tetanus of muscle
(fig. 17). And lastly, the influence of fatigue in plants is to produce
a modification of response-curve exactly similar to that of muscle (see
below). One effect of superposition of stimuli may be mentioned here.
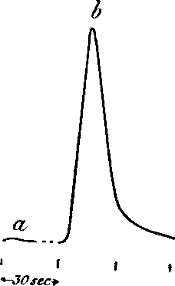
Fig. 18.—Additive Effect
(a) A single stimulus of 3° vibration produced little or no effect,
but the same stimulus when rapidly superposed thirty times, produced the
large effect (b). (Leaf-stalk of turnip.)
Additive effect.—It is found in animal responses that there is a
minimum intensity of stimulus, below which no response can be evoked.
But even a sub-minimal stimulus will, though singly ineffective, become
effective by the summation of several. In plants, too, we obtain a
similar effect, i.e. the summation of single ineffective stimuli
produces effective response (fig. 18).
Staircase effect.—Animal tissues sometimes exhibit what is known as the
‘staircase effect,’ that is to say, the heights of successive responses
are gradually increased, though the stimuli are maintained constant.
This is exhibited typically by cardiac muscle, though it is not unknown
even in nerve. The cause is obscure, but it seems to depend on the
condition of the tissue. It appears as if the molecular sluggishness of
tissue were in these cases only gradually removed under stimulation, and
the increased effects were due to increased molecular mobility. Whatever
be the explanation, I have sometimes observed the same staircase effect
in plants (fig. 19).

Fig. 19.—‘Staircase Effect’ in Plant
Fatigue.—It is assumed that in living substances like muscle, fatigue
is caused by the break down or dissimilation of tissue by stimulus. And
till this waste is repaired by the process of building-up or
assimilation, the functional activity of the tissue will remain below
par. There may also be an accumulation of the products of
dissimilation—‘the fatigue stuffs’—and these latter may act as poisons
or chemical depressants.
In an animal it is supposed that the nutritive blood supply performs the
two-fold task of bringing material for assimilation and removing the
fatigue products, thus causing the disappearance of fatigue. This
explanation, however, is shown to be insufficient by the fact that an
excised bloodless muscle recovers from fatigue after a short period of
rest. It is obvious that here the fatigue has been removed by means
other than that of renewed assimilation and removal of fatigue products
by the circulating blood. It may therefore be instructive to study
certain phases of fatigue exhibited under simpler conditions in
vegetable tissue, where the constructive processes are in abeyance, and
there is no active circulation for the removal of fatigue products.
It has been said before that the E.M. variation caused by stimulus is
the concomitant of a disturbance of the molecules of the responsive
tissues from their normal equilibrium, and that the curve of recovery
exhibits the restoration of the tissue to equilibrium.
No fatigue when sufficient interval between successive stimuli.—We may
thus gather from a study of the response-curve some indication of the
molecular distortion experienced by the excited tissue. Let us first
take the case of an experiment whose record is given in fig. 20, a.
It will be seen from that curve that one minute after the application of
stimulus there is a complete recovery of the tissue; the molecular
condition is exactly the same at the end of recovery as in the beginning
of stimulation. The second and succeeding response-curves therefore are
exactly similar to the first, provided a sufficient interval has been
allowed in each case for complete recovery. There is, in such a case,
no diminution in intensity of response, that is to say, no fatigue.
We have an exactly parallel case in muscles. ‘In muscle with normal
circulation and nutrition there is always an interval between each pair
of stimuli, in which the height of twitch does not diminish even after
protracted excitation, and no fatigue appears.’[10]
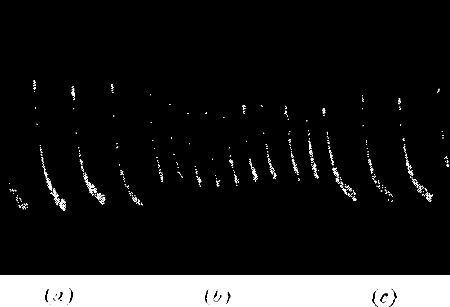
Fig. 20.—Record Showing Diminution of Response when
Sufficient Time is not Allowed for Full Recovery
In (a) stimuli were applied at intervals of one minute; in (b) the
intervals were reduced to half a minute; this caused a diminution of
response. In (c) the original rhythm is restored, and the response is
found to be enhanced. (Radish.)
Apparent fatigue when stimulation frequency increased.—If the rhythm of
stimulation frequency be now changed, and made quicker, certain
remarkable modifications will appear in the response-curves. In fig. 20,
the first part shows the responses at one minute interval, by which time
the individual recovery was complete.
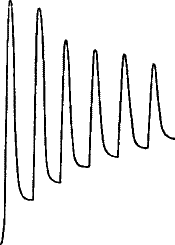
Fig. 21.—Fatigue in Celery
Vibration of 30° at intervals of half a minute.
The rhythm was now changed to intervals of half a minute, instead of
one, while the stimuli were maintained at the same intensity as before.
It will be noticed (fig. 20, b) that these responses appear much
feebler than the first set, in spite of the equality of stimulus. An
inspection of the figure may perhaps throw some light on the subject. It
will be seen that when greater frequency of stimulation was introduced,
the tissue had not yet had time to effect complete recovery from
previous strain. The molecular swing towards equilibrium had not yet
abated, when the new stimulus, with its opposing impulse, was received.
There is thus a diminution of height in the resultant response. The
original rhythm of one minute was now restored, and the succeeding
curves (fig. 20, c) at once show increased response. An analogous
instance may be cited in the case of muscle response, where ‘the height
of twitch diminishes more rapidly in proportion as the excitation
interval is shorter.’[11]
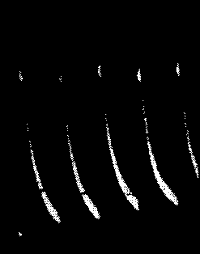
Fig. 22.—Fatigue in Leaf-stalk of Cauliflower
Stimulus: 30° vibration at intervals of one minute.
From what has just been said it would appear that one of the causes of
diminution of response, or fatigue, is the residual strain. This is
clearly seen in fig. 21, in a record which I obtained with celery-stalk.
It will be noticed there that, owing to the imperfect molecular recovery
during the time allowed, the succeeding heights of the responses have
undergone a continuous diminution. Fig. 22 gives a photographic record
of fatigue in the leaf-stalk of cauliflower.
It is evident that residual strain, other things being equal, will be
greater if the stimuli have been excessive. This is well seen in
fig. 23, where the set of first three curves A is for stimulus intensity
of 45° vibration, and the second set B, with an augmented response, for
stimulus intensity of 90° vibration. On reverting in C to stimulus
intensity of 45°, the responses are seen to have undergone a great
diminution as compared with the first set A. Here is seen marked
fatigue, the result of overstrain from excessive stimulation.
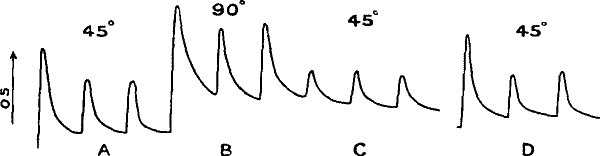
Fig. 23.—Effect of Overstrain in Producing Fatigue
Successive stimuli applied at intervals of one minute. The intensity of
stimulus in C is the same as that of A, but response is feebler owing to
previous over-stimulation. Fatigue is to a great extent removed after
fifteen minutes’ rest, and the responses in D are stronger than those in
C. The vertical line between arrows represents ·05 volt. (Turnip
leaf-stalk.)
If this fatigue be really due to residual strain effect, then, as strain
disappears with time, we may expect the responses to regain their former
height after a period of rest. In order to verify this, therefore, I
renewed the stimulation (at intensity 45°) after fifteen minutes. It
will at once be seen from record D how far the fatigue had been removed.
One peculiarity that will be noticed in these curves is that, owing to
the presence of comparatively little residual strain, the first response
of each set is relatively large. The succeeding responses are
approximately equal where the residual strains are similar. The first
response of A shows this because it had had long previous rest. The
first of B shows it because we are there passing for the first time to
increased stimulation. The first of C does not show it, because there
is now a strong residual strain. D again shows it because the strain has
been removed by fifteen minutes’ rest.
Fatigue under continuous stimulation.—The effect of fatigue is
exhibited in marked degree when a tissue is subjected to continuous
stimulation. In cases where there is marked fatigue, as for instance in
certain muscles, the top of the tetanic curve undergoes rapid decline. A
similar effect is obtained also with plants (fig. 24).
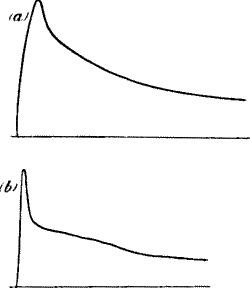
Fig. 24.—Rapid Fatigue under Continuous Stimulation in
(a) Muscle; (b) in Leaf-stalk of Celery
The effect of rest in producing molecular recovery, and hence in the
removal of fatigue, is well illustrated in the following set of
photographic records (fig. 25). The first shows the curve obtained with
a fresh plant. The effect is seen to be very large. Two minutes were
allowed for recovery, and then stimulation was repeated during another
two minutes. The response in this case is seen to be decidedly smaller.
A third case is somewhat similar to the second. A period of rest of five
minutes was now allowed, and the curve obtained subsequently, owing to
partial removal of residual strain, is found to exhibit greater
response.
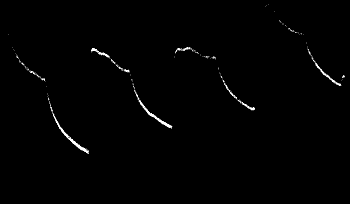
Fig. 25.—Effect of Continuous Vibration (through 50°) in
Carrot
In the first three records, two minutes’ stimulation is followed by two
minutes’ recovery. The last record was taken after the specimen had a
rest of five minutes. The response, owing to removal of fatigue by rest,
is stronger.
The results thus arrived at, under the simple conditions of vegetable
life, free as they are from all possible complications and
uncertainties, may perhaps throw some light on the obscure phenomena of
fatigue in animal tissues.
CHAPTER VI
PLANT RESPONSE—ON DIPHASIC VARIATION
- Diphasic variation
- —Positive after-effect and positive response
- —Radial E.M. variation.
When a plant is stimulated at any point, a molecular disturbance—the
excitatory wave—is propagated outwards from the point of its
initiation.
Diphasic variation.—This wave of molecular disturbance is attended by a
wave of electrical disturbance. (Usually speaking, the electrical
relation between disturbed and less disturbed is that of copper to
zinc.) It takes some time for a disturbance to travel from one point to
another, and its intensity may undergo a diminution as it recedes
further from its point of origin. Suppose a disturbance originated at C;
if two points are taken near each other, as A and B, the disturbance
will reach them almost at the same time, and with the same intensity.
The electric disturbance will be the same in both. The effect produced
at A and B will balance each other and there will be no resultant
current.
By killing or otherwise reducing the sensibility of B as is done in the
method of injury, there is no response at B, and we obtain the
unbalanced response, due to disturbance at A; the same effect is
obtained by putting a clamp between A and B, so that the disturbance
may not reach B. But we may get response even without injury or block.
If we have the contacts at A and B, and if we give a tap nearer A than
B (fig. 26, a), then we have (1) the disturbance reaching A earlier
than B. (2) The disturbance reaching A is much stronger than at B. The
disturbance at B may be so comparatively feeble as to be negligible.
It will thus be seen that we might obtain responses even without injury
or block, in cases where the disturbance is enfeebled in reaching a
distant point. In such a case on giving a tap near A a responsive
current would be produced in one direction, and in the opposite
direction when the tap is given near B (fig. 26, b). Theoretically,
then, we might find a neutral point between A and B, so that, on
originating the disturbance there, the waves of disturbance would reach
A and B at the same instant and with the same intensity. If, further,
the rate of recovery be the same for both points, then the electric
disturbances produced at A and B will continue to balance each other,
and the galvanometer will show no current. On taking a cylindrical root
of radish I have sometimes succeeded in finding a neutral point, which,
being disturbed, did not give rise to any resultant current. But
disturbing a point to the right or to the left gave rise to opposite
currents.
It is, however, difficult to obtain an absolutely cylindrical specimen,
as it always tapers in one direction. The conductivity towards the tip
of the root is not exactly the same as that in the ascending direction.
It is therefore difficult to fix an absolutely neutral point, but a
point may be found which approaches this very nearly, and on stimulating
the stalk near this, a very interesting diphasic variation has been
observed. In a specimen of cauliflower-stalk, (1) stimulus was applied
very much nearer A than B (the feeble disturbance reaching B was
negligible). The resulting response was upward and the recovery took
place in about sixty seconds.
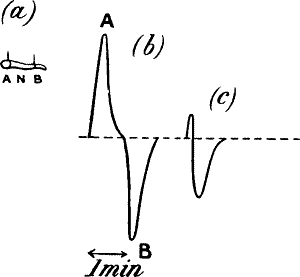
Fig. 26.—Diphasic Variation
(2) Stimulus was next applied near B. The resulting response was now
downward (fig. 26, b).
(3) The stimulus was now applied near the approximately neutral point N.
In this case, owing to a slight difference in the rates of propagation
in the two directions, a very interesting diphasic variation was
produced (fig. 26, c). From the record it will be seen that the
disturbance arrived earlier at A than at B. This produced an upward
response. But during the subsidence of the disturbance at A, the wave
reached B. The effect of this was to produce a current in the opposite
direction. This apparently hastened the recovery of A (from 60 seconds
to 12 seconds). The excitation of A now disappeared, and the second
phase of response, that due to excitation of B, was fully displayed.
Positive after-effect.—If we regard the response due to excitation of A
as negative, the later effect on B would appear as a subsequent positive
variation.
In the response of nerve, for example, where contacts are made at two
surfaces, injured and uninjured, there is sometimes observed, first a
negative variation, and then a positive after-effect. This may sometimes
at least be due to the proximal uninjured contact first giving the usual
negative variation, and the more distant contact of injury giving rise,
later, to the opposite, that is to say, apparently positive, response.
There is always a chance of an after-effect due to this cause, unless
(1) the injured end be completely killed and rendered quite
irresponsive, or (2) there be an effective block between A and B, so
that the disturbance due to stimulus can only act on one, and not on the
other.
I have found cases where, even when there was a perfect block, a
positive after-effect occurred. It would thus appear that if molecular
distortion from stimulus give rise to a negative variation, then during
the process of molecular recovery there may be over-shooting of the
equilibrium position, which may be exhibited as a positive variation.
Positive variation.—The responses given by muscle or nerve are,
normally speaking, negative. But that of retina is positive. The sign of
response, however, is apt to be reversed if there be any molecular
modification of the tissue from changes of external circumstances. Thus
it is often found that nerve in a stale condition gives positive,
instead of the normal negative variation, and stale retina often gives
negative, instead of the usual positive.
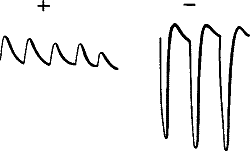
Fig. 27.—Abnormal Positive Responses in Stale Leaf-stalk
of Turnip converted into Normal Negative under Strong Stimulation[12]
The relative intensities of stimuli in the two cases are in the ratio of
1:7.
Curiously enough, I have on many occasions found exactly parallel
instances in the response of plants. Plants when fresh, as stated, give
negative responses as a rule. But when somewhat faded they sometimes
give rise to positive response. Again, just as in the modified nerve the
abnormal positive response gives place to the normal negative under
strong and long-continued stimulation, so also in the modified plant the
abnormal positive response passes into negative (fig. 27) under strong
stimulation. I was able in some cases to trace this process of gradual
reversal, by continuously increasing the intensity of stimulus. It was
then found that as the stimulus was increased, the positive at a certain
point underwent a reversal into the normal negative response (fig. 28).
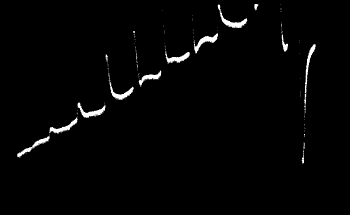
Fig. 28. Abnormal Positive passing into Normal Negative
in a Stale Specimen of Leaf-stalk of Cauliflower
Stimulus was gradually increased from 1 to 10, by means of
spring-tapper. When the stimulus intensity was 10, the response became
reversed into normal negative. (Parts of 8 and 9 are out of the plate.)
The plant thus gives a reversed response under abnormal conditions of
staleness. I have sometimes found similar reversal of response when the
plant is subjected to the abnormal conditions of excessively high or low
temperature.
Radial E.M. variation.—We have seen that a current of response flows in
the plant from the relatively more to the relatively less excited. A
theoretically important experiment is the following: A thick stem of
plant stalk was taken and a hole bored so as to make one contact with
the interior of the tissue, the other being on the surface. After a
while the current of injury was found to disappear. On exciting the stem
by taps or torsional vibration, a responsive current was observed which
flowed inwards from the more disturbed outer surface to the shielded
core inside (fig. 29). Hence it is seen that when a wave of disturbance
is propagated along the plant, there is a concomitant wave of radial
E.M. variation. The swaying of a tree by the wind would thus appear to
give rise to a radial E.M.F.
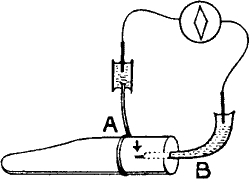
Fig. 29.—Radial E.M. Variation
CHAPTER VII
PLANT RESPONSE—ON THE RELATION BETWEEN STIMULUS AND RESPONSE
- Increased response with increasing stimulus
- —Apparent diminution of response with excessively strong stimulus.
As already said, in the living tissue, molecular disturbance induced by
stimulus is accompanied by an electric disturbance, which gradually
disappears with the return of the disturbed molecules to their position
of equilibrium. The greater the molecular distortion produced by the
stimulus, the greater is the electric variation produced. The electric
response is thus an outward expression of a molecular disturbance
produced by an external agency, the stimulus.
Curve of relation between stimulus and response.—In the curve showing
the relation between stimulus and response in nerve and muscle, it is
found that the molecular effect as exhibited either by contraction or
E.M. variation in muscle, or simply by E.M. variation in nerve, is at
first slight. In the second part, there is a rapidly increasing effect
with increased stimulus. Finally, a tendency shows itself to approach a
limit of response. Thus we find the curve at first slightly convex, then
straight and ascending, and lastly, concave to the abscissa (fig. 30).
In muscle the limit of response is reached much sooner than in nerve. As
will be seen, the range of variation of stimulus in these curves is not
very great. When the stimulus is carried beyond moderate limits, the
response, owing to fatigue or other causes, may sometimes undergo an
actual diminution.
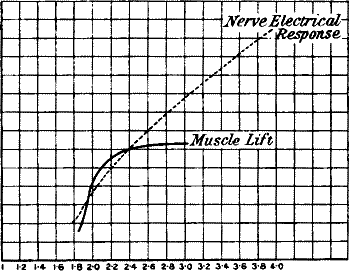
Fig. 30.—Curves Showing the Relation Between the
Intensity of Stimulus and Response
Abscissæ indicate increasing intensity of stimulus. Ordinates indicate
magnitude of response. (Waller.)
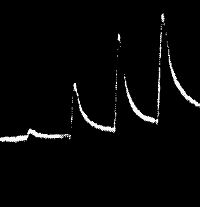
Fig. 31
Taps of increasing strength 1:2:3:4 producing increased response in leaf
stalk of turnip.
I have obtained very interesting results, with reference to the relation
between stimulus and response, when experimenting with plants. These
results are suggestive of various types of response met with in animal
tissues.
1. In order to obtain the simplest type of effects, not complicated by
secondary phenomena, one has to choose specimens which exhibit little
fatigue. Having procured these, I undertook two series of experiments.
In the first (A) the stimulus was applied by means of the
spring-tapper, and in the second (B) by torsional vibration.
(A) The first stimulus was given by a fall of the lever through h,
the second through 2 h, and so on. The response-curves clearly show
increasing effect with increased stimulus (fig. 31).
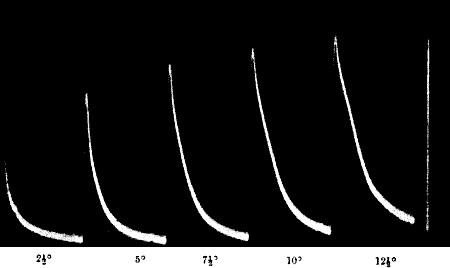
Fig. 32.—Increased Response with Increasing Vibrational
Stimuli (Cauliflower-stalk)
Stimuli applied at intervals of three minutes. Vertical line = ·1 volt.
(B) 1. The vibrational stimulus was increased from 2·5° to 5° to 7·5°
to 10° to 12·5° in amplitude. It will be observed how the intensity of
response tends to approach a limit (fig. 32).
Table showing the Increased E.M. Variation
produced by Increasing Stimulus
| Angle of Vibration |
E.M.F |
| 2·5° |
·044 volt |
| 5° |
·075 volt |
| 7·5° |
·090 volt |
| 10° |
·100 volt |
| 12·5° |
·106 volt |
2. The next figure shows how little variation is produced with low value
of stimulus, but with increasing stimulus the response undergoes a rapid
increase, after which it tends to approach a limit (fig. 33, a).
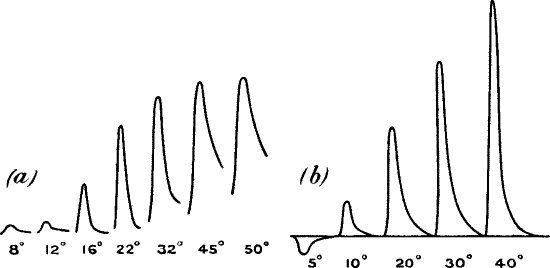
Fig. 33.—Responses to Increasing Stimuli produced by
Increasing Angle of Vibration
(a) Record with a specimen of fresh radish. Stimuli applied at
intervals of two minutes. The record is taken for one minute.
(b) Record for stale radish. There is a reversed response for the
feeble stimulus of 5° vibration.
3. As an extreme instance of the case just cited, I have often come
across a curious phenomenon. During the gradual increase of the stimulus
from a low value there would be apparently no response. But when a
critical value was reached a maximum response would suddenly occur, and
would not be exceeded when the stimulus was further increased. Here we
have a parallel to what is known in animal physiology as the ‘all or
none’ principle. With the cardiac muscle, for example, there is a
certain minimal intensity which is effective in producing response, but
further increase of stimulus produces no increase in response.
4. From an inspection of the records of responses which are given, it
will be seen that the slope of a curve which shows the relation of
stimulus to response will at first be slight, the curve will then ascend
rapidly, and at high values of stimulus tend to become horizontal. The
curve as a whole becomes, first slightly convex to the abscissa, then
straight and ascending, and lastly concave. A far more pronounced
convexity in the first part is shown in some cases, especially when the
specimen is stale. This is due to the fact that under these
circumstances response is apt to begin with an actual reversal of sign,
the plant under feebler than a certain critical intensity of stimulus
giving positive, instead of the normal negative, response (fig. 33,
b).
Diminution of response with excessively strong stimulus.—It is found
that in animal tissues there is sometimes an actual diminution of
response with excessive increase of stimulus. Thus Waller finds, in
working with retina, that as the intensity of light stimulus is
gradually increased, the response at first increases, and then sometimes
undergoes a diminution. This phenomenon is unfortunately complicated by
fatigue, itself regarded as obscure. It is therefore difficult to say
whether the diminution of response is due to fatigue or to some
reversing action of an excessively strong stimulus.
From fig. 33, b, above, it is seen that there was an actual reversal
of response in the lower portion of the curve. It is therefore not
improbable that there may be more than one point of reversal.
In physical phenomena we are, however, acquainted with numerous
instances of reversals. For example, a common effect of magnetisation
is to produce an elongation of an iron rod. But Bidwell finds that as
the magnetising force is pushed to an extreme, at a certain point
elongation ceases and is succeeded, with further increase of magnetising
force, by an actual contraction. Again a photographic plate, when
exposed continuously to light, gives at first a negative image. Still
longer exposure produces a positive. Then again we have a negative.
There is thus produced a series of recurrent reversals. In photographic
prints of flashes of lightning, two kinds of images are observed, one,
the positive—when the lightning discharge is moderately intense—and
the other, negative, the so-called ‘dark lightning’—due to the reversal
action of an intensely strong discharge.
In studying the changes of conductivity produced in metallic particles
by the stimulus of Hertzian radiation, I have often noticed that whereas
feeble radiation produces one effect, strong radiation produces the
opposite. Again, under the continuous action of electric radiation, I
have frequently found recurrent reversals.[13]
Diminution of response under strong stimulus traced to fatigue.—But
there are instances in plant response where the diminution effect can be
definitely traced to fatigue. The records of these cases are extremely
suggestive as to the manner in which the diminution is brought about.
The accompanying figures (fig. 34) give records of responses to
increasing stimulus. They were made with specimens of
cauliflower-stalks, one of which (a) showed little fatigue, while in
the other (b) fatigue was present. It will be seen that the curves
obtained by joining the apices of the successive single responses are
very similar.
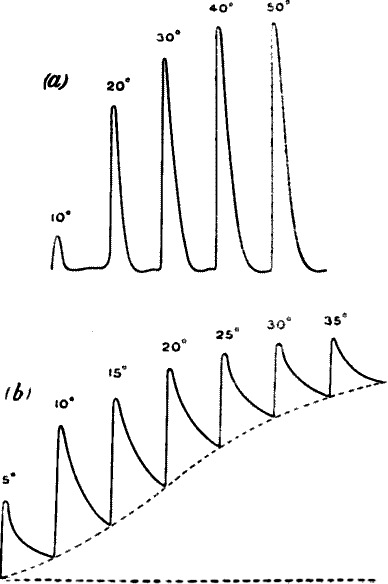
Fig. 34.—Responses to Increasing Stimulus obtained with Two Specimens of Stalk of Cauliflower
In (a) fatigue is absent, in (b) it is present.
In one case there is no fatigue, the recovery from each stimulus being
complete. Every response in the series therefore starts from a position
of perfect equilibrium, and the height of the single responses increases
with increasing stimulation. But in the second case, the strain is not
completely removed after any single stimulation of the series. That
recovery is partial is seen by the gradual shifting of the base line
upwards. In the former case the base line is horizontal and represents a
condition of complete equilibrium. Now, however, the base line, or line
of modified equilibrium, is tilted upwards. Thus even in this case if we
measure the heights of successive responses from the line of absolute
equilibrium, they will be found to increase with increasing stimulus.
Ordinarily, however, we make no allowance for the shifting of the base
line, measuring response rather from the place of its previous recovery,
or from the point of modified equilibrium. Judged in this way, the
responses undergo an apparent diminution.
CHAPTER VIII
PLANT RESPONSE—ON THE INFLUENCE OF TEMPERATURE
- Effect of very low temperature
- —Influence of high temperature
- —Determination of death-point
- —Increased response as after-effect of temperature variation
- —Death of plant and abolition of response by the action of steam.
For every plant there is a range of temperature most favourable to its
vital activity. Above this optimum, the vital activity diminishes, till
a maximum is reached, when it ceases altogether, and if this point be
maintained for a long time the plant is apt to be killed. Similarly, the
vital activity is diminished if the temperature be lowered below the
optimum, and again, at a minimum point it ceases, while below this
minimum the plant may be killed. We may regard these maximum and minimum
temperatures as the death-points. Some plants can resist these extremes
better than others. Length of exposure, it should however be remembered,
is also a determining factor in the question as to whether or not the
plant shall survive unfavourable conditions of temperature. Thus we have
hardy plants, and plants that are affected by excessive variations of
temperature. Within the characteristic power of the species, there may
be, again, a certain amount of individual difference.
These facts being known, I was anxious to deter mine whether the
undoubted changes induced by temperature in the vital activity of plants
would affect electrical response.
Effect of very low temperature.—As regards the influence of very low
temperature, I had opportunities of studying the question on the sudden
appearance of frost. In the previous week, when the temperature was
about 10° C., I had obtained strong electric response in radishes whose
value varied from ·05 to ·1 volt. But two or three days later, as the
effect of the frost, I found electric response to have practically
disappeared. A few radishes were, however, found somewhat resistant, but
the electric response had, even in these cases, fallen from the average
value of ·075 V. under normal temperature to ·003 V. after the frost.
That is to say, the average sensitiveness had been reduced to about
1/25th. On warming the frost-bitten radish to 20° C. there was an
appreciable revival, as shown by increase in response. In specimens
where the effect of frost had been very great, i.e. in those which
showed little or no electric response, warming did not restore
responsiveness. From this it would appear that frost killed some, which
could not be subsequently revived, whereas others were only reduced to a
condition of torpidity, from which there was revival on warming.
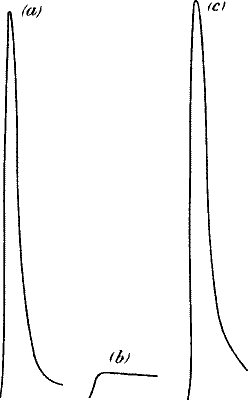
Fig. 35.—Diminution of Response in Eucharis by Lowering
of Temperature
(a) Normal response at 17° C.
(b) The response almost disappears when plant is subjected to −2° C.
for fifteen minutes.
(c) Revival of response on warming to 20° C.
I now tried the effect of artificial lowering of temperature on various
plants. A plant which is very easily affected by cold is a certain
species of Eucharis lily. I first obtained responses with the leaf-stalk
of this lily at the ordinary temperature of the room (17° C.). I then
placed it for fifteen minutes in a cooling chamber, temperature −2° C.,
for only ten minutes, after which, on trying to obtain response, it was
found to have practically disappeared. I now warmed the plant by
immersing it for awhile in water at 20° C., and this produced a revival
of the response (fig. 35). If the plant be subjected to low temperature
for too long a time, there is then no subsequent revival.
I obtained a similar marked diminution of response with the flower-stalk
of Arum lily, on lowering the temperature to zero.
My next attempt was to compare the sensibility of different plants to
the effect of lowered temperatures. For this purpose I chose three
specimens: (1) Eucharis lily; (2) Ivy; and (3) Holly. I took their
normal response at 17° C., and found that, generally speaking, they
attained a fairly constant value after the third or fourth response.
After taking these records of normal response, I placed the specimens in
an ice-chamber, temperature 0° C., for twenty-four hours, and
afterwards took their records once more at the ordinary temperature of
the room. From these it will be seen that while the responsiveness of
Eucharis lily, known to be susceptible to the effect of cold, had
entirely disappeared, that of the hardier plants, Holly and Ivy, showed
very little change (fig. 36).
Another very curious effect that I have noticed is that when a plant
approaches its death-point by reason of excessively high or low
temperature, not only is its general responsiveness diminished almost to
zero, but even the slight response occasionally becomes reversed.
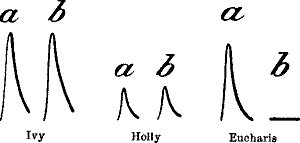
Fig. 36.—After-effect of Cold on Ivy, Holly, and
Eucharis Lily
a. The normal response; b. Response after subjection to freezing
temperature for twenty-four hours.
Influence of high temperature, and determination of death-point.—I next
tried to find out whether a rise of temperature produced a depression of
response, and whether the response disappeared at a maximum
temperature—the temperature of death-point. For this purpose I took a
batch of six radishes and obtained from them responses at gradually
increasing temperatures. These specimens were obtained late in the
season, and their electric responsiveness was much lower than those
obtained earlier. The plant, previously kept for five minutes in water
at a definite temperature (say 17° C.), was mounted in the vibration
apparatus and responses observed. The plant was then dismounted, and
replaced in the water-bath at a higher temperature (say 30° C.) again,
for five minutes. A second set of responses was now taken. In this way
observations were made with each specimen till the temperature at which
response almost or altogether ceased was reached. I give below a table
of results obtained with six specimens of radish, from which it would
appear that response begins to be abolished in these cases at
temperatures varying from 53° to 55° C.
Table showing Effect of High Temperature in
Abolishing Response
| Temperature |
Galvanometric response
(100 dns. = ·07 V.) |
| (1) { |
17° C |
70 |
dns. |
| 53° |
4 |
" |
| (2) { |
17° |
160 |
" |
| 53° |
1 |
" |
| (3) { |
17° |
100 |
" |
| 50° |
2 |
" |
| (4) { |
17° |
80 |
" |
| 55° |
0 |
" |
| (5) { |
17° |
40 |
" |
| 60° |
0 |
" |
| (6) { |
17° |
60 |
" |
| 55° |
0 |
" |
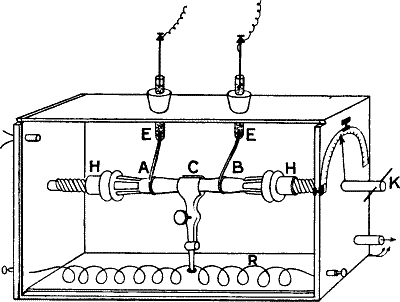
Fig. 37.—The Glass Chamber containing the Plant
Amplitude of vibration which determines the intensity of stimulus is
measured by the graduated circle seen to the right. Temperature is
regulated by the electric heating coil R. For experiments on action of
anæsthetics, vapour of chloroform is blown in through the side tube.
Electric heating.—The experiments just described were, however, rather
troublesome, inasmuch as, in order to produce each variation of
temperature, the specimen had to be taken out of the apparatus, warmed,
and remounted. I therefore introduced a modification by which this
difficulty was obviated. The specimen was now enclosed in a glass
chamber (fig. 37), which also contained a spiral of German-silver wire,
through which electric currents could be sent, for the purpose of
heating the chamber. By varying the intensity of the current, the
temperature could be regulated at will. The specimen chosen for
experiment was the leaf-stalk of celery. It was kept at each given
temperature for ten minutes, and two records were taken during that
time. It was then raised by 10° C., and the same process was repeated.
It will be noticed from the record (fig. 38) that in this particular
case, as the temperature rose from 20° C. to 30° C., there was a marked
diminution of response. At the same time, in this case at least,
recovery was quicker. At 20° C., for example, the response was 21 dns.,
and the recovery was not complete in the course of a minute. At 30° C.,
however, the response had been reduced to 7·5 divisions, but there was
almost complete recovery in twelve seconds. As the temperature was
gradually increased, a continuous decrease of response occurred. This
diminution of response with increased temperature appears to be
universal, but the quickening of recovery may be true of individual
cases only.
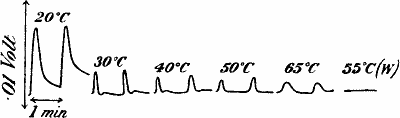
Fig. 38.—Effect of Temperature on Response
The response was abolished at the hot-water temperature of 55° C.
Table showing Diminution of Response with Increasing Temperature
(·01 Volt = 35 divisions)
| Temperature | Response |
|---|
| 20° | 21 |
| 30° | 7·5 |
| 40° | 5·5 |
| 50° | 4 |
| 65° | 3 |
In radishes response disappeared completely at 55° C., but with celery,
heated in the manner described, I could not obtain its entire abolition
at 60° C. or even higher. A noticeable circumstance, however, was the
prolongation of the period of recovery at these high temperatures. I
soon understood the reason of this apparent anomaly. The method adopted
in the present case was that of dry heating, whereas the previous
experiments had been carried on by the use of hot water. It is well
known that one can stand a temperature of 100° C. without ill effects in
the hot-air chamber of a Turkish bath, while immersion in water at
100° C. would be fatal.
In order to find out whether subjection to hot water would kill the
celery-stalk, I took it out and placed it for five minutes in water at
55° C. This, as will be seen from the record taken afterwards,
effectively killed the plant (fig. 38, w).
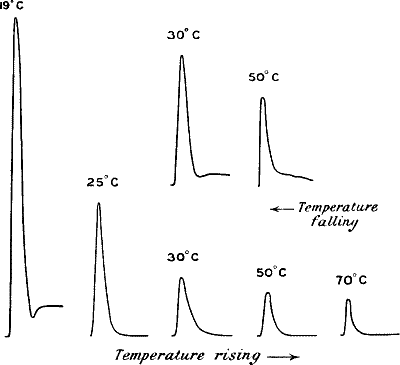
Fig. 39.—Effect of Rising and Falling Temperature on the
Response Of Scotch Kale
Increased sensitiveness as after-effect of temperature variation.—A
very curious effect of temperature variation is the marked increase of
sensitiveness which often appears as its after-effect. I noticed this
first in a series of observations where records were taken during the
rise of temperature and continued while the temperature was falling
(fig. 39). The temperature was adjusted by electric heating. It was
found that the responses were markedly enhanced during cooling, as
compared with responses given at the same temperatures while warming
(see table). Temperature variation thus seems to have a stimulating
effect on response, by increasing molecular mobility in some way. The
second record (fig. 40) shows the variation of response in Eucharis lily
(1) during the rise, and (2) during the fall of temperature. Fig. 41
gives a curve of variation of response during the rise and fall of
temperature.
Table showing the Variation of Response in Scotch Kale
during the Rise and Fall of Temperature
| Temperature |
↓ |
Response
[Temperature falling] |
|
Response
[Temperature rising] |
↑ |
| 19° C. |
47 |
dns. |
— |
| 25° " |
24 |
" |
— |
| 30° " |
11 |
" |
23 |
dns. |
| 50° " |
8 |
" |
16 |
" |
| 70° " |
7 |
" |
— |
|
|
|
|
→ |
|
|
|

Fig. 40.—Records of Responses in Eucharis Lily during
Rise and Fall of Temperature
Stimulus constant, applied at intervals of one minute. The temperature
of plant-chamber gradually rose on starting current in the heating coil;
on breaking current, the temperature fell gradually. Temperature
corresponding to each record is given below.
Temperature rising: (1) 20°, (2) 20°, (3) 22°, (4) 38°, (5) 53°,
(6) 68°, (7) 65°.
Temperature falling: (8) 60°, (9) 51°, (10) 45°, (11) 40°, (12) 38°.
Point of temperature maximum.—We have seen how, in cases of lowered
temperature, response is abolished earlier in plants like Eucharis,
which are affected by cold, than in the hardier plants such as Holly and
Ivy. Plants again are unequally affected as regards the upper range. In
the case of Scotch kale, for instance, response disappears after ten
minutes of water temperature of about 55° C., but with Eucharis fairly
marked response can still be obtained after such immersion and does not
disappear till it has been subjected for ten minutes to hot water, at a
temperature of 65° C. or even higher. The reason of this great power of
resistance to heat is probably found in the fact that the Eucharis is a
tropical plant, and is grown, in this country, in hot-houses where a
comparatively high temperature is maintained.
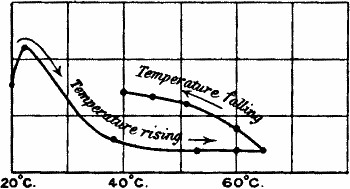
Fig. 41.—Curve showing Variation of Response in Eucharis
with the Rise and Fall of Temperature
The effect of steam.—I next wished to obtain a continuous record by
which the effects of suddenly increased temperatures, culminating in the
death of the plant, might be made evident. For this purpose I mounted
the plant in the glass chamber, into which steam could be introduced. I
had chosen a specimen which gave regular response. On the introduction
of steam, with the consequent sudden increase of temperature, there was
a transitory augmentation of excitability. But this quickly disappeared,
and in five minutes the plant was effectively killed, as will be seen
graphically illustrated in the record (fig. 42).
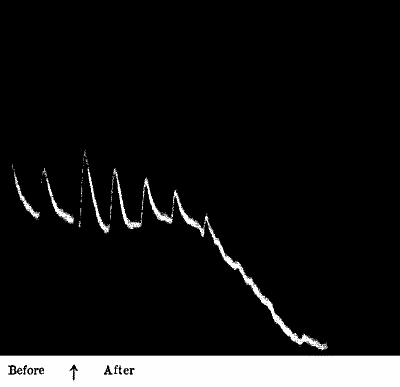
Fig. 42.—Effect of Steam in Killing Response
The two records to the left exhibit normal response at 17° C. Sudden
warming by steam produced at first an increase of response, but five
minutes exposure to steam killed the plant (carrot) and abolished the
response.
Vibrational stimulus of 30° applied at intervals of one minute; vertical
line = ·1 volt.
It will thus be seen that those modifications of vital activity which
are produced in plants by temperature variation can be very accurately
gauged by electric response. Indeed it may be said that there is no
other method by which the moment of cessation of vitality can be so
satisfactorily distinguished. Ordinarily, we are able to judge that a
plant has died, only after various indirect effects of death, such as
withering, have begun to appear. But in the electric response we have an
immediate indication of the arrest of vitality, and we are thereby
enabled to determine the death-point, which it is impossible to do by
any other means.
It may be mentioned here that the explanation suggested by Kunkel, of
the response being due to movement of water in the plant, is inadequate.
For in that case we should expect a definite stimulation to be under all
conditions followed by a definite electric response, whose intensity and
sign should remain invariable. But we find, instead, the response to be
profoundly modified by any influence which affects the vitality of the
plant. For instance, the response is at its maximum at an optimum
temperature, a rise of a few degrees producing a profound depression;
the response disappears at the maximum and minimum temperatures, and is
revived when brought back to the optimum. Anæsthetics and poisons
abolish the response. Again, we have the response undergoing an actual
reversal when the tissue is stale. All these facts show that mere
movement of water could not be the effective cause of plant response.
CHAPTER IX
PLANT RESPONSE—EFFECT OF ANÆSTHETICS AND POISONS
- Effect of anæsthetics, a test of vital character of response
- —Effect of chloroform
- —Effect of chloral
- —Effect of formalin
- —Method in which response is unaffected by variation of resistance
- —Advantage of block method
- —Effect of dose.
The most important test by which vital phenomena are distinguished is
the influence on response of narcotics and poisons. For example, a nerve
when narcotised by chloroform exhibits a diminishing response as the
action of the anæsthetic proceeds. (See below, fig. 43.) Similarly,
various poisons have the effect of permanently abolishing all response.
Thus a nerve is killed by strong alkalis and strong acids. I have
already shown how plants which previously gave strong response did not,
after application of an anæsthetic or poison, give any response at all.
In these cases it was the last stage only that could be observed. But it
appeared important to be able to trace the growing effect of
anæsthetisation or poisoning throughout the process. There were,
however, two conditions which it at first appeared difficult to meet.
First it was necessary to find a specimen which would normally exhibit
no fatigue, and give rise for a long time to a uniform series of
response. The immediate changes made in the response, in consequence of
the application of chemical reagents, could then be demonstrated in a
striking manner. And with a little trouble, specimens can be secured in
which perfect regularity of response is found. The record given in
fig. 16, obtained with a specimen of radish, shows how possible it is to
secure plants in which response is absolutely regular. I subjected this
to uniform stimulation at intervals of one minute, during half an hour,
without detecting the least variation in the responses. But it is of
course easier to find others in which the responses as a whole may be
taken as regular, though there may be slight rhythmic fluctuations. And
even in these cases the effect of reagents is too marked and sudden to
escape notice.
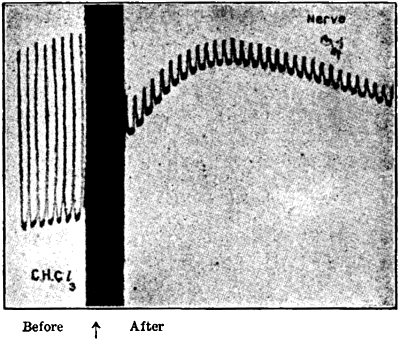
Fig. 43.—Effect of Chloroform on Nerve Response
(Waller)
For the obtaining of constant and strong response I found the best
materials to be carrot and radish, selected individuals from which gave
most satisfactory results. The carrots were at their best in August and
September, after which their sensitiveness rapidly declined. Later,
being obliged to seek for other specimens, I came upon radish, which
gave good results in the early part of November; but the setting-in of
the frost had a prejudicial effect on its responsiveness. Less perfect
than these, but still serviceable, are the leaf-stalks of turnip and
cauliflower. In these the successive responses as a whole may be
regarded as regular, though a curious alternation is sometimes noticed,
which, however, has a regularity of its own.
My second misgiving was as to whether the action of reagents would be
sufficiently rapid to display itself within the time limit of a
photographic record. This would of course depend in turn upon the
rapidity with which the tissues of the plant could absorb the reagent
and be affected by it. It was a surprise to me to find that, with good
specimens, the effect was manifested in the course of so short a time as
a minute or so.
Effect of chloroform.—In studying the effect of chemical reagents in
plants, the method is precisely similar to that employed with nerve;
that is to say, where vapour of chloroform is used, it is blown into the
plant chamber. In cases of liquid reagents, they are applied on the
points of contact A and B and their close neighbourhood. The mode of
experiment was (1) to obtain a series of normal responses to uniform
stimuli, applied at regular intervals of time, say one minute, the
record being taken the while on a photographic plate. (2) Without
interrupting this procedure, the anæsthetic agent, vapour of chloroform,
was blown into the closed chamber containing the plant. It will be seen
how rapidly chloroform produces depression of response (fig. 44), and
how the effect grows with time. In these experiments with plants, the
same curious shifting of the zero line is sometimes noticed as in nerve
when subjected similarly to the action of reagents. This is a point of
minor importance, the essential point to be noticed being that the
responses are rapidly reduced.
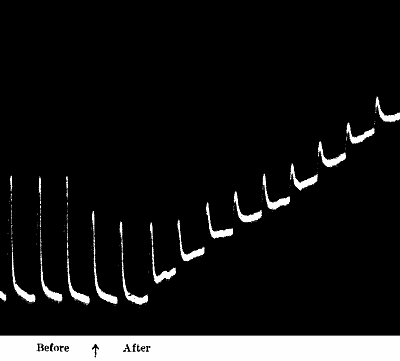
Fig. 44.—Effect of Chloroform on Responses of Carrot
Stimuli of 25° vibration at intervals of one minute.
Effects of chloral and formalin.—I give below (figs. 45, 46) two sets
of records, one for the reagent chloral and the other for formalin. The
reagents were applied in the form of a solution on the tissue at the two
leading contacts, and the contiguous surface. The rhythmic fluctuation
in the normal response shown in fig. 45 is interesting. The abrupt
decline, within a minute of the application of chloral, is also
extremely well marked.
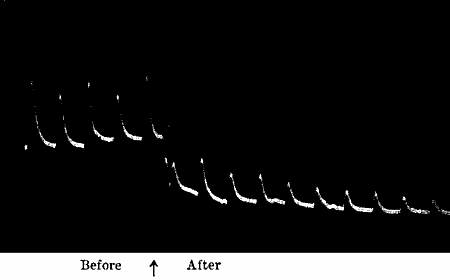
Fig. 45.—Action of Chloral Hydrate on the Responses of
Leaf-stalk of Cauliflower
Vibration of 25° at intervals of one minute.
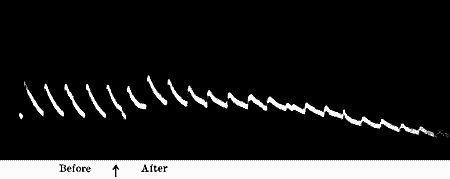
Fig. 46.—Action of Formalin (Radish)
Response unaffected by variation of resistance.—In order to bring out
clearly the main phenomena, I have postponed till now the consideration
of a point of some difficulty. To determine the influence of a reagent
in modifying the excitability of the tissue, we rely upon its effect in
exalting or depressing the responsive E.M. variation. We read this
effect by means of galvanometric deflections. And if the resistance of
the circuit remained constant, then an increase of galvanometer
deflection would accurately indicate a heightened or depressed E.M.
response, due to greater or less excitability of tissue caused by the
reagent. But, by the introduction of the chemical reagent, the
resistance of the tissue may undergo change, and owing to this cause,
modification of response as read by the galvanometer may be produced
without any E.M. variation. The observed variation of response may thus
be partly owing to some unknown change of resistance, as well as to that
of the E.M. variation in response to stimulus.
We may however discriminate as to how much of the observed change is due
to variation of resistance by comparing the deflections produced in the
galvanometer by the action of a definite small E.M.F. before and after
the introduction of the reagent. If the deflections be the same in both
cases, we know that the resistance has not varied. If there have been
any change, the variation of deflection will show the amount, and we can
make allowance accordingly.
I have however adopted another method, by which all necessity of
correction is obviated, and the galvanometric deflections simply give
E.M. variations, unaffected by any change in the resistance of the
tissue. This is done by interposing a very large and constant resistance
in the external circuit and thereby making other resistances negligible.
An example will make this point clear. Taking a carrot as the vegetable
tissue, I found its resistance plus the resistance of the
non- polarisable electrode equal to 20,000 ohms. The introduction of a
chemical reagent reduced it to 19,000 ohms. The resistance of the
galvanometer is equal to 1,000 ohms. The high external resistance was
1,000,000 ohms. The variation of resistance produced in the circuit
would therefore be 1,000 in (1,000,000 + 19,000 + 1,000) or one part in
1,020. Therefore the variation of galvanometric deflection due to change
of resistance would be less than one part in a thousand (cf. fig. 49).
The advantage of the block method.—In these investigations I have used
the block method, instead of that of negative variation, and I may here
draw attention to the advantages which it offers. In the method of
negative variation, one contact being injured, the chemical reagents act
on injured and uninjured unequally, and it is conceivable that by this
unequal action the resting difference of potential may be altered. But
the intensity of response in the method of injury depends on this
resting difference. It is thus hypothetically possible that on the
method of negative variation there might be changes in the responses
caused by variation of the resting difference, and not necessarily due
to the stimulating or depressing effect of the reagent on the tissue.
But by the block method the two contacts are made with uninjured
surfaces, and the effect of reagents on both is similar. Thus no
advantage is given to one contact over the other. The changes now
detected in response are therefore due to no adventitious circumstance,
but to the reagent itself. If further verification be desired as to the
effect of the reagent, we can obtain it by alternate stimulation of the
A and B ends. Both ends will then show the given change. I give below a
record of responses given by two ends of leaf-stalk of turnip,
stimulated alternately in the manner described. The stalk used was
slightly conical, and owing to this difference between the A and B ends
the responses given by one end were slightly different from those given
by the other, though the stimuli were equal. A few drops of 10 per cent.
solution of NaOH was applied to both the ends. It will be seen how
quickly this reagent abolished the response of both ends (fig. 47).
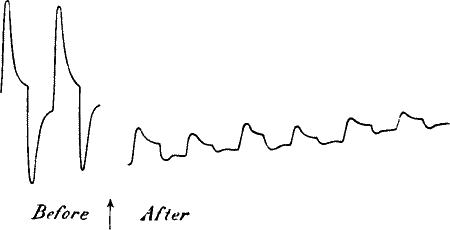
Fig. 47.—Abolition of Response at both A and B Ends by
the Action of NaOH
Stimuli of 30° vibration were applied at intervals of one minute to A
and B alternately. Response was completely abolished twenty-four minutes
after application of NaOH.
Effect of dose.—It is sometimes found that while a reagent acts as a
poison when given in large quantities, it may act as a stimulant in
small doses. Of the two following records fig. 48 shows the slight
stimulating effect of very dilute KOH, and fig. 49 exhibits nearly
complete abolition of response by the action of the same reagent when
given in stronger doses.
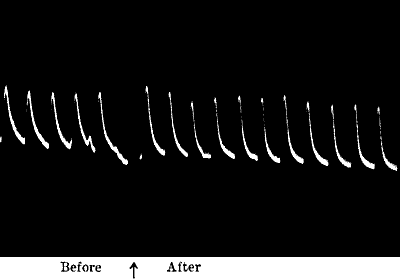
Fig. 48.—Stimulating Action of very dilute KOH
So we see that, judged by the final criterion of the effect produced by
anæsthetics and poisons, the plant response fulfils the test of vital
phenomenon. In previous chapters we have found that in the matter of
response by negative variation, of the presence or absence of fatigue,
of the relation between stimulus and response, of modification of
response by high and low temperatures, and even in the matter of
occasional abnormal variations such as positive response in a modified
tissue, they were strictly correspondent to similar phenomena in animal
tissues. The remaining test, of the influence of chemical reagents,
having now been applied, a complete parallelism may be held to have been
established between plant response on the one hand, and that of animal
tissue on the other.
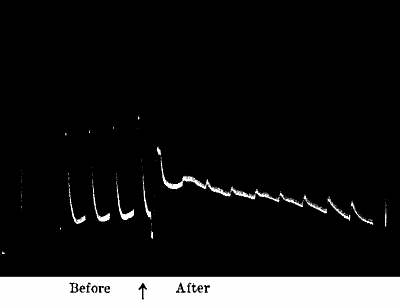
Fig. 49.—Nearly Complete Abolition of Response by Strong
KOH
The two vertical lines are galvanometer deflections due to ·1 volt,
before and after the application of reagent. It will be noticed that the
total resistance remains unchanged.
CHAPTER X
RESPONSE IN METALS
- Is response found in inorganic substances?
- —Experiment on tin, block method
- —Anomalies of existing terminology
- —Response by method of depression
- —Response by method of exaltation.
We have now seen that the electrical sign of life is not confined to
animals, but is also found in plants. And we have seen how electrical
response serves as an index to the vital activity of the plant, how with
the arrest of this vital activity electrical response is also arrested
temporarily, as in the case amongst others of anæsthetic action, and
permanently, for instance under the action of poisons. Thus living
tissues—both animal and vegetable—may pass from a responsive to an
irresponsive condition, from which latter there may or may not be
subsequent revival.
Hitherto, as already said, electrical response in animals has been
regarded as a purely physiological phenomenon. We have proved by various
tests that response in plants is of the same character. And we have seen
that by physiological phenomena are generally understood those of which
no physical explanation can be offered, they being supposed to be due to
the play of some unknown vital force existing in living substances and
giving rise to electric response to stimulation as one of its
manifestations.
Is response found in inorganic substances?[14]—It is now for us,
however, to examine into the alleged super-physical character of these
phenomena by stimulating inorganic substances and discovering whether
they do or do not give rise to the same electrical mode of response
which was supposed to be the special characteristic of living
substances. We shall use the same apparatus and the same mode of
stimulation as those employed in obtaining plant response, merely
substituting, for the stalk of a plant, a metallic wire, say ‘tin’
(fig. 50). Any other metal could be used instead of tin.
Experiment on tin, block method.—Let us then take a piece of tin
wire[15] from which all strains have been previously removed by
annealing, and hold it clamped in the middle at C. If the strains have
been successfully removed A and B will be found iso-electric, and no
current will pass through the galvanometer. If A and B are not exactly
similar, there will be a slight current. But this will not materially
affect the results to be described presently, the slight existing
current merely adding itself algebraically to the current of response.
If we now stimulate the end A by taps, or better still by torsional
vibration, a transitory ‘current of action’ will be found to flow in the
wire from B to A, from the unstimulated to the stimulated, and in the
galvanometer from the stimulated to the unstimulated. Stimulation of B
will give rise to a current in an opposite direction.
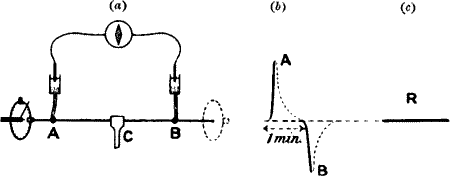
Fig. 50.—Electric Response in Metals
(a) Method of block; (b) Equal and opposite responses when the ends
A and B are stimulated; the dotted portions of the curves show recovery;
(c) Balancing effect when both the ends are stimulated
simultaneously.
Experiment to exhibit the balancing effect.—If the wire has been
carefully annealed, the molecular condition of its different portions is
found to be approximately the same. If such a wire be held at the
‘balancing point’ (which is at or near the middle) by the clamp, and a
quick vibration, say, of 90° be given to A, an upward deflection will be
produced; if a vibration of 90° be given to B, there will be an equal
downward deflection. If now both the ends A and B are vibrated
simultaneously, the responsive E.M. variation at the two ends will
continuously balance each other and the galvanometer spot will remain
quiescent (fig. 30, A, B, R). This balance will be still maintained when
the block is removed and the wire is vibrated as a whole. It is to be
remembered that with the length of wire constant, the intensity of
stimulus increases with the amplitude of vibration. Again, keeping the
amplitude constant, the intensity of stimulus is increased by shortening
the wire. Hence it will be seen that if the clamp be shifted from the
balancing point towards A, simultaneous vibration of A and B through 90°
will now give a resultant upward deflection, showing that the A response
is now relatively stronger. Thus keeping the rest of the circuit
untouched, merely moving the clamp from the left, past the balancing
point to the right, we get either a positive, or zero, or negative,
resultant effect.
In tin the current of response is from the less to the more excited
point. In the retina also, we found the current of action flowing from
the less stimulated to the more stimulated, and as that is known as a
positive response, we shall consider the normal response of tin to be in
like manner positive.
Just as the response of retina or nerve, under certain molecular
conditions, undergoes reversal, the positive being then converted into
negative, and negative into positive, so it will be shown that the
response in metallic wires under certain conditions is found to undergo
reversal.
Anomalies of present terminology.—When there is no current of injury, a
particular current of response can hardly be called a negative, or
positive, variation. Such nomenclature is purely arbitrary, and leads,
as will be shown, to much confusion. A more definite terminology, free
from misunderstanding, would be, as already said, to regard the current
towards the more stimulated as positive, and that towards the less
stimulated, in tissue or wire, as negative.
The stimulated end of tin, say the end A, thus becomes zincoid, i.e.
the current through the electrolyte (non-polarisable electrodes with
interposed galvanometer) is from A to B, and through the wire, from
the less stimulated B to the more stimulated A. Conversely, when B is
stimulated, the action current flows round the circuit in an opposite
direction. This positive is the most usual form of response, but there
are cases where the response is negative.
In order to show that normally speaking a stimulated wire becomes
zincoid, and also to show once more the anomalies into which we may fall
by adopting no more definite terminology than that of negative
variation, I have devised the following experiment (fig. 51). Let us
take a bar, one half of which is zinc and the other half copper, clamped
in the middle, so that a disturbance produced at one end may not reach
the other; the two ends are connected to a galvanometer through
non-polarisable electrodes. The current through the electrolyte
(non-polarisable electrodes and interposed galvanometer) will then flow
from left to right. We must remember that metals under stimulation
generally become, in an electrical sense, more zinc-like. On vibrating
the copper end (inasmuch as copper would then become more zinc-like) the
difference of potential between zinc and copper ought to be diminished,
and the current flowing in the circuit would therefore be lessened. But
vibration of the zinc end ought to increase the potential difference,
and there ought to be then an increase of current during stimulation of
zinc.
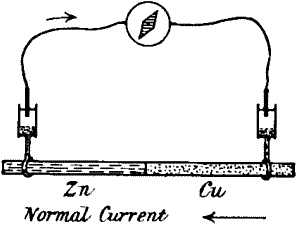
Fig. 51.—Current of Response towards the Stimulated End
Hence when Cu stimulated: action current →, normal E.M.F. diminished
(·85-·009) V.
When Zn stimulated: action current ←, normal E.M.F. increased (·85 +
·013) V.
In the particular experiment of fig. 51, the E.M.F. between the zinc and
copper ends was found to be ·85 volt. This was balanced by a
potentiometer arrangement, so that the galvanometer spot came to zero.
On vibrating the zinc wire, a deflection of 33 dns. was obtained, in a
direction which showed an increase of E.M.F. On stopping the
vibration, the spot of light came back to zero. On now vibrating the
copper wire, a deflection of 23 dns. was obtained in an opposite
direction, showing a diminution of E.M.F. This transitory responsive
variation disappeared on the cessation of disturbance.
By disturbing the balance of the potentiometer, the galvanometer
deflection due to a known increase of E.M.F. was found from which the
absolute E.M. variation caused by disturbance of copper or zinc was
determined.
It was thus found that stimulation of zinc had increased the P.D. by
fifteen parts in 1,000, whereas stimulation of copper had decreased it
by eleven parts in 1,000. According to the old terminology, the response
due to stimulation of zinc would have been regarded as positive
variation, that of copper negative. The responses however are not
essentially opposite in character, the action current in the bar being
in both cases towards the more excited. For this reason it would be
preferable, as already said, to employ the terms positive and negative
in the sense I have suggested, i.e. positive, when the current in the
acted substance is towards the more excited, and negative, when towards
the less excited. The method of block is, as I have already shown, the
most perfect for the study of these responses.
In the experiment fig. 50, if the block is abolished and the wire is
struck in the middle, a wave of molecular disturbance will reach A and
B. The mechanical and the attendant electrical disturbance will at these
points reach a maximum and then gradually subside. The resultant effect
in the galvanometer will be due to EA-EB when EA and EB are
the electrical variations produced at A and B by the stimulus. The
electric changes at A and B will continuously balance each other, and
the resultant effect on the galvanometer will be zero: (a) if the
exciting disturbance reaches A and B at the same time and with the same
intensity; (b) if the molecular condition is similar at the two
points; and (c) if the rate of rise and subsidence of excitation is
the same at the two points. In order that a resultant effect may be
exhibited in the galvanometer, matters have to be so arranged that the
disturbance may reach one point, say A, and not B, and vice versa.
This was accomplished by means of a clamp, in the method of block. Again
a resultant differential action may be obtained even when the
disturbance reaches both A and B, if the electrical excitability of one
point is exalted or depressed by physical or chemical means. We shall in
Chap. XVI study in detail the effect of chemical reagents in producing
the enhancement or depression of excitability. There are thus two other
means of obtaining a resultant effect—(2) by the method of relative
depression, (3) by the method of relative exaltation.
Electric response by method of depression.—We may thus by reducing or
abolishing the excitability of one end by means of suitable chemical
reagents (so-called method of injury) obtain response in metals without
a block. The entire length of the wire may then be stimulated and a
resultant response will be produced, owing to the difference between the
excitability of the two ends. A piece of tin wire is taken, and one
normal contact is made at A (strip of cloth moistened with water, or
very dilute salt solution). The excitability of B is depressed by a few
drops of strong potash or oxalic acid. By the application of the latter
there will be a small P.D. between A and B; this will simply produce a
displacement of zero. By means of a potentiometer the galvanometer spot
may be brought back to the original position. The shifting of the zero
will not affect the general result. The effect of mechanical stimulus is
to produce a transient electro-motive response, which will be superposed
algebraically on the existing P.D. The deflection will take place from
the modified zero to which the spot returns during recovery. On now
stimulating the wire as a whole by, say, torsional vibration, the
current of response will be found towards the more excitable, i.e. from
B to A (fig. 52, a).
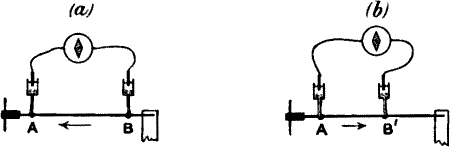
Fig. 52.—Response by Method of Depression (Without
Block)
When the wire is stimulated as a whole the current of response is
towards the more excitable.
In (a) A is a normal contact, B has been depressed by oxalic acid;
current of response is towards the more excitable A.
In (b) the same wire is used, only A is depressed by oxalic acid and a
normal contact is made at a fresh point B′, a little to the left of B in
(a). Current of response is now from A towards the more excitable B′.
A corroborative reversal experiment may next be made on the same piece
of wire. The normal contact, through water or salt solution, is now made
at B′, a little to the left of B. The excitability of A is now depressed
by oxalic acid. On stimulation of the whole wire, the current of
response will now be found to flow in an opposite direction—i.e. from A
to B′—but still from the relatively less to the relatively more
excitable (fig. 52, b).
From these experiments it will be seen how in one identical piece of
wire the responsive current flows now in one direction and then in the
other, in absolute conformity with theoretical considerations.
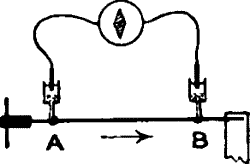
Fig. 53.—Method of Exaltation
The contact B is made more excitable by chemical stimulant
(Na2CO3). The current of response is towards the more excitable
B.
Method of exaltation.—A still more striking corroboration of these
results may, however, be obtained by the converse process of relative
exaltation of the responsiveness of one contact. This may be
accomplished by touching one contact, say B, with a reagent which like
Na2CO3 exalts the electric excitability. On stimulation of the
wire, the current of response is towards the more excitable B (fig. 53).
I give four records (fig. 54) which will clearly exhibit the responses
as obtained by the methods of relative depression or exaltation. In
(a) B is touched with the excitant Na2CO3, a permanent current
flows from A to B, response to stimulus is in the same direction as the
permanent current (positive variation). In (b) B is touched with a
trace of the depressant oxalic acid, the permanent current is in the
same direction as before, but the current of response is in the opposite
direction (negative variation). In (c) B is touched with dilute KHO,
the response is exhibited by a positive variation. In (d) B is touched
with strong KHO, the response is now exhibited by a negative variation.
The last two results, apparently anomalous, are due to the fact, which
will be demonstrated later, that KHO in minute quantities is an
excitant, while in large quantities it is a depressant.
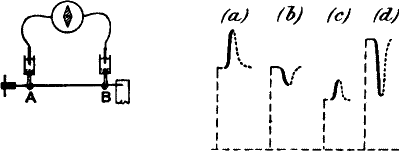
Fig. 54
| Permanent
Current | Current
of
Response |
|---|
| B treated with sodium carbonate. | → | → |
|---|
| B treated with oxalic acid | → | ← |
|---|
| B treated with very dilute potash | → | → |
|---|
| B treated with strong potash | → | ← |
|---|
Current of response is always towards the more excitable point.
|
- (a) Response when B is treated with sodium carbonate.—An apparent
positive variation.
- (b) Response when B is treated with oxalic acid.—An apparent negative
variation.
- (c) Response when B is treated with very dilute potash.—Positive
variation.
- (d) Response when B is treated with strong potash.—Negative
variation.
The response is up when B is more excitable, and down when A is more
excitable.
Lines thus ------ indicate deflection due to permanent current.
|
We have thus seen that we may obtain response (1) by block method, (2)
by the method of injury, or relative depression of responsiveness of one
contact, and (3) by the method of relative exaltation of responsiveness
of one contact. In all these cases alike we obtain a consistent action
current, which in tin is normally positive, or towards the relatively
more excited.
CHAPTER XI
INORGANIC RESPONSE—MODIFIED APPARATUS TO EXHIBIT RESPONSE IN METALS
- Conditions of obtaining quantitative measurements
- —Modification of the block method
- —Vibration cell
- —Application of stimulus
- —Graduation of the intensity of stimulus
- —Considerations showing that electric response is due to molecular disturbance
- —Test experiment
- —Molecular voltaic cell.
We have already seen that metals respond to stimulus by E.M. variation,
just as do animal and vegetable tissues. We have yet to see whether the
similarity extends to this point only, or goes still further, whether
the response-curves of living and in organic are alike, and whether the
inorganic response-curve is modified, as living response was found to
be, by the influence of external agencies. If so, are the modifications
similar? What are the effects of superposition of stimuli? Is there
fatigue? If there be, in what way does it affect the curves? And lastly,
is the response of metals exalted or depressed by the action of chemical
reagents?
Conditions of obtaining quantitative measurements.—In order to carry
out these investigations, it is necessary to remove all sources of
uncertainty, and obtain quantitative measurements. Many difficulties at
first presented themselves in the course of this attempt, but they were
completely removed by the adoption of the following experimental
modification. In the simple arrangement for qualitative demonstration of
response in metals previously described, successive experiments will not
give results which are strictly comparable (1) unless the resistance of
the circuit be maintained constant. This would necessitate the adoption
of some plan for keeping the electrolytic contacts at A and B absolutely
invariable. There should then be no chance of any shifting or variation
of contact. (2) There must also be some means of applying successive
stimuli of equal intensity. (3) And for certain further experiments it
will be necessary to have some way of gradually increasing or decreasing
the stimuli in a definite manner.
Modification of the block method.—By consideration of the following
experimental modifications of the block method (fig. 55), it will be
found easy to construct a perfected form of apparatus, in which all
these conditions are fully met. The essentials to be kept in mind were
the introduction of a complete block midway in the wire, so that the
disturbance of one half should be prevented from reaching the other, and
the making of a perfect electrolytic contact for the electrodes leading
to the galvanometer.
Starting from the simple arrangement previously described where a
straight wire is clamped in the middle (fig. 55, a), we next arrive at
(b). Here the wire A B is placed in a U tube and clamped in the
middle by a tightly fitting cork. Melted paraffin wax is poured to a
certain depth in the bend of the tube. The two limbs of the tube are
now filled with water, till the ends A and B are completely immersed.
Connection is made with the non-polarisable electrodes by the side
tubes. Vibration may be imparted to either A or B by means of ebonite
clip holders seen at the upper ends A B of the wire.
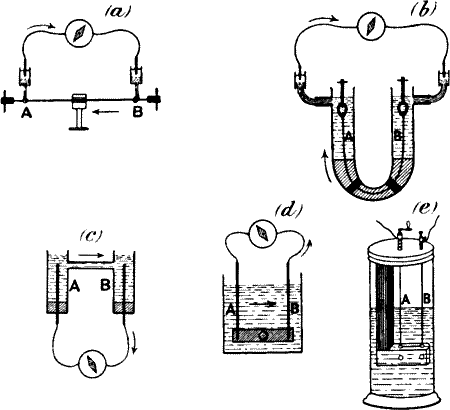
Fig. 55.—Successive Modifications of the Block Method
from the ‘Straight Wire’ (a) to ‘Cell Form’ (e)
When A is excited, current of response in the wire is from less
excited B to more excited A. Note that though the current of response is
constant in direction, the galvanometer deflection in (d) will be
opposite to that in (b).
It will be seen that the two limbs of the tube filled with water serve
the purpose of the strip of moistened cloth used in the last experiment
to make electric connections with the leading-out electrodes—with the
advantage that we have here no chance of any shifting of contact or
variation of surface, the contact between the wire and the surrounding
liquid being perfect and invariable.
On now vibrating the end A of the tin wire by means of the ebonite clip
holder, a current will be found to flow from B to A through the
wire—that is to say, towards the excited—and from A to B in the
galvanometer.
The next modification (c) is to transfer the galvanometer from the
electrolytic to the metallic part of the circuit, that is to say, it is
interposed in a gap made by cutting the wire A B, the upper part of the
circuit being directly connected by the electrolyte. Vibration of A will
now give rise to a current of response which flows in the metallic part
of the circuit with the interposed galvanometer from B to A. We see that
though the direction of the current in this is the same as in the last
case, yet the galvanometer deflection is now reversed, for the evident
reason that we have it interposed in the metallic and not in the
electrolytic part of the circuit.
The next arrangement (d) consists simply of the preceding placed
upside down. Here A and B are held parallel to each other in an
electrolytic bath (water). Mechanical vibration may now be applied to A
without affecting B, and vice versa.
The actual apparatus, of which this is a diagrammatic representation, is
seen in (e).
Two pieces, from the same specimen of wire, are clamped separately at
their lower ends by means of ebonite screws, in an L-shaped piece of
ebonite. The wires are fixed at their upper ends to two
electrodes —leading to the galvanometer—and kept moderately and
uniformly stretched by spiral springs. The handle, by which a torsional
vibration is imparted to the wire, may be slipped over either electrode.
The amplitude of vibration is measured by means of a graduated circle.
It will be seen from these arrangements:
(1) That the cell depicted in (e) is essentially the same as that in
(a).
(2) That the wires in the cell being immersed to a definite depth in the
electrolyte there is always a perfect and invariable contact between the
wire and the electrolyte. The difficulty as regards variation of contact
is thus eliminated.
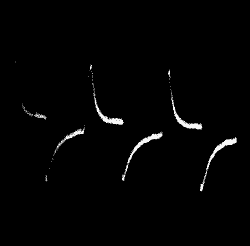
Fig. 56.—Equal and Opposite Responses exhibited by A and
B
(3) That as the wires A and B are clamped separately below, we may
impart a sudden molecular disturbance to either A or B by giving a quick
to-and-fro (torsional) vibration round the vertical wire, as axis, by
means of the handle. As the wire A is separate from B, disturbance of
one will not affect the other. Vibration of A produces a current in one
direction, vibration of B in the opposite direction. Thus we have means
of verifying every experiment by obtaining corroborative and reversed
effects. When the two wires have been brought to exactly the same
molecular condition by the processes of annealing or stretching, the
effects obtained on subjecting A or B to any given stimulus are always
equal (fig. 56).
Usually I interpose an external resistance varying from one to five
megohms according to the sensitiveness of the wire. The resistance of
the electrolyte in the cell is thus relatively small, and the
galvanometer deflections are proportional to the E.M. variations. It is
always advisable to have a high external resistance, as by this means
one is not only able to keep the deflections within the scale, but one
is not troubled by slight accidental disturbances.
Graduation of intensity of stimulus.—If now a rapid torsional vibration
be given to A or B, an E.M. variation will be induced. If the amplitude
of vibration be kept constant, successive responses—in substances
which, like tin, show no fatigue—will be found to be absolutely
identical. But as ‘the amplitude of vibration’ is increased, response
will also become enhanced (see Chap. XV).
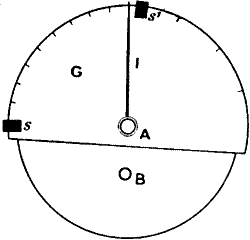
Fig. 57.—Top View of the Vibration Cell
The amplitude of vibration is determined by means of movable stops S S′,
fixed to the edge of the graduated circle G. The index arm I plays
between the stops. (The second index arm, connected with B, and the
second circle are not shown.)
Amplitude of vibration is measured by means of the graduated circle
(fig. 57). A projecting index, in connection with the vibration-head,
plays between fixed and sliding stops (S and S′), one at the zero point
of the scale, and the other movable. The amplitude of a given vibration
can thus be predetermined by the adjustment of the sliding stop. In this
way we can obtain either uniform or definitely graduated stimuli.
Considerations showing that electric response is due to molecular
disturbance.—The electromotive variation varies with the substance.
With superposition of stimuli, a relatively high value is obtained in
tin, amounting sometimes to nearly half a volt, whereas in silver the
electromotive variation is only about ·01 of this value. The intensity
of the response, however, does not depend on the chemical activity of
the substance, for the electromotive variation in the relatively
chemically inactive tin is greater than that of zinc. Again, the sign of
response, positive or negative, is sometimes modified by the molecular
condition of the wire (see Chap. XII).
As regards the electrolyte, dilute NaCl solution, dilute solution of
bichromate of potash &c. are normal in their action, that is to say, the
electric response in such electrolytes is practically the same as with
water. Ordinarily I use tap-water as the electrolyte. Zinc wires in
ZnSO4 solution give responses similar in character to those given by,
for example, Pt or Sn in water.
Test experiment.—It may be urged that the E.M. effect is due in some
way (1) to the friction of the vibrating wire against the liquid; or (2)
to some unknown surface action, at the point in the wire of the contact
of liquid and air surfaces. This second objection has already been
completely met in experi mental modification, fig. 55, b, where the
wire was shown to give response when kept completely immersed in water,
variation of surface being thus entirely eliminated.
Both these questions may, however, be subjected to a definite and final
test. When the wire to be acted on is clamped below, and vibration is
imparted to it, a strong molecular disturbance is produced. If now it be
carefully released from the clamp, and the wire rotated backwards and
forwards, there could be little molecular disturbance, but the liquid
friction and surface variation, if any, would remain. The effect of any
slight disturbance outstanding owing to shaking of the wire would be
relatively very small.
We can thus determine the effect of liquid friction and surface action
by repeating an experiment with and without clamping. In a tin wire
cell, with interposed external resistance equal to one million ohms, the
wire A was subjected to a series of vibrations through 180°, and a
deflection of 210 divisions was obtained. A corresponding negative
deflection resulted on vibrating the wire B. Now A was released from the
clamp, so that it could be rotated backwards and forwards in the water
by means of the handle. On vibrating the wire A no measurable deflection
was produced, thus showing that neither water friction nor surface
variation had anything to do with the electric action. The vibration of
the still clamped B gave rise to the normal strong deflection.
As all the rest of the circuit was kept absolutely the same in the two
different sets of experiments, these results conclusively prove that
the responsive electro-motive variation is solely due to the molecular
disturbance produced by mechanical vibration in the acted wire.
A new and theoretically interesting molecular voltaic cell may thus be
made, in which the two elements consist of the same metal. Molecular
disturbance is in this case the main source of energy. A cell once made
may be kept in working order for some time by pouring in a little
vaseline to prevent evaporation of the liquid.
It will be shown further, in succeeding chapters, by numerous instances,
that any conditions which increase molecular mobility will also increase
intensity of response, and conversely that any conditions having the
reverse effect will depress response.
CHAPTER XII
INORGANIC RESPONSE—METHODS OF ENSURING CONSISTENT RESULTS
- Preparation of wire
- —Effect of single stimulus.
I shall now proceed to describe in detail the response-curves obtained
with metals. The E.M. variations resulting from stimulus range, as has
been said, from ·4 volt to ·01 of that value, according to the metal
employed. And as these are molecular phenomena, the effect will also
depend on the molecular condition of the wire.
Preparation of wire.—In order to have our results thoroughly
consistent, it is necessary to bring the wire itself into a normal
condition for experiment. The very fact of mounting it in the cell
strains it, and the after-effect of this strain may cause irregularities
in the response.
For the purpose of bringing the wire to this normal state, one or all of
the following devices may be used with advantage. (1) The wires obtained
are usually wound on spools. It is, therefore, advisable to straighten
any given length, before mounting, by holding it stretched, and rubbing
it up and down with a piece of cloth. On washing with water, they are
now ready for mounting in the cell.
(2) The cell is usually filled with tap-water, and a period of rest
after making up, generally speaking, improves the sensitiveness. These
expedients are ordinarily sufficient, but it occasionally happens that
the wire has got into an abnormal condition.
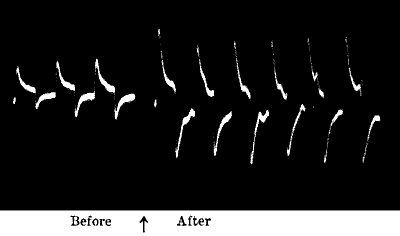
Fig. 58.—Effect of Annealing on increasing the Response
of both A and B Wires (Tin)
Stimuli (vibration of 160°) applied at intervals of one minute.
In this case it will be found helpful (3) to have recourse to the
process of annealing. For if response be a molecular phenomenon, then
anything that increases molecular mobility will also increase its
intensity. Hence we may expect annealing to enhance responsiveness. This
inference will be seen verified in the record given in fig. 58. In the
case under consideration, the convenient method employed was by pouring
hot water into the cell, and allowing it to stand and cool slowly. The
first three pairs of responses were taken by stimulating A and B
alternately, on mounting in the cell, which was filled with water. Hot
water was then substituted, and the cell was allowed to cool down to
its original temperature. The six following pairs of responses were then
taken. That this beneficial effect of annealing was not due to any
accidental circumstance will be seen from the fact that both wires
have their sensitiveness equally enhanced.
(4) In addition to this mode of annealing, both wires may be
short-circuited and vibrated for a time. Lastly (5) slight stretching
in situ will also sometimes be found beneficial. For this purpose I
have a screw arrangement.
By one or all of these methods, with a little practice, it is always
possible to bring the wires to a normal condition. The responses
subsequently obtained become extraordinarily consistent. There is
therefore no reason why perfect results should not be arrived at.
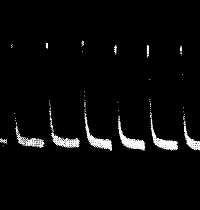
Fig. 59.—Uniform Responses in Tin
Effect of single stimulus.—The accompanying figure (fig. 59) gives a
series, each of which is the response curve for a single stimulus of
uniform intensity, the amplitude of vibration being kept constant. The
perfect regularity of responses will be noticed in this figure. The wire
after a long period of rest may be in an abnormal condition, but after a
short period of stimulation the responses become extremely regular, as
may be noticed in this figure. Tin is, usually speaking, almost
indefatigable, and I have often obtained several hundreds of successive
responses showing practically no fatigue. In the figure it will be
noticed that the rising portion of the curve is somewhat steep, and the
recovery convex to the abscissa, the fall being relatively rapid in its
first, and less rapid in its later, parts. As the electric variation is
the concomitant effect of molecular disturbance—a temporary upset of
the molecular equilibrium—on the cessation of the external stimulus,
the excitatory state, and its expression in electric variation,
disappear with the return of the molecules to their condition of
equilibrium. This process is seen clearly in the curve of recovery.
Different metals exhibit different periods of recovery, and this again
is modified by any influence which affects the molecular condition.
That the excitatory state persists for a time even on the cessation of
stimulus can be independently shown by keeping the galvanometer circuit
open during the application of stimulus, and completing it at various
short intervals after the cessation, when a persisting electrical
effect, diminishing rapidly with time, will be apparent. The rate of
recovery immediately on the cessation of stimulus is rather rapid, but
traces of strain persist for a short time.
CHAPTER XIII
INORGANIC RESPONSE—MOLECULAR MOBILITY: ITS INFLUENCE ON RESPONSE
- Effects of molecular inertia
- —Prolongation of period of recovery by overstrain
- —Molecular model
- —Reduction of molecular sluggishness attended by quickened recovery and heightened response
- —Effect of temperature
- —Modification of latent period and period of recovery by the action of chemical reagents
- —Diphasic variation.
We have seen that the stimulation of matter causes an electric
variation, and that the acted substance gradually recovers from the
effect of stimulus. We shall next study how the form of response-curves
is modified by various agencies.
In order to study these effects we must use, in practice, a highly
sensitive galvanometer as the recorder of E.M. variations. This
necessitates the use of an instrument with a comparatively long period
of swing of needle, or of suspended coil (as in a D’Arsonval). Owing to
inertia of the recording galvanometer, however, there is a lag produced
in the records of E.M. changes. But this can be distinguished from the
effect of the molecular inertia of the substance itself by comparing two
successive records taken with the same instrument, in one of which the
latter effect is relatively absent, and in the other present. We wish,
for example, to find out whether the E.M. effect of mechanical stimulus
is instantaneous, or, again, whether the effect disappears immediately.
We first take a galvanometer record of the sudden introduction and
cessation of an E.M.F. on the circuit containing the vibration-cell
(fig. 60, a). We then take a record of the E.M. effect produced by a
stimulus caused by a single torsional vibration. In order to make the
conditions of the two experiments as similar as possible, the disturbing
E.M.F., from a potentiometer, is previously adjusted to give a
deflection nearly equal to that caused by stimulus. The torsional
vibration was accomplished in a quarter of a second, and the contact
with the potentiometer circuit was also made for the same length of
time.
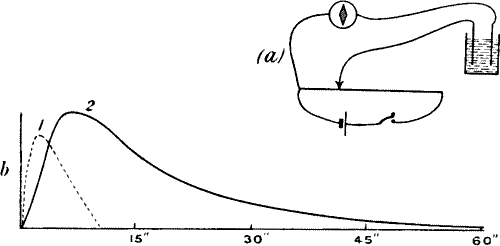
Fig. 60
(a) Arrangement for applying a short-lived E.M.F.
(b) Difference in the periods of recovery: (1) from instantaneous
E.M.F.; and (2) that caused by mechanical stimulus.
The record was then taken as follows. The recording drum had a fast
speed of six inches in a minute, one of the small subdivisions
representing a second. The battery contact in the main potentiometer
circuit was made for a quarter of a second as just mentioned and a
record taken of the effect of a short-lived E.M.F. on the circuit
containing the cell. (2) A record was next taken of the E.M. variation
produced in the cell by a single stimulus. It will be seen on comparison
of the two records that the maximum effect took place relatively later
in the case of mechanical stimulus, and that whereas the galvanometer
recovery in the former case took place in 11 seconds, the recovery in
the latter was not complete till after 60 seconds (fig. 60, b). This
shows that it takes some time for the effect of stimulus to attain its
maximum, and that the effect does not disappear till after the lapse of
a certain interval. The time of recovery from strain depends on the
intensity of stimulus. It takes a longer time to recover from a stronger
stimulus. But, other things being equal, successive recovery periods
from successive stimulations of equal intensity are, generally speaking,
the same.
We may now study the influence of any change in external conditions by
observing the modifications it produces in the normal curve.
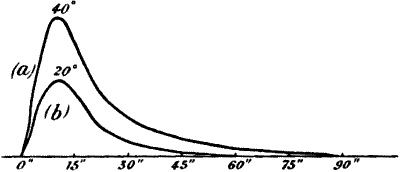
Fig. 61.—Prolongation of Period of Recovery after
Overstrain
Recovery is complete in 60″ when the stimulus is due to 20° vibration.
But with stronger stimulus of 40° vibration, the period of recovery is
prolonged to 90″.
Prolongation of period of recovery by overstrain.—The pair of records
given in fig. 61 shows how recovery is delayed, as the effect of
overstrain. Curve (a) is for a single stimulus due to a vibration of
amplitude 20°, and curve (b) for a stimulus of 40° amplitude of
vibration. It will be noticed how relatively prolonged is the recovery
in the latter case.
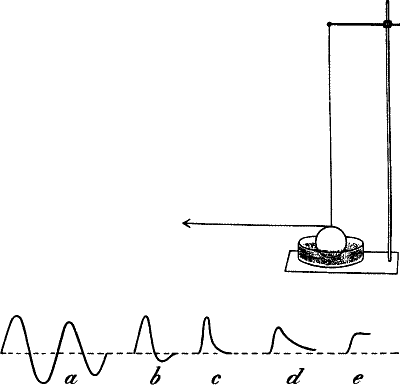
Fig. 62.—Model showing the Effect of Friction
Molecular Model.—We have seen that the electric response is an outward
expression of the molecular disturbance produced by the action of the
stimulus. The rising part of the response-curve thus exhibits the effect
of molecular upset, and the falling part, or recovery, the restoration
to equilibrium. The mechanical model (fig. 62) will help us to visualise
many complex response phenomena. The molecular model consists of a
torsional pendulum—a wire with a dependent sphere. By the stimulus of a
blow there is produced a torsional vibration—a response followed by
recovery. The writing lever attached to the pendulum records the
response-curves. The form of these curves, stimulus remaining constant,
will be modified by friction; the less the friction, the greater is the
mobility. The friction may be varied by more or less raising a vessel of
sand touching the pendulum. By varying the friction the following curves
were obtained.
(a) When there is little friction we get an after-oscillation, to
which we have the corresponding phenomenon in the retinal
after-oscillation (compare fig. 105).
(b and c) If the friction is increased, there is a damping of
oscillation. In (c) we get recovery-curves similar to those found in
nerve, muscle, plant, and metal.
(d) If the friction is still further increased the maximum is reached
much later, as will be seen in the increasing slant of the rising part
of the curve; the height of response is diminished and the period of
recovery very much prolonged by partial molecular arrest. The curve
(d) is very similar to the ‘molecular arrest’ curve obtained by small
dose of chemical reagents which act as ‘poison’ on living tissue or on
metals (compare fig. 93, a).
(e) When the molecular mobility is further decreased there is no
recovery (compare fig. 93, b).
Still further increase of friction completely arrests the molecular
pendulum, and there is no response.
From what has been said, it will be seen that if in any way the friction
is diminished or mobility increased the response will be enhanced. This
is well exemplified in the heightened response after annealing (fig. 58)
and after preliminary vibration (figs. 81, 82).
Possibly connected with this may be the increased responses exhibited by
the action of stimulants (figs. 89, 90).
Reduction of molecular sluggishness attended (1) by quickened
recovery.—Sometimes, after a cell has been resting for too long a
period, especially on cold days, the wire gets into a sluggish
condition, and the period of recovery is thereby prolonged. But
successive vibrations gradually remove this inertness, and recovery is
then hastened. This is shown in the accompanying curves, fig. 63, where
(a) exhibits only very partial recovery even after the expiration of
60 seconds, whereas when a few vibrations had been given recovery was
entirely completed in 47 seconds (b). There was here little change in
the height of response.
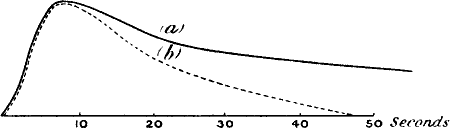
Fig. 63
(a) Slow recovery of a wire in a sluggish condition.
(b) Quickened recovery in the same wire after a few vibrations.
Or (2) by heightened response.—The removal of sluggishness by
vibration, resulting in increased molecular mobility, is in other
instances attended by increase in the height of response, as will be
seen from the two sets of records which follow (fig. 64). Cold, due to
prevailing frosty weather, had made the wires in the cell somewhat
lethargic. The records in (a) were the first taken on the day of the
experiment. The amplitudes of vibration were 45°, 90°, and 135°. In
(b) are given the records of the next series, which are in every case
greater than those of (a). This shows that previous vibration, by
conferring increased mobility, had heightened the response. In this
case, removal of molecular sluggishness is attended by greater intensity
of response, without much change in the period of recovery. In
connection with this it must be remembered that greater strain
consequent on heightened response has a general tendency to a
prolongation of the period of recovery.
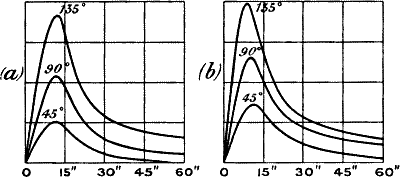
Fig. 64
(a) Three sets of responses for 45°, 90°, and 135° vibration in a
sluggish wire.
(b)The next three sets of responses in the same wire; increased
mobility conferred by previous vibration has heightened the response.
It is thus seen that when the wire is in a sluggish condition,
successive vibrations confer increased molecular mobility, which finds
expression in quickened recovery or heightened response.
Effect of temperature.—Similar considerations lead us to expect that a
moderate rise of temperature will be conducive to increase of response.
This is exhibited in the next series of records. The wire at the low
temperature of 5° C. happened to be in a sluggish condition, and the
responses to vibrations of 45° to 90° in amplitude were feeble. Tepid
water at 30° C. was now substituted for the cold water in the cell, and
the responses underwent a remarkable enhancement. But the excessive
molecular disturbance caused by the high temperature of 90° C. produced
a great diminution of response (fig. 65).
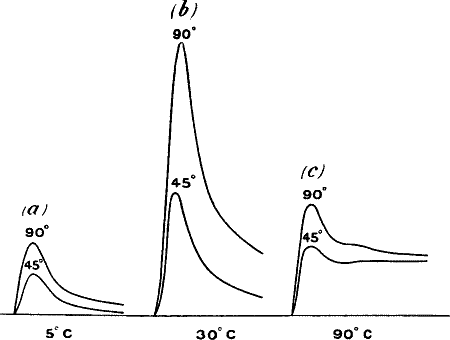
Fig. 65.—Responses of a Wire To Amplitudes of Vibration
45° and 90°
(a) Responses when the wire was in a sluggish condition at temperature
of 5° C.
(b) Enhanced response at 30° C.
(c) Diminution of response at 90° C.
Diphasic variation.—It has already been said that if two points A and B
are in the same physico-chemical condition, then a given stimulus will
give rise to similar excitatory electric effects at the two points. If
the galvanometer deflection is ‘up’ when A alone is excited, the
excitation of B will give rise to a downward deflection. When the two
points are simultaneously excited the electric variation at the two
points will continuously balance each other. Under such conditions
there will be no resultant deflection. But if the intensity of
stimulation of one point is relatively stronger, then the balance will
be disturbed, and a resultant deflection produced whose sign and
magnitude can be found independently by the algebraical summation of the
individual effects of A and B.
It has also been shown that a balancing point for the block, which is
approximately near the middle of the wire, may be found so that the
vibrations of A and B through the same amplitude produce equal and
opposite deflection. Simultaneous vibration of both will give no
resultant current; when the block is abolished and the wire is vibrated
as a whole, there will still be no resultant, inasmuch as similar
excitations are produced at A and B.
After obtaining the balance, if we apply an exciting reagent like
Na2CO3 at one point, and a depressing reagent like KBr at the
other, the responses will now become unequal, the more excitable point
giving a stronger deflection. We can, however, make the two deflections
equal by increasing the amplitude of vibration of the less sensitive
point. The two deflections may thus be rendered equal and opposite, but
the time relations—the latent period, the time rate for attaining the
maximum excitation and recovery from that effect—will no longer be the
same in the two cases. There would therefore be no continuous balance,
and we obtain instead a very interesting diphasic record. I give below
an exact reproduction of the response-curves of A and B recorded on a
fast-moving drum. It will be remembered that one point was touched with
Na2CO3 and the other with KBr. By suitably increasing the
amplitude of vibration of the less sensitive, the two deflections were
rendered approximately equal. The records of A and B were at first taken
separately (fig. 66, a). It will be noticed that the maximum
deflection of A was attained relatively much earlier than that of B.
The resultant curve R′ was obtained by summation.
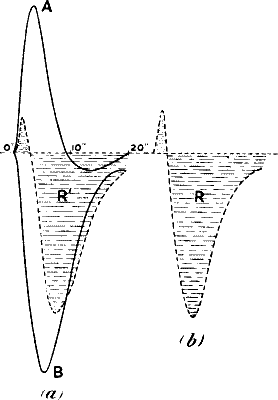
Fig. 66.—Diphasic Variation
(a) Records of A and B obtained separately. R′ is the resultant by
algebraical summation. (b) Diphasic record obtained by simultaneous
stimulation of A and B.
After taking the records of A and B separately, a record of resultant
effect R due to simultaneous vibration of A and B was next taken. It
gave the curious two-phased response—positive effect followed by
negative after-vibration, practically similar to the resultant curve R′
(fig. 66, b).
The positive portion of the curve is due to A effect and the negative to
B. If by any means, say by either increasing the amplitude of vibration
of A or increasing its sensitiveness, the response of A is very greatly
enhanced, then the positive effect would be predominant and the negative
effect would become inconspicuous. When the two constituent responses
are of the same order of magnitude, we shall have a positive response
followed by a negative after-vibration; the first twitch will belong to
the one which responds earlier. If the response of A is very much
reduced, then the positive effect will be reduced to a mere twitch and
the negative effect will become predominant.
I give a series of records, fig. 67, in which these three principal
types are well exhibited, the two contacts having been rendered
unequally excitable by solutions of the two reagents KBr and
Na2CO3. A and B were vibrated simultaneously and records taken.
(a) First, the relative response of B (downward) is increased by
increasing its amplitude of vibration. The amplitude of vibration of A
was throughout maintained constant. The negative or downward response is
now very conspicuous, there being only a mere preliminary indication of
the positive effect. (b) The amplitude of vibration of B is now
slightly reduced, and we obtain the diphasic effect. (c) The intensity
of vibration of B is diminished still further, and the negative effect
is seen reduced to a slight downward after-vibration, the positive
up-curve being now very prominent (fig. 67).
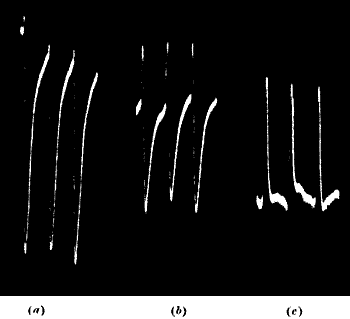
Fig. 67.—Negative, Diphasic, and Positive Resultant
Response
Continuous transformation from negative to positive.—I have shown
the three phases of transformation, the intensity of one of the
constituent responses being varied by altering the intensity of
disturbance.
In the following record (fig. 68) I succeeded in obtaining a continuous
transformation from positive to negative phase by a continuous change in
the relative sensitiveness of the two contacts.
I found that traces of after-effect due to the application of
Na2CO3 remain for a time. If the reagent is previously applied to
an area and the traces of the carbonate then washed off, the increased
sensitiveness conferred disappears gradually. Again, if we apply
Na2CO3 solution to a fresh point, the sensitiveness gradually
increases. There is another further interesting point to be noticed: the
beginning of response is earlier when the application of Na2CO3 is
fresh.
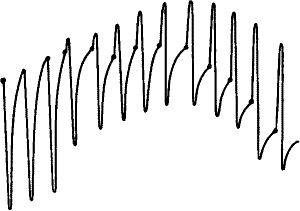
Fig. 68.—Continuous Transformation from Negative To
Positive through Intermediate Diphasic Response
Thick dots represent the times of application of successive stimuli.
We have thus a wire held at one end, and successive uniform vibrations
at intervals of one minute imparted to the wire as a whole, by means of
a vibration head on the other end.
Owing to the after-effect of previous application of Na2CO3 the
sensitiveness of B is at the beginning great, hence the three resultant
responses at the beginning are negative or downward.
Dilute solution of Na2CO3 is next applied to A. The response of A
(up) begins earlier and continues to grow stronger and stronger. Hence,
after this application, the response shows a preliminary positive twitch
of A followed by negative deflection of B. The positive grows
continuously. At the fifth response the two phases, positive and
negative, become equal, after that the positive becomes very prominent,
the negative being reduced as a feeble after-vibration.
It need only be added here that the diphasic variations as exhibited by
metals are in every way counterparts of similar phenomena observed in
animal tissues.
CHAPTER XIV
INORGANIC RESPONSE—FATIGUE, STAIRCASE, AND MODIFIED RESPONSE
- Fatigue in metals
- —Fatigue under continuous stimulation
- —Staircase effect
- —Reversed responses due to molecular modification in nerve and metal, and their transformation into normal after continuous stimulation
- —Increased response after continuous stimulation.
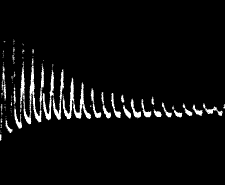
Fig. 69.—Fatigue in Muscle (Waller)
Fatigue.—In some metals, as in muscle and in plant, we find instances
of that progressive diminution of response which is known as fatigue
(fig. 69). The accompanying record shows this in platinum (fig. 70). It
has been said that tin is practically indefatigable. We must, however,
remember that this is a question of degree only. Nothing is absolutely
indefatigable. The exhibition of fatigue depends on various conditions.
Even in tin, then, I obtained the characteristic fatigue-curve with a
specimen which had been in continuous use for many days (fig. 71).
While discussing the subject of fatigue in plants, I have adduced
considerations which showed that the residual effect of strain was one
of the main causes for the production of fatigue. This conclusion
receives independent support from the records obtained with metals.
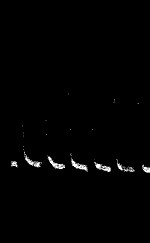
Fig. 70.—Fatigue in Platinum
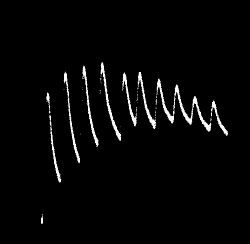
Fig. 71.—Fatigue Shown by Tin Wire which had been
Continuously Stimulated for Several Days
In this connection the important fact is that the various typical
fatigue effects exhibited in living substances are exactly reproduced in
metals, where there can be question neither of fatigue-product producing
fatigue effects, nor of those constructive processes by which they might
be removed. We have seen, both in muscles and in plants, that if
sufficient time for complete recovery be allowed between each pair of
stimuli, the heights of successive responses are the same, and there is
no apparent fatigue (see page 39). But the height of response diminishes
as the excitation interval is shortened. We find the same thing in
metals. Below is given a record taken with tin (fig. 72). Throughout the
experiment the amplitude of vibration was maintained constant, but in
(a) the interval between consecutive stimuli was 1′, while in (b)
this was reduced to 30″. A diminution of height immediately occurs. On
restoring the original rhythm as in (c), the responses revert to their
first large value. Thus we see that when the wire has not completely
recovered, its responses, owing to residual strain, undergo diminution.
Height of response is thus decreased by incomplete recovery. If then
sufficient time be not allowed for perfect recovery, we can understand
how, under certain circumstances, the residual strain would
progressively increase with repetition of stimulus, and thus there would
be a progressive diminution of height of response or fatigue. Again, we
saw in the last chapter that increase of strain necessitates a longer
period of recovery. Thus the longer a wire is stimulated, the more and
more overstrained it becomes, and it therefore requires a gradual
prolongation of the interval between the successive stimuli, if recovery
is to be complete. This interval, however, being maintained constant,
the recovery periods virtually undergo a gradual reduction, and
successive recoveries become more and more incomplete. These
considerations may be found to afford an insight into the progressive
diminution of response in fatigued substances.
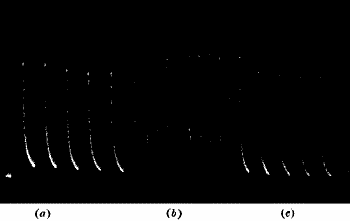
Fig. 72.—Diminution of Response due to Shortening the
Period of Recovery
The stimulus is maintained constant. In (a) the interval between two
successive stimuli is one minute, in (b) it is half a minute, and in
(c) it is again one minute. The response in (b) is feebler than in
either (a) or (c).
Fatigue under continuous stimulation.—Fatigue is perhaps best shown
under continuous stimulation. For example, in muscles, when fresh and
not fatigued, the top of the tetanic curve is horizontal, or may even be
ascending, but with long-continued stimulation the curve declines. The
rapidity of this decline depends on the nature of the muscle and its
previous condition.
In metals I have found exactly parallel instances. In tin, so little
liable to fatigue, the top of the curve is horizontal or ascending; or
it may exhibit a slight decline. But the record with platinum shows the
rapid decline due to fatigue (fig. 73).
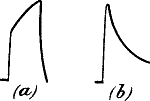
Fig. 73
(a) The top of response-curve under continuous stimulation in tin
is horizontal or ascending as in figure.
(b) In platinum there is
rapid decline owing to fatigue.
Taking any of these instances, say that in which fatigue is most
prominent, it is found that short period of rest restores the original
intensity of response. This affords additional proof of the fact that
fatigue is due to overstrain, and that this strain, with its sign of
attendant fatigue, disappears with time.
Staircase effect.—We shall now discuss an effect which appears to be
the direct opposite of fatigue. This is the curious phenomenon known to
physiologists as ‘the staircase’ effect, in which successive uniform
stimuli produce a series of increasing responses. This is seen under
particular conditions in the response of certain muscles (fig. 74, a).
It is also observed sometimes even in nerve, which otherwise, generally
speaking, gives uniform responses. Of this effect, no satisfactory
theory has as yet been offered. It is in direct contradiction to that
theory which supposes that each stimulus is followed by dissimilation or
break-down of the tissue, reducing its function below par. For in these
cases the supposed dissimilation is followed not by a decrease but by an
increase of functional activity. This ‘staircase effect’ I have shown to
be occasionally exhibited by plants. I have also found it in metals. In
the last chapter we have seen that a wire often falls, especially after
resting for a long time, into a state of comparative sluggishness, and
that this molecular inertness then gradually gives place to increased
mobility under stimulation. As a consequence, an increased response is
thus obtained. I give in fig. 74, b, a series of responses to uniform
stimuli, exhibited by platinum which had been at rest for some time.
This effect is very clearly shown here. So we see that in a substance
which has previously been in a sluggish condition, stimulation confers
increased mobility. Response thus reaches a maximum, but continued
stimulation may afterwards produce overstrain, and the subsequent
responses may then show a decline. This consideration will explain
certain types of responses exhibited by muscles, where the first part
of the series exhibits a staircase increase followed by declining
responses of fatigue.
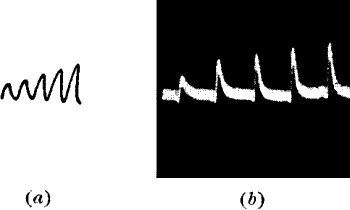
Fig. 74.—‘Staircase’ Effect
(a) in muscle (after Engelmann).
(b) in metal.
Reversed response due to molecular modification and its transformation
into normal after continuous stimulation (1) in nerve.—Reference has
already been made to the fact that a nerve which, when fresh, exhibited
the normal negative response, will often, if kept for some time in
preservative saline, undergo a molecular modification, after which it
gives a positive variation. Thus while the response given by fresh nerve
is normal or negative, a stale nerve gives modified, i.e. reversed
or positive, response. This peculiar modification does not always occur,
yet is too frequent to be considered abnormal. Again, when such a nerve
is subjected to tetanisation or continuous stimulation, this modified
response tends once more to become normal.
It is found that not only tetanisation, but also CO2 has the power of
converting the modified response into normal. Hence it has been
suggested that the conversion under tetanisation of modified response to
normal, in stale nerve, is due to a hypothetical evolution of CO2 in
the nerve during stimulation.[16]
(2) In metals.—I have, however, met with exactly parallel phenomena in
metals, where, owing to some molecular modification, the responses
became reversed, and where, under continuous stimulation, though here
there could be no possibility of the evolution of CO2, they tended
again to become normal.
If after mounting a wire in a cell filled with water, it be set aside
for too long a time, I have sometimes noticed that it undergoes a
certain modification, owing to which its response ceases to be normal
and becomes reversed in sign. I have obtained this effect with various
metals, for instance lead and tin, and even with the chemically inactive
substance—platinum.
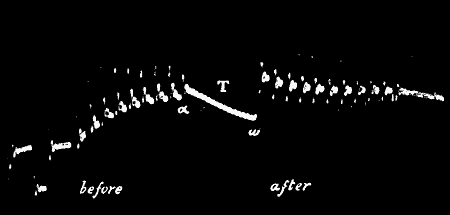
Fig. 75.—Abnormal Positive (up) Response in Nerve
Converted into Normal (down) Response after Continuous Stimulation T
(Waller)
The galvanometer is not dead-beat, and shows after-oscillation.
The subject will be made clearer if we first follow in detail the
phenomenon exhibited by modified nerve, giving this abnormal response.
The normal responses in nerve are usually represented by ‘down’ and the
reversed abnormal responses by ‘up’ curves. In the modified nerve, then,
the abnormal responses are ‘up’ instead of the normal ‘down.’ The record
of such abnormal response in the modified nerve is shown in fig. 75. It
will be noticed that in this, the successive responses are undergoing a
diminution, or tending towards the normal. After continuous stimulation
or tetanisation (T), it will be seen that the abnormal or ‘up’ responses
are converted into normal or ‘down.’
I shall now give a record which will exhibit an exactly similar
transformation from the abnormal to normal response after continuous
stimulation. Here the normal responses are represented by ‘up’ and the
abnormal by ‘down’ curves. This record was given by a tin wire, which
had been molecularly modified (fig. 76). We have at first the abnormal
responses; successive responses are undergoing a diminution or tending
towards the normal; after continuous stimulation (T), the subsequent
responses are seen to have become normal. Another record, obtained with
platinum, shows the same phenomenon (fig. 77).
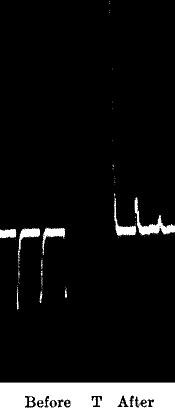
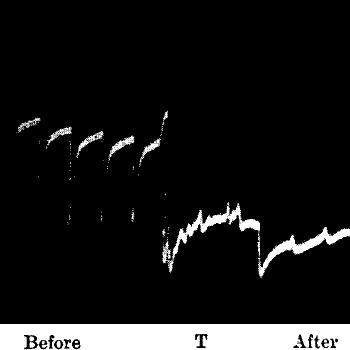
Fig. 76 and Fig. 77
Abnormal ‘down’ response in tin (fig. 76) and in platinum (fig. 77)
transformed into normal ‘up’ response, after continuous stimulation, T.
On placing the three sets of records—nerve, tin, and platinum—side by
side, it will be seen how essentially similar they are in every
respect.[17]
This reversion to normal is seen to have appeared in a pronounced manner
after rapidly continuous stimulation, in process of which the modified
molecular condition must in some way have reverted to the normal.
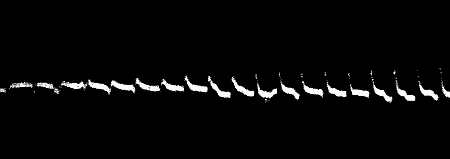
Fig. 78.—The Gradual Transition from Abnormal To Normal
Response in Platinum
The transition will be seen to have commenced at the third and ended at
the seventh, counting from the left.
Being desirous to trace this change gradually taking place, I took a
platinum wire cell giving modified responses, and obtained a series of
records of effects of individual stimuli continued for a long time. In
this series, the points of transition from modified response to normal
will be clearly seen (fig. 78).
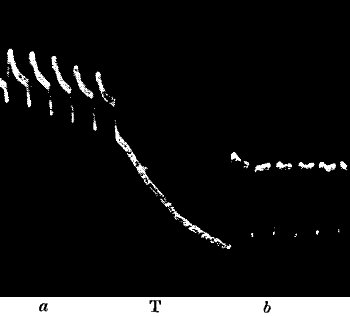
Fig. 79.—The Normal Response a in Nerve Enhanced to
b after Continuous Stimulation T (Waller)
The normal response in nerve is recorded ‘down.’
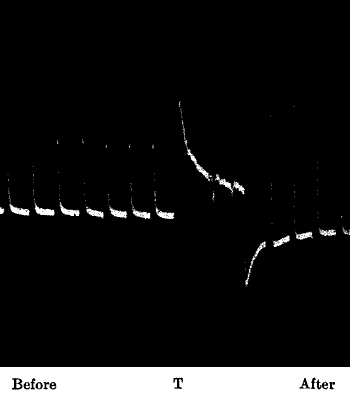
Fig. 80.—Enhanced Response in Platinum after Continuous
Stimulation T
Increased response after continuous stimulation.—We have seen that
responses to uniform stimuli sometimes show a staircase increase,
apparently owing to the gradual removal of molecular sluggishness.
Possibly analogous to this is the increase of response in nerve after
continuous stimulation or tetanisation, observed by Waller (fig. 79).
Like the staircase effect, this contravenes the commonly accepted theory
of the dissimilation of tissue by stimulus, and the consequent
depression of response. It is suggested by Waller that this increase of
response after tetanisation may be due to the hypothetical evolution of
CO2 to which allusion has previously been made.
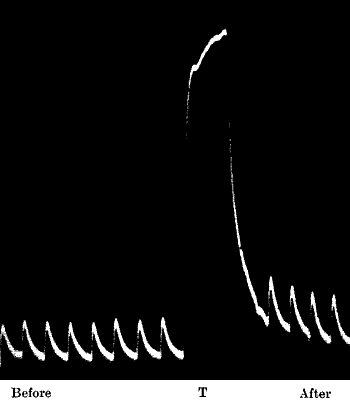
Fig. 81.—Enhanced Response in Tin After Continuous
Stimulation T
But there is an exact correspondence between this phenomenon and that
exhibited by metals under similar conditions. I give here two sets of
records (figs. 80, 81), one obtained with platinum and the other with
tin, which demonstrate how the response is enhanced after continuous
stimulation in a manner exactly similar to that noticed in the case of
nerve.
The explanation which has been suggested with regard to the staircase
effect—increased molecular mobility due to removal of sluggishness by
repeated stimulation—would appear to be applicable in this case also.
It would appear, then, that in all the phenomena which we have studied
under the heads of ‘staircase’ effect, increase of response after
continuous stimulation, and fatigue, there is a similarity between the
observations made upon the response of muscle and nerve on the one hand,
and that of metals on the other. Even in their abnormalities we have
seen an agreement.
But amongst these phenomena themselves, though at first sight so
diverse, there is some kind of continuity. Calling all normal response
positive, for the sake of convenience, we observe its gradual
modification, corresponding to changes in the molecular condition of the
substance.
Beginning with that case in which molecular modification is extreme, we
find a maximum variation of response from the normal, that is to say, to
negative.
Continued stimulation, however, brings back the molecular condition to
normal, as evidenced by the progressive lessening of the negative
response, culminating in reversion to the normal positive. This is
equally true of nerve and metal.
In the next class of phenomena, the modification of molecular condition
is not so great. It now exhibits itself merely as a relative inertness,
and the responses, though positive, are feeble. Under continued
stimulation, they increase in the same direction as in the last case,
that is to say, from less positive to more positive, being the reverse
of fatigue. This is evidenced alike by the staircase effect and by the
increase of response after tetanisation, seen not only in nerve but also
in platinum and tin.
The substance may next be in what we call the normal condition.
Successive uniform stimuli now evoke uniform and equal positive
responses, that is to say, there is no fatigue. But after intense or
long-continued stimulation, the substance is overstrained. The responses
now undergo a change from positive to less positive; fatigue, that is
to say, appears.
Again, under very much prolonged stimulation the response may decline to
zero, or even undergo a reversal to negative, a phenomenon which we
shall find instanced in the reversed response of retina under the
long-continued stimulus of light.
We must then recognise that a substance may exist in various molecular
conditions, whether due to internal changes or to the action of
stimulus. The responses give us indications of these conditions. A
complete cycle of molecular modifications can be traced, from the
abnormal negative to the normal positive, and then again to negative
seen in reversal under continuous stimulation.
CHAPTER XV
INORGANIC RESPONSE—RELATION BETWEEN STIMULUS AND
RESPONSE—SUPERPOSITION OF STIMULI
- Relation between stimulus and response
- —Magnetic analogue
- —Increase of response with increasing Stimulus
- —Threshold of response
- —Superposition of Stimuli
- —Hysteresis.
Relation between stimulus and response.—We have seen what extremely
uniform responses are given by tin, when the intensity of stimulus is
maintained constant. Hence it is obvious that these phenomena are not
accidental, but governed by definite laws. This fact becomes still more
evident when we discover how invariably response is increased by
increasing the intensity of stimulus.
Electrical response is due, as we have seen, to a molecular disturbance,
the stimulus causing a distortion from a position of equilibrium. In
dealing with the subject of the relation between the disturbing force
and the molecular effect it produces, it may be instructive to consider
certain analogous physical phenomena in which molecular deflections are
also produced by a distorting force.
Magnetic analogue.—Let us consider the effect that a magnetising force
produces on a bar of soft iron. It is known that each molecule in such a
bar is an individual magnet. The bar as a whole, nevertheless, exhibits
no external magnetisation. This is held to be due to the fact that the
molecular magnets are turned either in haphazard directions or in closed
chains, and there is therefore no resultant polarity. But when the bar
is subjected to a magnetising force by means, say, of a solenoid
carrying electrical current, the individual molecules are elastically
deflected, so that all the molecular magnets tend to place themselves
along the lines of magnetising force. All the north poles thus point
more or less one way, and the south poles the other. The stronger the
magnetising force, the nearer do the molecules approach to a perfect
alignment, and the greater is the induced magnetisation of the bar.
The intensity of this induced magnetisation may be measured by noting
the deflection it produces on a freely suspended magnet in a
magnetometer.
The force which produces that molecular deflection, to which the
magnetisation of the bar is immediately due, is the magnetising current
flowing round the solenoid. The magnetisation, or the molecular effect,
is measured by the deflection of the magnetometer. We may express the
relation between cause and effect by a curve in which the abscissa
represents the magnetising current, and the ordinate the magnetisation
produced (fig. 82).
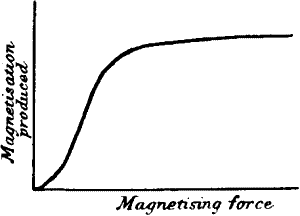
Fig. 82.—Curve of Magnetisation
In such a curve we may roughly distinguish three parts. In the first,
where the force is feeble, the mole cular deflection is slight. In the
next, the curve is rapidly ascending, i.e. a small variation of
impressed force produces a relatively large molecular effect. And
lastly, a limit is reached, as seen in the third part, where increasing
force produces very little further effect. In this cause-and-effect
curve, the first part is slightly convex to the abscissa, the second
straight and ascending, and the third concave.
Increase of response with increasing stimulus.—We shall find in dealing
with the relation between the stimulus and the molecular effect—i.e.
the response—something very similar.
On gradually increasing the intensity of stimulus, which may be done, as
already stated, by increasing the amplitude of vibration, it will be
found that, beginning with feeble stimulation, this increase is at first
slight, then more pronounced, and lastly shows a tendency to approach a
limit. In all this we have a perfect parallel to corresponding phenomena
in animal and vegetable response. We saw that the proper investigation
of this subject was much complicated, in the case of animal and
vegetable tissues, by the appearance of fatigue. The comparatively
indefatigable nature of tin causes it to offer great advantages in the
pursuit of this inquiry. I give below two series of records made with
tin. The first record, fig. 83, is for increasing amplitudes from 5° to
40° by steps of 5°. The stimuli are imparted at intervals of one minute.
It will be noticed that whereas the recovery is complete in one minute
when the stimulus is moderate, it is not quite complete when the
stimulus is stronger. The recovery from the effect of stronger stimulus
is more prolonged. Owing to want of complete recovery, the base line is
tilted slightly upward. This slight displacement of the zero line does
not materially affect the result, provided the shifting is slight.
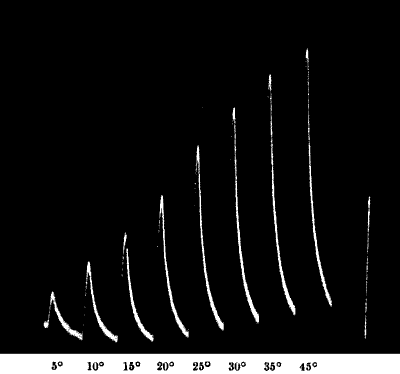
Fig. 83.—Records of Responses in Tin with Increasing
Stimuli, Amplitudes of Vibration from 5° to 40°
The vertical line to the right represents ·1 volt.
Table showing the Increasing Electric Response due to
Increasing Amplitude of Vibration
| Vibration amplitude | E.M. variation |
|---|
| 5° | ·024 volt |
| 10° | ·057 " |
| 20° | ·111 " |
| 25° | ·143 " |
| 30° | ·170 " |
| 35° | ·187 " |
| 40° | ·204 " |
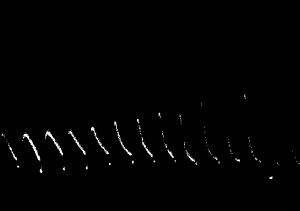
Fig. 84.—A Second Set of Records with a Different
Specimen of Tin
The amplitudes of vibration are increased by steps of 10°, from 20° to
160°. (The deflections are reduced by interposing a high external
resistance.)
The next figure (fig. 84) gives record of responses through a wider
range. For accurate quantitative measurements it is preferable to wait
till the recovery is complete. We may accomplish this within the limited
space of the recording photographic plate by making the record for one
minute; during the rest of recovery, the clockwork moving the plate is
stopped and the galvanometer spot of light is cut off. Thus the next
record starts from a point of completed recovery, which will be noticed
as a bright spot at the beginning of each curve. With stimulation of
high intensity, a tendency will be noticed for the responses to approach
a limit.
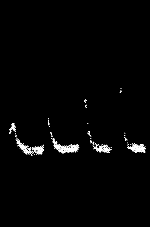
Fig. 85.—Effect of Superposition on Tin
A single stimulus produces the feeble effect shown in the first
response. Superposition of 5, 9, 13 such stimuli produce the succeeding
stronger responses.
Threshold of response.—There is a minimum intensity of stimulus below
which there is hardly any visible response. We may regard this point as
the threshold of response. Though apparently ineffective, the subliminal
stimuli produce some latent effect, which may be demonstrated by their
additive action. The record in fig. 85 shows how individually feeble
stimuli become markedly effective by superposition.
Superposition of stimuli.—The additive effect of succeeding stimuli
will be seen from the above. The fusion of effect will be incomplete if
the frequency of stimulation be not sufficiently great; but it will tend
to be more complete with higher frequency of stimulation (fig. 86). We
have here a parallel case to the complete and incomplete tetanus of
muscles, under similar conditions.
By the addition of these rapidly succeeding stimuli, a maximum effect is
produced, and further stimulation adds nothing to this. The effect is
balanced by a force of restitution. The response-curve thus rises to
its maximum, after which the deflection is held as it were rigid, so
long as the vibration is kept up.
It was found that increasing intensities of single stimuli produced
correspondingly increased responses. The same is true also of groups of
stimuli. The maximum effect produced by superposition of stimuli
increases with the intensity of the constituent stimuli.
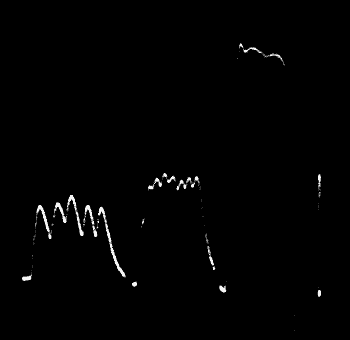
Fig. 86.—Incomplete and Complete Fusion of Effect in Tin
As the frequency of stimulation is increased the fusion becomes more and
more complete. Vertical line to the right represents ·1 volt.
Hysteresis.—Allusion has already been made to the increased
responsiveness conferred by preliminary stimulation (see p. 127). Being
desirous of finding out in what manner this is brought about, I took a
series of observations for an entire cycle, that is to say, a series of
observations were taken for maximum effects, starting from amplitude of
vibration of 10° and ending in 100°, and backwards from 100° to 10°.
Effect of hysteresis is very clearly seen (see A, fig. 87); there is a
considerable divergence between the forward and return curves, the
return curve being higher. On repeating the cycle several times, the
divergence is found very much reduced, the wire on the whole is found to
assume a more constant sensitiveness. In this steady condition,
generally speaking, the sensitiveness for smaller amplitude of vibration
is found to be greater than at the very beginning, but the reverse is
the case for stronger intensity of stimulation.
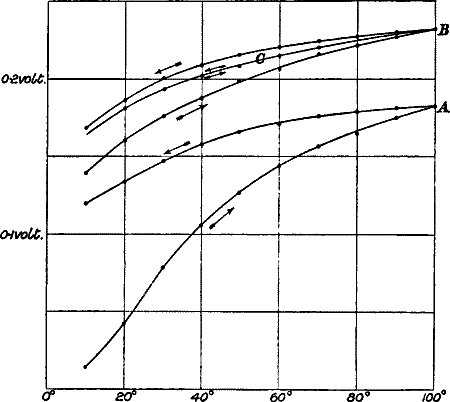
Fig. 87.—Cyclic Curve for Maximum Effects showing
Hysteresis
Effect of annealing.—I repeated the experiment with the same wire,
after pouring hot water into the cell and allowing it to cool to the old
temperature. From the cyclic curve (B, fig. 87) it will be seen (1) that
the sensitiveness has become very much enhanced; (2) that there is
relatively less divergence between the forward and return curves. Even
this divergence practically disappeared at the third cycle, when the
forward and backward curves coincided (C, fig. 87). The above results
show in what manner the excitability of the wire is enhanced by purely
physical means.
It is very curious to notice that addition of Na2CO3 solution (see
Chap. XV—Action of Stimulants) produces enhancement of responsive power
similar to that produced by annealing; that is to say, not only is there
a great increase of sensitiveness, but there is also a reduction of
hysteresis.
CHAPTER XVI
INORGANIC RESPONSE—EFFECT OF CHEMICAL REAGENT
- Action of chemical reagents
- —Action of stimulants on metals
- —Action of depressants on metals
- —Effect of ‘poisons’ on metals
- —Opposite effect of large and small doses.
We have seen that the ultimate criterion of the physiological character
of electric response is held to be its abolition when the substance is
subjected to those chemical reagents which act as poisons.
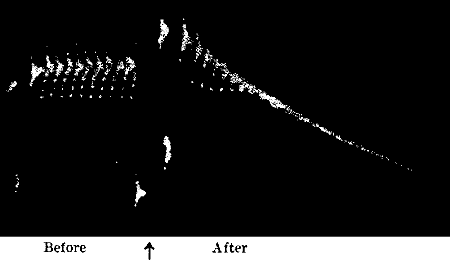
Fig. 88.—Action of Poison in Abolishing Response in
Nerve (Waller)
Action of chemical reagents.—Of these reagents, some are universal in
their action, amongst which strong solutions of acids and alkalis, and
salts like mercuric chloride, may be cited. These act as powerful toxic
agents, killing the living tissue, and causing electric response to
disappear. (See fig. 88.) It must, however, be remembered that there are
again specific poisons which may affect one kind of tissue and not
others. Poisons in general may be regarded as extreme cases of
depressants. As an example of those which produce moderate physiological
depression, potassium bromide may be mentioned, and this also diminishes
electric response. There are other chemical reagents, on the other hand,
which produce the opposite effect of increasing the excitability and
causing a corresponding exaltation of electric response.
We shall now proceed to inquire whether the response of inorganic bodies
is affected by chemical reagents, so that their excitability is exalted
by some, and depressed or abolished by others. Should it prove to be so,
the last test will have been fulfilled, and that parallelism which has
been already demonstrated throughout a wide range of phenomena, between
the electric response of animal tissues on the one hand, and that of
plants and metals on the other, will be completely established.
Action of stimulants on metals.—We shall first study the stimulating
action of various chemical reagents. The method of procedure is to take
a series of normal responses to uniform stimuli, the electrolyte being
water. The chemical reagent whose effect is to be observed is now added
in small quantity to the water in the cell, and a second series of
responses taken, using the same stimulus as before. Generally speaking,
the influence of the reagent is manifested in a short period, but there
may be occasional instances where the effect takes some time to develop
fully. We must remember that by the introduction of the chemical reagent
some change may be produced in the internal resistance of the cell. The
effect of this on the deflection is eliminated by interposing a very
high external resistance (from one to five megohms) in comparison with
which the internal resistance of the cell is negligible. The fact that
the introduction of the reagent did not produce any variation in the
total resistance of the circuit was demonstrated by taking two
deflections, due to a definite fraction of a volt, before and after the
introduction of the reagent. These deflections were found equal.
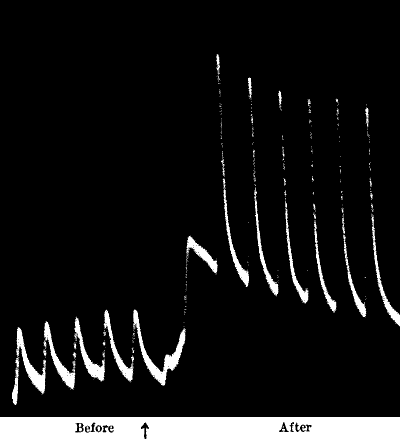
Fig. 89.—Stimulating Action of Na2CO3 on Tin
I first give a record of the stimulating action of sodium carbonate on
tin, which will become evident by a comparison of the responses before
and after the introduction of Na2CO3 (fig. 89). The next record
shows the effect of the same reagent on platinum (fig. 90).
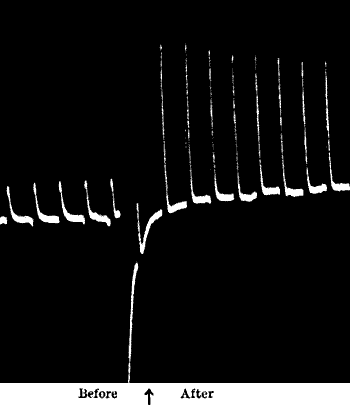
Fig. 90.—Stimulating Action of Na2CO3 on Platinum
Action of depressants.—Certain other reagents, again, produce an
opposite effect. That is to say, they diminish the intensity of
response. The record given on the next page (fig. 91) shows the
depressing action of 10 per cent. solution of KBr on tin.
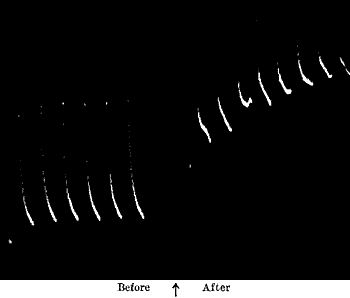
Fig. 91.—Depressing Effect of KBr (10 per Cent.) on the
Response of Tin
Effect of ‘poison.’—Living tissues are killed, and their electric
responses are at the same time abolished by the action of poisons. It is
very curious that various chemical reagents are similarly effective in
killing the response of metals. I give below a record (fig. 92) to show
how oxalic acid abolishes the response. The depressive effect of this
reagent is so great that a strength of one part in 10,000 is often
sufficient to produce complete abolition. Another notable point with
reference to the action of this reagent is the persistence of
after-effect. This will be clearly seen from an account of the following
experiment. The two wires A and B, in the cell filled with water, were
found to give equal responses. The wires were now lifted off, and one
wire B was touched with dilute oxalic acid. All traces of acid were next
removed by rubbing the wire with cloth under a stream of water. On
replacing the wire in the cell, A gave the usual response, whereas that
of B was found to be abolished. The depression produced is so great and
passes in so deep that I have often failed to revive the response, even
after rubbing the wire with emery paper, by which the molecular layer on
the surface must have been removed.
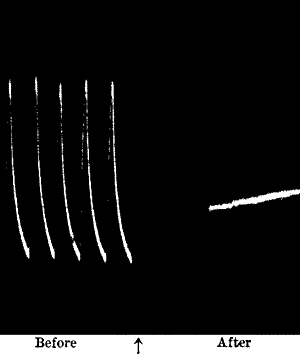
Fig. 92.—Abolition of Response by Oxalic Acid
We have seen in the molecular model (fig. 62, d, e) how the
attainment of maximum is delayed, the response diminished, and the
recovery prolonged or arrested by increase of friction or reduction of
molecular mobility.
It would appear as if the reagents which act as poisons produced some
kind of molecular arrest. The following records seen to lend support to
this view. If the oxalic acid is applied in large quantities, the
abolition of response is complete. But on carefully adding just the
proper amount I find that the first stimulus evokes a responsive
electric twitch, which is less than the normal, and the period of
recovery is very much prolonged from the normal one minute before, to
five minutes after, the application of the reagent (fig. 93, a). In
another record the arrest is more pronounced, i.e. there is now no
recovery (fig. 93, b). Note also that the maximum is attained much
later. Stimuli applied after the arrest produce no effect, as if the
molecular mechanism became, as it were, clogged or locked up.
In connection with this it is interesting to note that the effect of
veratrine poison on muscle is somewhat similar. This reagent not only
diminishes the excitability, but causes a very great prolongation of the
period of recovery.
In connection with the action of chemical reagents the following points
are noteworthy.
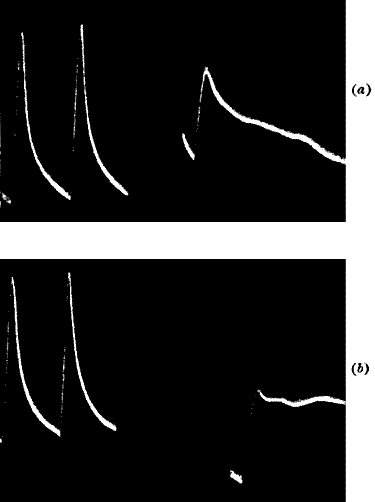
Fig. 93.—‘Molecular Arrest’ by the Action of ‘poison’
In each, curves to the left show the normal response, curve to the right
shows the effect of poison. In (a) the arrest is evidenced by
prolongation of period of recovery. In (b) there is no recovery.
(1) The effect of these reagents is not only to increase or diminish the
height of the response-curve, but also to modify the time relations. By
the action of some the latent period is diminished, others produce a
prolongation of the period of recovery. Some curious effects produced by
the change of time relations have been noticed in the account given of
diphasic variation (see p. 113).
(2) The effect produced by a chemical reagent depends to some extent on
the previous condition of the wire.
(3) A certain time is required for the full development of the effect.
With some reagents the full effect takes place almost instantaneously,
while with others the effect takes place slowly. Again the effect may
with time reach a maximum, after which there may be a slight decline.
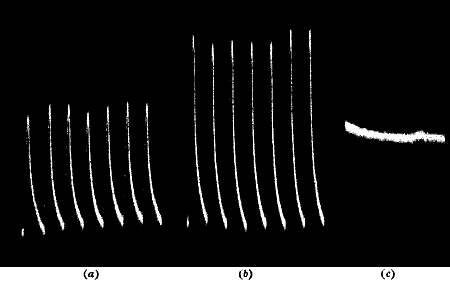
Fig. 94.—Opposite Effects of Small and Large Doses (Tin)
(a) is the normal response; (b) is the stimulating action of small
dose of potash (3 parts in 1,000); (c) is the abolition of response
with a stronger dose (3 parts in 100).
(4) The after-effects of the reagents may be transitory or persistent;
that is to say, in some cases the removal of the reagent causes the
responses to revert to the normal, while in others the effect persists
even after the removal of all traces of the reagent.
Opposite effects of large and small doses.—There remains a very curious
phenomenon, known not only to students of physiological response but
also known in medical practice, namely that of the opposite effects
produced by the same reagent when given in large or in small doses.
Here, too, we have the same phenomena reproduced in an extraordinary
manner in inorganic response. The same reagent which becomes a ‘poison’
in large quantities may act as a stimulant when applied in small doses.
This is seen in record fig. 94, in which (a) gives the normal
responses in water; KHO solution was now added so as to make the
strength three parts in 1,000, and (b) shows the consequent
enhancement of response. A further quantity of KHO was added so as to
increase the strength to three parts in 100. This caused a complete
abolition (c) of response.
It will thus be seen that as in the case of animal tissues and of
plants, so also in metals, the electrical responses are exalted by the
action of stimulants, lowered by depressants, and completely abolished
by certain other reagents. The parallelism will thus be found complete
in every detail between the phenomena of response in the organic and the
inorganic.
CHAPTER XVII
ON THE STIMULUS OF LIGHT AND RETINAL CURRENTS
- Visual impulse: (1) chemical theory; (2) electrical theory
- —Retinal currents
- —Normal response positive
- —Inorganic response under stimulus of light
- —Typical experiment on the electrical effect induced by light.
The effect of the stimulus of light on the retina is perceived in the
brain as a visual sensation. The process by which the ether-wave
disturbance causes this visual impulse is still very obscure. Two
theories may be advanced in explanation.
(1) Chemical theory.—According to the first, or chemical, theory, it is
supposed that certain visual substances in the retina are affected by
light, and that vision originates from the metabolic changes produced in
these visual substances. It is also supposed that the metabolic changes
consist of two phases, the upward, constructive, or anabolic phase, and
the downward, destructive, or katabolic phase. Various visual substances
by their anabolic or katabolic changes are supposed to produce the
variations of sensation of light and colour. This theory, as will be
seen, is very complex, and there are certain obstacles in the way of its
acceptance. It is, for instance, difficult to see how this very quick
visual process could be due to a comparatively slow chemical action,
consisting of the destructive breaking-down of the tissue, followed by
its renovation. Some support was at first given to this chemical theory
by the bleaching action of light on the visual purple present in the
retina, but it has been found that the presence or absence of visual
purple could not be essential to vision, and that its function, when
present, is of only secondary importance. For it is well known that in
the most sensitive portion of the human retina, the fovea centralis,
the visual purple is wanting; it is also found to be completely absent
from the retinæ of many animals possessing keen sight.
(2) Electrical theory.—The second, or electrical, theory supposes that
the visual impulse is the concomitant of an electrical impulse; that an
electrical current is generated in the retina under the incidence of
light, and that this is transmitted to the brain by the optic nerve.
There is much to be said in favour of this view, for it is an undoubted
fact, that light gives rise to retinal currents, and that, conversely,
an electrical current suitably applied causes the sensation of light.
Retinal currents.—Holmgren, Dewar, McKendrick, Kuhne, Steiner, and
others have shown that illumination produces electric variation in a
freshly excised eye. About this general fact of the electrical response
there is a widespread agreement, but there is some difference of opinion
as regards the sign of this response immediately on the application,
cessation, and during the continuance of light. These slight
discrepancies may be partly due to the unsatisfactory nomenclature—as
regards use of terms positive and negative—hitherto in vogue and
partly also to the differing states of the excised eyes observed.
Waller, in his excellent and detailed work on the retinal currents of
the frog, has shown how the sign of response is reversed in the moribund
condition of the eye.
As to the confusion arising from our present terminology, we must
remember that the term positive or negative is used with regard to a
current of reference—the so-called current of injury.
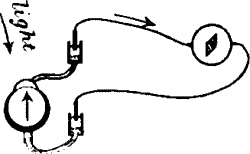
Fig. 95. Retinal Response To Light
The current of response is from the nerve to the retina.
When the two galvanometric contacts are made, one with the cut end of
the nerve, and the other on the uninjured cornea, a current of injury is
found which in the eye is from the nerve to the retina. In the normal
freshly excised eye, the current of response due to the action of light
on the retina is always from the nerve, which is not directly stimulated
by light, to the retina, that is, from the less excited to the more
excited (fig. 95). This current of response flows, then, in the same
direction as the existing current of reference—the current of
injury—and may therefore be called positive. Unfortunately the
current of injury is very often apt to change its sign; it then flows
through the eye from the cornea to the nerve. And now, though the
current of response due to light may remain unchanged in direction,
still, owing to the reversal of the current of reference, it will appear
as negative. That is to say, though its absolute direction is the same
as before, its relative direction is altered.
I have already advocated the use of the term positive for currents
which flow towards the stimulated, and negative for those whose flow
is away from the stimulated. If such a convention be adopted, no
confusion can arise, even when, as in the given cases, the currents of
injury undergo a change of direction.
Normal response positive.—The normal effect of light on the retina, as
noticed by all the observers already mentioned, is a positive variation,
during exposure to light of not too long duration. Cessation of light is
followed by recovery. On these points there is general agreement amongst
investigators. Deviations are regarded as due to abnormal conditions of
the eye, owing to rough usage, or to the rapid approach of death. For
just as in the dying plant we found occasional reversals from negative
to positive response, so in the dying retina the response may undergo
changes from the normal positive to negative.
The sign of response, as we have already seen in numerous cases, depends
very much on the molecular condition of the sensitive substance, and if
this condition be in any way changed, it is not surprising that the
character of the response should also undergo alteration.
Unlike muscle in this, successive retinal responses exhibit little
change, for, generally speaking, fatigue is very slight, the retina
recovering quickly even under strong light if the exposure be not too
long. In exceptional cases, however, fatigue, or its converse, the
staircase effect, may be observed.
Inorganic response under the stimulus of light.—It may now be asked
whether such a complex vital phenomenon as retinal response could have
its counterpart in non-living response. Taking a rod of silver, we may
beat out one end into the form of a hollow cup, sensitising the inside
by exposing it for a short time to vapour of bromine. The cup may now be
filled with water, and connection made with a galvanometer by
non-polarisable electrodes. There will now be a current due to
difference between the inner surface and the rod. This may be balanced,
however, by a compensating E.M.F.
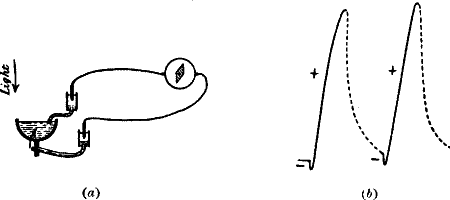
Fig. 96.—Record of Responses To Light given by the
Sensitive Cell
Thick lines represent the effect during illumination, dotted lines the
recovery in darkness. Note the preliminary negative twitch, which is
sometimes also observed in responses of frog’s retina.
We have thus an arrangement somewhat resembling the eye, with a
sensitive layer corresponding to the retina, and the less sensitive rod
corresponding to the conducting nerve-stump (fig. 96, a).
The apparatus is next placed inside a black box, with an aperture at the
top. By means of an inclined mirror, light may be thrown down upon the
sensitive surface through the opening.
On exposing the sensitive surface to light, the balance is at once
disturbed, and a responsive current of positive character produced. The
current, that is to say, is from the less to the more stimulated
sensitive layer. On the cessation of light, there is fairly quick
recovery (fig. 96, b).
The character and the intensity of E.M. variation of the sensitive cell
depend to some extent on the process of preparation. The particular cell
with which most of the following experiments were carried out usually
gave rise to a positive variation of about ·008 volt when acted on for
one minute by the light of an incandescent gas-burner which was placed
at a distance of 50 cm.
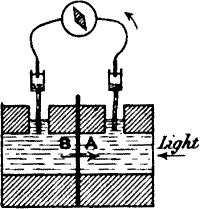
Fig. 97 (a)
A, B are the two faces of a brominated sheet of silver. One face, say A,
is acted on by light. The current of response is from B to A, across the
plate.
Typical experiment on the electrical effect induced by light.—This
subject of the production of an electrical current by the stimulus of
light would appear at first sight very complex. But we shall be able to
advance naturally to a clear understanding of its most complicated
phenomena if we go through a preliminary consideration of an ideally
simple case. We have seen, in our experiments on the mechanical
stimulation of, for example, tin, that a difference of electric
potential was induced between the more stimulated and less stimulated
parts of the same rod, and that an action current could thus be
obtained, on making suitable electrolytic connections. Whether the more
excited was zincoid or cuproid depended on the substance and its
molecular condition.
Let us now imagine the metal rod flattened into a plate, and one face
stimulated by light, while the other is protected. Would there be a
difference of potential induced between the two faces of this same sheet
of metal?
Let two blocks of paraffin be taken and a large hole drilled through
both. Next, place a sheet of metal between the blocks, and pour melted
paraffin round the edge to seal up the junction, the two open ends being
also closed by panes of glass. We shall have then two compartments
separated by the sheet of metal, and these compartments may be filled
with water through the small apertures at the top (fig. 97, a).

Fig. 97 (b).—Record of Responses obtained from the
Above Cell
Ten seconds’ exposure to light followed by fifty seconds’ recovery in
the dark. Thick lines represent action in light, dotted lines represent
recovery.
The two liquid masses in the separated chambers thus make perfect
electrolytic contacts with the two faces A and B of the sheet of metal.
These two faces may be put in connection with a galvanometer by means of
two non-polarisable electrodes, whose ends dip into the two chambers. If
the sheet of metal have been properly annealed, there will now be no
difference of potential between the two faces, and no current in the
galvanometer. If the two faces are not molecularly similar, however,
there will be a current, and the electrical effects to be subsequently
described will act additively, in an algebraical sense. Let one face now
be exposed to the stimulus of light. A responsive current will be found
to flow, from the less to the more stimulated face, in some cases, and
in others in an opposite direction.
It appears at first very curious that this difference of electric
potential should be maintained between opposite faces of a very thin and
highly conducting sheet of metal, the intervening distance between the
opposed surfaces being so extremely small, and the electrical resistance
quite infinitesimal. A homogeneous sheet of metal has become by the
unequal action of light, molecularly speaking, heterogeneous. The two
opposed surfaces are thrown into opposite kinds of electric condition,
the result of which is as if a certain thickness of the sheet,
electrically speaking, were made zinc-like, and the rest copper-like.
From such unfamiliar conceptions, we shall now pass easily to others to
which we are more accustomed. Instead of two opposed surfaces, we may
obtain a similar response by unequally lighting different portions of
the same surface. Taking a sheet of metal, we may expose one half, say
A, to light, the other half, B, being screened. Electrolytic contacts
are made by plunging the two limbs in two vessels which are in
connection with the two non-polarisable electrodes E and E′ (fig. 98,
a). On illumination of A and B alternately, we shall now obtain
currents flowing alternately in opposite directions.
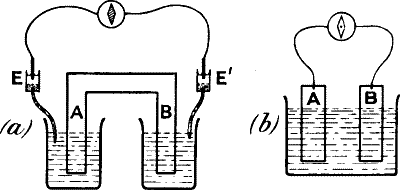
Fig. 98.—Modification of the Sensitive Cell
Just as in the strain cells the galvanometer contact was transferred
from the electrolytic part to the metallic part of the circuit, so we
may next, in an exactly similar manner, cut this plate into two, and
connect these directly to the galvanometer, electrolytic connection
being made by partially plunging them into a cell containing water. The
posterior surfaces of the two half-plates may be covered with a
non-conducting coating. And we arrive at a typical photo-electric cell
(fig. 98, b). These considerations will show that the eye is
practically a photo-electric cell.
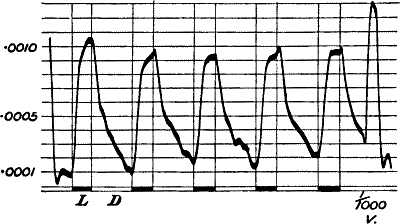
Fig. 99.—Responses To Light in Frog’s Retina
Illumination L for one minute, recovery in dark for two minutes during
obscurity D. (Waller.)
We shall now give detailed experimental results obtained with the
sensitive silver-bromide cell, and compare its response-curve with those
of the retina. A series of uniform light stimuli gives rise to uniform
responses, which show very little sign of fatigue. How similar these
response-curves are to those of the retina will be seen from a pair of
records given below, where fig. 99 shows responses of frog’s retina, and
fig. 100 gives the responses obtained with the sensitive silver cell
(fig. 100).
It was said that the responses of the retina are uniform. This is only
approximately true. In addition to numerous cases of uniform responses,
Waller finds instances of ‘staircase’ increase, and its opposite, slight
fatigue. In the record here given of the silver cell, the staircase
effect is seen at the beginning, and followed by slight fatigue. I have
other records where for a very long time the responses are perfectly
uniform, there being no sign of fatigue.
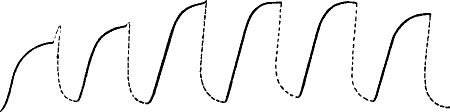
Fig. 100.—Responses in Sensitive Silver Cell
Illumination for one minute and obscurity for one minute. Thick line
represents record during illumination, dotted line recovery during
obscurity.
Another curious phenomenon sometimes observed in the response of retina
is an occasional slight increase of response immediately on the
cessation of light, after which there is the final recovery. An
indication of this is seen in the second and fourth curves in fig. 99.
Curiously enough, this abnormality is also occasionally met with in the
responses of the silver cell, as seen in the first two curves of
fig. 100. Other instances will be given later.
CHAPTER XVIII
INORGANIC RESPONSE—INFLUENCE OF VARIOUS CONDITIONS ON THE RESPONSE TO
STIMULUS OF LIGHT
- Effect of temperature
- —Effect of increasing length of exposure
- —Relation between intensity of light and magnitude of response
- —After-oscillation
- —Abnormal effects: (1) preliminary negative twitch; (2) reversal of response; (3) transient positive twitch on cessation of light; (4) decline and reversal
- —Résumé.
We shall next proceed to study the effect, on the response of the
sensitive cell, of all those conditions which influence the normal
response of the retina. We shall then briefly inquire whether even the
abnormalities sometimes met with in retinal responses have not their
parallel in the responses given by the inorganic.
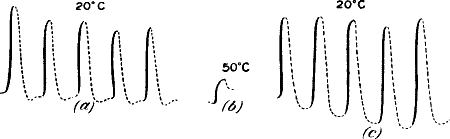
Fig. 101.—Influence of Temperature on Response
Illumination 20″, obscurity 40″.
In (a) is shown a series of responses at 20° C.—the record exhibits
slight fatigue. (b) is the slight irregular response at 50° C. (c)
is the record on re-cooling; it exhibits ‘staircase’ increase.
Effect of temperature.—It has been found that when the temperature is
raised above a certain point, retinal response shows rapid diminution.
On cooling, however, response reappears, with its original intensity. In
the response given by the sensitive cell, the same peculiarity is
noticed. I give below (fig. 101, a) a set of response-curves for
20° C. These responses, after showing slight fatigue, became fairly
constant. On raising the temperature to 50° C. response practically
disappeared (101, b). But on cooling to the first temperature again,
it reappeared, with its original if not slightly greater intensity
(fig. 101, c). A curious point is that while in record (a), before
warming, slight fatigue is observed, in (c), after cooling, the
reverse, or staircase effect, appears.
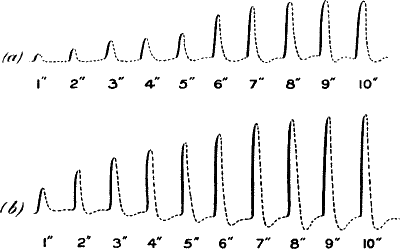
Fig. 102.—Response-curves for Increasing Duration of
Illumination from 1″ to 10″
In (a) the source of light was at a distance of 50 cm.; in (b) it
was at a distance of 25 cm. Note the after-oscillation.
Effect of increasing length of exposure.—If the intensity of light be
kept constant, the magnitude of response of the sensitive cell increases
with length of exposure. But this soon reaches a limit, after which
increase of duration does not increase magnitude of effect. Too long an
exposure may however, owing to fatigue, produce an actual decline.
I give here two sets of curves (fig. 102) illustrating the effect of
lengthening exposure. The intensities of light in the two cases are as 1
to 4. The incandescent burner was in the two cases at distances 50 and
25 cm. respectively. It will be observed that beyond eight seconds’
exposure the responses are approximately uniform. Another noticeable
fact is that with long exposure there is an after-oscillation. This
growing effect with lengthening exposure and attainment of limit is
exactly paralleled by responses of retina under similar conditions.
Relation between intensity of light and magnitude of response.—In the
responses of retina, it is found that increasing intensity of light
produces an increasing effect. But the rate of increase is not uniform:
increase of effect does not keep pace with increase of stimulus. Thus a
curve giving the relation between stimulus and response is concave to
the axis which represents the stimulus.
The same is true of the sensation of light. That is to say, within wide
limits, intensity of sensation does not increase so rapidly as stimulus.
This particular relation between stimulus and effect is also exhibited
in a remarkable manner by the sensitive cell. For a constant source of
light I used an incandescent burner, and graduated the intensity of the
incident light by varying its distance from the sensitive cell. The
intensity of light incident on the cell, when the incandescent burner
is at a distance of 150 cm., has been taken as the arbitrary unit. In
order to make allowance for the possible effects of fatigue I took two
successive series of responses (fig. 103). In the first, records were
taken with intensities diminishing from 7 to 1, and immediately
afterwards increasing from 1 to 7, in the second.
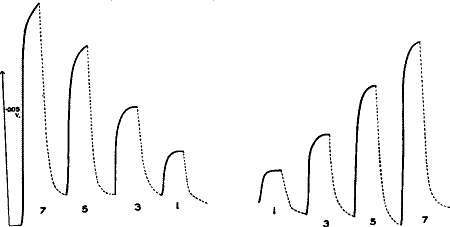
Fig. 103.—Responses of Sensitive Cell to various
Intensities of Light
On the left the responses are for diminishing intensities in the ratios
of 7, 5, 3, and 1. On the right they are for the increasing intensities
1, 3, 5, and 7. The thick lines are records during exposures of one
minute; the dotted lines represent recoveries for one minute.
Table giving Response to varying Intensities of Light
(The intensity of an incandescent gas-burner at a distance of 150 cm.
is taken as unit.)
Intensity
of Light |
Response
(Light
diminishing) |
Response
(Light
increasing) |
Mean |
Value in volt |
| 7 |
43 |
39 |
41 |
63·0 × 10− volt |
| 5 |
31 |
29 |
30 |
46·1 ×" |
| 3 |
18·5 |
17·5 |
18 |
27·7 ×" |
| 1 |
10 |
9 |
9·5 |
14·6 ×" |
As the zero point was slightly shifted during the course of the
experiment, the deflection in each curve was measured from a line
joining the beginning of the response to the end of its recovery. A mean
deflection, corresponding to each intensity, was obtained by taking the
average of the descending and ascending readings. The two sets of
readings did not, however, vary to any marked extent.
The deflections corresponding to the intensities 1, 3, 5, 7, are, then,
as 9·5 to 18, to 30, to 41. If the deflections had been strictly
proportionate to the intensities of light stimulus they would have been
as 9·5 to 28·5, to 47·5, to 66·5.
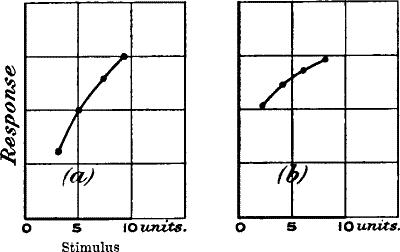
Fig. 104.—Curves giving the Relation between Intensity
of Light and Magnitude of Response
In (a) sensitive cell, (b) in frog’s retina.
In another set of records, with a different cell, I obtained the
deflections of 6, 10, 13, 15, corresponding to light intensities of 3,
5, 7, and 9.
The two curves in fig. 104, giving the relation between response and
stimulus, show that in the case of inorganic substances, as in the
retina (Waller), magnitude of response does not increase so rapidly as
stimulus.
After-oscillation.—When the sensitive surface is subjected to the
continued action of light, the E.M. effect attains a maximum at which
it remains constant for some time. If the exposure be maintained after
this for a longer period, there will be a decline, as we found to be the
case in other instances of continued stimulation. The appearance of this
decline, and its rapidity, depends on the particular condition of the
substance.
When the sensitive element is considerably strained by the action of
light, and if that light be now cut off, there is a rebound towards
recovery and a subsequent after-oscillation. That is to say, the curve
of recovery falls below the zero point, and then slowly oscillates back
to the position of equilibrium. We have already seen an instance of this
in fig. 102. Above is given a series of records showing the appearance
of decline, from too long-continued exposure and recovery, followed by
after-oscillation on the cessation of light (fig. 105). Certain visual
analogues to this phenomenon will be noticed later.
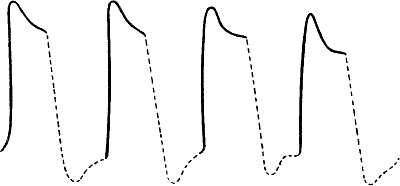
Fig. 105.—After-oscillation
Exposure of one minute followed by obscurity of one minute. Note the
decline during illumination, and after-oscillation in darkness.
Abnormal effects.—We have already treated of all the normal effects of
the stimulus of light on the retina, and their counterparts in the
sensitive cell. But the retina undergoes molecular changes when injured,
stale, or in a dying condition, and under these circumstances various
complicated modifications are observed in the response.
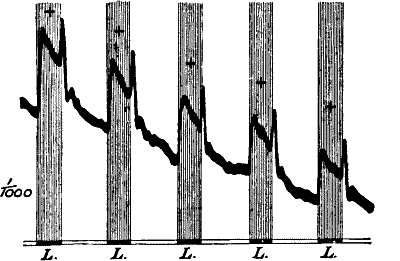
Fig. 106.—Transient Positive Augmentation given by the
Frog’s Retina on the Cessation of Light L (Waller)
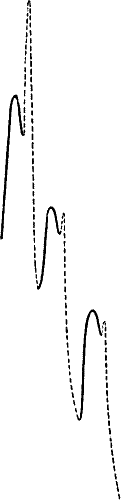
Fig. 107.—Responses in Silver Cell
The thick line represents response during light (half a minute’s
exposure), and dotted line the recovery during darkness. Note the
terminal positive twitch.
1. Preliminary negative twitch.—When the light is incident on the
frog’s retina, there is sometimes a transitory negative variation,
followed by the normal positive response. This is frequently observed in
the sensitive cell (see fig. 96, b).
2. Reversal of response.—Again, in a stale retina, owing to molecular
modification the response is apt to undergo reversal (Waller). That is
to say, it now becomes negative. In working with the same sensitive cell
on different days I have found it occasionally exhibiting this reversed
response.
3. Transient rise of current on cessation of light.—Another very
curious fact observed in the retina by Kuhne and Steiner is that
immediately on the stoppage of light there is sometimes a sudden
increase in the retinal current, before the usual recovery takes place.
This is very well shown in the series of records taken by Waller
(fig. 106). It will be noticed that on illumination the response-curve
rises, that continued illumination produces a decline, and that on the
cessation of light there is a transient rise of current. I give here a
series of records which will show the remarkable similarity between the
responses of the cell and retina, in respect even of abnormalities so
marked as those described (fig. 107). I may mention here that some of
these curious effects, that is to say, the preliminary negative twitch
and sudden augmentation of the current on the cessation of light, have
also been noticed by Minchin in photo-electric cells.
4. Decline and reversal.—We have seen that under the continuous action
of light, response begins to decline. Sometimes this process is very
rapid, and in any case, under continued light, the deflection falls.
(1) The decline may nearly reach zero. If now the light be cut off there
is a rebound towards recovery downwards, which carries it below zero,
followed by an after-oscillation (fig. 108, a).
(2) If the light be continued for a longer time, the decline goes on
even below zero; that is to say, the response now becomes apparently
negative. If, now, the light be stopped, there is a rebound upwards to
recovery, with, generally speaking, a slight preliminary twitch
downwards (fig. 108, b, c). This rebound carries it back, not only
to the zero position, but sometimes beyond that position. We have here a
parallel to the following observation of Dewar and McKendrick: ‘When
diffuse light is allowed to impinge on the eye of the frog, after it has
arrived at a tolerably stable condition, the natural E.M.F. is in the
first place increased, then diminished; during the continuance of light
it is still slowly diminished to a point where it remains tolerably
constant, and on the removal of light there is a sudden increase of the
E.M. power nearly up to its original position.’[18]
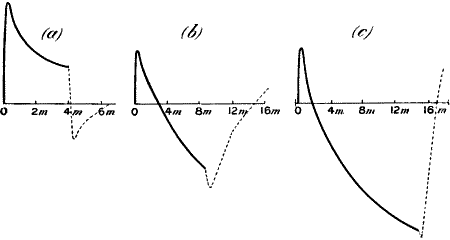
Fig. 108—Decline under the Continued Action of Light
(a) Decline short of zero; on stoppage of light, rebound downwards to
zero; after-oscillation.
(b) Decline below zero; on stoppage of light, rebound towards zero,
with preliminary negative twitch.
(c) The same, decline further down; negative twitch almost
disappearing.
(3) I have sometimes obtained the following curious result. On the
incidence of light there is a response, say, upward. On the continuation
of light the response declines to zero and remains at the zero position,
there being no further action during the continuation of stimulus. But
on the cessation or ‘break’ of light stimulus, there is a response
downwards, followed by the usual recovery. This reminds us of a somewhat
similar responsive action produced by constant electric current on the
muscle. At the moment of ‘make’ there is a responsive twitch, but
afterwards the muscle remains quiescent during the passage of the
current, but on breaking the current there is seen a second responsive
twitch.
Résumé.—So we see that the response of the sensitive inorganic cell, to
the stimulus of light, is in every way similar to that of the retina. In
both we have, under normal conditions, a positive variation; in both the
intensity of response up to a certain limit increases with the duration
of illumination; it is affected, in both alike, by temperature; in both
there is comparatively little fatigue; the increase of response with
intensity of stimulus is similar in both; and finally, even in
abnormalities—such as reversal of response, preliminary negative twitch
on commencement, and terminal positive twitch on cessation of
illumination, and decline and reversal under continued action of
light—parallel effects are noticed.
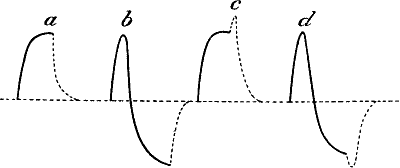
Fig. 109.—Certain After-effects of Light
We may notice here certain curious relations even in these abnormal
responses (fig. 109). If the equilibrium position remain always
constant, then it is easy to understand how, when the rising curve has
attained its maximum, on the cessation of light, recovery should proceed
downwards, towards the equilibrium position (fig. 109, a). One can
also understand how, after reversal by the continued action of light,
there should be a recovery upwards towards the old equilibrium
position (fig. 109, b). What is curious is that in certain cases we
get, on the stoppage of light, a preliminary twitch away from the zero
or equilibrium position, upwards as in (c) (compare also fig. 107) and
downwards as in (d) (compare also fig. 108 b).
In making a general retrospect, finally, of the effects produced by
stimulus of light, we find that there is not a single phenomenon in the
responses, normal or abnormal, exhibited by the retina which has not its
counterpart in the sensitive cell constructed of inorganic material.
CHAPTER XIX
VISUAL ANALOGUES
- Effect of light of short duration
- —After-oscillation
- —Positive and negative after-images
- —Binocular alternation of vision
- —Period of alternation modified by physical condition
- —After-images and their revival
- —Unconscious visual impression.
We have already referred to the electrical theory of the visual impulse.
We have seen how a flash of light causes a transitory electric impulse
not only in the retina, but also in its inorganic substitute. Light thus
produces not only a visual but also an electrical impulse, and it is not
improbable that the two may be identical. Again, varying intensities of
light give rise to corresponding intensities of current, and the curves
which represent the relation between the increasing stimulus and the
increasing response have a general agreement with the corresponding
curve of visual sensation. In the present chapter we shall see how this
electrical theory not only explains in a simple manner ordinary visual
phenomena, but is also deeply suggestive with regard to others which are
very obscure.
We have seen in our silver cell that if the molecular conditions of the
anterior and posterior surfaces were exactly similar, there would be no
current. In practice, however, this is seldom the case. There is,
generally speaking, a slight difference, and a feeble current in the
circuit. It is thus seen that there may be an existing feeble current,
to which the effect of light is added algebraically. The stimulus of
light may thus increase the existing current of darkness (positive
variation). On the cessation of light again, the current of response
disappears and there remains only the feeble original current.
In the case of the retina, also, it is curious to note that on closing
the eye the sensation is not one of absolute darkness, but there is a
general feeble sensation of light, known as ‘the intrinsic light of the
retina.’ The effect produced by external light is superposed on this
intrinsic light, and certain curious results of this algebraical
summation will be noticed later.
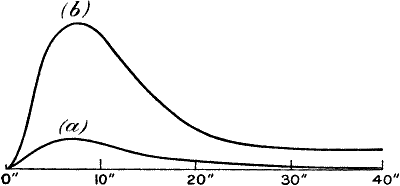
Fig. 110—Response-curves of the Sensitive Silver Cell
Showing greater persistence of after-effect when the stimulus is strong.
(a) Short exposure of 2″ to light of intensity 1; (b) short exposure
of 2″ to light nine times as strong.
Effect of light of short duration.—If we subject the sensitive cell to
a flash of radiation, the effect is not instantaneous but grows with
time. It attains a maximum some little time after the incidence of
light, and the effect then gradually passes away. Again, as we have seen
previously with regard to mechanical strain, the after-effect persists
for a slightly longer time when the stimulus is stronger. The same is
true of the after-effect of the stimulus of light. Two curves which
exhibit this are given below (fig. 110). With regard to the first
point—that the maximum effect is attained some time after the cessation
of a short exposure—the corresponding experiment on the eye may be made
as follows: at the end of a tube is fixed a glass disc coated with
lampblack, on which, by scratching with a pin, some words are written in
transparent characters. The length of the tube is so adjusted that the
disc is at the distance of most distinct vision from the end of the tube
applied to the eye. The blackened disc is turned towards a source of
strong light, and a short exposure is given by the release of a
photographic shutter interposed between the disc and the eye. On closing
the eye, immediately after a short exposure, it will at first be found
that there is hardly any well-defined visual sensation; after a short
time, however, the writing on the blackened disc begins to appear in
luminous characters, attains a maximum intensity, and then fades away.
In this case the stimulus is of short duration, the light being cut off
before the maximum effect is attained. The after-effect here is
positive, there being no reversal or interval of darkness between the
direct image and the after-image, the one being merely the continuation
of the other. But we shall see, if light is cut off after a maximum
effect is attained by long exposure, that the immediate after-image
would be negative (see below). The relative persistence of after-effect
of lights of different intensities may be shown in the following manner:
If a bold design be traced with magnesium powder on a blackened board
and fired in a dark room, the observer not being acquainted with the
design, the instantaneous flash of light, besides being too quick for
detailed observation, is obscured by the accompanying smoke. But if the
eyes be closed immediately after the flash, the feebler obscuring
sensation of smoke will first disappear, and will leave clear the more
persistent after-sensation of the design, which can then be read
distinctly. In this manner I have often been able to see distinctly, on
closing the eyes, extremely brief phenomena of light which could not
otherwise have been observed, owing either to their excessive rapidity
or to their dazzling character.[19]
After-oscillation.—In the case of the sensitive silver cell, we have
seen (fig. 105), when it has been subjected for some time to strong
light, that the current of response attains a maximum, and that on the
stoppage of the stimulus there is an immediate rebound towards recovery.
In this rebound there may be an over-shooting of the equilibrium
position, and an after-oscillation is thus produced.
If there has been a feeble initial current, this oscillatory
after-current, by algebraical summation, will cause the current in the
circuit to be alternately weaker and stronger than the initial current.
Visual recurrence.—Translated into the visual circuit, this would mean
an alternating series of after-images. On the cessation of light of
strong intensity and long duration, the immediate effect would be a
negative rebound, unlike the positive after-effect which followed on a
short exposure.
The next rebound is positive, giving rise to a sensation of brightness.
This will go on in a recurrent series.
If we look for some time at a very bright object, preferably with one
eye, on closing the eye there is an immediate dark sensation followed by
a sensation of light. These go on alternating and give rise to the
phenomena of recurrent vision. With the eyes closed, the positive or
luminous phases are the more prominent.
This phenomenon may be observed in a somewhat different manner. After
staring at a bright light we may look towards a well-lighted wall. The
dark phases will now become the more noticeable.
If, however, we look towards a dimly lighted wall, both the dark and
bright phases will be noticed alternately.
The negative effect is usually explained as due to fatigue. That
position of the retina affected by light is supposed to be ‘tired,’ and
a negative image to be formed in consequence of exhaustion. By this
exhaus tion is meant either the presence of fatigue-stuffs, or the
breaking-down of the sensitive element of the tissue, or both of these.
In such a case we should expect that this fatigue, with its consequent
negative image, would gradually and finally disappear on the restoration
of the retina to its normal condition.
We find, however, that this is not the case, for the negative image
recurs with alternate positive. The accepted theory of fatigue is
incapable of explaining this phenomenon.
In the sensitive silver cell, we found that the molecular strain
produced by light gave rise to a current of response, and that on the
cessation of light an oscillatory after-effect was produced. The
alternating after-effect in the retina points to an exactly similar
process.
Binocular alternation of vision.—It was while experimenting on the
phenomena of recurrent vision that I discovered the curious fact that in
normal eyes the two do not see equally well at a given instant, but that
the visual effect in each eye undergoes fluctuation from moment to
moment, in such a way that the sensation in the one is complementary to
that in the other, the sum of the two sensations remaining approximately
constant. Thus they take up the work of seeing, and then, relatively
speaking, resting, alternately. This division of labour, in binocular
vision, is of obvious advantage.
Fig. 111.—Stereoscopic Design
As regards maximum sensation in the two retinæ there is then a relative
retardation of half a period. This may be seen by means of a
stereoscope, carrying, instead of stereo-photographs, incised plates
through which we look at light. The design consists of two slanting
cuts at a suitable distance from each other. One cut, R, slants to the
right, and the other, L, to the left (see fig. 111). When the design is
looked at through the stereoscope, the right eye will see, say R, and
the left L, the two images will appear superimposed, and we see an
inclined cross. When the stereoscope is turned towards the sky, and the
cross looked at steadily for some time, it will be found, owing to the
alternation already referred to, that while one arm of the cross begins
to be dim, the other becomes bright, and vice versa. The alternate
fluctuations become far more conspicuous when the eyes are closed; the
pure oscillatory after-effects are then obtained in a most vivid manner.
After looking through the stereoscope for ten seconds or more, the eyes
are closed. The first effect observed is one of darkness, due to the
rebound. Then one luminous arm of the cross first projects aslant the
dark field, and then slowly disappears, after which the second
(perceived by the other eye) shoots out suddenly in a direction athwart
the first. This alternation proceeds for a long time, and produces the
curious effect of two luminous blades crossing and recrossing each
other.
Another method of bringing out the phenomenon of alternation in a still
more striking manner is to look at two different sets of writing, with
the two eyes. The resultant effect is a blur, due to superposition,
and the inscription cannot be read with the eyes open. But on closing
them, the composite image is analysed alternately into its component
parts, and thus we are enabled to read better with eyes shut than open.
This period of alternation is modified by age and by the condition of
the eye. It is, generally speaking, shorter in youth. I have seen it
vary in different individuals from 1″ to 10″ or more. About 4″ is the
most usual. With the same individual, again, the period is somewhat
modified by previous conditions of rest or activity. Very early in the
morning, after sleep, it is at its shortest. I give below a set of
readings given by an observer:
|
|
Period |
|
|
Period |
| 8 |
a.m. |
3″ |
6 |
p.m. |
5·4″ |
| 12 |
noon |
4″ |
9 |
" |
5·6″ |
| 3 |
p.m. |
5″ |
11 |
" |
6·5″ |
Again, if one eye be cooled and the other warmed, the retinal
oscillation in one eye is quicker than in the other. The quicker
oscillation overtakes the slower, and we obtain the curious phenomenon
of ‘visual beats.’
After-images and their revival.—In the experiment with the stereoscope
and the design of the cross, the after-images of the cross seen with the
eyes closed are at first very distinct—so distinct that any unevenness
at the edges of the slanting cuts in the design can be distinctly made
out. There can thus be no doubt of the ‘objective’ nature of the strain
impression on the retina, which on the cessation of direct stimulus of
light gives rise to after-oscillation with the concomitant visual
recurrence. This recurrence may therefore be taken as a proof of the
physical strain produced on the retina. The recurrent after-image is
very distinct at the beginning and becomes fainter at each repetition; a
time comes when it is difficult to tell whether the image seen is the
objective after-effect due to strain or merely an effect of ‘memory.’ In
fact there is no line of demarcation between the two, one simply merges
into the other. That this ‘memory’ image is due to objective strain is
rendered evident by its recurrence.
In connection with this it is interesting to note that some of the
undoubted phenomena of memory are also recurrent. ‘Certain sensations
for which there is no corresponding process outside the body are
generally grouped for convenience under this term [memory]. If the eyes
be closed and a picture be called to memory, it will be found that the
picture cannot be held, but will repeatedly disappear and appear.’[20]
The visual impressions and their recurrence often persist for a very
long time. It usually happens that owing to weariness the recurrent
images disappear; but in some instances, long after this disappearance,
they will spontaneously reappear at most unexpected moments. In one
instance the recurrence was observed in a dream, about three weeks after
the original impression was made. In connection with this, the revival
of images, on closing the eyes at night, that have been seen during the
day, is extremely interesting.
Unconscious visual impression.—While repeating certain experiments on
recurrent vision, the above phenomenon became prominent in an
unexpected manner. I had been intently looking at a particular window,
and obtaining the subsequent after-images by closing the eye; my
attention was concentrated on the window, and I saw nothing but the
window either as a direct or as an after effect. After this had been
repeated a number of times, I found on one occasion, after closing the
eye, that, owing to weariness of the particular portion of the retina, I
could no longer see the after-image of the window; instead of this I
however saw distinctly a circular opening closed with glass panes, and I
noticed even the jagged edges of a broken pane. I was not aware of the
existence of a circular opening higher up in the wall. The image of this
had impressed itself on the retina without my knowledge, and had
undoubtedly been producing the recurrent images which remained unnoticed
because my principal field of after-vision was filled up and my
attention directed towards the recurrent image of the window. When this
failed to appear, my field of after-vision was relatively free from
distraction, and I could not help seeing what was unnoticed before. It
thus appears that, in addition to the images impressed in the retina of
which we are conscious, there are many others which are imprinted
without our knowledge. We fail to notice them because our attention is
directed to something else. But at a subsequent period, when the mind is
in a passive state, these impressions may suddenly revive owing to the
phenomenon of recurrence. This observation may afford an explanation of
some of the phenomena connected with ocular phantoms and hallucinations
not traceable to any disease. In these cases the psychical effects
produced appear to have no objective cause. Bearing in mind the numerous
visual impressions which are being unconsciously made on the retina, it
is not at all unlikely that many of these visual phantoms may be due to
objective causes.
CHAPTER XX
GENERAL SURVEY AND CONCLUSION
We have seen that stimulus produces a certain excitatory change in
living substances, and that the excitation produced sometimes expresses
itself in a visible change of form, as seen in muscle; that in many
other cases, however—as in nerve or retina—there is no visible
alteration, but the disturbance produced by the stimulus exhibits itself
in certain electrical changes, and that whereas the mechanical mode of
response is limited in its application, this electrical form is
universal.
This irritability of the tissue, as shown in its capacity for response,
electrical or mechanical, was found to depend on its physiological
activity. Under certain conditions it could be converted from the
responsive to an irresponsive state, either temporarily as by
anæsthetics, or permanently as by poisons. When thus made permanently
irresponsive by any means, the tissue was said to have been killed. We
have seen further that from this observed fact—that a tissue when
killed passes out of the state of responsiveness into that of
irresponsiveness; and from a confusion of ‘dead’ things with inanimate
matter, it has been tacitly assumed that inorganic substances, like
dead animal tissues, must necessarily be irresponsive, or incapable of
being excited by stimulus—an assumption which has been shown to be
gratuitous.
This ‘unexplained conception of irritability became the starting-point,’
to quote the words of Verworn,[21] ‘of vitalism, which in its most
complete form asserted a dualism of living and lifeless Nature.... The
vitalists soon,’ as he goes on to say, ‘laid aside, more or less
completely, mechanical and chemical explanations of vital phenomena, and
introduced, as an explanatory principle, an all-controlling unknown and
inscrutable “force hypermécanique.” While chemical and physical forces
are responsible for all phenomena in lifeless bodies, in living
organisms this special force induces and rules all vital actions.
‘Later vitalists, however, attempted no analysis of vital force; they
employed it in a wholly mystical form as a convenient explanation of all
sorts of vital phenomena.... In place of a real explanation a simple
phrase such as “vital force” was satisfactory, and signified a mystical
force belonging to organisms only. Thus it was easy to “explain” the
most complex vital phenomena.’
From this position, with its assumption of the super-physical character
of response, it is clear that on the discovery of similar effects
amongst inorganic substances, the necessity of theoretically maintaining
such dualism in Nature must immediately fall to the ground.
In the previous chapters I have shown that not the fact of response
alone, but all those modifications in response which occur under
various conditions, take place in plants and metals just as in animal
tissues. It may now be well to make a general survey of these phenomena,
as exhibited in the three classes of substances.
We have seen that the wave of molecular disturbance in a living animal
tissue under stimulus is accompanied by a wave of electrical
disturbance; that in certain types of tissue the stimulated is
relatively positive to the less disturbed, while in others it is the
reverse; that it is essential to the obtaining of electric response to
have the contacts leading to the galvanometer unequally affected by
excitation; and finally that this is accomplished either (1) by
‘injuring’ one contact, so that the excitation produced there would be
relatively feeble, or (2) by introducing a perfect block between the two
contacts, so that the excitation reaches one and not the other.
Further, it has been shown that this characteristic of exhibiting
electrical response under stimulus is not confined to animal, but
extends also to vegetable tissues. In these the same electrical
variations as in nerve and muscle were obtained, by using the method of
injury, or that of the block.
Passing to inorganic substances, and using similar experimental
arrangements, we have found the same electrical responses evoked in
metals under stimulus.
Negative variation.—In all cases, animal, vegetable, and metal, we may
obtain response by the method of negative variation, so called, by
reducing the excitability of one contact by physical or chemical means.
Stimulus causes a transient diminution of the existing current, the
variation depending on the intensity of the stimulus (figs. 4, 7, 54).
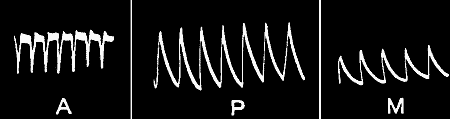
Fig. 112.—Uniform Responses in (A) Nerve, (P) Plant, and
(M) Metal
The normal response in nerve is represented ‘down.’ In this and
following figures, (A) is the record of responses in animal, (P) in
plant, and (M) in metal.
Relation between stimulus and response.—In all three classes we have
found that the intensity of response increases with increasing stimulus.
At very high intensities of stimulus, however, there is a tendency of
the response to reach a limit (figs. 30, 32, 84). The law that is known
as Weber-Fechner’s shows a similar characteristic in the relation
between stimulus and sensation. And if sensation be a measure of
physiological effect we can understand this correspondence of the
physiological and sensation curves. We now see further that the
physiological effects themselves are ultimately reducible to simple
physical phenomena.
Effects of superposition.—In all three types, ineffective stimuli
become effective by superposition.
Again, rapidly succeeding stimuli produce a maximum effect, kept
balanced by a force of restitution, and continuation of stimulus
produces no further effect, in the three cases alike (figs. 17, 18, 86).
Uniform responses.—In the responses of animal, vegetable, and metal
alike we meet with a type where the responses are uniform (fig. 112).
Fatigue.—There is, again, another type where fatigue is exhibited.
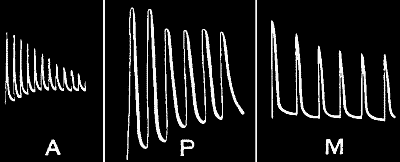
Fig. 113.—Fatigue (A) in Muscle, (P) in Plant, (M) in
Metal
The explanation hitherto given of fatigue in animal tissues—that it is
due to dissimilation or breakdown of tissue, complicated by the presence
of fatigue-products, while recovery is due to assimilation, for which
material is brought by the blood-supply—has long been seen to be
inadequate, since the restorative effect succeeds a short period of rest
even in excised bloodless muscle. But that the phenomena of fatigue and
recovery were not primarily dependent on dissimilation or assimilation
becomes self-evident when we find exactly similar effects produced not
only in plants, but also in metals (fig. 113). It has been shown, on the
other hand, that these effects are primarily due to cumulative residual
strains, and that a brief period of rest, by removing the overstrain,
removes also the sign of fatigue.
Staircase effect.—The theory of dissimilation due to stimulus reducing
the functional activity below par, and thus causing fatigue, is directly
negatived by what is known as the ‘staircase’ effect, where successive
equal stimuli produce increasing response. We saw an exactly similar
phenomenon in plants and metals, where successive responses to equal
stimuli exhibited an increase, apparently by a gradual removal of
molecular sluggishness (fig. 114).
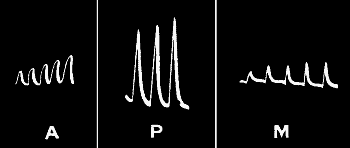
Fig. 114.—‘Staircase’ in Muscle, Plant, and Metal
Increased response after continuous stimulation.—An effect somewhat
similar, that is to say, an increased response, due to increased
molecular mobility, is also shown sometimes after continuous
stimulation, not only in animal tissues, but also in metals (fig. 115).
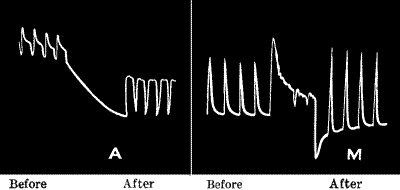
Fig. 115.—Increased Response after Continuous
Stimulation in Nerve and Metal
The normal response in animal tissue is represented ‘down,’ in metal
‘up.’
Modified response.—In the case of nerve we saw that the normal
response, which is negative, sometimes becomes reversed in sign, i.e.
positive, when the specimen is stale. In retina again the normal
positive response is converted into negative under the same conditions.
Similarly, we found that a plant when withering often shows a positive
instead of the usual negative response (fig. 28). On nearing the
death-point, also by subjection to extremes of temperature, the same
reversal of response is occasionally observed in plants. This reversal
of response due to peculiar molecular modification was also seen in
metals.
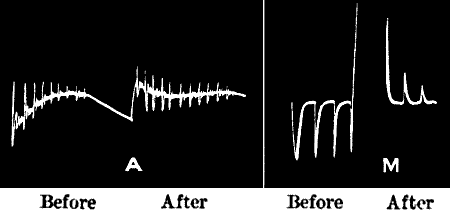
Fig. 116.—Modified Abnormal Response in (A) Nerve and
(M) Metal converted into Normal, after Continuous Stimulation
(A) is the record for nerve (recording galvanometer not being dead-beat
shows after-oscillation); the abnormal ‘up’ is converted into normal
‘down’ after continuous stimulation. (M) is the record for metal, the
abnormal ‘down’ being converted into normal ‘up’ after like
stimulation.
But these modified responses usually become normal when the specimen is
subjected to stimulation either strong or long continued (fig. 116).
Diphasic variation.—A diphasic variation is observed in nerve, if the
wave of molecular disturbance does not reach the two contacts at the
same moment, or if the rate of excitation is not the same at the two
points. A similar diphasic variation is also observed in the responses
of plants and metals (figs. 26, 68).
Effect of temperature.—In animal tissues response becomes feeble at low
temperatures. At an optimum temperature it reaches its greatest
amplitude, and, again, beyond a maximum temperature it is very much
reduced.
We have observed the same phenomena in plants. In metals too, at high
temperatures, the response is very much diminished (figs. 38, 65).
Effect of chemical reagents.—Finally, just as the response of animal
tissue is exalted by stimulants, lowered by depressants, and abolished
by poisons, so also we have found the response in plants and metals
undergoing similar exaltation, depression, or abolition.
We have seen that the criterion by which vital response is
differentiated is its abolition by the action of certain reagents—the
so-called poisons. We find, however, that ‘poisons’ also abolish the
responses in plants and metals (fig. 117). Just as animal tissues pass
from a state of responsiveness while living to a state of
irresponsiveness when killed by poisons, so also we find metals
transformed from a responsive to an irresponsive condition by the action
of similar ‘poisonous’ reagents.
The parallel is the more striking since it has long been known with
regard to animal tissues that the same drug, administered in large or
small doses, might have opposite effects, and in preceding chapters we
have seen that the same statement holds good of plants and metals also.
Stimulus of light.—Even the responses of such a highly specialised
organ as the retina are strictly paralleled by inorganic responses. We
have seen how the stimulus of light evokes in the artificial retina
responses which coincide in all their detail with those produced in the
real retina. This was seen in ineffective stimuli becoming effective
after repetition, in the relation between stimulus and response, and in
the effects produced by temperature; also in the phenomenon of
after-oscillation. These similarities went even further, the very
abnormalities of retinal response finding their reflection in the
inorganic.
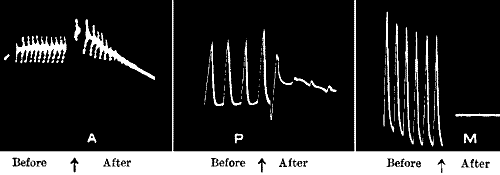
Fig. 117.—Abolition of Response in Nerve, Plant, and
Metal by the Action of the same ‘Poison’
The first half in each set shows the normal response, the second half
the abolition of response after the application of the reagent.
Thus living response in all its diverse manifestations is found to be
only a repetition of responses seen in the inorganic. There is in it no
element of mystery or caprice, such as we must admit to be applied in
the assumption of a hypermechanical vital force, acting in
contradiction or defiance of those physical laws that govern the world
of matter. Nowhere in the entire range of these
response-phenomena—inclusive as that is of metals, plants, and
animals—do we detect any breach of continuity. In the study of
processes apparently so complex as those of irritability, we must, of
course, expect to be confronted with many difficulties. But if these are
to be overcome, they, like others, must be faced, and their
investigation patiently pursued, without the postulation of special
forces whose convenient property it is to meet all emergencies in virtue
of their vagueness. If, at least, we are ever to understand the
intricate mechanism of the animal machine, it will be granted that we
must cease to evade the problems it presents by the use of mere phrases
which really explain nothing.
We have seen that amongst the phenomena of response, there is no
necessity for the assumption of vital force. They are, on the contrary,
physico-chemical phenomena, susceptible of a physical inquiry as
definite as any other in inorganic regions.
Physiologists have taught us to read in the response-curves a history of
the influence of various external agencies and conditions on the
phenomenon of life. By these means we are able to trace the gradual
diminution of responsiveness by fatigue, by extremes of heat and cold,
its exaltation by stimulants, the arrest of the life-process by poison.
The investigations which have just been described may possibly carry us
one step further, proving to us that these things are determined, not by
the play of an unknowable and arbitrary vital force, but by the working
of laws that know no change, acting equally and uniformly throughout the
organic and the inorganic worlds.
INDEX
- Action current
- in metal, 88
- in nerve, 8
- in plant, 19
- After-images and their revival, 177
- After-oscillation in photo-sensitive cell, 159, 163
- Anæsthetics, effect on response
- Annealing, effect on response in metal, 101, 138
- Binocular alternation of vision, 175
- Block method, advantages of, 28, 77
- for obtaining response in metal, 82
- for obtaining response in plant, 28
- Chloral, effect on plant response, 75
- Chloroform, effect on
- nerve response, 72
- plant response, 74
- Compensator, 22
- Current of injury in nerve, 7
- Curves, characteristics of response, 3
- Death-point, determination of, in plants, 61, 63
- Depressants, effect on inorganic response, 142
- Depression, response by relative, 87
- Dewar on retinal current, 149
- Diphasic variation
- Dose, effect on
- Electrical recorder, 11
- Electrical response. See Response, electrical
- Electric tapper, 24
- Exaltation, response by relative, 89
- Fatigue,
- absence of, under certain conditions,
- in metal, 120
- in muscle, 39
- in plant, 39
- apparent, with increased frequency of stimulation,
- in metal, 120
- in muscle, 40
- in plant, 40
- diminution of response under strong stimulus due to, in plant, 57
- in metal, 118, 119, 185
- in muscle, 118, 185
- in plant, 20, 185
- rapid, under continuous stimulation
- removal of, by rest in plant, 43
- theory of, in muscle, 38, 185
- Holmgren on retinal current, 149
- Hysteresis, 137
- Injury, current of, in nerve, 7
- Inorganic response. See Metal, electrical response in
- Kuhne on retinal current, 149
- Kunkel on electrical changes by injury or flexion in plant, 14, 70
- Light,
- after-effect of short exposure to,
- on photo-sensitive cell, 171
- on retina, 171
- decline and reversal of response under continuous,
- in photo-sensitive cell, 166
- in retina 166
- effect of temperature on
- response of photo-sensitive cell produced by, 158
- retinal response produced by, 158
- relation between intensity and response to,
- in photo-sensitive cell, 161, 162
- in retina, 162
- response to,
- after-oscillation in photo-sensitive cell, 159, 163
- effect of increasing length of exposure
- in photo-sensitive cell, 159
- in retina, 160
- in frog’s retina, 150, 151, 156, 164, 166
- in photo-sensitive cell, 152, 153, 154, 155, 157, 165, 166
- McKendrick on retinal response, 149
- Mechanical
- recorder, 3
- response, 1
- stimulus
- by electric tapper, 24
- by spring-tapper, 23
- by vibrator, 24
- conditions of maintaining uniformity of, 26
- means of graduating intensity of, 22, 24, 96
- Metal, electric response in,
- abnormal, 125
- abolition of, by ‘poison,’ 143
- additive effect of superposition of stimulus on, 135
- annealing, effect of, on, 101
- by method of
- depressants, effect of, on, 142
- diphasic, 113, 114, 115, 116, 188
- enhancement of, after continuous stimulation, 127, 128, 186
- fatigue, 118, 119, 120, 121, 185. See also Fatigue
- maximum effect due to superposition of stimuli, 136
- modified, 129
- ‘molecular arrest,’ effect of, by ‘poison’ on, 145
- molecular friction, effect of, on, 108, 109
- prolongation of recovery
- by overstrain, 106
- by ‘poison,’ 145
- relation between, and stimulus, 134, 135
- staircase effect, 122, 186
- stimulant, effect of, on, 141
- temperature, effect of, on, 111
- uniform, 102, 184
- Minchin on photo-electric cell, 165
- Molecular
- ‘arrest’ in metals by ‘poison,’ 145
- friction, 108, 109
- model, 107
- voltaic cell, 99
- Munck on electric response in sensitive plants, 14
- Muscle, fatigue in, 38, 39, 40, 42. See also Fatigue
- prolongation of recovery by ‘poison’ in, 144
- relation between stimulus and response in, 52
- staircase effect in, 122
- stimulus, effect of superposition of, on, 36
- Myograph, 2
- Negative variation, response by method of,
- Nerve,
- current of injury in, 7
- injured and uninjured contacts corresponding to Cu and Zn in voltaic couple, 8
- response in,
- abnormal, when stale, 124, 187
- abolition of, by ‘poison,’ 139, 189
- anæsthetics, effect of, on, 72
- by method of negative variation, 9
- current of action of, 8
- enhancement of, after continuous stimulation, 127
- modified, 128
- relation between, and stimulus, 52
- reversed when stale, 11
- uniform, 184
- Nomenclature, anomalies of present, 9, 85
- Photographic recorder, 11, 22
- Plant
- chamber, 64
- electrical response
- in,
- abnormal, when stale or dying, 48, 187
- abolition of, by high temperature, 32, 64
- additive effect of stimulus on, 37
- anæsthetics, effect of, on, 30, 73, 74, 75
- by method
- of block, 28
- of negative variation, 18, 183
- diphasic, 46
- fatigue, 20, 39, 40, 41, 42, 43, 57, 185. See also Fatigue
- physiological character, 30
- ‘poison,’ effect of, on, 30, 32, 78, 79
- relation between, and stimulus, 52, 53, 54
- staircase effect, 37, 185
- stimulus,
- effect of single, on, 35
- effect of superposition of, on, 35
- temperature, effect of, on, 32, 59–69
- uniform, 36, 184
- radial E.M. response in, 49
- Poison,
- effect of, on response
- ‘molecular arrest’ in metal by, 145
- prolongation of recovery by action of,
- Record, simultaneous mechanical and electrical, of response, 13
- Recorder,
- electrical, 11
- mechanical, 3
- photographic, 11, 22
- response, 19
- Response-curve,
- characteristics of, 3
- electrical,
- abnormal,
- in metal, 123, 125
- in stale nerve, 11, 123
- in stale or dying plant, 48, 187
- in stale retina, 11, 164
- converted into normal after strong or continuous stimulation
- abolition of,
- by high temperature in plant, 32, 64
- by ‘poison,’
- additive effect of stimulus on,
- in metal, 135
- in plant, 37
- anæsthetics, effect of, on,
- annealing, effect of, on, in metal, 101, 138
- by method of block, 28, 82, 92
- by negative variation, 9, 18, 87, 183
- by relative depression, 87
- by relative exaltation, 89
- conditions for obtaining, 6, 86, 87
- continuous transformation from positive to negative in metal, 115
- decline and reversal of, under continuous light in photo-sensitive cell, 166
- decline and reversal of, under continuous light in retina, 166
- depressants, effect of, on inorganic, 142
- diminution of. See Fatigue
- diphasic
- dose, effect of,
- enhancement of, after continuous stimulation in metal, 127, 128, 186
- enhancement of, after continuous stimulation in nerve, 127, 186
- maximum effect due to superposition of stimulus, 35, 136
- measure of physiological activity, 13
- molecular
- friction, effect of, on, 108, 109
- modification, effect of, on, 11, 48, 123, 125, 129, 164, 187
- physiological character of, in plant, 30
- positive and negative, 11
- prolongation of recovery in, by ‘poison’ in metal, 145
- prolongation of recovery in, by ‘poison’ in muscle, 144
- prolongation of recovery in, from overstrain, 106
- relation between, and stimulus
- in metal, 134, 135
- in muscle, 52
- in nerve, 52
- in plant, 52, 53, 54
- in real and artificial retinæ, 162
- staircase effect,
- stimulant, effect of, on, in metal, 141
- temperature, effect of, on. See Temperature
- threshold of, 135
- to light. See Light
- uniform
- universal applicability of, 12
- mechanical, 1
- retinal. See Light
- simultaneous mechanical and electrical record of, 13
- Retina. See Light
- Sanderson, Burdon-, on electrical response in sensitive plants, 14
- Spring-tapper, mechanical stimulus by, 23
- Staircase effect
- Steiner on retinal response, 149
- Stimuli, maximum effect due to superposition of,
- in metal, 136
- in muscle, 36
- in plant, 36
- Stimulus,
- advantages of vibrational, 25
- and response, relation between,
- in metal, 134, 135
- in muscle, 52
- in nerve, 52
- in plant, 52, 53, 54
- in real and artificial retinæ, 162
- effect of different kinds of, 2
- mechanical,
- by spring-tapper, 24
- conditions for maintaining uniformity of, 26
- means of graduating intensity of, 22, 96
- vibrational, 24, 25, 26
- Temperature,
- death-points in plants, 61, 63
- effect of, on response
- in metal, 111
- in photo-sensitive cell, 158
- in plants, 32, 60–69
- in retina, 158
- increased sensitiveness in plant due to variation of, 66, 67
- Vibrational stimulus, 24, 25, 26
- Vision,
- binocular alternation of, 175
- effect of various conditions on the period of binocular alternation of, 177
- Visual
- images, revival of, 177
- impression, unconscious, 178
- impulse,
- chemical theory of, 148
- electrical theory of, 149
- phantoms, 179
- recurrence, 174
- Vital force, 13
- Vitalism, 182
- Waller
- on enhancement of nerve-response after continuous stimulation, 127
- on relation between stimulus and response in muscle, nerve, and retina, 52, 162
- on retinal response, 150, 156, 165
- on reversal of response in stale nerve and retina, 11, 124, 164
- on transformation from abnormal to normal response in nerve after continuous stimulation, 124
PRINTED BY
SPOTTISWOODE AND CO. LTD., NEW-STREET SQUARE
LONDON
End of the Project Gutenberg EBook of Response in the Living and Non-Living, by
Jagadis Chunder Bose

*** END OF THIS PROJECT GUTENBERG EBOOK RESPONSE IN LIVING AND NON-LIVING ***

***** This file should be named 18986-h.htm or 18986-h.zip *****
This and all associated files of various formats will be found in:
        http://www.gutenberg.org/1/8/9/8/18986/

Produced by Bryan Ness, Laura Wisewell and the Online
Distributed Proofreading Team at http://www.pgdp.net


Updated editions will replace the previous one--the old editions
will be renamed.

Creating the works from public domain print editions means that no
one owns a United States copyright in these works, so the Foundation
(and you!) can copy and distribute it in the United States without
permission and without paying copyright royalties.  Special rules,
set forth in the General Terms of Use part of this license, apply to
copying and distributing Project Gutenberg-tm electronic works to
protect the PROJECT GUTENBERG-tm concept and trademark.  Project
Gutenberg is a registered trademark, and may not be used if you
charge for the eBooks, unless you receive specific permission.  If you
do not charge anything for copies of this eBook, complying with the
rules is very easy.  You may use this eBook for nearly any purpose
such as creation of derivative works, reports, performances and
research.  They may be modified and printed and given away--you may do
practically ANYTHING with public domain eBooks.  Redistribution is
subject to the trademark license, especially commercial
redistribution.


*** START: FULL LICENSE ***

THE FULL PROJECT GUTENBERG LICENSE
PLEASE READ THIS BEFORE YOU DISTRIBUTE OR USE THIS WORK

To protect the Project Gutenberg-tm mission of promoting the free
distribution of electronic works, by using or distributing this work
(or any other work associated in any way with the phrase "Project
Gutenberg"), you agree to comply with all the terms of the Full Project
Gutenberg-tm License (available with this file or online at
http://gutenberg.org/license).


Section 1.  General Terms of Use and Redistributing Project Gutenberg-tm
electronic works

1.A.  By reading or using any part of this Project Gutenberg-tm
electronic work, you indicate that you have read, understand, agree to
and accept all the terms of this license and intellectual property
(trademark/copyright) agreement.  If you do not agree to abide by all
the terms of this agreement, you must cease using and return or destroy
all copies of Project Gutenberg-tm electronic works in your possession.
If you paid a fee for obtaining a copy of or access to a Project
Gutenberg-tm electronic work and you do not agree to be bound by the
terms of this agreement, you may obtain a refund from the person or
entity to whom you paid the fee as set forth in paragraph 1.E.8.

1.B.  "Project Gutenberg" is a registered trademark.  It may only be
used on or associated in any way with an electronic work by people who
agree to be bound by the terms of this agreement.  There are a few
things that you can do with most Project Gutenberg-tm electronic works
even without complying with the full terms of this agreement.  See
paragraph 1.C below.  There are a lot of things you can do with Project
Gutenberg-tm electronic works if you follow the terms of this agreement
and help preserve free future access to Project Gutenberg-tm electronic
works.  See paragraph 1.E below.

1.C.  The Project Gutenberg Literary Archive Foundation ("the Foundation"
or PGLAF), owns a compilation copyright in the collection of Project
Gutenberg-tm electronic works.  Nearly all the individual works in the
collection are in the public domain in the United States.  If an
individual work is in the public domain in the United States and you are
located in the United States, we do not claim a right to prevent you from
copying, distributing, performing, displaying or creating derivative
works based on the work as long as all references to Project Gutenberg
are removed.  Of course, we hope that you will support the Project
Gutenberg-tm mission of promoting free access to electronic works by
freely sharing Project Gutenberg-tm works in compliance with the terms of
this agreement for keeping the Project Gutenberg-tm name associated with
the work.  You can easily comply with the terms of this agreement by
keeping this work in the same format with its attached full Project
Gutenberg-tm License when you share it without charge with others.

1.D.  The copyright laws of the place where you are located also govern
what you can do with this work.  Copyright laws in most countries are in
a constant state of change.  If you are outside the United States, check
the laws of your country in addition to the terms of this agreement
before downloading, copying, displaying, performing, distributing or
creating derivative works based on this work or any other Project
Gutenberg-tm work.  The Foundation makes no representations concerning
the copyright status of any work in any country outside the United
States.

1.E.  Unless you have removed all references to Project Gutenberg:

1.E.1.  The following sentence, with active links to, or other immediate
access to, the full Project Gutenberg-tm License must appear prominently
whenever any copy of a Project Gutenberg-tm work (any work on which the
phrase "Project Gutenberg" appears, or with which the phrase "Project
Gutenberg" is associated) is accessed, displayed, performed, viewed,
copied or distributed:

This eBook is for the use of anyone anywhere at no cost and with
almost no restrictions whatsoever.  You may copy it, give it away or
re-use it under the terms of the Project Gutenberg License included
with this eBook or online at www.gutenberg.org

1.E.2.  If an individual Project Gutenberg-tm electronic work is derived
from the public domain (does not contain a notice indicating that it is
posted with permission of the copyright holder), the work can be copied
and distributed to anyone in the United States without paying any fees
or charges.  If you are redistributing or providing access to a work
with the phrase "Project Gutenberg" associated with or appearing on the
work, you must comply either with the requirements of paragraphs 1.E.1
through 1.E.7 or obtain permission for the use of the work and the
Project Gutenberg-tm trademark as set forth in paragraphs 1.E.8 or
1.E.9.

1.E.3.  If an individual Project Gutenberg-tm electronic work is posted
with the permission of the copyright holder, your use and distribution
must comply with both paragraphs 1.E.1 through 1.E.7 and any additional
terms imposed by the copyright holder.  Additional terms will be linked
to the Project Gutenberg-tm License for all works posted with the
permission of the copyright holder found at the beginning of this work.

1.E.4.  Do not unlink or detach or remove the full Project Gutenberg-tm
License terms from this work, or any files containing a part of this
work or any other work associated with Project Gutenberg-tm.

1.E.5.  Do not copy, display, perform, distribute or redistribute this
electronic work, or any part of this electronic work, without
prominently displaying the sentence set forth in paragraph 1.E.1 with
active links or immediate access to the full terms of the Project
Gutenberg-tm License.

1.E.6.  You may convert to and distribute this work in any binary,
compressed, marked up, nonproprietary or proprietary form, including any
word processing or hypertext form.  However, if you provide access to or
distribute copies of a Project Gutenberg-tm work in a format other than
"Plain Vanilla ASCII" or other format used in the official version
posted on the official Project Gutenberg-tm web site (www.gutenberg.org),
you must, at no additional cost, fee or expense to the user, provide a
copy, a means of exporting a copy, or a means of obtaining a copy upon
request, of the work in its original "Plain Vanilla ASCII" or other
form.  Any alternate format must include the full Project Gutenberg-tm
License as specified in paragraph 1.E.1.

1.E.7.  Do not charge a fee for access to, viewing, displaying,
performing, copying or distributing any Project Gutenberg-tm works
unless you comply with paragraph 1.E.8 or 1.E.9.

1.E.8.  You may charge a reasonable fee for copies of or providing
access to or distributing Project Gutenberg-tm electronic works provided
that

- You pay a royalty fee of 20% of the gross profits you derive from
     the use of Project Gutenberg-tm works calculated using the method
     you already use to calculate your applicable taxes.  The fee is
     owed to the owner of the Project Gutenberg-tm trademark, but he
     has agreed to donate royalties under this paragraph to the
     Project Gutenberg Literary Archive Foundation.  Royalty payments
     must be paid within 60 days following each date on which you
     prepare (or are legally required to prepare) your periodic tax
     returns.  Royalty payments should be clearly marked as such and
     sent to the Project Gutenberg Literary Archive Foundation at the
     address specified in Section 4, "Information about donations to
     the Project Gutenberg Literary Archive Foundation."

- You provide a full refund of any money paid by a user who notifies
     you in writing (or by e-mail) within 30 days of receipt that s/he
     does not agree to the terms of the full Project Gutenberg-tm
     License.  You must require such a user to return or
     destroy all copies of the works possessed in a physical medium
     and discontinue all use of and all access to other copies of
     Project Gutenberg-tm works.

- You provide, in accordance with paragraph 1.F.3, a full refund of any
     money paid for a work or a replacement copy, if a defect in the
     electronic work is discovered and reported to you within 90 days
     of receipt of the work.

- You comply with all other terms of this agreement for free
     distribution of Project Gutenberg-tm works.

1.E.9.  If you wish to charge a fee or distribute a Project Gutenberg-tm
electronic work or group of works on different terms than are set
forth in this agreement, you must obtain permission in writing from
both the Project Gutenberg Literary Archive Foundation and Michael
Hart, the owner of the Project Gutenberg-tm trademark.  Contact the
Foundation as set forth in Section 3 below.

1.F.

1.F.1.  Project Gutenberg volunteers and employees expend considerable
effort to identify, do copyright research on, transcribe and proofread
public domain works in creating the Project Gutenberg-tm
collection.  Despite these efforts, Project Gutenberg-tm electronic
works, and the medium on which they may be stored, may contain
"Defects," such as, but not limited to, incomplete, inaccurate or
corrupt data, transcription errors, a copyright or other intellectual
property infringement, a defective or damaged disk or other medium, a
computer virus, or computer codes that damage or cannot be read by
your equipment.

1.F.2.  LIMITED WARRANTY, DISCLAIMER OF DAMAGES - Except for the "Right
of Replacement or Refund" described in paragraph 1.F.3, the Project
Gutenberg Literary Archive Foundation, the owner of the Project
Gutenberg-tm trademark, and any other party distributing a Project
Gutenberg-tm electronic work under this agreement, disclaim all
liability to you for damages, costs and expenses, including legal
fees.  YOU AGREE THAT YOU HAVE NO REMEDIES FOR NEGLIGENCE, STRICT
LIABILITY, BREACH OF WARRANTY OR BREACH OF CONTRACT EXCEPT THOSE
PROVIDED IN PARAGRAPH F3.  YOU AGREE THAT THE FOUNDATION, THE
TRADEMARK OWNER, AND ANY DISTRIBUTOR UNDER THIS AGREEMENT WILL NOT BE
LIABLE TO YOU FOR ACTUAL, DIRECT, INDIRECT, CONSEQUENTIAL, PUNITIVE OR
INCIDENTAL DAMAGES EVEN IF YOU GIVE NOTICE OF THE POSSIBILITY OF SUCH
DAMAGE.

1.F.3.  LIMITED RIGHT OF REPLACEMENT OR REFUND - If you discover a
defect in this electronic work within 90 days of receiving it, you can
receive a refund of the money (if any) you paid for it by sending a
written explanation to the person you received the work from.  If you
received the work on a physical medium, you must return the medium with
your written explanation.  The person or entity that provided you with
the defective work may elect to provide a replacement copy in lieu of a
refund.  If you received the work electronically, the person or entity
providing it to you may choose to give you a second opportunity to
receive the work electronically in lieu of a refund.  If the second copy
is also defective, you may demand a refund in writing without further
opportunities to fix the problem.

1.F.4.  Except for the limited right of replacement or refund set forth
in paragraph 1.F.3, this work is provided to you 'AS-IS' WITH NO OTHER
WARRANTIES OF ANY KIND, EXPRESS OR IMPLIED, INCLUDING BUT NOT LIMITED TO
WARRANTIES OF MERCHANTIBILITY OR FITNESS FOR ANY PURPOSE.

1.F.5.  Some states do not allow disclaimers of certain implied
warranties or the exclusion or limitation of certain types of damages.
If any disclaimer or limitation set forth in this agreement violates the
law of the state applicable to this agreement, the agreement shall be
interpreted to make the maximum disclaimer or limitation permitted by
the applicable state law.  The invalidity or unenforceability of any
provision of this agreement shall not void the remaining provisions.

1.F.6.  INDEMNITY - You agree to indemnify and hold the Foundation, the
trademark owner, any agent or employee of the Foundation, anyone
providing copies of Project Gutenberg-tm electronic works in accordance
with this agreement, and any volunteers associated with the production,
promotion and distribution of Project Gutenberg-tm electronic works,
harmless from all liability, costs and expenses, including legal fees,
that arise directly or indirectly from any of the following which you do
or cause to occur: (a) distribution of this or any Project Gutenberg-tm
work, (b) alteration, modification, or additions or deletions to any
Project Gutenberg-tm work, and (c) any Defect you cause.


Section  2.  Information about the Mission of Project Gutenberg-tm

Project Gutenberg-tm is synonymous with the free distribution of
electronic works in formats readable by the widest variety of computers
including obsolete, old, middle-aged and new computers.  It exists
because of the efforts of hundreds of volunteers and donations from
people in all walks of life.

Volunteers and financial support to provide volunteers with the
assistance they need, is critical to reaching Project Gutenberg-tm's
goals and ensuring that the Project Gutenberg-tm collection will
remain freely available for generations to come.  In 2001, the Project
Gutenberg Literary Archive Foundation was created to provide a secure
and permanent future for Project Gutenberg-tm and future generations.
To learn more about the Project Gutenberg Literary Archive Foundation
and how your efforts and donations can help, see Sections 3 and 4
and the Foundation web page at http://www.pglaf.org.


Section 3.  Information about the Project Gutenberg Literary Archive
Foundation

The Project Gutenberg Literary Archive Foundation is a non profit
501(c)(3) educational corporation organized under the laws of the
state of Mississippi and granted tax exempt status by the Internal
Revenue Service.  The Foundation's EIN or federal tax identification
number is 64-6221541.  Its 501(c)(3) letter is posted at
http://pglaf.org/fundraising.  Contributions to the Project Gutenberg
Literary Archive Foundation are tax deductible to the full extent
permitted by U.S. federal laws and your state's laws.

The Foundation's principal office is located at 4557 Melan Dr. S.
Fairbanks, AK, 99712., but its volunteers and employees are scattered
throughout numerous locations.  Its business office is located at
809 North 1500 West, Salt Lake City, UT 84116, (801) 596-1887, email
business@pglaf.org.  Email contact links and up to date contact
information can be found at the Foundation's web site and official
page at http://pglaf.org

For additional contact information:
     Dr. Gregory B. Newby
     Chief Executive and Director
     gbnewby@pglaf.org


Section 4.  Information about Donations to the Project Gutenberg
Literary Archive Foundation

Project Gutenberg-tm depends upon and cannot survive without wide
spread public support and donations to carry out its mission of
increasing the number of public domain and licensed works that can be
freely distributed in machine readable form accessible by the widest
array of equipment including outdated equipment.  Many small donations
($1 to $5,000) are particularly important to maintaining tax exempt
status with the IRS.

The Foundation is committed to complying with the laws regulating
charities and charitable donations in all 50 states of the United
States.  Compliance requirements are not uniform and it takes a
considerable effort, much paperwork and many fees to meet and keep up
with these requirements.  We do not solicit donations in locations
where we have not received written confirmation of compliance.  To
SEND DONATIONS or determine the status of compliance for any
particular state visit http://pglaf.org

While we cannot and do not solicit contributions from states where we
have not met the solicitation requirements, we know of no prohibition
against accepting unsolicited donations from donors in such states who
approach us with offers to donate.

International donations are gratefully accepted, but we cannot make
any statements concerning tax treatment of donations received from
outside the United States.  U.S. laws alone swamp our small staff.

Please check the Project Gutenberg Web pages for current donation
methods and addresses.  Donations are accepted in a number of other
ways including checks, online payments and credit card donations.
To donate, please visit: http://pglaf.org/donate


Section 5.  General Information About Project Gutenberg-tm electronic
works.

Professor Michael S. Hart is the originator of the Project Gutenberg-tm
concept of a library of electronic works that could be freely shared
with anyone.  For thirty years, he produced and distributed Project
Gutenberg-tm eBooks with only a loose network of volunteer support.


Project Gutenberg-tm eBooks are often created from several printed
editions, all of which are confirmed as Public Domain in the U.S.
unless a copyright notice is included.  Thus, we do not necessarily
keep eBooks in compliance with any particular paper edition.


Most people start at our Web site which has the main PG search facility:

     http://www.gutenberg.org

This Web site includes information about Project Gutenberg-tm,
including how to make donations to the Project Gutenberg Literary
Archive Foundation, how to help produce our new eBooks, and how to
subscribe to our email newsletter to hear about new eBooks.