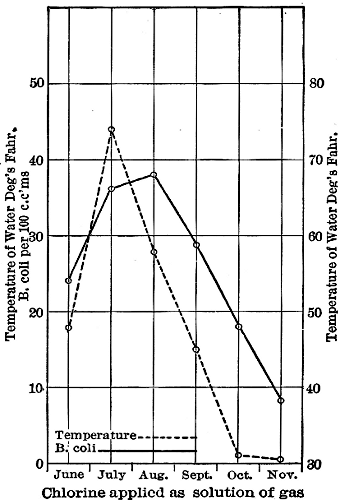
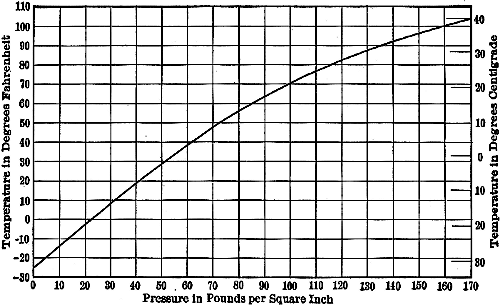
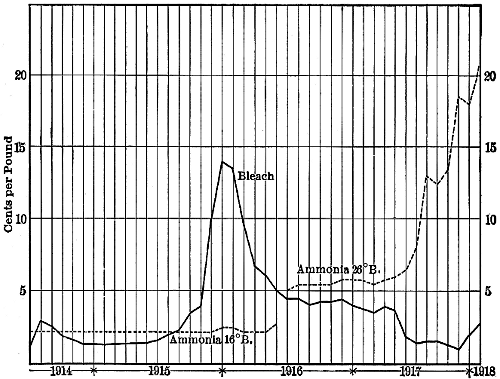
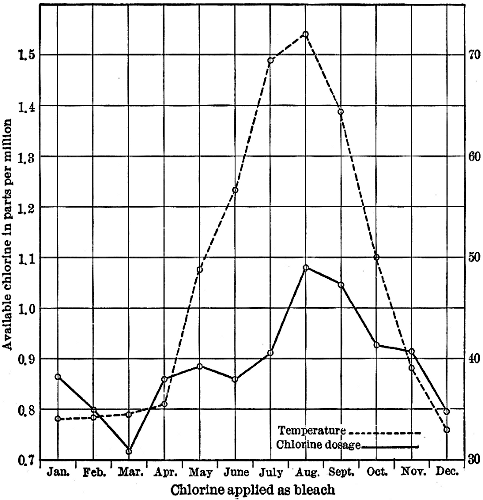
DIAGRAM III
EFFECT OF TEMPERATURE
The Project Gutenberg EBook of Chlorination of Water, by Joseph  Race

This eBook is for the use of anyone anywhere at no cost and with
almost no restrictions whatsoever.  You may copy it, give it away or
re-use it under the terms of the Project Gutenberg License included
with this eBook or online at www.gutenberg.org


Title: Chlorination of Water

Author: Joseph  Race

Release Date: September 11, 2011 [EBook #37389]

Language: English

Character set encoding: ISO-8859-1

*** START OF THIS PROJECT GUTENBERG EBOOK CHLORINATION OF WATER ***


Produced by Bryan Ness, Harry Lamé and the Online
Distributed Proofreading Team at http://www.pgdp.net (This
book was produced from scanned images of public domain
material from the Google Print project.)
More extensive transcriber's notes can be found at the end of this e-book.
WORKS OF
PUBLISHED BY
Examination of Milk for Public Health Purposes.
A practical handbook for those engaged in the chemical and bacteriological examination of milk for public health purposes. vi + 224 pages, 51⁄4 × 8, 4 diagrams. Cloth, $1.75 net.
Chlorination of Water.
In this book the various aspects and methods of chlorination are discussed with a view to stimulating research work in this field of science. viii + 158 pages, 51⁄4 × 8, 12 figures and 16 diagrams. Cloth, $1.50 net.
BY
City Bacteriologist and Chemist, Ottawa; Capt. Canadian Army Hydrological Corps;
Associate Member of Committee on Water Supplies, American Public Health
Association; Member of Committee on Water Standards and Standard
Methods of Analysis, American Water Works Association;
Chairman of Committee on Standard Methods of
Analysis, Canadian Public Health Association
FIRST EDITION
NEW YORK
JOHN WILEY & SONS, Inc.
London: CHAPMAN & HALL, Limited
1918
Copyright, 1918
BY
JOSEPH RACE, F.I.C.
PRESS OF
BRAUNWORTH & CO.
BOOK MANUFACTURERS
BROOKLYN, N. Y.
DEDICATED
TO
Sir Alexander Houston, K.B.E., D.Sc., M.B., C.M.
No apology is necessary for the publication of a book on the chlorination of water. This method of treatment, practically unknown fifteen years ago, has advanced in popularity during the last decade in a most remarkable manner, and in 1918 over forty millions of people are being supplied with chlorinated water.
It may justifiably be said that no other sanitary measure has accomplished so much at so small a cost; and that civilization owes a deep debt of gratitude to the pioneers in municipal water chlorination: Dr. A. C. Houston in England, and Mr. G. A. Johnson and Dr. Leal in America.
In this volume I have endeavoured to collect and correlate the information hitherto scattered in various journals and treatises and to present it in a comprehensible manner. The various aspects and methods of chlorination are discussed and suggestions have been made which, I hope, will stimulate research work in this fertile field of science.
I wish to acknowledge my indebtedness to the engineering staff of the Ottawa Water Works Department and to Lieut. W. M. Bryce for the preparation of diagrams.
Joseph Race.
Ottawa, Ont.,
April, 1918.
Chlorine, although one of the most widely distributed elements known to chemists, is never found in the free condition in nature; it exists in enormous quantities in combination with sodium, potassium, calcium, magnesium, etc. As sodium chloride, common salt, it occurs in practically inexhaustible quantities in sea water together with smaller quantities of other chlorides. In mineral form, enormous deposits of sodium chloride are found in Galicia, Transylvania, Spain, in England (particularly in Cheshire), and in sections of North America. The most important deposits of potassium chloride are those at Stassfurt, Germany, where it occurs either in the crystalline condition as sylvine or combined with magnesium chloride as carnallite.
Chlorine was discovered by the Swedish chemist Scheele in 1774, but he, like Lavoisier and his pupil Berthollet, who declared it an oxygenated muriatic acid, was unaware of the elemental nature of the new substance. Sir Humphrey Davy investigated this body in 1810 and definitely proved it to be an element; Davy designated the element chlorine from the Greek χλωρός = green.
The first attempt to utilise chlorine, or its compounds,[2] for bleaching purposes, appears to have been due to James Watt, who noticed the decolourising properties of chlorine during a visit to Berthollet. This attempt ended in failure because of the destructive effect on the fibres, but, in later trials, this was prevented by first absorbing the gas in a solution of fixed alkali. These experiments proved the possibility of bleaching by means of chlorine compounds but the high cost of soda made the process unprofitable, and it was not until Henry succeeded in preparing a combination with lime that could be reduced to a dry powder that this mode of chemical bleaching became a commercial success.
The manufacture of chloride of lime (hypochlorite of lime, bleaching powder, bleach) was taken up by Charles Tennant in 1799 at St. Rollox near Glasgow, and in 1800 about 50 tons were sold at a price of $680 (£139) per ton.
Chlorine is produced as a by-product in the manufacture of soda by the Leblanc process, but until 1865, when the British Alkali Act stopped the discharge of hydrochloric acid vapours into the atmosphere, the development of the bleaching powder industry was not rapid. The hydrochloric acid that was formerly discharged into the air as a waste product afterwards became a valuable asset that enabled the Leblanc process to successfully compete with the newer ammonia-soda process. In 1890 another competitor to the Leblanc process was introduced when caustic and chlorine were produced in Germany by electrolytic methods. After the successful development of this method in Germany, it was taken up in the United States of America and in 1912 more than 30,000 electrical horse-power were daily used in this industry. In 1914 the almost complete cessation of exports of bleach from Europe raised the price, which attained phenomenal heights in 1916 (cf. page 125), and stimulated the production of bleach both in the U. S. A. and Canada.
| Year. | Bleach Manufactured, Short Tons. |
Selling Price Per 100 Lbs. |
|
| 1904 | 19,000 | ||
| 1909 | 58,000 | ||
| 1914 | 155,000 | $ 1.63 | |
| 1915 | 180,000 | [A] | 2.63 |
| 1916 | 230,000 | [A] | 6.56 |
| 1917 | 260,000 | [A] | 2.44 |
| [A] Estimated. | |||
As a disinfectant, chlorine was first used about the year 1800 by de Morveau, in France, and by Cruikshank, in England, who prepared the gas by heating a mixture of hydrochloric acid and potassium bichromate or pyrolusite; this is essentially the same as the original mixture used by Scheele.
During the early part of the last century the efficacy of chlorine of lime as a disinfectant, and particularly as a deodourant, was well recognised and as early as 1854 an English Royal Commission used this substance for deodourising the sewage of London. A committee of the American Public Health Association reported in 1885 that chloride of lime was the best disinfectant available when cost and efficiency were considered.
Eau de Javelle, first made by Percy at the Javelle works near Paris in 1792, is another chlorine compound that has enjoyed a considerable reputation as a disinfectant and deodouriser for over a century; it is essentially a mixture of sodium chloride and sodium hypochlorite.
The discovery of electrolytic hypochlorites dates back to 1859, when Watt found that chlorides of the fixed alkalies and alkaline earths yielded hypochlorites on being submitted to the action of an electrical current.
Until the middle of the last century disinfection was regarded as a process that arrested or prevented putrefactive[4] changes but the nature of these changes was imperfectly comprehended and micro-organisms were not associated with them.
In 1839 Theodor Schwann,[1] who might be regarded as the founder of the school of antiseptics, reported that “Fermentation is arrested by any influence capable of killing fungi, especially by heat, potassium arseniate, etc....”; but his results were not accepted by the adherents of the theory of spontaneous generation and it was not until the publication of the work of Schroder and Dusch[2] that Schwann’s views were even partially accepted. The final refutation to the spontaneous generation theory was given by the monumental researches of Pasteur who, in 1862, proved the possibility of preparing sterile culture media and demonstrated the manner in which they could be protected from contamination. Bacteria and other micro-organisms were shown to be responsible for the phenomena that had been attributed previously to the “oxygen of the air,” and from this period the development of bacteriology as a science proceeded rapidly.
The next important step, from the public health standpoint, was the discovery by Koch, in 1876, that a specific bacterium (B. anthracis) was the cause of a specific disease in cattle (anthrax or splenic fever). In 1882 Koch made a further advance by developing a solid culture medium which permitted disinfectants and antiseptics to be studied quantitatively with a greater degree of accuracy than had been possible previously.
Since 1845, when Semmelweiss succeeded in stamping out puerperal fever in Vienna, where it had been so long established as to be endemic, chlorine has been very generally employed in sanitary work and the conditions necessary for obtaining successful results have been partially elucidated. Baxter was the first to state that the disinfecting action depended more upon the nature of the pabulum than[5] upon the specific organism present and this was confirmed later by Kuhn, Bucholtz, and Haberkorn. The latter found that urine consumed large quantities of chlorine before any disinfection occurred.
One of the earliest preparations used in sanitary work was an electrolysed sea water, usually known as Hermite Fluid. This was introduced by M. Hermite in 1889 and was employed for domestic purposes and for flushing sewers and latrines. It was used at Brest for the dissolution of fæcal matter and a prolonged trial was given to it at Worthing in 1894. The report of Dupré and Klein, who conducted the bacteriological examinations, was against the process, but Ruffer and Roscoe reported more favourably and further trials were carried out at Havre, l’Orient, and Nice. The Lancet (May 26, 1894) reported at length upon the Worthing experiments: it was found that during the electrolysis of the sea water, the magnesium chloride was also partially converted into hypochlorite, which then dissociated into magnesium hydrate and hypochlorous acid; the former deposited in the electrolyser and left the solution acid and unstable; urine was found to act upon it at once with a consequent loss in strength of over 50 per cent.
Another electrolytic method was that of Webster,[3] who installed an experimental plant at Crossness, near London, in 1889. A low-tension direct current was passed between iron electrodes placed in the sewage and although the process was largely one of chemical precipitation, Webster noted the disinfecting value of the hypochlorite formed from the chlorides normally present in the sewage. He also directed the attention of sanitarians to the possibility of using sea water as a cheap source of chlorides and a plant based on this principle was erected in Bradford in 1890 and reported upon by McLintock.[4]
Strong salt solutions were substituted for sea water by Woolf and the product was commercially known as “Electrozone.”[6] A plant of this description was installed at Brewster, N. Y., in 1893[5] for chlorinating the sewage from a small group of houses. The sewage was discharged into a small creek which polluted Croton Lake. Successful results led to a similar treatment near Tonetta Creek.[6] This was apparently the first occasion on which the specific object was the destruction of bacteria.
Electrozone was used at Maidenhead, on the Thames, in 1897 and the installation was reported upon by Robinson, Kanthack, and Rideal in 1898. Kanthack found that a dosage 3-3.6 p.p.m. reduced the organisms in a sewage effluent to 10-50 per c.cm. whilst Rideal found that about 18 p.p.m. of chlorine produced a condition of sterility in 1 c.cm.
Chloride of lime had previously been used in the London sewage as a deodourant by Dibden in 1884 but the treatment was not successful and was abandoned in favour of other oxidisers.
During the last decade of the twentieth century the use of bleach for the disinfection of both sewage and water received the attention of many well-known German sanitarians and many important results were obtained.
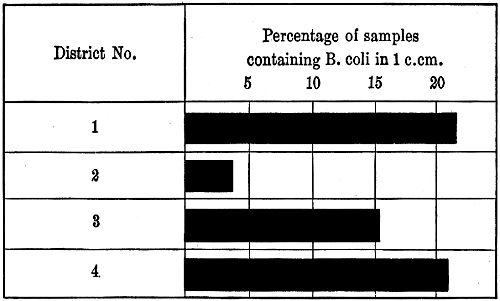
In the earlier experiments made at Hamburg, Proskauer and Elsner[7] obtained satisfactory results with 3-4 p.p.m. of chlorine on a clarified sewage with 10 minutes contact. Dunbar and Zirn (ibid.) used crude sewage and found that 17 p.p.m. of available chlorine were required to remove B. typhosus and cholera vibria with a contact period of two hours. A striking feature of all the German work on chlorination is the very high degree of purification aimed at: quantities as large as one litre were tested for specific organisms and in many of the experiments with sewage B. coli was found to be absent from a considerable percentage of the samples.
The importance of previously removing suspended matter,[7] which could not be penetrated by the germicide, was emphasised by Schwartz[8] although it had been previously noted by Schumacher.
At the Royal Testing Station in Berlin, numerous experiments on sewage chlorination were made by Kranejuhl and Kurpjuivut.[9] The results were judged by the B. coli content, which was taken as an index of pathogenicity because this typical intestinal bacillus was found to be more frequent and less viable than the majority of the pathogenic organisms.
Other important work on this subject was carried out, in connection with the pollution of the Hooghly River, by a Bengal Government Commission in 1904; and by the State Board of Health of Ohio in co-operation with the Bureau of Plant Industry of the United States Department of Agriculture in 1907. The chlorination experiments of the latter were reported by Kellerman, Pratt, and Kimberly.[10]
The most valuable contribution to the disinfection of sewage was that of Phelps,[11] who critically examined the work of previous experimenters and directed attention to the unnecessary stringent standards adopted in European practice. His work at Boston in 1906, at Red Bank, N. J., and at Baltimore in 1907, demonstrated in an indubitable manner the economic possibilities of sewage chlorination. The dosages necessary for crude sewage and filter effluents were indicated and also the necessary contact periods. This work marks the commencement of a new era in sanitary science.
The first occasion on which chlorine compounds were first used for the disinfection of water cannot be definitely ascertained. It has been stated to the author that bleach was used for treating wells as early as 1850 but this treatment was apparently made without definite knowledge of the destruction of micro-organisms.
In 1897, Sims Woodhead employed bleach solutions for[8] the sterilisation of the distribution mains at Maidstone, Kent, subsequent to an epidemic of typhoid fever.
The credit for the first systematic use of chlorine in water disinfection is due to A. C. Houston with whom McGowan was associated in the work carried out at Lincoln in 1904-1905.[12] The reservoirs, filters, and distribution system, owing to flood conditions, became infected with typhoid bacilli which caused a severe epidemic amongst the consumers. The storage and purifications works were thoroughly treated with a solution of “chloros” (sodium hypochlorite containing approximately 10 per cent of available chlorine) which was regulated to give an approximate dosage of 1 part per million. The bacteriological results were entirely satisfactory but many complaints were received that the treatment had imparted a mawkish taste to the water. This was attributed to the action of the alkaline chloros on the organic impurities in the water. It was also stated that the water injured plants, fish, and birds and extracted abnormal amounts of tannin from tea but no substantiating evidence was produced in support of these complaints. Houston made a continuous physiological test of the effect of the chlorinated water on small fish by suspending a cage of gold fish in the filter effluent chamber and also proved that the treatment had no appreciable effect on the plumbo-solvency of the supply.
Nesfield, of the Indian Army Medical Service,[13] reported in 1903 the results of numerous experiments on the destruction of pathogenic organisms by chlorine compounds and suggested their use in military work to prevent a recurrence of the appalling loss of life from water-borne diseases (especially enteric fever) such as took place during the Boer War. Nesfield proposed to use about 100 p.p.m. of available chlorine and to remove the excess after a contact period of 10 minutes. This work is especially interesting from the historical standpoint because it contains the first[9] suggestion of the possibilities of compressed chlorine gas in steel cylinders.
A few years later, electrolytic hypochlorite (oxychloride) was used at Guildford by Rideal and various chlorine compounds were tried on the water of the Seine and Vanne, in France, and at Middlekerke and Ostend, in Belgium. Experimental work on water chlorination was also reported by Thresh and by Moor and Hewlett.[14]
During the nineties many experiments on water chlorination were made by Traube, Sickenberger, Kauffman, Berge, Bassenge, and others. Traube[15] was able to completely sterilise water rich in bacteria in 2 hours by the addition of bleach equal to 1.06 p.p.m. of available chlorine. At the end of the contact period about 90 per cent of the added chlorine was unabsorbed and was destroyed by the addition of sodium bisulphite. Bassenge[16] followed up the work of Traube and that of Sickenberger and Kauffman, who had shown that it was possible to destroy cholera vibrio in Nile water by means of sodium hypochlorite. Bassenge used higher concentrations than Traube and found it possible to destroy B. typhosus and B. coli in ten minutes with 60-90 p.p.m. of available chlorine. The excess was destroyed by adding calcium bisulphite. Lode[17] experimented with waters seeded with B. coli, B. typhosus, and B. tetani and found, contrary to Traube, that 1-2 p.p.m. of chlorine did not sterilise in two hours. B. coli was usually destroyed by 4 p.p.m. of chlorine in ten minutes and even better results were obtained with B. typhosus and cholera vibrio: the former was destroyed in one hour by 1 p.p.m. and in ten minutes by 2 p.p.m.; the latter organism required 1-2 p.p.m. with a twenty-minute contact period. Lode noted that organic matter lowered the bactericidal activity of chlorine and recommended the use of 30 p.p.m. of chlorine to ensure rapid and complete sterilisation. Berge[18] used chlorine peroxide, generated by the action of hydrochloric[10] acid on potassium chlorate, for the sterilisation of water and this process was afterwards used at Ostend at a plant having a capacity of about 1,300,000 gallons per day. The dosage was equal to 0.53 p.p.m. of available chlorine and coke filters were used to destroy the excess although they were not found to be indispensable as the free chlorine disappeared spontaneously. This process appears to have been tried on the Brussels supply and also for the treatment of a hospital supply at Petrograd.
The object of German sanitarians seems to have been to obtain practically instantaneous sterilisation of water for the use of travellers and troops in the field. Until the commencement of the European War they did not have a high opinion of chlorination and generally regarded it as inefficient. Schumberg[19] expressed the opinion that no chemical method of disinfection could be absolutely relied upon, under all circumstances, to prove fatal to bacteria. Plucker[20] stated that several investigators, particularly Schuder, had shown that chlorine, even in the proportion of 40 p.p.m. did not invariably destroy cholera vibrio and B. typhosus; and that with smaller doses the destruction was still less complete. He also stated that the bacteriological experiments of American workers were open to criticism and that they employed antiquated methods.
By 1916 the German sanitarians appeared to have realised that their bacteriological standards were too stringent (Langer[21]) and that the process had proved its value in an indisputable manner.
European practice, in the comparatively few instances in which it has been used, has been to employ large doses of chlorine and to remove the excess by chemicals or by filtration through special media. In 1916, however, London commenced to chlorinate a portion of its supply and the following year practically the whole supply was chlorinated. A dosage of approximately 0.5 p.p.m. is used and[11] the bleach solution is added to the pre-filtered water. Worcester is also proposing to chlorinate the supply to maintain the purity of the water without extending the slow sand filtration plant.
In North America, hypochlorite of soda and chlorine were used on the Jewell Filter at the Louisville Experimental Station in about 1896 by George W. Fuller and a year later they were used at Adrian by Jewell. The first commercial successful attempt was made by G. A. Johnson. In 1908 the Union Stock Yards Company of Chicago were proceeded against by the City of Chicago regarding the condition of the effluent of the Bubbly Creek filter plant. Copper sulphate had been previously used in conjunction with the filters but stock shippers complained that the water had a deleterious effect upon the animals consuming it. Johnson eliminated the copper treatment and substituted bleach which was added seven and a half hours previous to filtration, with a dosage of 1.5 p.p.m. The results were very satisfactory.
About the same time, Johnson and Leal commenced the treatment of the Boonton supply of Jersey City, N. J., consumed about 40 million gallons per day. The water was first treated with 36 pounds of bleach per million gallons (1.4 p.p.m. of available chlorine) but this quantity was gradually reduced until only 5 pounds per million gallons (0.2 p.p.m. of chlorine) were being used in April, 1909. The ability of the process to adequately purify water became the cause of a lawsuit and the decision of the Court was:
“From the proofs taken before me, of the constant observation of the effect of this device, I am of the opinion and find that it is an effective process which destroys in the water the germs, the presence of which is deemed to indicate danger, including the pathogenic germs, so that the water after this treatment attains a purity much beyond that attained in water supplies of other municipalities. The[12] reduction and practical elimination of such germs from the water was shown to be substantially continuous.
“Upon the proofs before me, I find that the solution described leaves no deleterious substances in the water. It does produce a slight increase in the hardness but the increase is so slight as in my judgment to be negligible.
“I do therefore find and report that this device is capable of rendering the water delivered in Jersey City pure and wholesome, for the purposes for which it is intended and is effective in removing from the water those dangerous germs which were deemed by the decree to possibly exist therein at certain times.”[22]
During the next few years the use of hypochlorite in water purification, both alone and in conjunction with filtration, became very popular and in 1911 over 800 million gallons per day were treated in this manner. Amongst the users were some of the largest cities in North America, including Brooklyn, Albany, and New York City, N. Y., Cincinnati and Columbus, Ohio, Harrisburg, Philadelphia, Pittsburg, and Erie, Pa., Hartford, Conn., Nashville, Tenn., St. Louis and Kansas City, Mo., Montreal, P. Q., Toronto and Ottawa, Ont., Baltimore, Md., and Minneapolis, Minn. At present (1918) over 3,000 million gallons per day are being chlorinated in North America and more than 1,000 cities and towns are employing this process.
[1] Schwann. Microskopische Untersuchungen über die Übereinstimmung in der Textur und dem Wachstum der Tiere und Pflanzen. Berlin. 1839
[2] Schroder and Dusch. Ann. der Chem. u. Pharm., 1854, 89, 232.
[3] Webster. The Engineer. 1889, 67, 261.
[4] McLintock. Brit. Med. Jour., 1890, 11, 498.
[5] Eng. News. 1893, 30, 41.
[6] Eng. Record. 1894, 29, 110.
[7] Proskauer and Elsner. Vierteljahresschr. ger. Med. u. öff. Sanitätswesen. 1898, 16, Supp. Heft.[13]
[8] Schwartz. Gas. Eng., 1906, 29, 773.
[9] Kranejuhl and Kurjuivut. Mitteilungen aus der Königlichen Prüfungsanstalt für Wasserversorgung und Abwässerbeseitigung zu Berlin, 1907, 9, 149.
[10] Kellerman, Pratt, and Kimberly. Bull. 115, Bur. Plant Ind., U. S. Dept. of Agr., 1907.
[11] Phelps. Water Supply Paper 229, Dept. of Int., U. S. Geo. Survey.
[12] Houston and McGowan. 5th Rpt. Royal Commission on Sewage Disposal.
[13] Nesfield. Public Health. 1903, 15, 601.
[14] Moor and Hewlett. Rpt. of M. O. to L. G. B., 1909-10.
[15] Traube. Zeit. f. Hyg., 1894, 16, 149.
[16] Bassenge. Zeit. f. Hyg., 1895, 20, 227.
[17] Lode. Archiv. f. Hyg., 1895, 24, 236.
[18] Berge. Rev. d’Hyg., 1900, 22, 905.
[19] Schumburg. Zeit. f. Hyg., 1903, 45, 125.
[20] Plucker. J. Gasbeleucht., 1911, 54, 385.
[21] Langer. Zeit. f. Hyg., 1916, 81, 296.
[22] Johnson. Jour. Amer. Pub. Health Assoc., 1911, 1, 566.
Before considering the “modus operandi” of chlorine and hypochlorites, it will be advisable to take up the composition of the latter substances and particularly that of “bleach.” Bleach is manufactured by passing chlorine gas over slaked lime and the ensuing reactions are often represented by the equation Ca(OH)2 + Cl2 = CaOCl2 + H2O. This represents the substance formed as a pure oxychloride of calcium which contains approximately 50 per cent of chlorine, but the article commercially produced never contains this amount of chlorine, the usual percentage being from 35-37. The general composition of commercial bleach is fairly uniform. This is shown in the following analyses of which two are of German bleach examined by Lunge and one of Canadian manufacture analysed by the author.
| Lunge. | Race. | ||
| % | % | % | |
| Available chlorine | 37.00 | 38.30 | 37.50 |
| Chlorine as chlorides | 0.35 | 0.59 | 0.52 |
| Chlorine as chlorates | 0.25 | 0.08 | 0.18 |
| Lime | 44.49 | 43.34 | 44.12 |
| Magnesia | 0.40 | 0.31 | 1.28 |
| Iron oxide | 0.05 | 0.04 | 0.11 |
| Alumina | 0.43 | 0.41 | 0.46 |
| Carbon dioxide | 0.18 | 0.31 | 0.22 |
| Silica | 0.40 | 0.30 | 0.52 |
| Water and undetermined | 16.45 | 16.32 | 15.09 |
From these analyses the constitutional of commercial bleach might be represented by the formula
4CaOCl2·2Ca(OH)2·5H2O
which assumes it to contain:
| 68.0 per cent of calcium hypochlorite, | |
| 20.0 per cent of calcium hydroxide, | |
| and | 12.0 per cent of water. |
In this formula calcium hypochlorite has been written CaOCl2, but this substance actually contains one atom of oxygen less than the true hypochlorite, which has the constitutional formula ClO-Ca-OCl. This difference led some of the earlier chemists to regard CaOCl2 as a mixture of equal molecules of calcium chloride and calcium hypochlorite (CaCl2 + Ca(OCl)2 = 2CaOCl2), but it has been definitely established that no calcium chloride exists in the free state in dry commercial bleach.
Since the very earliest days when the process of bleaching was investigated it was considered to be a process of oxidation and it is not surprising that Lavoisier and his pupils, who had noted the strong decolourising action of the gas discovered previously by Scheele, should regard it as a compound that contained oxygen. They were confirmed in this view by the fact that an aqueous solution of the gas slowly evolved oxygen when placed in bright sunlight, and lost its bleaching properties. Watt disproved this and showed that the evolution of oxygen was due to the action of the chlorine on water.
Cl2 + H2O = 2HCl + O.
The bleaching action was not due to the chlorine “per se” but to the nascent oxygen produced in the presence of moisture. Later, when bleach and other chlorine compounds came into use as deodourisers, their action was attributed[16] to the oxygen produced and when their germicidal properties became known it was natural to assume that the destruction of bacteria was due to the same cause. Some of the earlier experimental work supported this view. Fischer and Proskauer[1] found that humidity played an important part in chlorine disinfection, probably because it favoured oxidation. In air saturated with moisture micro-organisms were killed by 0.3 per cent of chlorine in three hours but when the air was dry practically no action occurred. They concluded that chlorine was not directly toxic. Warouzoff, Winogradoff, and Kolessnikoff[2] were unable to confirm the results of Fischer and Proskauer and found that a mixture of chlorine gas and air killed tetanus spores in one minute.
The nascent oxygen hypothesis was clearly and succinctly expressed by Prof. Leal during the hearing of the Boonton, N. J., case and the following abstracts have been taken from his evidence:
“... That on the addition of bleach to water the loosely formed combination forming the bleach splits up into chloride of calcium and hypochlorite of calcium. The chloride of calcium being inert, the hypochlorite acted upon by the carbonic acid in the water either free or half bound, splits up into carbonate of calcium and hypochlorous acid. The hypochlorous acid in the presence of oxidisable matter gives off its oxygen; hydrochloric acid being left. The hydrochloric acid then drives off the weaker carbonic acid and unites with the calcium forming chloride of calcium.
“That the process was wholly an oxidising one, the work being done entirely by the oxygen set free from the hypochlorous acids in the presence of oxidizable matter....
“We have used during our investigations, the term ‘potential oxygen’ as expressing its factor of power. When set free, it is really nascent or atomic oxygen and is, in its most active state, entirely different from the oxygen normally in water....”
[17]The reactions suggested are expressed in the following equations:
| (i). | 2CaOCl2 = CaCl2 + Ca(OCl)2 |
| (ii). | Ca(OCl)2 + CO2 + H2O = CaCO3 + 2HClO |
| (iii). | 2HClO = 2HCl + O2 |
| (iv). | CaCO3 + 2HCl = CaCl2 + CO2 + H2O. |
Phelps, during the hearing of this case, suggested that hypochlorites were directly toxic to micro-organisms but this view was not supported by any definite evidence and the nascent oxygen hypothesis met with almost universal acceptance. Investigations made by the author in 1915, 1916 and 1917 have produced data which cannot be adequately explained by the nascent oxygen hypothesis.[3]
The disinfecting action of bleach can be most conveniently considered by regarding it as a heterogeneous mixture of the reactants and resultants of the reaction
CaO + H2O + Cl2 → CaOCl2 + H2O
which is in equilibrium for the temperature and pressure obtaining during the process of manufacture. Under suitable physical conditions the chlorine content can be increased to 40-42 per cent but such a product is not so stable as those represented by the analyses on page 14 and which contain approximately 20 per cent of excess hydrate of lime. The stability of bleach depends upon this excess of base (Griffen and Hedallen[4]) and although magnesia can be partially substituted for this excess of lime, a minimum of 5 per cent of free hydrate of lime is required to ensure stability.
On dissolving bleach in water the first action is the decomposition of calcium oxychloride into an equal number of molecules of calcium hypochlorite and calcium chloride.
2CaOCl2 = Ca(OCl)2 + CaCl2. [18]
In dilute solution these salts are dissociated and hydrolysis tends to occur in accordance with the equations
2Ca(OCl)2 + 4H2O ⇄ 2Ca(OH)2 + HOCl + HCl and
CaCl2 + 2H2O ⇄ Ca(OH)2 + 2HCl.
Calcium hydrate and hydrochloric acid are both practically completely dissociated, i.e. there is a large and equal quantity of H· and OH′, and the product is much greater than Kw (ionic product of water), and hence there is a combination of these ions, leaving the solution neutral and no undissociated acid or base exists. This statement is only approximately correct as hydrochloric acid is slightly more dissociated than calcium hydroxide (ratio 9 : 8) and the solution is consequently slightly acid, i.e. the H· concentration is greater than 1 × 10⁻⁷.
Hypochlorous acid is only very slightly dissociated, especially in the presence of the OCl′ ion due to the dissociation of the Ca(OCl)2, as compared with Ca(OH)2 and hydrolysis of the Ca(OCl)2 proceeds with increased dilution. The action is best represented by the equation
2Ca(OCl)2 + 2H2O ⇄ CaCl2 + Ca(OH)2 + 2HOCl
The hydrolytic constant of hypochlorous acid has apparently not been determined but as the acid is weaker than carbonic acid, which has a hydrolytic constant of 1 × 10⁻⁴, the value is probably between 1 × 10⁻³ and 1 × 10⁻⁴. From the formula x2⁄(1 - x)v = kwv in which 1 mole of pure Ca(OCl)2 is dissolved in v litres, x is the fraction hydrolysed, and kwv is the hydrolytic constant, complete hydrolysis occurs (x = 1) when v is not greater than 1 × 10⁴ litres. This is equivalent to a concentration of not less than 7.1 p.p.m. of available chlorine. Solutions of pure hypochlorites are alkaline in reaction because of the excess of hydroxyl ions [19](minimum concentration 1 × 10-4). In solutions of bleach the hydrolytic action is retarded by the OH′ due to the free base, and accelerated by the excess of H· caused by the dissociation and partial hydrolysis of CaCl2; the final result is determined by the relative proportions and the effect of the free base usually preponderates. The addition of any substance that reduces the OH′ concentration enables hydrolysis to proceed to completion and affords a rational explanation of the fact that solutions of bleach, on distillation with such weak acids as boric acid, yield a solution of hypochlorous acid. It also explains why the addition of an acid is necessary in Bunsen’s method (vide p. 79) of analysing hypochlorite solutions. It has been stated that when hydrochloric acid is employed the increase in the oxidising power is due to the action of the acid upon calcium chloride but this never occurs under ordinary conditions; weak acids such as carbonic or acetic will give practically the same result as hydrochloric acid in solutions of bleach of the strength used in water treatment. The slightly higher result obtained with strong acids is due to the decomposition of chlorates.
The effect of dilution alone is shown by the data given below. A 2 per cent bleach solution, containing very little excess base, was diluted with distilled water and the various dilutions titrated with thiosulphate after the addition of potassium iodide. In one series the solutions were titrated directly, and after acidification in the other. The results[A] were as follows:
| Strength of Solution. Grams Bleach Per 100 c.cms. |
|
|||
| 2.0 | 30.8 | |||
| 0.2 | 34.3 | |||
| 0.1 | 41.8 | |||
| 0.02 | 67.5 | |||
| 0.002 | 100.0 |
[A] Corrected for the alkali produced by HClO + 2KI = KCl + KOH + I2.
[20]Although every precaution was taken to exclude carbonic acid, a portion of the hydrolysis was probably due to this acid, which would remove calcium hydrate from the sphere of action and consequently alter the equilibrium. The above figures are only applicable to the particular sample used; other samples containing different excesses of base would yield different hydrolytic values. The results are in agreement with the hypothesis presented and confirm the theoretical deduction that very dilute bleach solutions are completely hydrolysed if no salts are present that will dissociate and increase the OH′ concentration. Hydrolysis is reduced by caustic alkalies and alkaline carbonates, and increased by acids and acid carbonates that reduce the OH′ concentration.
The effect of chlorides is anomalous and no adequate explanation for their action can be given at present. The addition of small quantities of sodium chloride (0.1 per cent) increases the hydrolysis of bleach solutions but much larger quantities tend to the opposite direction.
The effect of these substances upon the velocity of the germicidal action of bleach solutions is in the same direction as the hydrolysing effect.[4] Sodium chloride in quantities up to 10 parts per million has a very limited effect but larger quantities (90 p.p.m.) increase the velocity of the reaction. Sodium chloride, in the absence of hypochlorites, was found to have no influence upon the viability of B. coli in water.
In quantities up to approximately 5 p.p.m., sodium hydroxide has but little influence; 5-10 p.p.m. reduce the velocity to a marked degree, but when the quantity of caustic is still further increased the germicidal action of the alkali commences to be appreciable and may nullify the retarding action on the hypochlorite. Normal carbonates tend to reduce the velocity of the germicidal action and bicarbonates to increase it.
[21]Sulphuric acid, even in very small quantities (5 p.p.m.), has a marked accelerating effect and the total effect produced is much greater than can be accounted for by the germicidal activity of the acid alone. Weak acids such as carbonic acid and acetic acid are also effective accelerators. In one experiment a 0.01 per cent solution of bleach was found to be 40 per cent hydrolysed. By passing carbonic acid gas this was increased to 95 per cent and the velocity of the germicidal action of this solution was found to be approximately 100 per cent greater than that of the uncarbonated one. Norton and Hsu[5] have shown that the germicidal activity of some disinfectants is a function of the hydrogen ion concentration, but this factor is insufficient to account for the effect of acids on bleach solutions.
The effect of sodium chloride on the bacteriological results, like that on the hydrolytic constant, is anomalous. Similar effects have been observed on the addition of this salt to phenol and other disinfectants. The raison d’être of the increased activity is obscure but it is possible that the salt renders the organisms more susceptible to the action of the germicide.
Ammonia, though decreasing the hydrogen ion concentration of bleach and other hypochlorite solutions, markedly increases the velocity of the reaction; chlorinated derivatives of ammonia (chloramines), which have a specific germicidal action, are formed. These will be discussed at length in Chapter IX, p. 115.
Rideal[6] has shown that the addition of ammonia to sodium hypochlorite destroys the bleaching activity in acid solution. This has been found by the author to be also true for calcium hypochlorite (bleach). If the bleaching effect is due to oxidation, the oxidising power of hypochlorites must be considered to be destroyed by the addition of ammonia. The property of oxidising organic matter in water is also destroyed; this is well illustrated in Table II[22] which shows the rate of absorption of chlorine and chloramine by the Ottawa River water. The water used in this experiment contained 40 p.p.m. of colour and absorbed 9.5 p.p.m. of oxygen (30 mins. at 100° C.).
| Time of Contact Minutes. |
Absorption of Available Chlorine at 63° F. | ||
| Chlorine as Bleach. | Chlorine as Chloramine. | ||
| Nil. | 10.00 | 9.98 | |
| 5 | 6.50 | 9.98 | |
| 10 | 5.91 | 9.90 | |
| 20 | 5.18 | 9.90 | |
| 40 | 4.47 | 9.84 | |
| 60 | 3.90 | 9.84 | |
| 80 | 3.65 | 9.84 | |
| 20 | hours | .... | 9.68 |
| [B] Results are parts per million. | |||
From a consideration of these and other experiments made by the author in January, 1916, it became apparent that the nascent oxygen hypothesis entirely failed to explain the results obtained, and that they must be attributed to a direct toxic action of the chlorine or chloramine.
Dakin et al.[7] arrived at a similar conclusion from a consideration of the results obtained during the use of hypochlorite solutions in the treatment of wounds by Carrel’s method of irrigation. They attributed the marked beneficial action to the formation of chloramines in situ by the action of hypochlorous acid upon amino acids and proteid bodies. Compound chloramines (chlorinated aminobenzoic acids) were prepared in the laboratory and found to give excellent results in reducing wound infection. Later, other compounds were prepared for the purpose of sterilising small quantities of water for the use of mobile troops (see p. 128).
[23]Rideal[6] was the first to note the strong germicidal power of chloramine and attributed the persistent germicidal activity of hypochlorites in sewage to the formation of chloramine and chloramine derivatives.
Further evidence against the nascent oxygen theory of chlorine disinfection is to be found in the fact that such active oxidising agents as sodium, potassium, and hydrogen peroxides have a much lower germicidal activity than chlorine when compared on the basis of their oxygen equivalents. Table III shows chlorine to be approximately five times as active as potassium permanganate when compared on this basis.
| Contact Period. |
Bleach Available Chlorine 0.35 p.p.m. |
Potassium Permanganate. | ||||
| Oxygen Equivalent. Parts Per Million. | ||||||
| 0.08 | 0.133 | 0.266 | 0.400 | |||
| Nil | 140 | ... | ... | ... | ||
| 30 | mins | 90 | 122 | 115 | 110 | |
| 1 | hour | 68 | 115 | 100 | 80 | |
| 1 | 1⁄2 | hours | 63 | 108 | 95 | 75 |
| 4 | hours | 50 | 95 | 80 | 50 | |
| [C] Results are B. coli per 10 c.cms. | ||||||
The germicidal activity of oxidising agents has been shown by Novey and others to be somewhat proportional to the energy liberated during the reaction but even when this factor is taken into consideration chlorine compounds are more active than other oxidising agents. Hypochlorous acid is far superior to hydrogen peroxide as a germicidal agent and is as active as ozone, which liberates a greater amount of energy.
2HClO = 2HCl + O2 + 18,770 calories
2H2O2 = 2H2O + O2 + 46,120 calories
2O3 = 3O2 + 60,000 calories.
Again, solutions of chlorine gas and hypochlorites having the same oxidising activity, as determined by titration with thiosulphate after the addition of potassium iodide and acid, i.e. contain equal amounts of available chlorine, show approximately the same germicidal activity in water. On the addition of ammonia, the hypochlorite solutions retain their ability to liberate iodine from potassium iodide (Wagner test) but the property of oxidising such dyestuffs as indigo is destroyed and the germicidal activity is increased. Ammonia, when added to solutions of chlorine gas, diminishes the property of liberating iodine from potassium iodide, the bleaching effect on dyestuffs, and the germicidal action. It is often assumed that chlorine forms hypochlorous acid on solution in water Cl2 + H2O = HClO + HCl but the results obtained on the addition of ammonia indicate that either very little hypochlorous acid is formed or that ammonia and hypochlorous acid do not form chloramine in the presence of hydrochloric acid.
When chlorine gas was treated with a 0.5 per cent solution of ammonia in the proportion of 1 molecule of chlorine to 1.90-1.95 molecules of ammonia, Noyes and Lyon[8] found that nitrogen and nitrogen-trichloride were formed in equimolar quantities.
12NH3 + 6Cl2 = N2 + NCl3 + 9NH4Cl.
Bray and Dowell[9] showed that this reaction depended upon the hydrogen ion concentration and proceeded in accordance with the following equations:
| (i). | Acid solution 4NH3 + 3Cl2 = NCl3 + 3NH4Cl |
| (ii). | Alkaline solution 8NH3 + 3Cl2 = N2 + 6NH4Cl. |
In (i) with a ratio of chlorine to ammonia of 3 : 1 by weight, one-half of the chlorine is lost as ammonium chloride and one-half forms nitrogen trichloride, concerning which comparatively little is known; in (ii) the whole of the chlorine forms ammonium chloride, which has no germicidal value.
The effect of ammonia on the germicidal action of a solution of chlorine gas is shown in the Table IV.
| Conditions. Colour of water 40 p.p.m. Turbidity, 5 p.p.m. | |||||
| Contact Period. |
Available Chlorine 0.20 p.p.m., Ammonia. Parts Per Million. |
||||
| Nil. | 0.05 | 0.10 | 0.20 | ||
| Nil. | 130 | ... | ... | ... | |
| 10 | mins. | 135 | 140 | 130 | 135 |
| 1 | hour | 130 | 130 | 128 | 120 |
| 4 | hours | 120 | 112 | 110 | 105 |
| 24 | hours | 120 | 145 | 160 | 170 |
| [D] Results are B. coli per 10 c.cms. | |||||
Even when the ratio of Cl : NH3 was 4 : 1 by weight, practically the same as was used in the experiments of Noyes and Lyon, and Bray and Dowell, quoted above, the germicidal action was totally destroyed and the 24-hour results showed aftergrowths which were somewhat proportional to the amount of ammonia added. This was probably due to the formation of ammonium chloride, which provided additional nutriment for the organisms.
It has often been assumed that hypochlorite solutions are decomposed on addition to water containing free or half-bound carbonic acid with the production of free chlorine, but no evidence has been adduced in support. Free chlorine can be separated from hypochlorous acid in aqueous solution by extraction with carbon tetrachloride and when this solvent is shaken with a carbonated hypochlorite solution it is found that only traces of chlorine are removed.
[26]Hypochlorous acid reacts with hydrochloric acid with the evolution of free chlorine HClO + HCl = Cl2 + H2O but in very dilute solution the amount of free chlorine formed is exceedingly minute. Jakowkin[10] has shown that this reaction does not proceed to completion and that the concentration of free chlorine can be calculated from the equation HClO × H· × Cl′ = 320Cl2 in which the reactions are expressed in gram molecules per litre. The hydrogen ions and chlorine ions are obtained from the dissociation of carbonic acid (H2CO3 ⇄ H· + HCO3′) and chlorides (NaCl ⇄ Na· + Cl′) and also by the dissociation of hydrochloric acid produced by the interaction of hypochlorous acid and organic matter. HClO = O + HCl ⇄ H· + Cl′. If the formula of Jakowkin can be correctly applied to solutions containing fractions of a part per million of hypochlorous acid the free chlorine liberated by the addition of 1 p.p.m. of bleach to a water low in chlorides would be of the order 10-7-10-8 p.p.m.
Sodium hypochlorite is probably hydrolysed in dilute solution in a manner similar to that of bleach.
2NaOCl = NaCl + NaOH + HClO.
For solutions containing equal amounts of available chlorine, electrolytic sodium hypochlorite is more dissociated than bleach because of the absence of an excess of base, and this, together with the presence of sodium chloride, accounts for the slightly higher germicidal velocity obtained. The experience of pulp mills, with bleach and electrolytic hypochlorites, confirms this: the latter is a much quicker bleaching agent than bleach and it is often so rapid as to make it desirable to reduce the velocity by the addition of soda ash.
Regarding hypochlorite solutions a phenomenon of more scientific interest than of practical importance has been noted by Breteau[12] who found that alkaline solutions of sodium hypochlorite containing 0.94 per cent of available chlorine lost 3.6 per cent of their titer on dilution with[27] 80 volumes of water; also that this loss was increased by the addition of small quantities of salt (sodium chloride) and more so by carbonates and bicarbonates. The author has noted similar losses on diluting bleach solutions and that the loss increased on standing. The loss can be explained by the decomposition of hypochlorous acid, in the presence of light, into hydrochloric acid and oxygen. 2HClO = 2HCl + O2
Chlorine Water. When a solution of chlorine in water is used as a germicide the chemical reactions that occur differ materially from those of hypochlorite solutions. On solution in water, hydration or solvation probably takes place with the production of heat. Cl2·Aq. = 2,600 calories. Chlorine water is comparatively stable but decomposes under the influence of light in accordance with the equation Cl2 + H2O = 2HCl + O; a similar reaction occurs in the presence of organic matter or any substance capable of oxidation. Chlorine water contains only minute traces of hypochlorous acid and there is no evidence that the endothermic reaction
Cl2·Aq + H2O = HClO·Aq + HCl·Aq
-2600 - 68,460 = -29,930 - 39,315 - 1815
occurs in a measurable degree.
From thermochemical considerations hypochlorous acid and chlorine water should be about equally active as oxidising agents.
2HClO·Aq = 2HCl + O2 + 18,770 calories
2Cl2·Aq + 2H2O = 2HCl + O2 + 15,340 calories
2Cl2· + Aq + 2H2O = 2HCl + O2 + 20,540 calories
When a solution of chlorine or hypochlorite is added to water as a germicidal agent, a variety of reactions occur the character of which is determined by the nature of the mineral and organic matter in the water and the type of chlorine[28] compound added. The general reactions are of three types (1) oxidation of the organic matter, (2) direct chlorination of the organic matter, and (3) a bactericidal action.
In the treatment of waters that contain appreciable amounts of organic matter almost all the chlorine is consumed in reaction (1) and even with filter effluents it is probably true that oxidation accounts for the greater portion of the chlorine consumed. The author has found that a dosage of 0.02 part per million of available chlorine was more effective in destroying B. coli in distilled water than 0.40 p.p.m. in a water absorbing 9.5 p.p.m. of oxygen (30 mins. at 100° C.).
Reaction (1) can be adequately explained by the nascent oxygen hypothesis and it is this reaction that determines the dosage required for effective sterilisation. (See Chap. III.)
Very little information is available regarding reaction (2) but there is little doubt that a direct chlorination of the organic matter does occur and it is more than probable that these chlorinated derivatives are largely responsible for the obnoxious tastes and odours produced in some waters. It has been suggested that these were due to the formation of chloramines. This view was formerly supported by the author but the chloramine treatment at Ottawa and other places has demonstrated the inadequacy of this explanation. It is true that the odour of chloramine is stronger and more pungent than that of chlorine, but chloramine in the Ottawa supply, even with doses as high as 0.5 part per million of available chlorine, has caused no complaints.
The odour of some of the organo-chloro compounds is more penetrating and obnoxious than those of chlorine and chloramine, and it is quite possible that some of the higher homologues of chloramine are in this class. It should be noted, however, that some of the chloro-amido compounds prepared by Dakin are white, odourless, crystalline substances.
[29]Practically nothing is known regarding the specific nature of the mechanism involved in reaction (3). The hypothesis that chlorine, and chlorine compounds, exert a direct toxic action on the micro-organisms marks an advance in the science of water treatment but does not indicate the physiological processes involved. Cross and Bevan[11] have shown that chloro-amines have a tendency to combine with nitrogenous molecules and to become fixed on cellulose; it is therefore possible that reaction is a cytolytic one in which the chlorine attacks and partially or wholly destroys the membranous envelope of the organisms. A portion of the chlorine or chlorine-compound may also penetrate the membrane and produce changes that result in the death of the organism.
[1] Fischer and Proskauer, Rev. d’Hyg., 1884, 6, 515.
[2] Warouzoff, Winogradoff, and Kolessnikoff. Russkaia medicina, 1886, Nos. 3 and 32.
[3] Race. Jour. Amer. Water Works Assoc., 1918, 5, 63.
[4] Griffen and Hedallen. Jour. Soc. Chem. Ind., 1915, 34, 530.
[5] Norton and Hsu. Jour. Inf. Dis., 1916, 18, 180.
[6] Rideal, S. Jour. Roy. San. Inst., 1910, 31, 33.
[7] Dakin, Cohen, Duafresne, and Kenyon. Proc. Roy. Soc., 1916, 89B, 232.
[8] Noyes and Lyon. Jour. Amer. Chem. Soc., 1901, 23, 460.
[9] Bray and Dowell. Jour. Amer. Chem. Soc., 1917, 39, 905.
[10] Jakowkin. Zeit. f. Phys. Chim., 1899, 19, 613.
[11] Cross and Bevan. Jour. Soc. Chem. Ind., 1898, 28, 260.
[12] Breteau. Jour. Pharm. Chim., 1915, 12, 248.
The amount of chlorine required for efficient treatment is very largely determined by the amount required to satisfy the oxidisable matter present in the water. Many experimenters have reported results that would indicate that appreciable concentrations of chlorine are required for bactericidal action but the details of the technique, as published, show that the effect of the organic matter added with the test organism was not thoroughly appreciated. One cubic centimetre of a culture in ordinary peptone water, added to one litre of water, would increase the organic content by approximately 10 parts per million, an amount that would absorb appreciable amounts of chlorine.
Other conditions also make it very difficult to compare the results obtained in the past: one of these is the degree of purity set as the objective. German bacteriologists added enormous numbers of the test organism and endeavoured to obtain the complete removal of the organism from such quantities as one litre of water with a contact period often as short as 10 minutes. Nissen,[1] of the Hygienic Institute of Berlin, found that a 1 : 800 dilution of bleach (420 p.p.m. of chlorine) was required to destroy B. typhosus in one minute and a 1 : 1600 dilution (210 p.p.m. of chlorine) in 10 minutes. Delépine[2] obtained somewhat similar results by means of the thread method for testing disinfectants. Phelps,[3] using gelatine plates for enumeration of the bacteria, obtained a 90 per cent reduction of B. typhosus in twenty minutes[31] with 5 p.p.m. of available chlorine; over 99 per cent reduction in one hour, and over 99.99 per cent reduction in 18 hours. Wesbrook, Whittaker, and Mohler[4] tested bleach solutions with various strains of B. typhosus by means of the plate method and found that the most resistant one was reduced from 20,000 per c.cm. to sterility (in 1 c.cm.) by 3 p.p.m. of available chlorine in fifty minutes and that the least resistant one only required 1.0 p.p.m. with a thirty minutes’ contact.
Lederer and Bachmann[5] have reported the following results:
| Percentage Reduction, 15 Minutes’ Contact | ||||||||
| Available Chlorine p.p.m. |
Nature of Test Organism. | |||||||
| B. cloacæ. |
B. fæcalis alkali- genes. |
B. para- typho- sus. |
Proteus mira- bilis. |
B. enter- itidis. |
B. lactis aero- genes. |
B. cholerœ- suis. |
||
| 0.1 | ..... | 99.98 | ..... | 27.3 | ..... | ..... | ..... | |
| 0.2 | 99.69 | 99.99 | 99.97 | 45.5 | 99.83 | 99.17 | 95.8 | |
| 0.3 | 99.75 | 100.00 | 100.00 | 63.7 | 99.98 | 99.98 | 100.0 | |
| 0.5 | 100.00 | ..... | ..... | 72.7 | 100.00 | 100.00 | ..... | |
| 0.7 | ..... | ..... | ..... | 63.7 | ..... | ..... | ..... | |
| 1.0 | ..... | ..... | ..... | 63.7 | ..... | ..... | ..... | |
| 3.0 | ..... | ..... | ..... | 90.9 | ..... | ..... | ..... | |
| 5.0 | ..... | ..... | ..... | 90.0 | ..... | ..... | ..... | |
| Original number of organisms per c.cm. |
} | 160,000 | 9,500 | 3,000 | 8,000 | 180,000 | 180,000 | 500 |
With the exception of P. mirabilis, which forms endospores, all the organisms were killed (less than 1 per c.cm.) by 0.5 p.p.m. of available chlorine in fifteen minutes.
All these observers found that B. coli, the organism usually employed as an index of contamination, had approximately[32] the same degree of resistance to chlorine as B. typhosus, though Wesbrook et al. directed attention to the varying viability of organisms derived from different sources.
These experiments merely indicate the dosage required for exceptional conditions such as it is inconceivable would ever occur in water-works practice. No information is available regarding the actual B. typhosus content of waters that have caused epidemics of typhoid fever, but for the present purpose it may be assumed that the extreme condition would be a pollution by fresh sewage giving a B. coli content of 1,000 per c.cm. or 200 times worse than the average condition that can be satisfactorily purified without overloading a filter plant (500 B. coli per 100 c.cms.). Experiments made by the author indicate that a suspension of 1,000 B. coli per c.cm. in water, in the absence of organic matter, can be reduced to a 2 B. coli per 100 c.cms. standard (the U.S. Treasury Standard) by 0.1 p.p.m. of available chlorine in ten minutes at 65° F. This experiment indicates the amount of chlorine that is required for the bactericidal action only; such a dosage could never be used in practice to meet a pollution of this degree because of the accompanying organic matter. In actual practice the author has experienced the above condition but once, and on that occasion the B. coli were derived from soil washings and not from fresh sewage.
The amount of chlorine required for germicidal action is small, and the main factors that determine the dosage necessary to obtain this action are (1) the content of readily oxidisable organic matter, (2) the temperature of the water, (3) the method of application of the chlorine and (4) the contact period.
Oxidisable Matter. The oxidisable matter may be divided into two classes (a) inorganic and (b) organic. The inorganic constituents naturally found in water, that are readily oxidisable, are ferrous salts (usually carbonates), nitrites,[33] and sulphuretted hydrogen, and these react quantitatively with chlorine until fully oxidised. The oxygen value of chlorine is approximately one-quarter (actually 16 : 71) the available chlorine content in accordance with the equation Cl2/71 + H2O = 2HCl + O/16. One part per million of available chlorine will oxidise 1.58 p.p.m. of ferrous iron; 0.197 p.p.m. of nitrous nitrogen; and 0.479 p.p.m. of sulphuretted hydrogen.
| TEMPERATURE 63° F. | |||||
| Contact Period. | Water “A” Colour 3 Available Chlorine p.p.m. |
Water “B” Colour 40 Available Chlorine p.p.m. |
|||
| 0.2 | 0.2 | 0.4 | 0.5 | ||
| Nil | 194 | 194 | 194 | 194 | |
| 5 | minutes | 121 | 165 | 129 | 66 |
| 1 | hour | 7 | 95 | 20 | 1 |
| 5 | hours | 0 | 4 | 0 | 0 |
| 24 | hours | 0 | 1 | 1 | 0 |
| 48 | hours | 0 | 0 | 0 | 0 |
| [A] Results are B. coli per 10 c.cms. of water. | |||||
The organic matter found in water may be derived from various substances such as urea, amido compounds, and cellulose; humus bodies derived from soil washings and swamps may also be present. The humus compounds of swamps and muskeg are usually associated with the characteristic colour of the water derived from these sources. The effect of this coloured organic matter upon the chlorine dosage is well illustrated in Table VI. In this experiment B. coli was used as the test organism and the only varying factor was the organic matter. To obtain the same result with a contact period of one hour at 63° F. it was necessary to use about two and one-half times the amount of chlorine[34] with a water containing 40 p.p.m. of colour as with one practically free from colour. It will be noted that water “A,” in which the colour had been reduced to 3 p.p.m. by coagulation with aluminium sulphate, required a greater dosage of chlorine than was necessary for bactericidal action only. This was due to a residual organic content which produced none or but a trace of colour, for although the colour had been reduced by 92 per cent the organic matter, as measured by the oxygen absorbed test, had only been reduced by 70 per cent.
The results obtained by Harrington[6] at Montreal are in the same direction. During the greater part of the year the water is obtained from the St. Lawrence river, which is colourless and low in organic matter; in the spring months the flood waters of the Ottawa, a highly coloured river, enter the intake and necessitated a much higher dosage.
| Source of Supply. | Alka- linity. |
Colour. | Oxygen Absorbed (30 mins.) |
Chlorine Required p.p.m. |
Bacteria per c.cm. |
Per Cent Removed. |
| Ottawa river | 15-20 | 50-70 | 14.0 | 1.50 | 3,000 | over 98 |
| St. Lawrence river | 90-100 | Nil. | 0.30 | 0.30 | 500 | over 99 |
Ellms[7] obtained similar results and reported “that the rate at which sterilisation proceeds varies, in a general way, directly with the concentration of the applied available chlorine and the temperature, and inversely as the amount of easily oxidisable matter present.”
Experience with filter plants shows the same facts, the amount of chlorine required for the sterilisation of a filter effluent being invariably less than that necessary to purify the raw water to the same extent.
The effect of coloured organic matter upon the absorption of chlorine, in the form of hypochlorite, is shown on Diagram I.
DIAGRAM I
EFFECT OF COLOUR ON ABSORPTION OF CHLORINE BY WATER
|
||||||||||||||||||||||||||||||||||||||||||||||||||||||||||||||||||||||||||||||||||||||
[35]The shape of the curve obtained with a colour of 40 p.p.m. somewhat resembled that of a mono-molecular reaction and the results were calculated accordingly. The mathematical expression of this law is dN/dt = KN where N is the concentration of the available chlorine in parts per million. Integrating between t1 and t2 the formula K = log(N1/N2)/(t2 - t1) is obtained. If the compound absorbing the chlorine were simple in character, and the chlorine were present in large excess, the value of K would be constant. In the experiments recorded, K constantly decreases, due to the decreasing concentrations of the reacting substances and the complex nature of the organic matter.
[36]The results show the effect of organic matter on the reduction of the chlorine concentration available for germicidal action and also the importance of avoiding a local excess of chlorine (vide p. 41).
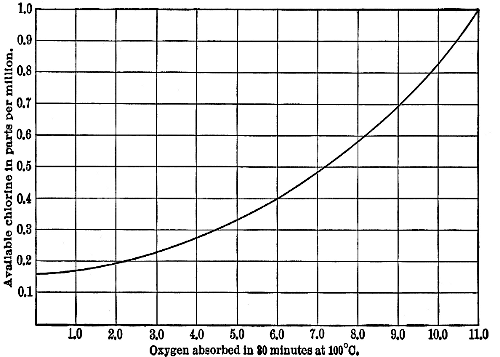
An effort has been made by some observers to find a quantitative relation between the organic matter, expressed as oxygen absorbed in parts per million, and the chlorine required for oxidation, but without definite result. Some of the results obtained are given in Table VII.
| Observer. |
|
|||||||
| Rouquette | 1 | |||||||
| Bonjean | 0 | .5 | ||||||
| Orticoni | Less than 1 | |||||||
| Valeski and Elmanovitsch | 0 | .4 | ||||||
| Race | 0 | .4 | ||||||
| Theoretical | 0 | .22 | ||||||
The value of 0.4 (0.39) obtained by the author is the average of over one hundred determinations covering a period of two years. The experiments of Zaleski and Elmanovitsch were made with the water of the Neva River.
The divergence in the ratios affords additional evidence in favor of reaction (2) mentioned on page 28 and also shows that the chlorinated compounds are less readily oxidized than those from which they are produced. Heise[8] has found that the amount of chlorine consumed is usually proportional to the concentration in which it is added though not necessarily a function of the concentration of the organic matter.
Temperature. The evidence regarding the effect of temperature upon the dosage required is somewhat conflicting. Ellms (vide supra) found that the velocity of the germicidal action varied directly with the temperature and this has also[37] been the author’s experience with laboratory experiments. Typical examples of these are given in Tables VIII and IX.
| Available Chlorine 0.4 Part Per Million | |||
| Contact Period. | Temperature, degrees, Fahrenheit. | ||
| 36 | 70 | 98 | |
| Nil | 424 | 424 | 424 |
| 5 minutes | 320 | 280 | 240 |
| 1.5 hours | 148 | 76 | 12 |
| 4.5 hours | 38 | 14 | 3 |
| 24 hours | 2 | 0 | 0 |
| 48 hours | 2 | 0 | 0 |
| [B] Results are B. coli per 10 c.cms. | |||
| Available Chlorine 0.2 Parts Per Million | ||||
| Contact Period. | Temperature, degrees, Fahrenheit. | |||
| 36 | 70 | 98 | ||
| Nil | 240 | 240 | 240 | |
| 5 | minutes | 240 | 250 | 235 |
| 1 | hour | 245 | 235 | 195 |
| 4 | hours | 215 | 190 | 170 |
| 24 | hours | 143 | 130 | 115 |
| 48 | hours | 130 | 59 | 19 |
| 72 | hours | ... | 28 | ... |
| 96 | hours | ... | 16 | ... |
| 120 | hours | ... | 6 | ... |
| [C] Results are B. coli per 10 c.cms. | ||||
The reaction velocity of a germicide is proportional to the temperature[9] and the influence of temperature may be mathematically expressed by the formula K1/K2 = θ(T2 - T1), in [38]which K1 and K2 are the constants of the reaction at temperatures T2 and T1, respectively, and θ is the temperature coefficient. From the value of θ, the velocity constant of a germicide for any temperature may be calculated from the equation KT = K20° × θ(T - T20°). K1 and K2 are obtained from the formula KT = log(N1/N2)/(t2 - t1) in which N1 - N2 is the number of bacteria destroyed in the interval t2 - t1.
A reduction of temperature also lowers the oxidizing activity of the chlorine so that a greater concentration is available for germicidal action. This is shown by the results plotted in Diagram II.
DIAGRAM II
EFFECT OF TEMPERATURE ON ABSORPTION OF CHLORINE BY WATER
|
||||||||||||||||||||||||||||||||||||||||||||||||||||||||||||||||||||||||||||||||||
Tables VIII and IX, however, show that the temperature coefficient of the germicidal action has a greater effect than[39] the reduction in the amount of chlorine absorbed and removed from the reaction.
The results obtained on the works scale with these waters are very different to the laboratory ones and show that more chlorine is required during the summer season than in winter. The results with bleach and liquid chlorine are in the same direction (vide Diagrams III and IV). The bleach was regulated so as to maintain a constant purity, whilst in the other case the dosage was constant with a varying B. coli content. In Diagram IV the B. coli is plotted; this does not represent all the factors involved as the B. coli content of the treated water is also a function of that of the raw water, but in the example given this factor is of no moment because it was comparatively constant during the period plotted (extreme variation 80 per cent).
The discrepancies between the laboratory and works results cannot be easily explained. The only difference in the conditions is the nature of the containing vessel. Glass is practically inert at all temperatures but the iron pipes, through which the water passed before the samples were taken, may exert an absorptive influence on the chlorine at the higher temperatures experienced during the summer months.
Waters containing organic matter that differs much in quantity from the examples above may yield very different results and no generalisation can be made that will cover all cases. An increase of temperature increases the germicidal velocity and also the rate of absorption of chlorine by the organic matter; other factors determine which of these competitive actions predominates.
Method of Application (admixture). A thorough admixture of the water and chlorine is a sine qua non for successful operation. This should, if possible, be attained by natural means, but if there is any doubt as to the efficiency of the mixing process, mechanical appliances should be utilised. Pumps, especially centrifugal pumps, constitute a very convenient[40] and efficacious method of mixing the germicide and the water, and the solutions should never be injected into the discharge pipes when it is possible to make connections with the suctions.
Inefficient admixture leads to local concentration of the chlorine, a condition which (vide p. 35), results in a wastage of the disinfectant. Two practical examples of this effect may be cited. In one case the water was free from colour and contained very little organic matter. This water was chlorinated at one plant by allowing the bleach solution to drop into one vertical limb of a syphon approximately 6,000 feet long, the other vertical limb being used as a suction well for the pumps which discharged into the distribution mains. At the other plant the bleach solution was injected into the discharge pipe of a reciprocating pump through a pipe perforated with a number of small holes. The results for two typical months are given in Table X.
| Month. | Available Chlorine Parts Per Million. |
Bacteria Per c.cm. | B. Coli Index Per 100 c.cms. |
||||
| Raw Water. | Treated Water. | ||||||
| A. | B. | A. | B. | A. | B. | ||
| July | 0.20 | 0.25 | 864 | 27 | 93 | < 0.2 | 8.5 |
| August | 0.20 | 0.27 | 1.108 | 12 | 120 | < 0.2 | 10.2 |
| A = efficient mixing. B = inefficient mixing. | |||||||
The results with the “B” plant were very irregular. The hypochlorite and water did not mix thoroughly and, as several suctions pipes were situated in the suction shaft, there was no subsequent admixture in the pumps; this also caused complaints regarding taste and odour but the complaints were localised, and not general as would result from an overdose of solution due to irregularities at the plant.
The second example deals with a water containing 40-45 p.p.m. of colour. This supply was taken from the river by[42] low-lift pumps and discharged into a header which was connected with the high-lift pumps by two intake pipes about 5,000 feet in length. During 1914 a baffled storage basin of two hours capacity was constructed and in June the hypochlorite was added at the inlet to this basin by means of a perforated pipe. The object was to increase the contact period prior to the delivery of the water into the header. The results for this month were as follows:
| Available Chlorine 1.88 Parts Per Million | ||||||
| Bacteria Per c.cm. Agar. | B. Coli. Index Per c.cm. | |||||
| 3 Days at 20 C. | 1 day at 37 C. | |||||
| Raw water | 410 | 104 | 0 | .280 | ||
| Treated water | 49 | 26 | 0 | .036 | ||
| Percentage purification | 88 | .2 | 75 | .0 | 87 | .5 |
During August the point of application of the hypochlorite was changed from the inlet of the basin to the suctions of the pumps and the solution proportioned to the amount of water pumped by the starch and iodide test. The average of the daily tests for this month were:
| Available Chlorine 1.55 Parts Per Million | ||||||
| Bacteria Per c.cm. Agar. | B. Coli. Index Per c.cm. | |||||
| 3 Days at 20 C. | 1 day at 37 C. | |||||
| Raw water | 448 | 100 | 0 | .600 | ||
| Treated water | 26 | 12 | 0 | .005 | ||
| Percentage purification | 91 | .9 | 88 | .0 | 99 | .2 |
Here again thorough admixture produced better results than inefficient admixture plus a longer contact period. Langer[10] has also noted the effect of local concentration and found that the disinfecting action is increased by adding the[43] bleach solution in fractions, a cumulative effect replacing that of concentration.
The importance of the admixture factor was not thoroughly appreciated during the earlier periods of chlorination but later installations, and particularly the liquid chlorine ones, have been designed to take full advantage of it.
The point of application in American water-works practice varies considerably (Longley[11]). In 57 per cent of those cases in which it is employed as an adjunct to filtration, it is used in the final treatment; in 26 per cent it is used after coagulation or sedimentation and before filtration; in the remaining 17 per cent it is applied before coagulation and filtration. The report of the committee adds: “The data at hand do not give any reasons for the application before coagulation. In general, an effective disinfection may be secured with a smaller quantity of hypochlorite, if it is applied after rather than before filtration. It should be noted that the storage of chlorinated water in coagulating basins, and its passage through filters, tend to lessen tastes and odors contributed by the treatment and this fact may in some cases account for its use in this way.”
Contact Period. Other things being equal, the efficiency of the treatment will vary directly, within certain limits, with the contact period. When a chlorinated water has to be pumped to the distribution mains directly after treatment, the dosage must be high enough to secure the desired standard of purity within twenty to thirty minutes. The chlorine is sometimes not completely absorbed in this period and may cause complaints as to tastes and odours. The examples given above show that the lack of contact period can be largely compensated by ensuring proper admixture. Experience has amply demonstrated that there is no necessity to use heroic doses for water that is delivered for consumption almost immediately after treatment, and that, with proper supervision, complaints can be almost entirely prevented.
[44]The general effect of the effect of contact period is shown in Tables VIII and IX on page 37. Another example of a coloured water is given in Table XI, whilst Table XII shows the results obtained with a colourless water.
| Contact Period. | Chlorine, Parts Per Million. | ||||
| 0.30 | 0.40 | 0.55 | 1.21 | ||
| Nil | 3,800 | ... | ... | ... | |
| 1 | minute | 1,400 | 120 | 0 | 0 |
| 10 | minutes | 720 | 5 | 0 | 0 |
| 20 | minutes | 35 | 0 | 0 | 0 |
| [D] Results are B. coli per 10 c.cms. | |||||
| Available Chlorine 0.27 Part Per Million | |||||||
| Sampling Point. | Bacteria Per c.cm. |
||||||
| Average of series of samples |
5,000 | ft. | from | pumping | station | 300 | |
| 6,000 | „ | „ | „ | „ | 203 | ||
| 7,000 | „ | „ | „ | „ | 103 | ||
| 12,000 | „ | „ | „ | „ | 86 | ||
| 14,000 | „ | „ | „ | „ | 87 | ||
Table XIII is taken from the work of Wesbrook et al.[4]
| Aug. 8, 1910 | ||||||
| Available Cl. P.p.m. |
Contact Period. (Temp. 22°‑26° C.). | |||||
| 30 Mins. | 1 Hr. 30 Mins. |
3 Hrs. | 6 Hrs. 30 Mins. |
24 Hrs. | ||
| 0 | 230,000 | 200,000 | 160,000 | 150,000 | 140,000 | |
| 0 | .5 | 14,000 | 7,400 | 2,000 | 6,000 | 11,000 |
| 1 | .0 | 20 | 14 | 170 | 450 | 60,000 |
| 1 | .5 | 10 | 6 | 16 | 45 | 70,000 |
| 2 | .0 | 7 | 8 | 10 | 97 | 70,000 |
| 2 | .5 | 7 | 14 | 30 | 116 | 65,000 |
| 3 | .0 | 6 | 12 | 5 | 12 | 16,500 |
| [E] Results are bacteria per c.cm. | ||||||
[45]In Tables VIII, IX, XI, and XII, the bacteria decreased constantly with increase of contact period, but the results in Table XIII show that no advantage was to be gained by prolonging the contact beyond three hours; after this period the bacteria commenced to increase in number and when twenty-four hours had elapsed the number approached the original. This increase in the bacteria is technically known as “aftergrowth” and will be discussed more fully in Chapter IV.
The replies to queries sent out by the Committee on Water Supplies of the American Public Health Association[11] indicate that the contact period after treatment varies considerably in American water-works practice. Forty per cent of the replies indicated no storage after treatment; 18 per cent less than one hour; 9 per cent from one to three hours; 5 per cent three to twelve hours; 11 per cent twelve to twenty-four hours, and 17 per cent a storage of more than twenty-four hours.
Turbidity is usually considered to exert an effect upon the dosage required but no definite evidence has been adduced in support of this hypothesis. Turbidity is generally caused by the presence of very finely divided suspended matter, usually silt or clay, which is inert to hypochlorites. The condition that produces turbidity, however, produces a concomitant increase in the pollution and some of the organisms are embedded in mineral or organic material that prevents access of the chlorine to the organisms which consequently survive treatment. A larger concentration is required to meet these conditions but it is not necessitated by the turbidity per se.
Effect of Light. Light exerts a marked photo-chemical effect on the germicidal velocity of chlorine and hypochlorites. When chlorinated water is passed through closed conduits and basins the effect of light is of course nil but in open conduits and reservoirs this factor is appreciable and reduces the necessary contact period. The effect of light on laboratory[46] experiments made with colourless glass bottles is so marked as to make it impossible to compare the results obtained on different days under different actinic conditions. The following figures illustrate the effect of sunlight:
| Contact Period. | Available Chlorine 0.35 p.p.m. | |||
| Exposed to Bright Sunlight (April) |
Stored in Dark Cupboard. |
|||
| Nil | 215 | 215 | ||
| 30 | minutes | 130 | 145 | |
| 1 | hour | 122 | 136 | |
| 2 | 1⁄2 | hours | 61 | 130 |
| 3 | 1⁄2 | hours | 0 | 32 |
Determination of Dosage Required. The dosage required for the treatment of a water can only be accurately determined by treating samples with various amounts of chlorine and estimating the number of bacteria and B. coli after an interval of time equal to that available in practice. The temperature of the water during the experiment should be the same as that of the water at the time of sampling.
In order to limit the range covered by the experiments the approximate dosage can be ascertained from Diagram V if the amount of oxygen absorbed by the water is known. This diagram is calculated on the amount of available chlorine, present as chlorine or hypochlorite, that will reduce the B. coli content to the U. S. Treasury standard (2 B. coli per 100 c.cms.) in two hours. If the oxygen absorbed values are determined by the four-hour test at 27° C. they should be multiplied by two.
Another method which has been generally adopted for military work during the war, consists in the addition of definite volumes of a standard chlorine solution to several samples of the water and, after a definite interval, testing[47] for the presence of free chlorine by the starch-iodide reaction. The details of the method of Gascard and Laroche, which is used by the French sanitary service, have been given by Comte.[12] One hundred c.cms. of the water to be examined are placed in each of 5 vessels and 1, 2, 3, 4, and 5 drops of dilute Eau de Javelle (1 : 100) are added and the contents stirred. After twenty minutes, 1 c.cm. of potassium iodide-starch reagent (1 gram each of starch, potassium, iodide and crystallized sodium carbonate to 100 c.cms.) is added and the samples again stirred. The lowest dilution showing a definite blue colour is regarded as the dose required, and the number of drops is identical with that required of the undiluted Eau de Javelle for 10 litres of water when the same dropping instrument is used. The actual concentration represented by these dilutions depends necessarily upon the size of the drops and the strength of the undiluted Eau de Javelle, but one drop per 100 c.cms. usually represents approximately 1 p.p.m.
[48]In Horrocks’s method, as used in the British army, a standard bleach solution is added and is almost immediately followed by the zinc iodide-starch reagent. The two methods were compared by Massy,[13] who found that the French method gave an average result of only 0.06 m.gr. per litre (0.06 p.p.m.) higher than the English method. Water in the Gallipoli campaign required from 0.21 to 1.06 p.p.m. as determined by both methods.
Diénert, Director of the Paris Service for investigating drinking water, adds 3 p.p.m. of available chlorine and allows the mixture to stand fifteen minutes after shaking; the residual chlorine is then titrated with thiosulphate. The amount absorbed is increased by 0.5 p.p.m. and in the opinion of Diénert this dosage is correct for a contact period of three hours.
For military camps where a standpipe usually provides a reasonable contact period, it has been found good practice to add sufficient chlorine to give a rich blue colour with the starch-iodide reagent and subsequently reduce the dosage gradually until the water, after standing one hour, gives but a faint reaction to the test reagent. This method should be checked up as soon as possible by bacteriological examinations. An example of this method is given in Table XIV.
| Starch-iodide Reaction After One Hour. |
Bacteria on Agar Per c.cm. | B. Coli Per 100 c.cms. |
|
| 1 Day at 37 C. | 2 Days at 20 C. | ||
| 000⊕⊕ | 40 | 15 | 0 |
| 0000⊕ | 37 | 18 | 8 |
| 00000 | 68 | 268 | 34 |
| 00000 | 115 | 553 | 61 |
| Raw water | 114 | 685 | 89 |
| The number of ⊕ signs indicates the intensity of the reaction. | |||
[1] Nissen. Zeit. f. Hyg., 1890, 8, 62.
[2] Delépine, J. Soc. Chem. Ind., 1911, 29, 1350.
[3] Phelps. Water Supply Paper No. 220, U. S. Geo. Survey.
[4] Wesbrook, Whittaker, and Mohler, J. Amer. Public Health Assoc., 1911, 1, 123.
[5] Lederer and Bachmann. Eng. Rec., 1912, 65, 360.
[6] Harrington. J. Amer. Waterworks Assoc., 1914, 1, 438.
[7] Ellms. Eng. Rec., 1911, 63, 472.
[8] Heise. Philippine Jour. Sci., 1917, 12, A, 17-34.
[9] Norton and Hsu, Jour. Inf. Dis., 1916, 18, 180.
[10] Langer. Zeit. f. Hyg., 1916, 81, 296.
[11] Longley. J. Amer. Public Health Assoc., 1915, 5, 920.
[12] Comte. J. Pharm. Chim., 1916, 14, 261.
[13] Massy. J. Pharm. Chim., 1917, 15, 209.
A disinfectant is usually described as a substance capable of destroying bacteria and other micro-organisms, and an antiseptic as one that restrains or retards their growth or reproduction. This distinction is entirely arbitrary as the ability of a substance to kill organisms or merely inhibit their growth depends upon the concentration employed.
Chlorine and hypochlorites, even in minute doses, exert a toxic effect that is sufficient to produce death in organisms but when still smaller concentrations are employed the toxic effect is transient and the reproductive faculty may be entirely regained.
The enumeration of bacteria by means of solid media depends upon the ability of the organism to reproduce at such a rate as to produce a visible colony within the period of incubation and any substance that prevents the growth of a visible colony is classified as a disinfectant; if on further incubation the bacterial count approximates that of the untreated sample the added substance has acted mainly as an antiseptic. In practice no substance acts entirely as an antiseptic as the organisms present have varying degrees of resistance and the less viable ones are killed by doses that are only antiseptic to the more resistant ones. An example of an antiseptic effect followed by a mild disinfectant action, caused by small doses of bleach is shown in Table XV. In this experiment the water designated as control was from the same source as the treated water. In order to make the bacterial count in this water approximately the same as in the treated water, the original count was reduced by diluting the sample with water from the same source, sterilised by boiling, and afterwards reaërated with sterile air.
| Sample treated with 0.1 part per million of available chlorine. | ||||||||||||||||
| Plated. | Incubation Period, Days. | Ratio of Bacterial Counts. | ||||||||||||||
| Time. | Day. | 2 | 3 | 4 | 5 | 6 | 2 : 4 Days. | 2 : 5 Days. | 2 : 6 Days. | |||||||
| 11 | a.m. | 1 | 520 | 940 | 1,350 | 2,360 | 2,780 | 1 : | 2.6 | 1 : | 4.5 | 1 : | 5.3 | |||
| 12 | noon | 1 | 390 | 770 | 1,080 | 2,040 | 2,320 | 2.8 | 5.2 | 5.8 | ||||||
| 2 | p.m. | 1 | 187 | 260 | 690 | 1,840 | 2,080 | 3.7 | 9.9 | 16.4 | ||||||
| 4 | p.m. | 1 | 91 | 130 | 280 | 760 | 840 | 3.1 | 8.3 | 9.2 | ||||||
| 10 | a.m. | 2 | 42 | 120 | 670 | 920 | ... | 15.9 | 22. | ... | ||||||
| 10 | a.m. | 3 | 320 | 1,210 | 3,500 | ... | ... | 10.9 | ... | ... | ||||||
| 10 | a.m. | 4 | 8,700 | 14,200 | 26,000 | ... | ... | 2.9 | ... | ... | ||||||
| Control. No Chlorine Added | ||||||||||||||||
| Plated. | Incubation Period, Days. | Ratio of Bacterial Counts. | ||||||||||||||
| Time. | Day. | 2 | 3 | 4 | 5 | 6 | 2 : 4 Days. | 2 : 5 Days. | 2 : 6 Days. | |||||||
| 11 | a.m. | 1 | 121 | 184 | 285 | liquid | ... | 1 : | 2.4 | 1 : | ... | ... | ||||
| 12 | noon | 1 | 115 | 171 | 223 | 380 | 392 | 1.9 | 1 : | 3.2 | 1 : | 3.2 | ||||
| 2 | p.m. | 1 | 109 | 152 | 221 | 362 | 375 | 2.0 | 3.3 | 3.4 | ||||||
| 4 | p.m. | 1 | 121 | 175 | 251 | 410 | 415 | 2.1 | 3.4 | 3.4 | ||||||
| 10 | a.m. | 2 | 6,200 | 8,500 | 8,800 | 8,900 | liquid | 1.4 | 1.4 | ... | ||||||
| 10 | a.m. | 3 | 425,000 | 650,000 | 670,000 | liquid | ... | 1.5 | ... | ... | ||||||
| Original Sample. Untreated and Undiluted | ||||||||||||||||
| 11 | a.m. | 1 | 915 | 1,410 | 1,630 | 2,150 | 3,200 | 1 : | 2.2 | 1 : | 2.8 | 1 : | 3.5 | |||
| [A] Results are bacteria per c.cm | ||||||||||||||||
[52]Table XVI shows the effect of a concentration of 1.0 p.p.m. of chlorine; the hypochlorite at this concentration acted almost entirely as a germicide or disinfectant.
| Available Chlorine 1.0 p.p.m. | |||||||
| Plated. | Incubation Period, Days. | ||||||
| Time. | Day. | 2 | 3 | 4 | 5 | 6 | |
| 11 | a.m. | 1 | 2 | 5 | 7 | 8 | 10 |
| 12 | noon | 1 | 1 | 1 | 2 | 2 | 4 |
| 2 | p.m. | 1 | 0 | 0 | 0 | 2 | 2 |
| 4 | p.m. | 1 | 1 | 2 | 2 | 6 | 6 |
| 10 | a.m. | 2 | 0 | 0 | 0 | 1 | .. |
| 10 | a.m. | 3 | 0 | 0 | 0 | .. | .. |
| 10 | a.m. | 4 | 5 | 13 | 16 | .. | .. |
| 10 | a.m. | 5 | 79 | 166 | .. | .. | .. |
| Untreated water | .. | 915 | 1,410 | 1,680 | 2,150 | 3,200 | |
| [B] Results are bacteria per c.cm. | |||||||
Table XV shows a recovery of the anabolic functions after treatment with 0.1 p.p.m. of chlorine but since this was obtained by plating on such a suitable medium as nutrient gelatine, it is probable that reproduction in water having a low organic content would be still further diminished. This is indicated by the results obtained.
There is no evidence of any marked difference in the resistance of ordinary water bacteria to chlorine and these are the first to be affected by the added germicide. The common intestinal organisms are also very susceptible to destruction by chlorine and there is considerable evidence that B. Coli is slightly more susceptible than many of the vegetative forms usually found in water. The specific[53] organisms causing the water-borne diseases, typhoid fever and cholera, are, on the average, not more resistant than B. coli.
The spore-forming bacteria usually found in water are those of the subtilis group, derived largely from soil washings, and B. enteritidis sporogenes, from sewage and manure. The spores of these organisms are very resistant and survive all ordinary concentrations. Wesbrook et al.[1] found that 3 p.p.m. of available chlorine had little effect on a spore-forming bacillus isolated from the Mississippi water and the author has obtained similar results with B. subtilis.
Thomas,[2] during the chlorination of the Bethlehem, Pa., supply, found four organisms that survived a concentration of 2 p.p.m. of available chlorine: Bact. ærophilum, B. cuticularis, and B. subtilis, all spore formers and M. agilis.
In practice no attempt is made, except in special cases, to destroy the spore-bearing organisms as they have no sanitary significance and the concentration of chlorine required for their destruction would cause complaints as to tastes and odours if the excess of chlorine were not removed. Such doses are unnecessary and result in waste of material. It is found that, when the dose is sufficient to eliminate the B. coli group from 25-50 c.cms. of water, the majority of the residual bacteria are of the spore-bearing type. Smeeton[3] has investigated the bacteria surviving in the Croton supply of New York City after treatment with 0.5 p.p.m. of available chlorine as bleach. Table XVII gives the results obtained.
The organisms of the B. subtilis group outnumbered all the others, 66 (62.8 per cent) belonging to this group alone. This group contained B. subtilis—Cohn (36 strains), B. tumescens—Chester (15 strains) B. ruminatus—Chester (13 strains), and B. simplex—Chester 1904, (2 strains). Three of the four coccus forms were classified as M. luteus. No intestinal forms were found.
Clark and De Gage[4] in 1910 directed attention to the[54] fact that the bacterial counts, made at 37° C. on chlorinated samples, were often much greater than the counts obtained at room temperature. “This phenomenon of reversed ratios between counts at the two temperatures,” they stated, “has been occasionally observed with natural water, but a study of the record of many thousands of samples shows that the percentage of such samples is very small, not over 3-5 per cent.... On the other hand 20-25 per cent. of samples treated with calcium hypochlorite show higher counts at body temperature than at room temperature.” Clark and De Gage were unable to state the true significance of this phenomenon but were of the opinion that it was not due to larger percentages of spore-forming bacteria in the treated samples. Other observers, on the contrary, have invariably found the spore-formers to be more resistant to chlorine and thermophylic in type.
| (Smeeton) | ||||||||||||||||||||||||||||||||
| Morphology | Spore Formation |
Gelatine Lique- faction |
Reaction in Litmus Milk |
Indol Produc- tion |
Acid Produc- tion in Glucose |
Reduc- tion of Nitrates |
Inhibi- tion by Gentian Violet |
|||||||||||||||||||||||||
| Bacilli. | Cocci. | Pos. | Neg. | Pos. | Neg. | Pos. | Neg. | Pos. | Neg. | Pos. | Neg. | Pos. | Neg. | Pos. | Neg. | |||||||||||||||||
| No. of strains | 100 | 5 | 89 | 16 | 68 | 37 | 98 | 7 | 75 | 30 | 61 | 44 | 40 | 65 | 98 | 7 | ||||||||||||||||
| Per cent. | 95 | .2 | 4 | .7 | 84 | .7 | 15 | .2 | 64 | .7 | 35 | .2 | 93 | .3 | 6 | .6 | 71 | .4 | 28 | .5 | 58 | 41 | .9 | 38 | 61 | .9 | 93 | .3 | 6 | .6 | ||
The removal of intestinal forms is, of course, merely a relative one and when large quantities of treated water are tested their presence can be detected.
[55]The author, in 1915, made a number of experiments to ascertain whether the B. coli found after chlorination were more resistant to chlorine than the original culture. The strains surviving treatment with comparatively large doses were fished into lactose broth and subjected to a second treatment, the process being repeated several times. The velocity of the germicidal reaction with the strains varied somewhat, but not always in the same direction, and the variations were not greater than were found in control experiments on the original culture. No evidence was obtained that the surviving strains were in any way more resistant to chlorine than the original strain; in considering the results it should be borne in mind that the surviving strains were cultivated twice on media free from chlorine before again being subjected to chlorination.
A number of the strains that survived several treatments were cultivated in lactose broth and the acidity determined quantitatively. All the cultures produced less acid than the original culture, and the average was materially less than the original. These results point to a diminution of the bio-chemical activity by action of the chlorine.
A point of perhaps more scientific interest than practical utility is the relative proportion of the various types of B. coli found before and after treatment with chlorine. The author, in 1914, commenced the differentiation of the types by means of dulcite and saccharose and obtained the results shown in Table XVIII. These figures are calculated from several hundreds of strains.
Although there is a slight difference in the relative proportions of the types found at Ottawa and Baltimore, both sets of results show definitely that there is no difference in the resistance of the various types to chlorination.
Aftergrowths. In Tables XIII (p. 44) and XV (p. 51), it will be noticed that, after the preliminary germicidal action has subsided, a second phase occurs in which there is[56] a rapid growth of organisms. This is usually known as aftergrowth. When the contact period between chlorination and consumption is short, the reaction does not proceed beyond the first phase, but when the treated water is stored in service reservoirs the second phase may ensue. At one purification plant, where the service reservoirs are of large capacity, the aftergrowths amounted to 20,000 bacteria per c.cm. although the water left the purification plant with a bacterial count usually lower than 50 per c.cm.
| Percentage of Organisms. | ||||||||
| B. coli communis |
B. coli communior |
B. lactis aerogenes |
B. acidi lactici |
|||||
| Raw. | Chlori- nated. |
Raw. | Chlori- nated. |
Raw. | Chlori- nated. |
Raw. | Chlori- nated. |
|
| Ottawa, 1914 | 5 | 4 | 40 | 48 | 44 | 36 | 11 | 12 |
| Ottawa, 1915 | 8 | 8 | 50 | 46 | 34 | 31 | 8 | 15 |
| Baltimore, 1913[C] | 11 | 14 | 33 | 25 | 35 | 31 | 21 | 30 |
| [C] Thomas and Sandman.[5] | ||||||||
Regarding the nature of this aftergrowth, there has been a considerable difference of opinion: some regard it as the result of the multiplication of a resistant minority of practically all the species of organisms present in the untreated water; others, that it is partially due to the organisms being merely “slugged” or “doped,” i.e. are in a state of suspended animation, and afterwards resume their anabolic functions; whilst others believe that with the correct dosage of chlorine, only spore-forming organisms escape destruction and that the aftergrowth is the result of these cells again becoming vegetative.
The aftergrowths obtained under the usual working conditions vary according to the dosage of chlorine employed, and none of the above hypotheses alone provides an adequate[57] explanation. When the dosage is small, a small number of active organisms, in addition to the spore bearers, will escape destruction, and others will suffer a reduction of reproductive capacity. The flora of the aftergrowth in this case will only differ from the original flora by the elimination of a majority of the organisms that are most susceptible to the action of chlorine and the weaker members of other species of greater average resistance. As the dose is increased these factors become relatively less important until a stage is reached when only the most resistant cells, the spores, remain. The resultant aftergrowth must necessarily be almost entirely composed of spore-bearing organisms. A small number of the most resistant members of non-sporulating organisms may also be present but they will, in the majority of instances, form a very small minority. This is the condition that usually obtains in practice and it is necessary to consider whether the aftergrowth may have any sanitary significance.
Concerning the secondary development of B. coli, the usual index of pollution, there is but little information. H. E. Jordon[6] reported that, of 201 samples, 21 gave a positive B. coli reaction immediately after treatment, 39 after standing for twenty-four hours, and 42 after forty-eight hours. These increases were confined to the warm months, the cold months actually showing a decrease. The following figures, taken from the author’s routine tests for 1913 and 1914, show a similar tendency, but an analysis of the results by months did not show that this was confined to the warm season. The sequence of the results from left to right, in the following Table, is in the same order as the contact period. Approximately 290 samples were taken at each sampling point.
At station No. 2 the germicidal action was still proceeding but at No. 5, representing an outlying section of the city, the increase in the B. coli content is very apparent.
During 1915 and 1916 the author endeavoured to duplicate[58] these results under laboratory conditions and entirely failed. These experiments, which were made with the same materials as were in use at the city chlorination plant, but in glass containers, were usually only carried to a forty-eight hours contact, as this was the extreme limit for the city mains; one, however, was prolonged to five days. Many experiments were made under varying conditions, with similar results. Typical examples are given in Tables VI, VIII and IX on pages 33 and 37.
| Percentage of Samples Showing B. Coli in 10 c.cms. | |||||
| Sampling Point No. | |||||
| 1 | 2 | 3 | 4 | 5 | |
| 1913 | 15.2 | 14.4 | 16.3 | 16.8 | 26.8 |
| 1914 | 7.0 | 5.7 | 6.0 | .... | 11.6 |
In every case there was persistent diminution in the number of B. coli with increase of contact period. Determination of the bacterial count on nutrient agar showed that, in several experiments, the aftergrowth had commenced, and in some instances there was evidence that the second cycle was partially complete i.e. the number had reached a maximum and then commenced to decline. The time required for the completion of the two cycles, comprising the first reduction caused by the chlorine, the increase or aftergrowth, and the final reduction due to lack of suitable food material, is dependent upon several factors of which the dosage and temperature are the most important. With a small dosage the germicidal period is short and the second phase is quickly reached; with large doses, the second phase is not reached in forty-eight hours; the higher the temperature the quicker is the action and the development of the aftergrowth. These statements refer only to the bacteria capable of development[59] on nutrient agar. The B. coli group behaved differently and persistently diminished in every case. If B. typhosus acts in a similar manner to B. coli, the laboratory experiments show that aftergrowths are of no sanitary significance and can safely be ignored, but as the results obtained in practice are contradictory to the laboratory ones, the matter must be regarded as sub judice until more definite evidence is available.
It is common knowledge that samples of water from “dead ends” of distribution mains show high counts and much larger quantities of B. coli than the water delivered to the mains. This is another phase of aftergrowth problem that often causes complaints and can only be eliminated by “blowing off” the mains frequently or by providing circulation by connecting up the “dead ends.” One extreme case of this description might be cited. A small service was taken off the main at the extreme edge of the city to supply a Musketry School two miles away and was only in use for a few months in the summer season. This service pipe delivered water containing B. coli in a considerable percentage of the 10 c.cm. samples and in a few instances in 1 c.cm., although the water delivered to the city mains never exceeded 2 B. coli per 100 c.cms. and averaged about one-tenth that quantity. No epidemiological records of the effect of this water are available because it was put through a Forbes steriliser before consumption.
In some instances the rate of development of the organisms after chlorination is greater than in the same water stored under similar conditions. This is especially noticeable in the presence of organic matter and has been ascribed to the action of the chlorine on the organic matter with the production of other compounds that are available as food material for the organisms.
Houston, during the treatment of prefiltered water Lincoln in 1905, found that although the removal of B. coli and other organisms growing at 37° C. was satisfactory,[60] there was almost invariably an increase in the bacteria growing on gelatine at 20° C. This was ascribed to the action mentioned above and the chemical results supported this view, more organic matter being found in the filter effluents than in the prefiltered water. Rideal’s experiments with sewage at Guildford indicate that a similar action may occur in contact beds. The addition of bleach to the prefiltered water at Yonkers also resulted in an increased count and in these instances the aftergrowths are due to a disturbance of the equilibrium by the action of the chlorine on the zooglea and other organic matter invariably found in ripe filters. Similar results can be produced by the addition of chlorinated water to small experimental sand filters. This is shown by the results in Tables XX and XXI.
| Available Chlorine in Water p.p.m. |
Bacteria Per Gram of Sand After |
Typical B. coli After 24 Hours. |
Free Chlorine After 24 Hrs. |
|||||
| Without Acidifi- cation. |
After Acidifi cation. |
|||||||
| 3 Hrs. | 24 Hrs. | 100 Gr. | 10 Gr. | 1 Gr. | 0.1 Gr. | |||
| Nil | 12,000 | 21,000 | + | + | + | - | - | - |
| 3.0 | 80 | 114,000 | - | - | - | - | - | - |
| 5.0 | 50 | 150,000 | - | - | - | - | - | - |
| 7.0 | 25 | 214,000 | - | - | - | - | - | - |
| 10.0 | 26 | 500,000 | - | - | - | - | - | - |
| Available in Water p.p.m. |
Bacteria Per Gram of Sand After | ||
| 3 Hours. | 24 Hours. | 48 Hours. | |
| Nil | 70,000 | ..... | ..... |
| 0.1 | 7,200 | 20,400 | 12,800 |
| 0.3 | 5,240 | 6,400 | 11,200 |
| 0.5 | 5,120 | 4,700 | 10,800 |
| 1.0 | 1,100 | 8,800 | 20,400 |
[61] It is observable that the effect of small doses was comparatively small and transient; large doses of bleach reduced the bacteria very materially but the reduction was not maintained and the subsequent increase was abnormally rapid.
[1] Wesbrook, Whittaker and Mohler. J. Amer. Pub. Health Assoc., 1911, 1, 123.
[2] Thomas. Jour. Ind. and Eng. Chem., 1914, 6, 548.
[3] Smeeton. Jour. of Bact., 1917, 2, 358.
[4] Clark and De Gage. Rpt. Mass. B. of H., 1910, p. 319.
[5] Thomas and Sandman. J. Ind. and Eng. Chem., 1914, 6, 638.
[6] Jordan, H. E. Eng. Record, 1915, May 17.
The complaints that have been made against chlorinated water since the practice was commenced have been very diversified in character and can be numbered by the legion and although some have been justifiable, the great majority has been unsubstantiated and must be ascribed to auto-suggestion.
Almost every one who has had charge of chlorination plants has noted the latter phenomenon, for in some instances complaints have been made following the publication of the information that chlorination was to be commenced but antecedent to its actual operation, and in others when for some reason or another, the chlorination plant has been temporarily stopped. Similar observations have been made in laboratory experiments when independent observers have been requested to detect the chlorinated waters from an equal number of treated and untreated waters. Such observers are wrong in the majority of the waters which they designate as treated ones if the dosage is not in excess of that required for satisfactory purification.
One amusing example of auto-suggestion was experienced by the author some years ago. During a ceremonial visit to the waterworks, the Mayor and several civic representatives happened to visit a hypochlorite plant that was built on a pier over the river and which had no ostensible connection with the city mains. One of the party expressed a desire for a drink of good river water without any hypochlorite[63] in it and was served with water from the plant supply by an assistant engineer of the waterworks department. The water was consumed by all with great relish and as it was being finished, the writer entered the plant and was invited to join them in the enjoyment of this “dopeless” water; on asking where it had been obtained he was astonished to hear that it was from a tap which was supplied with the ordinary chlorinated water of the city.
On many occasions, complaints are justifiable and should be carefully investigated instead of, as is often the case, being attributed to auto-suggestion. The time and energy that are often devoted to endeavouring to persuade water consumers that their complaints are without foundation, can better be utilised in so improving the chlorination process as to eliminate tastes and odours. All complaints should be carefully investigated and a record kept for future reference, for the cause, although not manifest at the time, may be discovered later. The records then provide valuable corroborative evidence.
The nature of the complaints against chlorinated water is very diversified and includes imparting foreign tastes and odours, causing colic, killing fish and birds, the extraction of abnormal amounts of tannin from tea, the destruction of plants and flowers, the corrosion of water pipes, and that horses and other animals refuse to drink it.
Tastes and Odours. When an excess of hypochlorite or liquid chlorine is added to a water it imparts a sharp pungent odour and acid taste, characteristic of chlorine, that render it offensive to the nose and palate. In some instances the presence of chlorine compounds is not obtrusive when the temperature of the water is low but becomes so when the temperature is raised. It is especially observable when the faucets of hot water services are first opened and the chlorine is carried off as a vapour by the other gases liberated by the reduction in pressure. For this reason the complaints[64] regarding hot water are relatively more numerous and sometimes constitute the whole of the complaints. In cold water containing appreciable quantities of mineral salts the hypochlorites and hypochlorous acid might not be entirely dissociated; they may become more hydrolysed with an increase in temperature and finally broken down under the influence of the carbonic acid liberated from the bicarbonates by heat.
Chlorine also forms chlorinated organic compounds by action on the organic matter present in water and some of the objectionable tastes and odours of chlorinated waters have been attributed to this agency. Some observers have stated that chloramines were amongst the chloro-organo compounds produced but the author’s experience with the Ottawa supply has demonstrated that simple chloramine (NH2Cl) can be successfully employed for water treatment without causing complaints. It was suggested on page 28 that some of the higher chloro-amines might be the cause of some complaints but at present there is no definite information regarding the formation of these compounds in water and all such hypotheses are little more than conjectures. Letton[1] has reported that at Trenton, in 1911, when the water of the Delaware River was first treated, the dosage was as high as 1.2 p.p.m. of available chlorine and although chemical tests showed the absence of free chlorine, the water had an extremely disagreeable taste which was especially noticeable in the hot water. The conclusion was reached that “the taste and odour were not those of chlorine, but were due to some complex chemical change brought about by the action of the chlorine on the organic matter present in the water.”
The waters that require the most accurate adjustment of chlorine dosage, if complaints are to be avoided, are those containing very small amounts of organic matter. The margin between the dosage required for the attainment of a satisfactory degree of bacteriological purity and that which may cause complaints is usually very small, often less than 25[65] per cent, with the waters of the Great Lakes and many filter effluents. On the other hand, coloured waters containing large amounts of organic matter can be treated with an excess of chlorine without causing tastes and odours. The author found that the addition of 1.5 p.p.m. of available chlorine to the Ottawa River water did not cause complaints although only 0.8 to 0.9 p.p.m. were usually required for satisfactory purification. Harrington of Montreal has had a similar experience with this water.
The presence of traces of foreign substances in water sometimes produces chlorinated derivatives having repugnant tastes and odours. Creosote and tar oils have caused an odour somewhat resembling that of iodoform and industrial wastes have also produced complaints.
The substitution of chlorine gas (liquid chlorine) for bleach solutions has apparently eliminated tastes and odours in some cases but this may be due to a more perfect control over the dosage rather than to any property of the bleach per se.
In some instances the sludge from bleach plants has caused complaints by producing an excessive concentration of chlorine during the period of its discharge. This occurred in Ottawa on several occasions before it was discovered and corrected. When the sludge in the storage tanks reached the discharge valve it was customary to wash out the tank and discharge the sludge into the river. The operators opened the wash out valves to the full extent and the sludge and liquor were discharged into the river about 70 feet away from the inlet to the sedimentation basin and on the downstream side of it. A portion of the hypochlorite was almost invariably carried into the basin and increased the dosage. This condition was remedied by carrying the sludge drain farther down stream and insisting upon the sludge being discharged at a slower rate.
Kienle[2] has reported similar occurrences at Chicago.[66] The hypochlorite was applied at the intake cribs situated a considerable distance off shore. The direction of the wind often necessitated holding the sludge for a considerable length of time but occasionally it was found impossible to await favourable conditions with the result that the wind and wave action carried a portion of the sludge back into the crib and down into the shaft and tunnel.
The temperature of the water at the time of treatment is another factor bearing on the production of tastes and odours. When the temperature is low, water absorbs relatively less chlorine (vide Diagram No. II, page 38) in the same period of time with the consequence that, if the dosage is kept constant, more chlorine is present in the free condition. At Milwaukee (Kienle)[2] with a dosage of 0.24 p.p.m. of available chlorine (as bleach) no complaints were received during the spring, summer, and autumn seasons but when the temperature reached 40° F., they were compelled to reduce the chlorine to 0.12 p.p.m. in order to prevent objectionable tastes and odours in the tap waters.
Abnormal conditions such as freshets, and storms, sometimes cause complaints regarding tastes and odours. Adams[3] found that the complaints in Toronto usually accompanied a change in the direction of the wind, a sustained east wind being the one most productive of trouble. The exact cause for this could not be ascertained but it was usually found that there was an accompanying increase in the number of microscopical organisms (plankton) present in the raw water.
Freshets usually increase the bacterial contamination and necessitate an increased dosage which may cause complaints.
Complaints as to tastes and odours can be best avoided by ensuring regularity of dosage, perfect admixture, and storage of the treated water for a reasonable period. These factors are discussed in detail elsewhere.
Colic. Although claims have been made that the consumption of chlorinated water has produced “colic” no[67] corroborative evidence has been adduced and the symptoms have probably been due to some other cause. Dilute solutions of chlorine have been used as intestinal antiseptics in the treatment of typhoid fever without producing irritation of the mucous lining and the usual dose for this treatment is one grain of chlorine. Before taking a medicinal dose of chlorine 140 gallons of water containing 0.1 p.p.m. would have to be consumed, a quantity greater than is ordinarily drunk in a year.
Chlorine and hypochlorites are destructive and irritant to skin and it is possible that hot chlorinated water has, in some instances, a similar effect.
It is inconceivable that the addition of minute traces of bleach or chlorine to water should cause it to extract abnormal amounts of tannin from tea but it is possible that free chlorine, when present, acts upon the tea extractives and produces compounds having obnoxious tastes and odours. Tannin to the ordinary tea drinker represents the disagreeable portion of the tea and an obnoxious taste in tea brewed with chlorinated water would consequently be ascribed to the extraction of abnormal quantities of tannin.
Almost all waterworks departments using chlorination have received complaints to the effect that the water had killed fish and small birds. There is usually no evidence that the loss was due to chlorinated water but it is generally impossible to convince the owners that the process of water treatment was not the cause. Many continuous physiological tests have been made of the effect of chlorinated water on small fish and have shown that the concentration used in water treatment is without effect. The author kept a tank of minnows in one of the pumping stations for months without loss although the tank was continuously supplied with water that had been treated but a few seconds previously. The bleach solution was discharged into the suction of the pumps and the water for the fish test was taken from the discharge header.
[68]It has been found on many occasions that fish are extremely susceptible to chlorine and hypochlorites. This knowledge has been sometimes used for such nefarious purposes as fish poaching, a few pounds of bleach in a small stream being a simple and most effective method of killing all the fish which are then carried down stream into a convenient net. Chlorinated sewage effluents have also been known to destroy the fish life of the stream into which they were discharged.
The opinion of fish culturists as to the action of chlorinated waters upon fish eggs in hatcheries is almost unanimously to the effect that it is a destructive one. Fish eggs are extremely sensitive to chlorine and hypochlorous acid and very few will survive in a water containing 0.1 p.p.m. of free chlorine. The Department of Fisheries of the Dominion of Canada has informed the author that free chlorine in the water had a marked adverse effect on the hatching of the eggs of Atlantic salmon, Great Lake trout, pickerel, and whitefish, but no effect was noticed when free chlorine was absent. The Department has, however, decided to remove all the hatcheries to localities where water that does not require chlorination can be obtained.
The effect of chlorinated water upon seeds, plants, and flowers has been investigated by the Dominion Department of Agriculture and Dr. Gussow (Dominion Botanist) and Dr. Shutt (Agricultural Chemist) who were in charge of the work, have reported that water treated with hypochlorite caused no apparent injury to carnations and hybrid roses. Six varieties of wheat seed, after soaking in freshly prepared hypochlorite solutions (0.05 to 10 parts per million of available chlorine) were all sown on the same day. Germination was found to be uniform throughout and no effect of the chlorine was observed either as regards the rate of germination or the development of the young plants. Experiments on barley and oats produced similar results. Radishes,[69] turnips, cucumbers, and beans also showed no retardation in development after treatment with chlorinated water.
These experiments were conducted with solutions of bleach in distilled water, but identical results were obtained in a later series when the treated city supply (Ottawa) was used.
The results proved conclusively that statements alleging damage to plants, flowers, and seeds by the hypochlorite treatment of water are unfounded and do not merit the slightest consideration.
Corrosion of Pipes. Chlorinated water, it has been alleged on many occasions, causes rapid corrosion of galvanised iron water services and especially of the water tubes of boilers, water heaters, etc. When bleach is used for water treatment, a slight increase in the hardness is produced but as this is mostly due to calcium chloride, there is no corresponding increase in the salts that form a protective coating. The presence of traces of calcium chloride and chloro-organic compounds might tend to increase the corrosive properties of a water but this increase is probably so small as to be negligible.
If pipe corrosion is considered by the carbonic acid hypothesis, the use of bleach should tend to reduce it because bleach contains an excess of base that combines with a portion of the free carbonic acid. The results of routine tests for free carbonic acid made on the raw and treated waters at Ottawa are as follows:
| Year. | Carbonic Acid. Parts per Million |
Nature of Treatment. | |
| Raw Water. | Chlorinated Water. |
||
| 1915 | 1.44 | 1.41 | Bleach |
| 1916 | 0.92 | 0.85 | Bleach |
| 1917 | 0.84 | 0.81 | Bleach first four months Chloramine during last eight months |
[70]These figures shown that the hypochlorite treatment produced a small but definite decrease in the carbonic acid content and should, cæteris paribus, tend to reduce and not increase corrosion.
If the corrosion of pipes is considered according to the electrolytic theory, a slight increase, due to an increased electrical conductivity, might be anticipated. The effect of the addition of hypochlorite upon the electrical conductivity of distilled water and the Ottawa River water is shown in Diagram VI.
With the concentrations of hypochlorite ordinarily used in water treatment it is inconceivable that the slight increase in the electrical conductivity has any practical significance at low temperatures. The conductivity increases rapidly,[71] however, with increase of temperature and any increment due to chlorination might produce a slight appreciable effect at temperatures approaching the boiling-point of water.
Liquid chlorine does not increase the conductivity to the same extent as an equivalent quantity of hypochlorite but it increases the carbonic acid content in proportion to the dosage used.
The author investigated the action of hypochlorite on galvanised pipes in 1914 and was unable to detect any definite corrosion with normal concentrations of chlorine. The experiments were made with 2-inch pipes and an examination of the first consignment received showed that, although the galvanising on the outside was perfect, the inner coat was very inferior: in some parts there was an excess of zinc that broke away on scraping whilst in others the iron pipe was bare.
A committee of the Pittsburg Board of Trade, appointed to investigate complaints as to pipe corrosion, reported in 1917 that they were largely due to inferior qualities of pipes and not to the method of water purification employed (slow sand filtration and chlorination).
The effect of chlorination on the plumbo-solvency of water was investigated in 1904 by Houston who found that chlorine, as chloros, in amounts between one and ten parts per million, did not appreciably increase the plumbo-solvent action of either unfiltered or filtered water. Similar results were obtained by the author with the Toronto supply: raw lake water, filtered water, and water treated with 0.25 and 0.50 p.p.m. of chlorine, all dissolved the same quantity of lead in twenty-four hours. The amount in each case was too small to be of any significance.
[1] Letton. J. Amer. Waterworks Assoc., 1915, 2, 688.
[2] Kienle. J. Amer. Waterworks Assoc., 1915, 2, 690.
[3] Adams. J. Amer. Pub. Health Assoc., 1916, 6, 867.
The treatment of water with bleach alone has been largely supplanted by the liquid chlorine process but the following details will be of use on meeting conditions for which liquid chlorine cannot be used and also for the preparation of the hypochlorite solution required in the chloramine process.
The essential features of a bleach installation are the solution or mixing tanks, storage tanks, piping system, discharge orifice or weir, and sludge drain.
Bleach is usually sent out by the manufacturers in sheet steel drums, 39 inches high and 291⁄2 inches in diameter, which contain about 14 cu. ft. of bleach and weigh approximately 750 pounds gross and 690 pounds net. It can be most economically purchased in car lots and if the consumption warrants this procedure storage should be provided for about 70 drums or rather more than one car load. According to Hooker[1] bleach loses 1 per cent of available chlorine per month in hot seasons and 0.3 per cent in cold ones so that it is advisable to carry as little stock as possible during hot weather. Hot weather also causes a further loss by accelerating the action of the bleach on the drum which rapidly disintegrates and cannot be handled. Bleach can often be purchased more cheaply in hot weather but such a policy is a short sighted one unless it is required for immediate use.
The general design of a hypochlorite plant is largely determined by the capacity but in all cases an effort should be made to avoid complicated details which may appear advantageous[73] in the drafting office but do not stand up in actual practice. Many metals rapidly develop a protective coating on immersion in bleach solution but if this is removed by friction, rapid erosion ensues; bearing metallic surfaces should be reduced to a minimum.
Mixing Tanks. All tanks, whether mixing or storage, should be constructed of concrete and painted with two coats of asphalt. Experience has shown that wooden tanks are not suitable. The author has used pine, oak, and cypress tanks but all were rapidly leached by the hypochlorite and ultimately had to be lined with concrete.
There is a considerable variation in the concentration of bleach solution made in mixing tanks at various works. Some operators use about one gallon of water per pound of bleach and mix the two to a cream by wooden paddles, revolving on a central axis, for 1-2 hours; the paddles are then stopped and the cream run out into the storage tanks and diluted to the required strength by passing water through the mixing tank. There are two objections to this method: (1) the addition of small quantities of water to bleach tends to gelatinisation which may protect lumps from the further action of water and (2) a stratification of the solution occurs in the storage tank unless agitation is used. Gelatinisation causes loss of available chlorine and stratification causes irregular dosage unless corrected by agitation, which necessitates power. Other operators mix the bleach and water to the final concentration in the mixing tank and discharge the contents into the storage tank, the intermittent process being repeated until the storage tank is full. Gelatinisation is avoided by using a low original concentration and as all batches are of equal density no stratification is produced.
At Ottawa the bleach is crushed and, after weighing, dumped into a circular concrete tank provided with a hinged wooden lid. The stirring arrangement consists of a bronze shaft on which an aluminium impeller is fixed which revolves[74] in an iron tube set slightly above the bottom of the tank (see Fig. 1). After the requisite amount of water has been added the motor connected to the bronze shaft is started and the mixture pumped for 15-20 minutes; without waiting for the sludge to settle the contents are discharged into the storage tank and the operation repeated until the tank is full. The piping between the mixing and storage tanks is of galvanised iron of generous dimension so as to compensate for incrustation. The pipes are straight and are provided with crosses at every change of direction to enable excessive incrustation to be removed. The valves should be made of hard rubber or special bronze; if brass valves are used they will probably require renewing every twelve months.
The concentration of solution necessarily depends upon local conditions but it is usually advisable to keep it below 2.5 per cent of bleach, which is equivalent to 0.85 per cent of available chlorine.
[75]Storage Tanks. These should be built of reinforced concrete and painted inside with asphalt, which should be periodically renewed to prevent the solution seeping through to the reinforcement. At least two tanks should be provided so that one may be filled and allowed to settle before being put in operation. The hypochlorite discharge pipe is usually 6-9 inches from the bottom to permit the collection of sludge, which is run off when it reaches the elevation of the hypochlorite discharge. The sludge drain, which opens into the bottom of the tank, is usually a 4- or 6-inch cast-iron pipe, with suitable gate valve, which discharges into a common drain made of clay pipe.
The storage tanks should be provided with either glass gauges or float indicators to enable the orifice discharge to be checked up at periodical intervals.
Regulation of Dosage. The discharge of the hypochlorite solution is usually regulated either by maintaining a constant head on an orifice of variable dimension or by varying the head on an orifice of fixed dimension. The weir principle may also be used but it is not so well adapted for hypochlorite as for other chemicals.
In the constant head method, the head is maintained by a bronze valve connected to a float made of glass or tinned copper. In many cases the orifice is a rectangular slot in a brass plate and is adjusted by means of a brass slide operated by a micrometer screw. Brass plates are not very suitable as they become corroded and so reduce the size of the orifice; if the incrustation is removed the orifice will discharge more than the calibration indicates. Needle valves are unsuitable for similar reasons.
An example of an orifice feed box of the constant head type is shown in Fig. 2. A vertically arranged hard-rubber pipe passes though a hard rubber stuffing box in the bottom of the tank and has one or more orifices near its upper end. The area of the submerged portions of the orifices is controlled[76] by the hand wheel which is connected with the threaded stem of the pipe. The stem has sixteen threads per inch, and one revolution of the wheel will submerge the orifices one-sixteenth of an inch. The extent to which the orifices are submerged is indicated on the dial fixed to the side of the tank.
Fig. 3 shows the regulating mechanism of another apparatus of the constant head type. The orifice consists of a circular slot in a hard rubber disc and is regulated by means of a hand wheel which operates a hard rubber slide.
The general arrangement of one of the variable head types is shown in Fig. 4. A constant head is maintained on the valve V by a float and cock operating in a lead- or porcelain-lined tank. The circular tapered orifice O, cut in glass, is situated in the flanged end of the iron casting C and the head, indicated on the gauge glass, is regulated by valve V. This arrangement is simple and reasonably accurate. The[77] orifice may show slight incrustation after being in service for some time but it can be easily cleaned by means of a test-tube brush or a small swab moistened with acid; a wire or rod tends to break the edge of the conical orifice and should not be used.
The volume of solution discharged by orifices of various dimensions is shown in Diagram XV, page 149. Diagram XVI, page 149, facilitates the calculation of the number of pounds of bleach required for any dosage.
The solution discharged from the orifice box is carried to the point of application either in galvanised iron pipes of generous dimension or in rubber hose. Pumps may be used for raising the solution to a higher elevation but unless special material is used in their construction they corrode rapidly and cannot be kept in service. Whenever possible, a water injector should be used as it does not corrode and assists in maintaining the delivery pipes free from sludge. All delivery pipes should be duplicated and blown out regularly by water under pressure; they should also be protected from frost.
The adjustment of the hypochlorite dosage can be automatically regulated in plants where the flow of the water to be treated is measured by a Venturi meter or other suitable[78] appliance. Various devices have been suggested and used but, in general, they are not so successful as automatic regulators for liquid chlorine on account of the presence of sludge particles which tend to diminish the area of the orifice.
For small plants, barrels have often been used as solution and storage vessels with, in some instances, fairly successful results. The bleach process, however, cannot be recommended for small installations because the chemical control necessary for successful operation is usually not available. One drum of bleach may suffice for several months operation and as the powder gradually loses strength, the dosage constantly diminishes and may jeopardise the safety of the supply. Liquid chlorine machines are much more suitable than hypochlorite installations for supplies having no chemical control.
Bleach is being very extensively used for the sterilisation of the water used by the allied troops in France. The water supplies on the British front are all more or less subject to pollution and it is consequently necessary, to ensure adequate protection, to chlorinate all supplies with bleach. Other forms of chlorine have been tried but have not proved successful near the firing lines. The details of the technique employed cannot be given but it may be stated that the concentration of chlorine employed is always more than sufficient and that residual tastes and odours are regarded as secondary considerations. Treated water is always tested by the starch-iodide method and a bacteriological examination is frequently made by mobile laboratories.
Control of Hypochlorite Plants. If efficient operation and regular dosage is to be obtained, it is necessary that hypochlorite plants should be controlled by a trained chemist. Good results are occasionally obtained without such control but in every plant circumstances arise at some period or another which only a chemist is qualified to deal with.
The points that require consideration are (1) the composition of the bleach; (2) concentration of available chlorine[79] in the prepared solutions; and (3) chemical tests for free chlorine in the treated water.
(1) Composition of Bleach. Each drum of bleach should be sampled and analysed before use. The sample is obtained by cutting out the head of the drum and removing a vertical section by means of a special sampling tube or a piece of half-inch iron pipe which is forced to the bottom of the drum with a boring motion and then removed; the core is then forced out by means of a rod, mixed, and quartered down to the required size.
For analysis weigh out 5 grms. on a balance sensitive to 0.01 grm. and grind in a mortar with 50-70 c.cms. of water; wash into a 250 c.cm. flask and make the volume up to 250 c.cms.; shake. After allowing the sludge to settle remove 10 c.cms. by means of a pipette and titrate by one of the following methods:
Bunsen’s Method. Add 10 c.cms. of a 5 per cent solution of potassium iodide and 0.5 c.cm. glacial acetic acid and titrate with sodium thiosulphate (24.8 grms. of the C.P. crystalline salt and 1 c.cm. of chloroform per litre) using a starch solution as indicator. Each cubic centimetre of thiosulphate used = 1.755 per cent of available chlorine (1 c.cm. N/10 sodium thiosulphate = 0.00355 grm. available chlorine).
Penot’s Method. Dilute the hypochlorite solution with 15 c.cms. of water and titrate with a solution of N/10 sodium arsenite using starch-iodide paper as an external indicator. Each c.cm. of solution used = 1.755 per cent of available chlorine (1 c.cm. = 0.00355 grm. available chlorine). The use of an external indicator makes this process a slow one and to overcome this objection Mohr proposed the addition of an excess of sodium arsenite solution and then titrating with N/10 iodine solution after adding a few drops of starch solution.
Griffen and Hedallen[2] compared these three methods and found that Penot’s method and Mohr’s modification of[80] that method gave results which were 0.6 per cent lower than those obtained by Bunsen’s method.
For a separate estimation of the chlorine present as chloride, chlorate, and hypochlorite the method given in Sutton’s Volumetric Analysis, 10th edition, page 178, should be followed.
Storage Liquor. This is tested by any of the above methods. It has been proposed to determine the strength of the bleach solution by the use of a hydrometer but the results are not sufficiently accurate and the method cannot be recommended.
If bleach is properly broken up and thoroughly agitated in the mixing tank at least 95 per cent of the available chlorine should be extracted. The efficiency of the extraction process is checked by comparing the tests of the storage liquor with those of the dry bleach and each batch of liquor should be tested daily. It is sometimes advisable to take two samples from each tank, one soon after a tank has been put into operation, and a second sample at the end of the run. Considerable differences are occasionally found between these samples and are due, either to inadequate agitation of the liquor in the storage tank, or inefficient mixing in the mixing tank. If the results are irregular the former is the more probable cause but if the second sample is invariably stronger the mixing tank operations should be investigated. The increased concentration of the second sample is due to unextracted bleach passing out of the mixing tank and gradually becoming leached as the tank contents are run off. If the bleach is lumpy and is not subsequently broken up, losses are almost inevitable.
Hale[3] found that during the period when the New York City supply was being treated with bleach it was necessary to constantly check the operations of the labourers by frequent samples. “During one week about 95 per cent of the chlorine added was actually applied, the second week it dropped to[81] 85 per cent. and the third week to 75 per cent. Whenever a poor run is called to the attention of the labourers, results improve.”
By taking two samples daily from each tank discharged the author has been able to obtain an average annual efficiency on the Ottawa plant of 94 per cent., i.e. the solutions contained 94 per cent. of the available chlorine contained in the bleach. In making such checks it is necessary to keep a careful account of the stock of bleach to prevent labourers adding a few extra pounds of bleach to compensate for losses.
Sludge forms an appreciable but unavoidable source of loss of material. When the sludge reaches the outlet of the hypochlorite pipe the sludge must be run to waste; otherwise it will pass over and tend to choke the dosage control apparatus. If the sludge is run into the same body of water that forms the source of supply, it must be discharged very slowly to prevent a possibility of over dosage and damage to fish life. With proper control, sludge losses can easily be kept under 2 per cent. and often under 1 per cent.
The greatest source of unavoidable loss in hypochlorite plants is from deterioration of the bleach during storage; in warm climates this loss may exceed 10 per cent. In Ottawa where high temperatures are only experienced during the summer months the loss from this cause has averaged from 7-8 per cent. on the bleach stored during that period.
Detection and Estimation of Free Chlorine. The oldest and probably the best known test for free chlorine in water is the Wagner test, made by adding a few drops of potassium iodide and starch; the presence of chlorine is indicated by a deep rich blue colouration that is proportional in intensity to the quantity of chlorine present. When this test is used as a colorimetric method for the estimation of chlorine several difficulties are encountered; the intensity of the colour produced by the majority of treated waters gradually diminishes and the loss is usually more rapid than in the standards[82] made up with distilled water; a different result is obtained if the solutions are acidified and the results vary with different acids, acetic acid yielding a much lower result than a mineral acid such as hydrochloric acid; in the presence of acid the colouration usually intensifies on standing, whereas the standard intensifies but little. The difference caused by the addition of acid is imperfectly understood but it is obvious that the chlorine set free by the acid cannot be present in the “free” state; it is probably in a semi-labile condition loosely attached to organic compounds. Whether this semi-labile chlorine is available for germicidal action is at present not definitely known but it has been noted by several observers that the germicidal action proceeds after the “free” chlorine reaction has disappeared.
The method used by the author for the estimation of free chlorine is as follows: place 500 c.cms. of the sample in a stoppered bottle, add 1 c.cm. of 5 per cent KI solution, 2 drops of conc. HCl and 1 c.cm. of starch solution and titrate with N/1000 sodium thiosulphate until colourless. The difficulty introduced by the opalescence of the liquid is overcome by pouring portions of the liquid into two Nessler tubes and adding a drop of thiosulphate solution to one and noting if any reduction of colour occurs on shaking; if the intensity of the colour is diminished, the contents of both tubes are poured back into the bottle and titrated until no further colour removal, as shown by the tubes, can be obtained. One c.cm. of N/1000 sodium thiosulphate = 0.07 p.p.m. of available chlorine when 500 c.cms. of water are used.
Adams[4] has employed the colorimetric method of estimating the colour obtained after the addition of dilute H2SO4, KI, and starch but used standard solutions of dyes for comparison. The standards were prepared from mixtures of Brilliant Mill Green “S” and Cardinal Red “J” and were made up weekly.
Phelps found that ortho-tolidine in acetic acid solution[83] produced an intense yellow colouration with free chlorine and suggested the use of this reagent as a qualitative test for chlorine. Ellms and Hauser[5] developed this process into a quantitative one and substituted hydrochloric acid for acetic acid as a solvent. One c.cm. of the reagent (1 gram of pure o-tolidine dissolved in 1 litre of 10 per cent of hydrochloric acid) is added to 100 c.cms. of the sample in a Nessler tube and the colour compared after five minutes with permanent standards made up with mixtures of potassium bichromate and copper sulphate. This method was adopted as the official standard method of the American Public Health Association; the details are given in the Appendix (p. 147).
The author has found that this method gives excellent results except for coloured waters. The colouring matter in many waters diminishes in intensity on the addition of acids and is somewhat similar in tint to that produced by addition of o-tolidine. If the reaction is used qualitatively on coloured treated water and a comparison made with the untreated sample, a negative result, due to the reduction in colour produced by the acid being greater than the increase caused by the reagent, might be obtained when traces of free chlorine are present. Similar difficulties are encountered when quantitative comparisons are made against permanent standards.
Benzidine (Wallis[6]) has also been suggested for the detection of free chlorine. On adding this reagent a blue colouration is produced but on stirring it rapidly changes to a bright yellow which is proportional in intensity to the amount of free chlorine present. Ellms and Hauser[5] investigated benzidine in 1913 and found it to be inferior to o-tolidine as a test reagent for free chlorine.
LeRoy[7] has proposed the use of hexamethyltripara-aminotriphenylmethane for detecting and estimating free chlorine. On the addition of a hydrochloric acid solution of this compound to a sample containing free chlorine a[84] violet colouration is produced that can be matched in the usual way with standards. It is stated that 0.03 p.p.m. of free chlorine gives a distinct colouration and that the reagent reacts very slowly with nitrites and is quite unaffected by hydrogen peroxide.
The starch-iodide and o-tolidine reactions are affected by oxidising agents or reducible substances; nitrites and ferric salts are the compounds that are most likely to interfere and Ellms and Hauser[5] have found that these bodies do not affect the o-tolidine reaction to the same extent as the starch-iodide reaction. Very small quantities of nitrites (0.03 p.p.m. of N) and ferric salts (0.2 p.p.m. Fe) give a blue colouration with the starch-iodide reagent and for this reason it is always advisable, whenever possible, to make a control test on the untreated water. Nitrites are oxidised by free chlorine and consequently do not interfere with the estimation of it by the thiosulphate method; the influence of ferric salts can be overcome by substituting 3 c.cms. of 25 per cent phosphoric acid for hydrochloric acid (Winkler[8]).
An electrical instrument called a “chlorometer” has been devised by E. K. Rideal and Evans[9] for the estimation of free chlorine. The diagrammatic sketch, reproduced in Fig. 5, shows the general construction of the apparatus. When water containing no free chlorine passes through the copper tube, hydrogen is liberated on the platinum rod by the electrolytic solution pressure of the copper and an electric current is generated; a polarizing action follows and the flow of current ceases. When free chlorine is present it combines with the hydrogen as produced and so enables more copper to dissolve and produces a permanent flow of current. The current produced is a function of the depolarizing action, i.e. of the free chlorine, and is indicated by the current meter which is graduated in parts per million of available chlorine. The usual range of instrument is 5 p.p.m. and each division of the scale is equal to one-tenth of one part per million.
[85]Only strong oxidisers, such as chlorine, ozone, and permanganates, which have a great affinity for hydrogen, are able to produce a permanent current; ferric chloride and other weak oxidisers do not affect the indicator.
Cost of Construction. According to the replies received by the Committee on Water Supplies of the American Public Health Association[10] the total cost of equipment for disinfection varies widely and bears no apparent relation to the capacity of the equipment. This is due to the temporary nature of the plants erected in many cities and the necessity of erecting expensive structures in others. The cost of construction varies also in different localities. The cost of equipping hypochlorite plants with standard concrete tanks and dosage regulators would be more uniform and for capacities between 10 and 50 million gallons per day would approximate $15 to $50 per million gallons.
[86]The operating cost of bleach plants shows similar wide variations. In some cases the labour required for mixing and supervision can be obtained without extra cost whilst in others the labour charge exceeds the cost of hypochlorite.
The price of bleach has shown violent fluctuations during the last three years (see Diagram IX, page 125) but is now (1918) comparatively steady at $2.25 to $2.75 per 100 pounds. Assuming that 33.3 per cent of available chlorine can be extracted, each pound of chlorine costs 6.75-7.25 cents as compared with 15-25 cents for liquid chlorine. The fixed charges on the capital expenditures together with the labour and incidental charges almost invariably make the total cost of operation of a straight bleach plant higher than that of a liquid chlorine plant. The tendency during the last four years has been to substitute liquid chlorine for hypochlorite and the majority of the plants are now of the former type.
Substances used for the removal of excess chlorine are usually known as “antichlors” and those that have been most frequently employed are sodium bisulphite, NaHSO3, and sodium thiosulphate Na2S2O3. The reactions with chlorine are:
| (i) | NaHSO3 + Cl2 + H2O = NaHSO4 + 2HCl. |
| (ii) | Na2S2O3 + Cl2 = Na2S4O6 + 2NaCl. |
Sodium bisulphite is a very efficient “antichlor,” only 1.46 parts being required to remove 1 part of chlorine, but owing to its instability the action is uncertain. Sodium thiosulphate is a comparatively stable cheap salt, containing 5 molecules of water of crystallization, Na2S2O3·5H2O but 7 parts are necessary to remove 1 part by weight of chlorine.
“Antichlors” are used as aqueous solutions and the dosage controlled in the same manner as for bleach solutions.[87] The action is an instantaneous one and it is consequently necessary that the germicidal action should be complete before the “antichlor” is added.
Filters, containing solid materials capable of absorbing free chlorine, have also been used for removing the excess of the germicidal reagent. Iron borings and aluminium were used experimentally by Thresh[11] but the process was not commercially developed. The “De Chlor” filter, in which carbon is the active substance, has been installed at several water works in England (Reading, Exeter, Aldershot) with apparently successful results. The Reading experimental installation, described by Walker,[12] consisted of a steel drum, 8 feet 3 inches in width, the top and bottom being domed. In the upper portion, 10 feet 9 inches in depth, provision was made for thorough admixture of the bleach solution and water and a subsequent storage of thirty minutes. The lower section of the filter was divided into three compartments, the first and last of which contained graded silica; the middle compartment was filled with a layer (20 inches deep) of specially prepared granulated charcoal or carbon.
The filter was operated under pressure and passed an average of 192,000 Imp. gallons per day, the rate being 32,000 Imp. gallons per square yard per day.
Water from the pre-filters (polarite and sand) was treated with bleach to give a concentration of 1 p.p.m. of available chlorine and passed through the De Chlor filter. The average bacteriological results obtained during the first six months operation were as follows:
| Bacteria Per c.cm. Gelatine 3 Days at 20° C. |
B. coli Index Per 100 c.cms. |
|
| Raw river water | 6,775 | 600 |
| Water from pre-filters | 579 | 119 |
| Water from De Chlor filter | 33 | Nil |
Free chlorine could not be detected by chemical tests in the filtered water which was also free from abnormal[88] tastes and odours. It is stated that the carbon has to be removed and revivified periodically. The filter was washed about once per week, the wash water being only one-tenth of one per cent.
The experimental filter was operated for nearly two years before being removed to permit the erection of larger units having a total capacity of one million Imp. gallons per day.
[1] Hooker. Chloride of Lime in Sanitation, New York, 1913.
[2] Griffen and Hedallen. J. Soc. Chem. Ind., 1915, 34, 530.
[3] Hale. Proc. N. J. San. Assoc., 1914.
[4] Adams. J. Amer. Pub. Health Assoc., 1916, 6, 867.
[5] Ellms and Hauser. J. Ind. and Eng. Chem., 1913, 5, 915 and 1030; ibid., 1914, 6, 553.
[6] Wallis. Ind. Jour. Med. Res., 1917, 4, 797.
[7] Le Roy. Comptes rend., 1916, 163, 226.
[8] Winkler. Zeit. angew. Chem., 1915, 28, 22.
[9] Rideal, E. K. and Evans. Analyst, 1913, 38, 353.
[10] J. Amer. Pub. Health Assoc. 1915, 5, 921.
[11] Thresh. Internat. Congress Appl. Chem., 1908.
[12] Walker. Jour. Roy. Inst. Pub. Health, Jan., 1911.
The use of liquefied chlorine for the disinfection of water was first proposed by Lieutenant Nesfield[1] of the Indian Medical Service. He stated that: “It occurred to me that chlorine gas might be found satisfactory ... if suitable means could be found for using it.... The next important question was how to render the gas portable. This might be accomplished in two ways: By liquefying it, and storing it in lead-lined iron vessels, having a jet with a very fine capillary canal, and fitted with a tap or a screw cap. The tap is turned on, and the cylinder placed in the amount of water required. The chlorine bubbles out, and in ten to fifteen minutes the water is absolutely safe, and has only to be rendered tasteless by the addition of sodium sulphite made into a cake or tablet.... The cylinders could, of course, be refilled. This method would be of use on a large scale, as for service water carts.”
The first practical demonstration of the possibilities of this method was made by Major Darnall[2] of the Medical Corps, United States Army, in 1910. Chlorine was taken from steel cylinders and passed through automatic reducing valves which provided a uniform flow of gas for the water requiring treatment. A uniform flow of water was maintained through the mixing pipe and so secured a uniform dosage. This apparatus might be considered as the forerunner of the various commercial types of machines that were[90] developed later and which are being so extensively used at the present time.
A working model, having a capacity of 500 gallons per hour, was erected at Fort Myer, Va., and was operated on water that had been treated with alum but had received no further purification. Despite the presence of the flocculated organic matter, satisfactory purification was obtained with 0.5 to 1.0 p.p.m. of available chlorine and no taste or odour was imparted to the supply.
From the results obtained at Fort Myer, and Washington, D.C., Darnall concluded that “In general, it may be said that with an average unfiltered river water such as that of the Potomac, about one-half of one part (by weight) of chlorine gas per million of water will be required. For clear lake waters three-tenths to four-tenths of a part per million will be sufficient.”
A Board of Officers of the War Department examined the results and reported (June, 1911) “That the apparatus is as efficient as purification by ozone or hypochlorite and is more reliable in operation than either.... That it could be installed at a very low cost and that the cost of operation would be very slight.”
In June, 1912, Ornstein experimented with chlorine gas, obtained from the liquefied gas in cylinders, for sewage and water disinfection but his method differed from Darnall’s in first dissolving the gas in water and feeding the solution to the liquid to be treated.
Kienle[3] made experiments at Wilmington, Del., in November, 1912, and obtained a constant flow of gas by means of high- and low-pressure valves; the gas was dissolved in water in an absorption tower and afterwards fed to the water to be treated.
Van Loan and Thomas of Philadelphia experimented with liquid chlorine on a large scale at the Belmont Filter Plant in September, 1912. The chlorine was fed into the[91] filtered water basin in the gaseous state and the quantity was regulated by the loss in weight of the containers. The dosage was approximately 0.14 p.p.m. (West[4]).
Jackson, of Brooklyn, made similar experiments about the same time at the Ridgewood Reservoir, Brooklyn, and his type of apparatus was shortly afterwards put on the market as the Leavitt-Jackson Liquid Chlorine Machine. The regulation of the flow in this machine was determined by the loss in weight of the gas cylinder which was suspended from a sensitive scale beam. By moving the counterbalancing weight on the beam at a constant rate, a uniform flow of gas was obtained, the area of the orifice being kept constant by the equilibrium in the balance operating controlling valves through a system of levers.
This type of apparatus was tried at several places but it was found that the adjustment of the regulating mechanism was too sensitive and produced considerable irregularities in the flow of gas.
The type used by Ornstein and Kienle were combined and commercially developed by the Electric Bleaching Gas Co. of New York.[A] In this combined type the gas was collected from one or more cylinders by means of a manifold which delivered it to the regulating mechanism at the pressure indicated by a gauge attached to the inlet pipe. Beyond this gauge were two pressure-regulating devices, the first being used primarily to reduce the initial pressure to about 15 pounds per square inch, and the second for controlling the pressure through a range sufficient to give the desired discharge of gas. The gas from the second regulator passed through an orifice in a plate at a pressure indicated by a suitable gauge which was calibrated in terms of weight of chlorine per unit of time. The gas, on leaving the regulating apparatus, passed up an absorption tower of hard rubber, where it met a descending stream of water. The solution [92]was carried by suitable piping to the point of application. This type was modified in some cases by the substitution of a flow meter of the float type for the inferential pressure meter.
[A] This type has recently been withdrawn from the market.
Another type of apparatus, developed by Wallace and Tiernan,[B] is shown in Figs. 6 and 7. The gas under the pressure indicated by the tank pressure gauge (Fig. 6) passes into the pressure compensating chamber, which maintains a constant drop in pressure across the chlorine control[93] valve, through the check valve, and into the solution jar after measurement in the pulsating meter. The water required for dissolving the chlorine enters the jar through the feed line and check valve and the solution passes along the feed line after being water sealed in a special chamber. The meter is a volumetric displacement one and is regulated by observing the number of pulsations per minute. Each pulsation corresponds to 100 milligrams or 0.00022 pound of chlorine; diagrams for converting pulsations per minute into weight per twenty-four hours are usually provided[94] with the apparatus. This type of meter is suitable for quantities between 0.1 and 12 pounds per day and possesses the distinct advantage of enabling the operator to see the actual delivery of the gas.
[B] Manufactured by Wallace and Tiernan Co. Inc. N. Y.
The quantities of gas exceeding 12 pounds per day the type shown in Fig. 7 may be used. The gas from the control valve passes through a visible glass orifice which is connected with the manometer. This manometer, or chlorine meter, contains carbon tetrachloride and is graduated empirically in terms of weight of chlorine per unit of time. A suitable gauge indicates the back pressure thrown by the check valve and registers the same pressure as the tank gauge when the flow of gas is stopped. The gas passes into the glass cylinder where it is dissolved in water and passes out by the feed pipe.
The most accurate range of the orifice type is from 1-6, i.e. if the minimum graduation on the scale is 10, the maximum is 60. If quantities less than the minimum graduation are desired, a smaller orifice with its corresponding scale can be substituted in a few minutes.
These types are manually controlled, but automatic control types, to meet almost any condition, can be obtained and are in use in many cities.
In some instances (dry-feed types) the chlorine gas is not dissolved in water prior to addition to the water requiring treatment but is carried to the point of application as a dry gas and enters the water through a diffusion plate made of carborundum sponge. The sponge becomes saturated with water because of the capillary action of the carborundum upon the water. The pressure of the chlorine in the feed pipe forces the gas through the diffuser in the form of minute bubbles which become saturated with moisture. On meeting the water they immediately go into solution and no gas escapes.
The operation of liquid chlorine machines is exceedingly[95] simple. After the cylinders have been connected, the cylinder valves are opened and the joints tested for leakage by holding a swab of absorbent cotton saturated with strong ammonia under them; a leakage is indicated by the appearance of white fumes of ammonium chloride. The control valve is then slightly opened and the auxiliary cylinder valves partially opened; whilst the pressure in the apparatus is slowly increasing the remainder of the joints are tested and if found to be tight, the cylinder valves are fully opened and the control valve opened to the desired amount. In the solution feed types the water required as solvent is turned on before the control valve is opened. Once the apparatus is working, no further attention is required, except for the regulation of the dosage in the manual control types, until the cylinders are replaced. When the stock of gas in the cylinders is almost depleted the pressure falls but it is always preferable to determine the stock by standing the cylinders on a platform scale and weighing at regular intervals. This also provides a check on the apparatus and can be utilised to check the operators.
The accumulation of substances that impede the flow of gas is usually slow and is indicated by a gradual increase in the back pressure. The orifice is calibrated at 25 pounds back pressure and any deviation from this figure will show a discrepancy between the actual weight of chlorine evaporated and the amount calculated from the scale reading.
Liquid chlorine is usually sent out by the manufacturers in steel cylinders which contain about 1.1 cubic feet of liquid or approximately 100 pounds (1 cu. ft. = 89.75 pounds).[C]
[C] An effort is now being made to standardise cylinders of 150 lbs. capacity.
For small installations only one cylinder is necessary but it is always preferable to connect more than one. When the flow of gas is rapid the temperature of the liquid chlorine falls and reduces the pressure. The effect of the fall in temperature, due to the latent heat of evaporation, can be[96] partially overcome by using a larger number of cylinders; in addition a source of external heat should be provided that will maintain the temperature of the cylinders at a minimum of 80° F. This is a “sine qua non” for successful operation. The effect of the temperature upon the pressure in the cylinders is shown in Diagram VII.
In practice it is found impossible to utilise all the gas contained in the containers; when the cylinders are almost empty the pressure necessary for the operation of the regulating device cannot be obtained and full cylinders must be attached. When sufficient heat is provided the weight of chlorine in the cylinder can be reduced to 1 - 11⁄2 pounds before the tank pressure becomes too low.
Liquid chlorine machines will operate, with ordinary care, for long periods. The various parts are made of such metals as experience has demonstrated to be best able to resist the corrosive action of the dry gas and the apparatus is designed to prevent the access of moisture which would otherwise produce corrosion and impede the flow of gas. Stoppages are sometimes caused by brown deposits derived from[97] impurities in the liquid chlorine. These are primarily due to variations in the graphite electrodes used in the electrolytic process for the manufacture of chlorine from salt.
To convey the dry gas from the apparatus to the point of application, copper or iron pipes may be used; for aqueous solutions, flexible rubber hose must be employed. Chlorine water is exceedingly active, chemically, and rapidly attacks all the common metals; ordinary galvanised iron pipe is eroded in a few days and should never be used.
Liquid chlorine, for water disinfection, possesses several marked advantages over the ordinary bleach process.
(1) The sterilising agent is practically 100 per cent pure,[98] the only impurities being traces of carbon dioxide and air, and does not deteriorate on storage; it will, in fact, keep almost indefinitely.
(2) Liquid chlorine practically eliminates all labour costs because of the simplicity of the apparatus and the concentrated form of the sterilising agent. The apparatus is so compact that all the cylinders and regulating apparatus required for delivering 200 pounds of gas per day can be placed in an area of about 50 square feet and it can consequently be almost invariably accommodated in locations where the trifling amount of attention required can be obtained without extra cost.
(3) The sludge problem, inseparable from bleach installations, is eliminated.
(4) Regulation of the dosage is simpler and consequently usually more accurate. The dosing apparatus in bleach plants invariably tends to choke and demands regular attention from intelligent operators; a similar tendency in liquid chlorine machines is easily detected and electrical devices can be installed to indicate automatically any changes in the flow.
(5) The first cost is smaller. The cost of liquid chlorine machines varies from $400, for the small manual control types, to $1,200, for the automatic control types. The capital outlay is mainly determined by the number of machines and accessories required and not, within certain limits, by the capacity. One machine will deliver up to 200 pounds of gas per day, an amount sufficient to treat 60,000,000 U. S. A. gallons (50,000,000 Imp. gals.) at 0.40 p.p.m. of available chlorine. Unless duplicate machines are installed for the higher rates, the first cost is inversely proportional, though not directly so, to the volume of water treated. It is in all cases less than the first cost of a bleach plant of equal capacity, accuracy, and durability.
(6) Liquid chlorine installations usually tend to produce[99] less complaints as to tastes and odours. This is probably due, not to any merit of the chlorine per se, but to a more accurate regulation of the dosage and efficient distribution of the chlorine in the treated water. The advantages ensuing from thorough admixture had only become partially appreciated before liquid chlorine machines were fully developed and they have been more fully utilised in the design of these later installations.
Claims have also been made that liquid chlorine prevents “aftergrowths” but no evidence can be adduced in support of this statement. Aftergrowths have occurred at many places where this process is employed and in this respect it possesses no advantage over hypochlorite installations.
It is also claimed that one pound of liquid chlorine is more efficient, as a germicide, than an equal weight of chlorine in the form of bleach. Jackson[5] has stated that 1 pound of chlorine is equal to 9 pounds of bleach; Kienle (loc. cit.) that it was equal to 8 pounds of bleach, whilst Huy claimed to have obtained an efficiency ratio of 1 : 10 at Niagara Falls, N. Y. The conditions of the experiment were not comparable however, in the last mentioned ratio. Catlett, at Wilmington, N. C. (West[4]) obtained a better bacterial reduction with 1 pound of liquid chlorine than with 6 pounds of bleach.
The efficiency ratio of chlorine to bleach has been reported upon by West.[4] From 1910-1913 the mixed filter effluents of the Torresdale plant at Philadelphia were treated with bleach but in November, 1913 the liquid chlorine process was substituted. On comparing the results obtained during the same months of the two periods it was found that, in general, 1 pound of liquid chlorine gave a slightly higher percentage purification than 6-7 pounds of bleach. Similar results were obtained at the other Philadelphia plants. The figures published by West show that the hypochlorite solutions used were abnormally strong (3.6-10.4 per cent of available chlorine), a condition that would increase the difficulty of[100] extracting all the soluble hypochlorite. It was found indeed, that, under the most advantageous conditions, only 87 per cent of the available chlorine was extracted. The average chlorine content of the bleach used during 1912-1913 was 36.1 per cent but the figures given would indicate that at least 1.5 per cent, a reduction of 4.6 per cent of the total, was lost during storage. It would seem not improbable that the total loss under average conditions was not less than 20 per cent, which would reduce the efficiency ratio to 1 : 4.8-5.6.
Hale[6] also made a comparison of the relative efficiency of liquid chlorine and hypochlorite of lime at New York, and the earlier results agreed with West’s ratio of 1 : 6-7. An investigation showed that large quantities of chlorine were not extracted from the bleach and when this condition was rectified the total loss averaged only 4 per cent and the results obtained were equal to those given by the liquid chlorine machines. Hale’s comparative figures are given in Table XXIII.
| Treatment. | Water Treated. |
Number of Samples. |
Chlorine p.p.m. |
Reduction of B. coli. |
| Bleach | Croton | 84 | 0.27-0.36 | 93% |
| Liquid chlorine | Bronx | 84 | 0.27-0.36 | 93% |
Hale concluded that, when efficiently used, the ratio of chlorine to bleach required to produce equal bacterial purification, approached 1 : 3.
The results obtained by the author in Ottawa are similar to those of Hale. During the earlier period of the bleach treatment a dosage of 1.5 p.p.m. of available chlorine was required to obtain satisfactory purification but various improvements that were subsequently made enabled the[101] quantity to be reduced to 0.8 p.p.m. The same raw water usually requires 0.75 to 0.80 p.p.m. of liquid chlorine to obtain the same purification. The total losses in the Ottawa bleach plant averaged 6-8 per cent and based on these figures the efficiency ratio is approximately 1 : 3.5.
Ratios as low as 1 : 3.5 can only be obtained by the supervision of a chemist and this analytical control involves additional expense that must be charged against the bleach process. No chemical analyses are necessary for the control of liquid chlorine plants.
Disadvantages of Liquid Chlorine Plants. The main objection to the use of liquid chlorine is that the slight leaks of gas occur occasionally and unless removed by forced ventilation may produce a concentration of chlorine that will injure the operators.
Pettenkofer and Lehmann[7] found that 0.001-0.005 per cent of chlorine in air affected the respiratory organs; 0.04-0.06 per cent produced dangerous symptoms, whilst concentrations exceeding 0.06 per cent rapidly proved fatal.
The danger of gas leakages can be eliminated by placing the apparatus in a small separate room provided with a fan and a ventilation duct. By the liberal use of glass in the construction of the room, the operation of the plant can be seen at all times without entering the chamber.
A portion of the liquid chlorine apparatus is made of glass and is consequently easily fractured. Duplicates of the glass parts should be kept in stock to prevent interrupting the supply of gas; a duplicate machine is also advisable in large installations.
Cost of Treatment. Prior to the outbreak of war in 1914, liquid chlorine sold at 10-11 cents per pound in small quantities and for 8-9 cents per pound in large shipments. In 1917 the price was 18-20 cents per pound for small quantities and 15 cents upwards for large contracts. Canadian prices are 25 per cent higher.
[102]The amount of chlorine required for satisfactory disinfection (see Chapter III) depends upon the nature of the water and the cost of treatment varies accordingly. In the majority of plants the cost varies from 25-90 cents per million gallons.
Popularity of Process. Since 1913, when the first commercial liquid chlorine machines were used, the popularity of this process has increased in a most remarkable manner. In 1913 over 1,700 million gallons per day were treated with hypochlorite; in 1915, 1,000 million gallons per day were treated with liquid chlorine and an approximately equal amount with hypochlorite; in January 1918, the amounts were 3,500 million gallons per day (liquid chlorine) and 500 million gallons per day (hypochlorite).
This wonderful development has been largely due to the intrinsic merits of the process and the reliability of the machines manufactured although it has been indirectly assisted by the excessive cost of hypochlorite during 1915-1916.
Liquid chlorine machines are being used for the purification of water on the Western Front of the European battlefield. The outfit is a mobile one and consists of a rapid sand filter, liquid chlorine apparatus, a small storage tank and solution tanks. Owing to the limited contact period available a large dosage of chlorine is employed and the excess afterwards removed by the addition of a solution of sodium thiosulphate.
Chlorine Water. Marshall[8] has proposed the use of chlorine water for the sterilisation of water for troops. The solution is contained in ampoules which are of two sizes, one for water carts and the other for water bottles of one quart capacity.
The coefficient of solubility of chlorine, from 10°-41° C. [103]is C = 3.0361 - 0.04196t + 0.0001107t2; when t = 10° C. 1 c.cm. of water absorbs 2.58 c.cms. of chlorine or 8.2 m.gr., a quantity sufficient to give a concentration of 1 p.p.m. in 8 litres of water. Marshall has stated that, when pure materials are used, chlorine water is stable but the author is unable to confirm this. A saturated solution of chlorine in distilled water lost over 50 per cent of its available chlorine content when stored for five days in the dark at 70° F. The chlorine present as hypochlorous acid increased slightly but the quantity never exceeded very small proportions. Chlorine solutions decompose in accordance with the equation, Cl2 + H2O = 2HCl + O.
Although chlorine water appears to be of little value because of its instability there appears to be no reason why chlorine hydrate should not be successfully employed. The hydrate was first prepared by Faraday[9] by passing chlorine into water surrounded by a freezing mixture. A thick yellow magma resulted from which the crystals of chlorine hydrate were separated by pressing between filter paper at 0° C. The hydrate prepared by Faraday was found to have the composition represented by the formula Cl·5H2O but later investigators have shown that more concentrated hydrates can be prepared. Roozeboom[10] prepared a hydrate represented by the formula Cl·4H2O and Forcrand[11] one containing only 31⁄2 molecules of water (Cl2·7H2O). Chlorine hydrate separates into chlorine gas and chlorine water at 9.6° C. in open vessels and at 28.7° C. in closed vessels. Pedler[12] has shown that when the ratio of Cl2 : H2O is 1 : 64 or greater, the mixture of chlorine hydrate and water exhibits great stability and can be exposed to tropical sunlight for several months without decomposition.
Cl2·64H2O contains 5.8 per cent of chlorine and about 8. c.cms. would be required to give a concentration of 1 p.p.m. in 110 Imp. gallons of water, the usual capacity of a military water cart.
[1] Nesfield. Public Health, 1903, 15, 601.
[2] Darnall. J. Amer. Pub. Health Assoc., 1911, 1, 713.
[3] Kienle. Proc. Amer. Waterworks Assoc., 1913, 274.
[4] West. J. Amer. Waterworks Assoc., 1914, 1, 400-446.
[5] Jackson. Proc. Amer. Waterworks Assoc., 1913.
[6] Hale. Proc. N. J. San. Assoc., 1914.
[7] Pettenkofer and Lehmann. Munich Acad., 1887.
[8] Marshall. Conv. Amer. Elect. Chem. Soc., 1917. Eng. and Contr., 1918, 49, 40.
[9] Faraday. Q. J. S., 15, 71.
[10] Roozeboom. Rec. Trav. Chim., 1885, 3, 59.
[11] Forcrand. Comp. rend., 1902, 134, 991.
[12] Pedler. J. C. S., 1890, 83, 613.
Since 1889 when Webster first proposed the use of electrolysed sea-water as a disinfectant, various attempts have been made to introduce electrolytic hypochlorites for the bactericidal treatment of water and sewage. Two of these preparations were named Hermite fluid, and electrozone (c.f. page 5). Sodium hypochlorite, made by passing chlorine into solutions of caustic soda, or by the decomposition of bleach by sodium carbonate, has also been used and preparations of this character have been sold under such names as Eau de Javelle, Labarraque solution, chloros, and chlorozone. These solutions contain mixtures of sodium hypochlorite and sodium chloride together with some free alkali. Chlorozone was the name given by Count Dienheim-Brochoki to a number of preparations patented in 1876 and subsequently down to 1885. They were produced by passing air and chlorine into solutions of caustic soda. Lunge and Landolt[1] have shown that the air introduced is without effect and that the advantages claimed for chlorozone are illusory.
The earliest electrolytic installation on this continent was operated at Brewster, N. Y., in 1893 and since that date several plants have been erected where local conditions conduced to economical operation.
When a uni-directional current of electricity is passed through a solution of sodium chloride, the salt is dissociated and the components liberated, NaCl = Na + Cl. If the elements[106] are not separated, the chlorine combines with the sodium hydrate, formed by the action of the sodium on the water, to form sodium hypochlorite. The equations 2Na + 2H2O = 2NaOH + H2, and 2NaOH + Cl2 = NaOCl + NaCl + H2O show that only one-half of the chlorine produced is found as hypochlorite; the other half reforming sodium chloride.
Several types of electrolysers have been used for the production of hypochlorites and chlorine but only two are suitable for water-works purposes: in one, the cathodic and anodic products recombine in the main body of the electrolyte; in the other, the diaphragm process, they are separated as removed and the final products are chlorine gas and a solution containing caustic soda and some undecomposed salt.
Until a few years ago the non-diaphragm process was the only one used for water treatment and it will consequently be discussed first.
Non-diaphragm Process. The theoretical voltage required for the decomposition of sodium chloride is 2.3 but when the products recombine in the electrolyte, side reactions occur which increase the minimum voltage to 3.54. On this basis one kilowatt hour gives 272 ampere hours and as one ampere hour is theoretically capable of producing 1.33 grams of chlorine, 1.21 kilowatt hours are necessary for the production of 1 pound of chlorine by the decomposition of 1.65 pounds of salt.
Charles Watt (1851) discovered this process and was the first to recognize the necessary conditions which are (1) insoluble electrodes, (2) low temperature of electrolyte, and (3) rapid circulation of electrolyte from the cathode to the anode. The control of the temperature is very important, for as it increases, side reactions occur with the formation of chlorates, and the efficiency is decreased.
The non-diaphragm cells used in Europe (Haas and Oettel, Kellner, Hermite, Vogelsand, and Mather and Platt)[107] have been described by Kershaw.[2] In the Haas and Oettel electrolyser the electrodes are composed of carbon but in the other types at least one electrode is made from platinum or a platinum alloy. The Dayton electrolyser, which is the cell most familiar in North America, is shown in Fig. 9.
The outer cell is made of soapstone and is approximately 21⁄2 feet long and 2 feet wide. The main electrodes consist of four pieces of Atcheson graphite connected together by screws and metal strips to which is attached a clamp for connecting electrical terminals. Circulation of the brine is produced by glass baffle plates and secondary electrodes placed one inch apart between the main electrodes. The cell is intended to be used at 110-volts pressure but by wiring two cells in series a 220-volt circuit may be employed. An inlet and outlet are provided at each end of the tank to permit the direction of the flow to be periodically reversed for the[108] purpose of removing the lime deposit from the graphite plates.
The salt solution is prepared in wooden tanks from coarse clean salt (ground rock salt is unsuitable), containing as little iron as possible, in the proportion of 50 pounds to 100 gallons of water. After passing through a gravel or other suitable filter the brine solution is carried by brass pipes to the electrolyser. The rate of flow is adjusted to the temperature of the hypochlorite solution leaving the cell but under normal conditions it is stated that the cell described will pass 40 gallons per hour with a consumption of 70 amperes and produce 21⁄2 pounds of chlorine per hour. This is equal to 8 pounds of salt and 3.08 kilowatt hours per pound of chlorine. After the cells have been operated for several months the efficiency usually falls and 10-11 pounds of salt and 3.5-3.7 kilowatt hours are required for the production of one pound of chlorine. The concentration of the hypochlorite solution is usually about 6 grams per litre.
Rickard[3] stated that by cooling the Dayton cell with ice 1 pound of chlorine could be produced from 2.65 kilowatt hours and 6.9 pounds of sodium chloride; without cooling the figures were 3.62 kilowatt hours and 7.2 pounds of salt. Based on the figures that have been obtained from mature cells, the efficiency of the Dayton cell as compared with those described by Kershaw is as follows:
| Type of Cell. | Salt. | Power. | ||
| Per Pound of Available Chlorine. | ||||
| Pounds. | Per Cent Consumed. |
Kilowatt Hours. |
Efficiency Per Cent. |
|
| Haas and Oettel | 10.7 | 15.4 | 3.8 | 31.9 |
| Kellner | 7.5 | 22.0 | 2.75 | 43.9 |
| Hermite | 11.2 | 14.5 | 2.87 | 42.2 |
| Mather and Platt | .... | .... | 2.75 | 43.9 |
| Dayton | 10.0 | 16.5 | 3.6 | 33.6 |
| Theoretical | 1.65 | 100.0 | 1.21 | 100.0 |
[109]The cost of production depends upon local conditions: if alternating current is available at $30 per horse-power per annum, and low-grade salt can be obtained for $5 per ton the cost of 1 pound of chlorine would be
| Type of Cell. | Cost (Cents) Per Pound of Available Chlorine. |
||
| Salt. | Current. | Total. | |
| Haas and Oettel | 2.67 | 1.97 | 4.64 |
| Kellner | 1.87 | 1.43 | 3.30 |
| Hermite | 2.80 | 1.49 | 4.29 |
| Dayton | 2.50 | 1.92 | 4.42 |
The electrical and chemical efficiencies of the Haas and Oettel and Dayton cells, which contain carbon electrodes, are smaller than those containing platinum electrodes but for water sterilisation the carbon cells have been found to be more suitable. To prevent the action of magnesium salts on the platinum electrodes it is necessary to use a higher grade of salt or to provide means of purification. Because of the absence of a base and the presence of chlorides, electrolytic hypochlorite cannot be stored for more than a few hours without appreciable loss of titre. Unless used for the treatment of the effluent of a filter plant operated at a fairly constant rate a small storage tank is necessary to compensate for the irregular demand and to provide the head required by orifice feed boxes. Small variations can be made by regulating the flow through the cells but large ones are not compatible with efficiency, which is the highest under a constant load.
Claims have been made that electrolytic hypochlorite is more efficient as a germicide than bleach when compared on the basis of their available chlorine content but no evidence of it has been produced. Bleach contains an excess of base, which retards the germicidal action, and electrolytic hypochlorite[110] contains an excess of sodium chloride, which accelerates it (Race[4]) but the ultimate effect is the same with both. This is shown in Table XXIV.
| Contact Period. | Bleach. | Electrolytic Hypochlorite. |
||
| Available Chlorine. Parts Per Million. | ||||
| 0.4 | 0.6 | 0.4 | 0.6 | |
| Nil | 182 | ... | ... | ... |
| 10 minutes | 130 | 10 | 120 | 8 |
| 1 hour | 66 | 1 | 60 | 0 |
| 2 hours | 3 | 0 | 1 | 0 |
| 31⁄2 hours | 0 | 0 | 0 | 0 |
| [A] Results are B. coli per 10 c.cms. | ||||
Electrolytic hypochlorite has a greater germicidal velocity than bleach but the difference is so small as to be of no practical importance. Rabs[5] experimented with various hypochlorites but was unable to find any appreciable differences in their germicidal action.
If electrical power can be obtained at a very low cost, or if the cost is merely nominal, as it is when there is an appreciable difference between the normal consumption and the peak load upon which the rate is based, the electrolytic hypochlorite method offers some advantages but in the great majority of plants it cannot economically compete with bleach. The instability of the liquor and cell troubles have also prevented the process being generally utilised. Baltimore and Cincinnati experimented with this method but did not adopt it. Winslow[6] has reported that, owing to the difficulty in obtaining bleach since the outbreak of war, Petrograd has used electrolytic hypochlorite made from salt.
Diaphragm Process. The various types of diaphragm cells that have been commercially operated are of two varieties:[111] (1) cells with submerged diaphragms and (2) cells in which the electrolyte comes in contact with one face only of an unsubmerged diaphragm.
The Le Sueur, Gibbs, Crocker, Billiter-Siemens, Nelson, and Hargreaves-Bird cells are of the submerged diaphragm variety. The Nelson cell has been operated for some time at the filtration plant at Little Falls, N. J. The cells are fed with brine solution previously purified by the addition of soda ash and have given fairly successful results although the cost of maintenance is comparatively high. Tolman[7] has reported that several towns in West Virginia use a bleach solution prepared by absorbing chlorine, manufactured by the Hargreaves-Bird process, in lime water; the solution contains about 1.95 per cent of available chlorine.
The diaphragms in both the submerged and unsubmerged types are usually constructed either with asbestos paper or cloth, placed in such a manner as to divide the cells into two separate compartments: the anodic, into which the brine is fed and where the chlorine is produced; and the cathodic, where caustic soda is formed.
By maintaining the liquor in the anodic compartment at a higher elevation than in the cathodic one, the direction of flow is towards the latter, but owing to osmosis and diffusion the separation is not complete and a portion of the caustic soda passes the diaphragm and produces hypochlorite with a consequent loss of efficiency and rapid deterioration of the anodes. With the exception of the Billiter-Siemens cell, the submerged diaphragm cells operate at not more than 85 per cent efficiency and the cost of maintenance is usually high.
In the non-submerged diaphragm types the invasion of the anodic compartment by caustic is much reduced and the efficiency and life increased.
An electrolyser of the non-submerged diaphragm type is the Allen-Moore cell which has been adopted by the Montreal[112] Water and Power Co. This has been described by Pitcher and Meadows.[8] The general lay-out of the installation is shown in Fig. 10, and the essential features are: a salt storage bin having a capacity of 40 tons; the brine saturating and purifying apparatus; duplicate 15 horse-power motor-generator sets; four chlorine cells; and the silver ejectors and distributing lines for carrying the chlorine solution to the point of application.
The brine solution, which is prepared by passing water through the saturators previously filled with salt, is delivered to the two concrete reaction tanks where an amount of soda ash and caustic liquor sufficient to combine with the calcium and magnesium salts is added, and the mixture filtered through sand and stored in the purified brine tanks. To prevent the formation of hypochlorites by the interaction of chlorine and alkali, the alkalinity of the liquor is determined[113] and sufficient hydrochloric acid added to ensure an acidity of 0.01 per cent. The acid brine is delivered at one end of the four cells (Fig. 11) each of which is 7 feet long and 203⁄8 inches wide and consumes 600 amperes at 3.3 volts. The cell box is built of concrete and is provided with a perforated wrought iron cathode box and graphite anode plates which are separated by an unsubmerged asbestos paper diaphragm.
Each cell has a capacity of 32 pounds of chlorine per day and the gas flow is determined by measuring the volume of caustic soda produced in a given period of time and calculating the weight from the volume and concentration as determined by titration with standard acid; each gram of NaOH is equal to 0.88 gram of chlorine. The efficiency of the cell is obtained by dividing the number of grams of chlorine produced per hour by the product of the current volume (in amperes) and the factor 1.33, the theoretical production of chlorine for one ampere hour. The average efficiency of the Montreal cells was found to be 93 per cent. The installation comprises four cells, one being held in reserve, and the annual cost of producing 90 pounds of chlorine per day is given as $2,500. The details are:
| Salt at $8.00 per ton, delivered | $500.00 |
| Power, 15 H.P., at $30.00 flat rate | 450.00 |
| Labour and superintendence | 500.00 |
| Interest at 6 per cent on capital cost | 300.00 |
| Depreciation, 15 per cent | 750.00 |
| ———— | |
| $2,500.00 |
cost per pound of chlorine = 7.6 cents.
The diaphragm cells, like the non-diaphragm ones, operate most efficiently under a constant load; they are consequently suitable for treating the effluent of filter plants.
Where very cheap electrical power can be obtained, the cost per pound of available chlorine is less for the electrolytic method just described than for liquid chlorine or chlorine obtained from bleach; but this condition obtains in very few places. Mr. J. A. Meadows has suggested to the author that the cost could be reduced by converting the chlorine gas into hypochlorite and then adding dilute ammonia as in the chloramine process (vide page 115). The caustic liquor, usually run to waste from the cathodic compartment, could be delivered into a feed box from which it would be drawn off by the water injector used for dissolving the chlorine gas.
[1] Lunge and Landolt. Jour. Soc. Dyers and Colourists, Nov. 25, 1885.
[2] Kershaw. Jour. Soc. Chem. Ind., 1912, 31, 54.
[3] Rickard. Quar. Bull. Ohio Board of Health, Oct.-Dec., 1904.
[4] Race. Jour. Amer. Waterworks Assoc., 1918, 5, 63.
[5] Rabs. Hygienische Rundschau, 1901, 11.
[6] Winslow. Public Health Rpts. U. S. P. H. S., 1917, 32, 2202.
[7] Tolman. Jour. Amer. Waterworks Assoc., 1917, 4, 337.
[8] Pitcher and Meadows. Jour. Amer. Waterworks Assoc., 1917, 4, 337.
Chloramine (NH2Cl), a chemical compound in which one of the hydrogen atoms of ammonia has been replaced by chlorine, was discovered by Raschig[1] in 1907. Chloramine was prepared by cooling dilute solutions of bleach and ammonia and adding the latter to the former contained in a flask surrounded by a freezing mixture. The proportions were as the equivalent weights of anhydrous ammonia and available chlorine (approximately two parts by weight of chlorine to one part by weight of ammonia). After gas evolution had ceased the mixture was saturated with zinc chloride and the magma distilled under reduced pressure. The distillate was a dilute solution of comparatively pure chloramine.
The first to notice the effect of ammonia on the germicidal value of hypochlorites was S. Rideal[2] who noted that during the chlorination of sewage, the first rapid consumption of chlorine was succeeded by a slower action which continued for days in some instances, and was accompanied by a germicidal action after free chlorine or hypochlorite had disappeared. Rideal stated that: “It became evident that chlorine, in supplement to its oxidising action, which had been exhausted, was acting by substitution for hydrogen in ammonia and organic compounds, yielding products more or less germicidal.” On investigating the effect of ammonia on hypochlorite it was found that the addition of an equivalent of ammonia to electrolytic hypochlorite increased the carbolic[116] acid coefficient of 2.18, for one per cent available chlorine, to 6.36 (nearly three times the value). Further experimental work showed that the increase was due to the formation of chloramine.
The author, in 1915, during a series of experiments on the relative germicidal action of hypochlorites, attempted to prepare the ammonium salt by double decomposition of bleach and ammonium oxalate solutions.
Ca(OCl)2 + (NH4)2C2O4 = CaC2O4 + 2NH4OCl.
The velocity of the germicidal action of the solution was found to be about ten times greater than the germicidal velocities of other hypochlorites of equal concentrations, (Race[3]), and from a consideration of the chemical formula of ammonium hypochlorite it appeared probable that it would be very unstable and decompose into chloramine, which Rideal had previously shown to have an abnormal germicidal action, and water. NH4OCl = NH2CL + H2O. After these results have been confirmed, the effect of adding ammonia to bleach solution was tried and it was found that 0.20 p.p.m. of available chlorine and 0.10 p.p.m. of ammonia produced equally good results as 0.60 p.p.m. of chlorine only. Similar results were obtained on the addition of ammonia to electrolytic hypochlorite.
Experiments made with a view to determining the most efficient ratios of ammonia gave very surprising results: chlorine to ammonia ratios (by weight) between 8 : 1 and 1 : 2 gave approximately the same germicidal velocity.[3] The action of the ammonia on the oxidising power of bleach, as measured by the indigo test, was also found to be disproportionate to the amount added.
The oxidising action of various mixtures of bleach and ammonia as measured by the rate of absorption of the available by the organic matter in the Ottawa River water is shown in Table XXV.
|
Percentage of Original Found After | |||||||||||
| 10 Mins. | 4 Hours. | 20 Hours. | ||||||||||
| Infinity (ammonia absent) | 66.8 | 40.0 | 25.1 | |||||||||
| 8 : 1 | 83.2 | 77.8 | 67.3 | |||||||||
| 4 : 1 | 97.2 | 94.7 | 88.5 | |||||||||
| 2.7 : 1 | 98.3 | 96.5 | 92.8 | |||||||||
| 2 : 1 | 99.8 | 98.2 | 96.2 | |||||||||
The 8 : 1 ratio caused a marked reduction in the rate of absorption of the chlorine whilst a 4 : 1 ratio was almost as active as the ratios containing more ammonia.
At the time when the abnormal results were obtained with ammonium hypochlorite and mixtures of bleach and ammonia, the phenomenon appeared to be of scientific interest only and especially so as Rideal had attributed the obnoxious tastes and odours, sometimes produced by chlorination, to the formation of chloramines. During the winter of 1915-1916 the price of bleach, however, advanced to extraordinary heights and the author then determined to try out the process on a practical scale for the purification of water. A subsidiary plant pumping about 200,000 Imperial gallons per day (240,000 U. S. A. gallons) was found to be available for this purpose and the chloramine process was substituted for the bleach method previously in operation. The process was commenced by the addition of pure ammonia fort, in the amount required to give a chlorine to ammonia ratio of 2 : 1, to the bleach solutions in the barrels. The results were not in accordance with those obtained in the laboratory and it was found that the samples of bleach solutions received for analysis were far below the strength calculated from the amount of dry bleach used. This experience was repeated on subsequent days and the deficiency was found to increase on increasing the ammonia dosage. Solutions of similar[118] concentration were then used in the laboratory with similar losses, and it was observed that on the addition of ammonia a copious evolution of gas occurred. An investigation showed that the ammonia and bleach must be mixed as dilute solutions and prolonged contact avoided (vide p. 127). Alterations were accordingly made in the plant and the bleach and ammonia were prepared as dilute solutions in separate vessels and allowed to mix for only a few seconds before delivery to the suction of the pumps. This method of application was instantaneously successful and results equal to those obtained in the laboratory were at once secured. The dosage was reduced until the bacteriological results were adversely affected and continued at values slightly in excess of this figure (0.15 p.p.m.) for a short period to prove that the process was reliable.
From a consideration of the work of Raschig and Rideal, it appeared that the most efficient proportions of available chlorine and ammonia would be two parts by weight of the former to one part of the latter and this ratio was maintained during the run on the experimental plant. Lower ratios of chlorine to ammonia were contra-indicated by the laboratory experiments, which showed that the efficiency was not increased thereby whilst higher ratios were left for future consideration.
The results obtained on the experimental plant, together with those obtained on the main plant, where 24 million gallons per day were treated with bleach only, are given in Tables XXVI, XXVII and XXVIII. The two periods given represent the spring flood condition and that immediately preceding it; these are respectively the worst and best water periods. The results in both cases are from samples examined approximately two hours after the application of the chemicals.
The cost data were calculated on the current New York prices of bleach and ammonia.
| Bacteriological Results | ||||||||||||
| 1916 | Raw Water. | Treated with Hypochorite Alone. | Treated with Hypochlorite and Ammonia. | |||||||||
| Bacteria per cubic centimeter. |
B. coli Index per 100 cc. |
Bacteria per cubic centimeter. |
B. coli Index per 100 cc. |
Available chlorine parts per million. |
Bacteria per cubic centimeter. |
B. coli Index per 100 cc. |
Available chlorine parts per million. |
Ammonia, parts per million. |
||||
| Agar 1 day at 37° C. |
Agar 3 days at 20° C. |
Agar 1 day at 37° C. |
Agar 3 days at 20° C. |
Agar 1 day at 37° C. |
Agar 3 days at 20° C. |
|||||||
| Mar. 15-31 | 44 | 238 | 35.7 | 4 | 12 | <0.14 | 0.90 | 4 | 12 | 0.14 | 0.22 | 0.11 |
| April 1-19 | 3,099 | 14,408 | 195.5 | 32 | 56 | 0.50 | 1.10 | 33 | 246 | 0.74 | 0.25 | 0.13 |
| Percentage Reduction | ||||||||
| Hypochlorite Alone. | Hypochlorite and Ammonia. | |||||||
| Bacteria per cubic centimeter. |
B. coli Index per 100 cubic centi- meters. |
Available Chlorine Parts per Million. |
Bacteria per cubic centimeter. |
B. coli Index per 100 cubic centi- meters. |
Available Chlorine Parts per Million. |
|||
| Agar 1 day at 37° C. |
Agar 3 days at 20° C. |
Agar 1 day at 37° C. |
Agar 3 days at 20° C. |
|||||
| Mar. 15-31 | 90.9 | 95.8 | 99.9+ | 0.90 | 90.0 | 95.0 | 99.7 | 0.22 |
| April 1-19 | 98.9 | 99.6 | 99.7 | 1.10 | 98.3 | 98.9 | 99.6 | 0.25 |
| Cost Per Million Imperial Gallons[A] | ||
| Hypochlorite alone. |
Hypochlorite and ammonia. |
|
| Mar. 15-31 | $1.12 | $0.46 |
| April | 1.26 | 0.54 |
| [A] Calculated as Bleach at $3.80 per 100 pounds and aqua ammonia (26° Bé.) at 51⁄2 cents per pound. |
||
[120]The results were so satisfactory that the author recommended the adoption of the process on the main chlorinating plant but owing to conditions imposed by the Provincial Board of Health the process was not operated until February, 1917.
In place of ammonia fort, aqua ammonia (26° Bé.), containing approximately 29 per cent of anhydrous ammonia, was used. The material was first examined by the presence of such noxious substance as cyanides and found to be very satisfactory.
The general design of the plant is shown in Fig. 12. The bleach is mixed in tank A as a solution containing 0.3 to 0.6 per cent of available chlorine and delivered to tanks B and D, each of which has a twenty-four-hour storage capacity. The ammonia solution is mixed and stored in tank B and contains 0.3-0.5 per cent of anhydrous ammonia. The two solutions are run off into boxes E and F which maintain a constant head on valves V and V′ controlling the head on the orifices. Both orifices discharge into a common feed[121] box G from which the mixture is carried by the water injector J through one of duplicate feed pipes and discharged into the suction well through a perforated pipe.
As tank B was previously used as a bleach storage tank, the change from hypochlorite alone to chloramine necessitated very little expense.
The treatment was commenced by gradually increasing the quantity of ammonia, until a dosage of 0.12 p.p.m. was reached, and constantly increasing the dosage of bleach, which was formerly 0.93 p.p.m. of available chlorine. Owing to the restrictions imposed by the Provincial authorities it has not been possible to maintain a dosage as low as that indicated as sufficient by the experimental plants results, but some interesting data have been obtained. Table XXIX shows the results obtained from February to October, 1917, from the chloramine treatment at Ottawa and also those obtained with liquid chlorine at Hull where the same raw water is treated with 0.7-0.8 p.p.m. of chlorine.
| 1917 | B. coli Per 100 c.cms. | Tur- bidity. |
Colour. | Dosage p.p.m. | Hull B. coli Per 100 c.cms. |
||
| Raw Water. |
Tap Water. |
Chlo- rine. |
Ammo- nia. |
||||
| Feb. | 268 | 0.88 | 3 | 40 | 0.57 | 0.05 | .... |
| Mar. 1-18 | 250 | 0.96 | 4 | 40 | 0.32 | 0.11 | .... |
| Mar. 1-31 | 643 | 0.43 | 4 | 40 | 0.47 | 0.14 | .... |
| April | 5228 | 0.34 | 31 | 32 | 0.56 | 0.10 | .... |
| May | 162 | <0.08 | 3 | 39 | 0.52 | 0.08 | .... |
| June | 114 | <0.08 | 3 | 41 | 0.51 | 0.08 | .... |
| July | 237 | 0.08 | 5 | 41 | 0.51 | 0.08 | 44.4 |
| Aug. | 165 | 0.08 | 4 | 42 | 0.51 | 0.10 | 28.0 |
| Sept. | 55 | <0.08 | 6 | 42 | 0.50 | 0.09 | 15.2 |
| Oct. | 31 | 0.15 | 5 | 42 | 0.42 | 0.08 | 1.1 |
| Average | 211 | 0.22 | 7 | 40 | 0.51 | 0.09 | |
[122]At the height of the spring floods the raw water contained 80 p.p.m. of turbidity and over 500 B. coli per c.cm. but 0.6 p.p.m. of chlorine and 0.13 p.p.m. of ammonia reduced the B. coli index in the tap samples to 2.5 per 100 c.cms.; samples taken in Hull on the same day (treated with 0.7-0.8 p.p.m. of liquid chlorine) gave a B. coli index of 26.7. Previous experiences in Ottawa has shown that a dosage of approximately 1.5 p.p.m. of available chlorine is required to reduce the B. coli index to 2.0 per 100 c.cms. under similar physical and bacteriological conditions.
During the period of nine months covered by the results in Table XXIX, only five cases of typhoid fever were reported in which the evidence did not clearly indicate that the infection had occurred outside the city. The reduction in the bleach consumed during the same period effected a saving of $3,200.
During one period of operation the hypochlorite dosage was gradually reduced to ascertain what factor of safety was maintained with a dosage of 0.5 p.p.m. of available chlorine and 0.06-0.08 p.p.m. of ammonia. The results are shown in Diagram VIII. The percentage of samples of treated water showing B. coli in 50 c.cms. was calculated from the results of the examination of 4-7 samples daily.
The results showed that it was possible to reduce the chlorine dosage to 0.25 p.p.m. with 0.06 p.p.m. of ammonia without adversely affecting the bacteriological purity of the tap supply and fully confirmed the experimental results previously obtained.
The lowest ratio of available chlorine to ammonia used during this test was approximately 4 : 1. This is the ratio indicated by a consideration of the theory of the reaction, and not 2 : 1 as was formerly stated (Race[4]). If bleach is represented as Ca(OCl)2, the equation
Ca(OCl)2 + 2NH3 = 2NH2Cl + Ca(OH)2
[123] would indicate a ratio of 2 : 1; but only one molecule of Ca(OCl)2 is produced from two molecules of bleach and the theoretical ratio is therefore 4 : 1 (142 : 34),
| 2CaOCl2 | = CaCl2 + Ca(OCl)2 | and Ca(OCl)2 + | 2NH3 | = 2NH2Cl + Ca(OH)2. |
| Cl = 142 | 34 | |||
The chlorine to ammonia ratio is very important because of its influence on the economics of the process (vide p. 124).
All the laboratory and works results that have been obtained in Ottawa indicate the importance of an adequate contact period. The superiority of chloramine over other processes is due to the non-absorption of the germicidal agent and to obtain the same degree of efficiency the contact period must be increased as the concentration is decreased. For this reason the best results will be obtained by chlorinating at the entrance to reservoirs or under other conditions that will ensure several hours contact. At Ottawa the capacity[124] of the pipes connecting the pumping station (point of chlorination) and the distribution mains provides a contact period of one and a quarter hours but even better results would be obtained if the contact period were increased.
The general results obtained during the use of chloramine at Ottawa in 1917 have shown that the aftergrowths noted during the use of hypochlorite (see p. 56) have been entirely eliminated and that the B. coli content of the tap samples from outlying districts has been invariably less than that of samples taken from taps near to the point of application of the chloramine. At Denver, Col., where the chloramine process has also been used, similar results were obtained[5]: four days after the initiation of the chloramine treatment the aftergrowth count on gelatine of the Capitol Hill reservoir dropped from 15,000 to 10 per c.cm. The hypochlorite dosage was cut from 0.26-0.13 p.p.m. of available chlorine and 0.065 p.p.m. of ammonia added.
Economics of the Chloramine Process. The chloramine process was introduced at Ottawa for the purpose of obtaining relief from the effect of the high price of bleach caused by the cessation of imports from Europe in 1915. The results obtained with the experimental plant indicated that, calculated on the prices current at the beginning of 1917, appreciable economies could be made. Although the reduction in the chlorine dosage has not been as great as was anticipated, due to the restrictions previously mentioned, the cost of sterilising chemicals in 1917 was $3,200 less than the cost of straight hypochlorite treatment.
During the latter part of 1917 the relative cost of bleach and ammonia changed (see Diagram IX).
When calculated on the New York prices for January, 1918, the cost of chloramine treatment in the United States would be greater than hypochlorite alone unless a large reduction in the dosage could be secured by very long contact periods. This condition is only temporary, however, and[125] the price of ammonia will probably gradually decline as the plants for fixation of atmospheric nitrogen commence operations and reduce the demand for the ammonia produced from ammoniacal gas liquor.
In Canada, the market conditions are still (1918) favourable to the chloramine process: bleach is 25 per cent higher than the U.S.A. product and ammonia can be obtained for one-half the New York prices.
Advantages of the Chloramine Process. Although the market conditions may, in some instances, be unfavourable to the chloramine process, the method possesses certain advantages that more than offset a slight possible increase in the cost of materials. The taste and odour of chloramine is even more pungent than that of chlorine but since the introduction of the process in Ottawa no complaints have been[126] received. Owing to the reduced dosage, slight proportional fluctuations in the dosage do not produce the same variations in the amount of free chlorine which is the usual cause of complaints. A public announcement that the amount of hypochlorite has been reduced also has a psychological effect upon the consumers and tends to reduce complaints due to auto-suggestion.
The most important advantage of the process is the elimination of the aftergrowth problem. At Denver, where the aftergrowth trouble is possibly more acute than at any other city on the continent, it was effectively banished by the use of chloramine. At Ottawa, the sanitary significance of B. coli aftergrowths is no longer of practical interest because such aftergrowths have ceased to occur. Whatever may be their opinion as to the sanitary significance of aftergrowths, all water sanitarians will agree that the better policy is to prevent their occurrence.
Operation of Chloramine Process. For the successful operation of the chloramine process, the essential factors are low concentrations of the hypochlorite and ammonia solutions. The author has found that hypochlorite containing 0.3-0.5 per cent of available chlorine and ammonia containing 0.3-0.5 per cent of anhydrous ammonia can be mixed in a 4 : 1 or 8 : 1 ratio without appreciable loss in titre. Solutions of these concentrations mixed in 4 : 1 ratio lost only 2-3 per cent of available chlorine in fifteen minutes and less than 10 per cent in five hours. The effect of mixing solutions containing 4.35 per cent of available chlorine and 2.2 per cent of ammonia is shown in Table XXX.
| Hypochlorite containing 4.35 per cent available chlorine. Ammonia contained 2.2 per cent NH3 |
|||
| Ratio Chlorine to Ammonia by Weight. |
Loss of Available Chlorine After | ||
| Few Minutes. |
1 Hour. | 24 Hours. | |
| Per cent | Per cent | Per cent | |
| 6 : 1 | 19 | 19 | 19 |
| 4 : 1 | 24 | 25 | 25 |
| 2 : 1 | 45 | 47 | 47 |
| 1 : 1 | 91 | 91 | 92 |
| 1 : 2 | 20 | 28 | 65 |
The stability of chloramine is a function of the concentration and the temperature and in practice it will be found advisable to determine in the laboratory the maximum concentrations that can be used at the maximum temperature attained by the water to be treated (cf. Muspratt and Smith[6]).
[127]According to Raschig[1] two competing reactions occur when ammonia is in excess.
| (1) | NH2Cl + NH3 = N2H4HCl hydrazine hydrochloride | |
| and | (2) | 3NH2Cl + 2NH3 = N2 + 3NH4Cl. |
When the excess of ammonia is large, as on the addition of ammonia fort, the second reaction predominates and the yield of nitrogen gas is almost quantitatively proportional to the quantity of available chlorine present. As ammonium chloride has no germicidal action, and hydrazine a carbolic coefficient of only 0.24 (Rideal), the formation of these compounds should be avoided.
The dosage of chloramine can be checked by titration of the available chlorine (see p. 82) immediately after treatment or by the estimation of the increment in the total ammonia (free and albuminoid). Routine determinations of the latter made in Ottawa show that practically the whole (90-95 per cent) of the added ammonia can be recovered by distillation with alkaline permanganate and that 85-90 per cent is in the “free” condition.
[128]In operating the chloramine process it is important that the pipes used for conveying the chloramine solution should be of ample dimensions and provided with facilities for blowing out the lime that deposits from the solution.
Ca(OCl)2 + 2NH3 = 2NH2Cl + Ca(OH)2.
The marked activity of chloramine as a chlorinating agent could be predicated from its heat of formation, which is 8,230 calories. The other possible chloramines should be even more active as the heat of formation of these compounds are:
| Dichloramine | NHCl2 | — | 36,780 calories. |
| Nitrogen trichloride | NCl3 | — | 65,330 calories. |
Dichloramine is unknown but nitrogen chloride has been prepared and is a highly explosive yellow oil that decomposes slowly when kept under water in the ice box. NCl3 can be easily prepared by passing chlorine gas into a solution of ammonium chloride and this process would suggest that a method might be found of utilising chlorine and ammonia as gases for the production of nitrogen trichloride as a germicide for water chlorination. NH4Cl + 3Cl2 = NCl3 + 4HCl.
The “available” chlorine content of the chloramines is double the actual chlorine content as each atom of chlorine will liberate two atoms of iodine from hydriodic acid.
| NH2Cl + 2HI | = | I2 + NH4Cl. |
| NCl3 + 6HI | = | 3I2 + NH4Cl + 2HCl. |
For the sterilisation of small individual quantities of water such as are required by cavalry and other mobile troops bleach and acid sulphate tablets have been usually employed.[129] Such tablets have given fairly satisfactory results but certain difficulties inherent to these chemicals have made it desirable to seek other methods.
The subject was investigated by Dakin and Dunham,[7] who first tried chloramine-T (sodium toluene-p-sulphochloramide). It was found that heavily contaminated waters, and particularly those containing much carbonates, required a comparatively high concentration of the disinfectant: 40 parts per million of chloramine-T were necessary in some cases and such an amount was distinctly unpalatable. By adding tartaric acid or citric acid the effective concentration could be reduced to 4 p.p.m. but the mixture could not be made into a tablet without decomposition and a two-tablet system was deemed undesirable.
Toluene sulphodichloramines were next tried. Excellent bacteriological results were obtained but the manufacture of tablets again presented difficulties. When the necessary quantity of dichloramine was mixed with what were assumed to be inert salts—sodium chloride for example—the normal slow rate of decomposition was accelerated. The dichloramine, in tablet form, was also found to be too insoluble to effect prompt sterilisation.
The most suitable substance found by Dakin and Dunham was “halazone” or p-sulphodichloraminobenzoic acid (Cl2N·O2S·C6H4·COOH). This compound is easily prepared from cheap readily available materials and was found to be effective and reasonably stable.
The starting point in the preparation of halazone is p-toluenesulphonic chloride, a cheap waste product in the manufacture of saccharine. By the action of ammonia, p-toluene sulphonamide is produced and is subsequently oxidised by bichromate and sulphuric acid to p-sulphonamidobenzoic acid. This acid, on chlorination at low temperatures, yields p-sulphondichloraminobenzoic acid (halazone). The reactions may be expressed as follows:
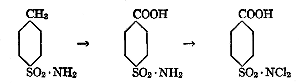
Halazone is a white crystalline solid, sparingly soluble in water and chloroform, and insoluble in petroleum. It readily dissolves in glacial acetic acid from which it crystallizes in prisms (M.P. 213° C.).
The purity of the compound can be ascertained by dissolving in glacial acetic acid, adding potassium iodide, and titrating with thiosulphate; 0.1 gram should require 14.8 to 14.9 c.cms. of N/10 sodium thiosulphate. Each chlorine atom in halazone is equivalent to 1 molecule of hypochlorous acid and the “available” chlorine content is consequently 52.5 per cent or double the actual chlorine content.
>SO2·NCl2 + 4HI = >SO2·NH2 + 2HCl + 2I2.
From the bacteriological results given by Dakin and Dunham it would appear that 3 parts per million of halazone (1.5 p.p.m. available chlorine) are sufficient to sterilise heavily polluted waters in thirty minutes and that this concentration can be relied upon to remove pathogenic organisms.
The formula recommended for the preparation of tablets is halazone 4 per cent, sodium carbonate, 4 per cent (or dried borax 8 per cent), and sodium chloride (pure) 92 per cent.
Halazone and halazone tablets, when tested in the author’s laboratory on the coloured Ottawa River water seeded with B. coli, have given rather inferior results. With 1 tablet per quart, over six hours were required to reduce a B. coli content of 100 per 10 c.cms. to less than 1 per 10 c.cms. Clear well waters gave excellent results and large numbers of B. coli were reduced to less than 1 per 10 c.cms. in less than thirty minutes. McCrady[B] has also obtained excellent results[131] with various strains of B. coli seeded into the colourless St. Lawrence water.
[B] Private communication.
[1] Raschig. Chem. Zeit., 1907, 31, 926.
[2] Rideal. S. J. Roy. San. Inst., 1910, 31, 33-45.
[3] Race. J. Amer. Waterworks Assoc., 1918, 5, 63.
[4] Race. Eng. and Contr., 1917, 47, 251.
[5] Contract Record. Aug. 15, 1917, 696.
[6] Muspratt and Smith. J. Soc. Chem. Ind., 1898, 17, 529.
[7] Dakin and Dunham. Brit. Med. Jour., 1917, No. 2943, 682.
The object of adding chlorine or chlorine compounds to water is for the purpose of destroying any pathogenic organisms that may be present. In a few instances some collateral advantages are also obtained but, in general, no other object is aimed at or secured.
Chlorination does not change the physical appearance of water; it does not reduce or increase the turbidity nor does it decrease the colour in an appreciable degree.
The chemical composition is also practically unaltered. When bleach is used there is a proportionate increase in the hardness but the amount is usually trifling and is without significance. During 1916 when the Ottawa supply was entirely treated with bleach at the rate of 2.7 parts per million (0.92 p.p.m. of available chlorine) the average increase in the total hardness as determined by the soap method was 2.5 parts per million.
When chlorine is added to prefiltered water, as an adjunct to filtration, an increase in the number of gallons filtered per run has been noted at some plants. This increase is not so great with rapid as with slow sand filters but in some instances it has led to appreciable economies.
Walden and Powell[1] of Baltimore, found that the addition of a quantity of bleach equal to approximately 0.50 p.p.m. of available chlorine enabled the alum to be reduced from 0.87 to 0.58 grain per gallon. The percentage of water used in washing the filters was also reduced, from 4.1 per cent[133] to 2.9 per cent, whilst the filter runs were increased on the average by one hour and ten minutes. The net saving in coagulant alone amounted to 30 cents per million gallons.
Clark and De Gage[2] found that the use of smaller amounts of coagulant during the period of combined disinfection and coagulation resulted in an increase of nearly 25 per cent in the quantity of water passed through the filter between washings, and also in a material reduction of the cost of chemicals, which averaged $2.62 per million gallons for combined disinfection and coagulation as against $4.86 for coagulation alone. The water used in these experiments was obtained from the Merrimac River at Lawrence.
The effect of hypochlorite on the reduction of algæ growths on slow sand filters was first noticed by Houston during the treatment of the Lincoln supply in 1905. Two open service reservoirs were fed with treated water and were themselves dosed from time to time. “Previous to 1905 they developed seasonally most abundant growths, but during the hypochlorite treatment it was noticed that they remained bright, clear, and remarkably free from growths” (Houston[3]).
Ellms,[4] of Cincinnati, has also noted the effect of hypochlorite on algæ. When the bleach was added to the coagulated water the destruction of the plankton was not as satisfactory as had been anticipated and it was found that large doses destroyed the coating of the sand particles and rendered the filters less efficient. The use of bleach in the filtered water basin was more successful and cleared it of troublesome growths.
In 1916, during the treatment of the London Supply with bleach (dosage 0.5 p.p.m. of available chlorine), Houston made further observations on this point. The Thames water, taken at Staines, had previously been stored for considerable periods in reservoirs, but this necessitated lifting the water by pumps which consumed large quantities of coal that were urgently needed for national purposes. As a war measure,[134] the storage was eliminated and the water treated with hypochlorite at Staines and allowed to flow by gravitation to the various works where the slow sand filters are situated. The treatment resulted in a marked reduction in the growths of algæ, the reduction in the area of filters cleaned in 1916 (June to September) as compared with 1915 being as follows:
| Filter Works. | Percentage Reduction (Approximate). |
| Grand Junction (Hampton) | 6 |
| Grand Junction (Kew) | 43 |
| East London (Sunbury) | 30 |
| Kempton Park | 33 |
| West Middlesex | 56 |
A portion of this reduction can probably be attributed to the elimination of storage.
Chlorination, by decreasing the load on filter beds, has enabled the rate of filtration to be increased in some cases. This increased capacity, which would otherwise have necessitated additional filter units, has been obtained without any further capital outlay. At Pittsburg (Johnson[5]) the rate of filtration, after cleaning, was increased 250,000 gallons each hour until the normal rate was reached; restored beds were maintained at a 250,000 gallon rate for one week. After the introduction of chlorination it was found possible to increase the rates more rapidly without adversely affecting the purity of the mixed filter affluents.
Hygienic Results. Evidence as to the actual reduction of the number of such pathogenic germs as B. typhosus in water supplies by chlorination is most readily found in the death rates from typhoid fever in cities that have no other means of water purification. In some cases this evidence is necessarily of a circumstantial nature; in others it is definite and conclusive.
Some of the earlier results of the effect of chlorination on typhoid morbidity and mortality rates were compiled by[135] Jennings[6] and others have been published by Longley.[7] These data have been brought up to date in Table XXXI and other statistics added.
| Average Typhoid Death Rate Per 100,000 Population | ||||||
| City. | Commenced Chlorination. |
Before Using. | After Using. | Percentage Reduction. |
||
| Period. | Rate. | Period. | Rate. | |||
| Baltimore | June 1911 | 1900-10 | 35.2 | 1912-15 | 22.2 | 36 |
| Cleveland | Sept. 1911 | 1900-10 | 35.5 | 1912-16 | 8.2 | 77 |
| Des Moines | Dec. 1910 | 1905-10 | 22.7 | 1911-13 | 13.4 | 41 |
| Erie | Mar. 1911 | 1906-10 | 50.6 | 1912-14 | 15.0 | 70 |
| Evanston, Ill. | Dec. 1911 | 1908-11 | 29.0 | 1912-13 | 14.5 | 50 |
| Jersey City | Sept. 1908 | 1900-17 | 18.7 | 1909-16 | 8.4 | 55 |
| Kansas City, Mo. | Jan. 1911 | 1900-10 | 42.5 | 1911-16 | 14.2 | 66 |
| Omaha, Neb. | May 1910 | 1900-09 | 22.5 | 1911-16 | 10.6 | 53 |
| Trenton | Dec. 1911 | 1907-11 | 46.0 | 1911-14 | 28.7 | 35 |
| Montreal | Feb. 1910 | 1906-10 | 40.0 | 1911-16 | 25.0 | 37 |
| Toronto | Apr. 1911 | 1906-10 | 31.2 | 1912-16 | 7.8 | 75 |
| Ottawa | Sept. 1912 | 1906-10 | 34.0 | 1913-17 | 17.0 | 50 |
The figures given in this table show the effect of chlorination only; no other form of purification was used during the periods given, except at Toronto where a portion of the supply has been subjected to filtration.
It will be seen that since chlorination was adopted the typhoid death rates have been reduced by approximately 50 per cent and that the averages for the period after treatment are almost invariably less than 20 per 100,000, a figure that a few years ago was regarded as satisfactory. The average death rate for the last available year is 11 per 100,000, a result that is even more satisfactory and exceeds the anticipations of the most optimistic of sanitarians.
A portion of the reduction in the typhoid rates is no doubt due to improvements in general sanitary conditions but the reduction is much greater than can be accounted for in that[136] manner alone and in many cases there was a sharp decline immediately following the commencement of chlorination.
In a few instances there is evidence that chlorination has reduced the typhoid rates of cities previously supplied with filtered water. Diagram X, drawn from data supplied by Dr. West, of the Torresdale Filtration Plant, shows the effect of disinfecting the filter effluents at Philadelphia.
During the years 1909-10-11, when practically the whole of the city supply was filtered, the average typhoid death rate was 18, but when the water was also chlorinated, in 1914-15-16, the rate was only 7, a reduction of 61 per cent.
The figures in Table XXXII show that the Torresdale filters, during 1915-16 were unable to adequately purify the water and that chlorination was necessary.
| (Torresdale) | ||||||||||||
| Oxygen Con- sumed. |
Colour. | Tur- bidity. |
Bacteria Per Cubic Centimeter. |
B. coli communis Per Cent Positive Tests. |
Added Chlorine Parts Per Million. |
|||||||
| Untreated. | Treated. | Untreated. | Treated. | |||||||||
| Gela- tine. |
Agar. | Gela- tine. |
Agar. | 10 c.cms. |
1 c.cm. |
10 c.cms. |
1 c.cm. |
|||||
| 1915 | 1.70 | 12 | 0.6 | 141 | 30 | 28 | 14 | 66 | 24 | 5 | 0.3 | 0.18 |
| 1916 | 1.90 | 12 | Nil. | 88 | 23 | 38 | 11 | 49 | 16 | 7.4 | 1.9 | 0.15 |
In Diagram XI the typhoid death rates of Columbus, Ohio, and New Orleans are shown to exemplify conditions that have not been improved by chlorination. The endemic condition of typhoid in Columbus was brought to an abrupt conclusion by the installation and operation of the softening and filter plant in September, 1908, and no further reduction followed the introduction of chlorination in December, 1909.
In New Orleans the typhoid rate decreased on the inception of the new water works system in 1909 and again after the installation of the Carrollton filters in 1912. The product of the filtration plants has always been above suspicion but aftergrowths occasionally developed and the bacterial count then exceeded the United States Treasury standard. To overcome this difficulty, hypochlorite was used in 1915, but, as was anticipated, it had no effect on the typhoid rate. The high rate in New Orleans is largely due to outside cases received for hospital treatment and to other circumstances beyond the control of the water and sewerage department.
[138]In all the examples previously cited, the evidence as to the effect of chlorination on typhoid mortality rates is circumstantial but, taken as a whole, it is fairly conclusive. In the examples to be considered next the evidence is more direct.
One of the most conclusive experiments as to the beneficial effect of chlorination is that reported by Young[8] of Chicago. The water supply of Chicago was obtained from Lake Michigan by means of intake pipes and pumped to various parts of the city. The distribution system was divided into four districts and, although there was a certain amount of mixing along the borders, the water supplied to each district was substantially separate. The rapid and progressive decline in the typhoid rate of Chicago (from 19[139] in 1900 to 10.8 in 1911) subsequent to the diversion of the city sewage from the lake, led to the assumption that water-borne typhoid had ceased to be of any moment. Early in 1912, however, permission was secured to chlorinate the supply of one district (No. 1) and the treatment was continued until December when the solutions commenced to freeze.[140] Diagram XII shows the effect of the treatment on the autumnal increase in District No. 1 as compared with the other three districts. The autumnal increase was calculated from the excess of typhoid incidence for July to November inclusive, over that for February to June inclusive.
These results demonstrate in a most striking manner the beneficial effect of chlorination. The general conditions, with the exception of the raw water supply, were approximately the same in all four districts. Diagram XIII shows that the raw water supply of District No. 1 was slightly worse than any of the others, 21.8 per cent of the samples from District No. 1 containing B. coli in 1 c.cm. as compared with 21.0 per cent in the most polluted supply of the other districts.
The results obtained at Ottawa are also conclusive. Following two epidemics of typhoid fever in 1911 and 1912, caused by breaks in the intake pipe, hypochlorite treatment was commenced and has been in continuous operation until February, 1917, when chloramine treatment was substituted. The dosage has been so regulated as to assure a high degree of purity at all times in the water delivered to the mains and as evidence of this it might be mentioned that the average[141] B. coli index (calculated by Phelps’ method) for the years 1916 and 1917 was only 0.27 per 100 c.cms. The typhoid rates for the five years preceding the epidemic years and for a similar subsequent period are given in Diagram XIV.
The diagram shows that there has been a constant reduction in the city typhoid rate since the last severe epidemic with the exception of the year 1915. The high rate of that year was caused by a localised epidemic started by polluted well water and spread by flies from an unsewered area. This outbreak was the cause of about seven deaths registered during that year (population 100,000).
The objection might be raised that if the reduction of the typhoid rate were due to the water treatment, the decline should have been abrupt and not a gradual one. It is probable that there has been practically no water-borne typhoid in[142] the city since chlorination was commenced but this fact is masked by cases from other sources. During 1911 and 1912 over 3,500 cases of typhoid were reported, of which an appreciable number would become carriers for various periods of time. As these carriers decreased the number of cases infected by them would also decrease and so account for a gradually declining death rate.
It might be further objected that the reduced typhoid rate is due to a general improvement in the sanitary conditions. If the death rate from causes other than typhoid can be regarded as a measure of the general sanitary conditions it is obvious from the data in Table XXXIII that the improvement in the typhoid rate is immeasurably greater than can be ascribed to that cause.
| Cause. | Rate Per 100,000 | Percentage | ||||
| 1908-12 | 1913-17 | Reduction | Increase | |||
| Total[A] | 14 | .90 | 14 | .78 | 1.2 | ... |
| Typhoid, total | 34 | [B] | 17 | 50.0 | ... | |
| Typhoid, city | 26 | [B] | 8 | 69.2 | ... | |
| Pneumonia | 100 | 107 | ... | 7.0 | ||
| Tuberculosis | 133 | 138 | ... | 3.7 | ||
| Diarrhœa and Enteritis under 2 years | 139 | 128 | 7.9 | ... | ||
| [A] Rate per 1,000. | ||||||
| [B] 1906-10, epidemic years 1911-12 excluded. | ||||||
One further objection might be made: that the raw water was not infected during 1913-17 or infected to a smaller extent than during the previous period. Attempts to isolate B. typhosus from the raw water have invariably been futile but their presence in 1914 might be inferred from the fact that during the latter part of the summer of that year an epidemic of typhoid fever occurred at Aylmer, a village that discharges its sewage into the Ottawa River about six miles above the Ottawa intake. Hull, situated on the opposite[143] bank of the river and having a population of 20,000, takes its water supply from the same channel that supplies Ottawa but at a point a few hundred feet further down stream. During November and December, 1914, some 200 cases of typhoid fever (incidence 1,000 per 100,000) occurred in Hull as compared with 28 in Ottawa. As the Ottawa intake is situated between the Hull intake and the outlet of the Aylmer sewer it is incredible that the Ottawa raw water was not also infected.
In 1916 a liquid chlorine plant was installed in Hull, but in 1917, owing to an accident, it was out of commission for a short period and at least 100 cases of fever developed during the following month. During the same period only two cases were reported in Ottawa and of these one was obviously contracted outside the city.
In view of the preceding facts it must be granted that the improvement in the typhoid rate of Ottawa can be definitely attributed to an improvement in the water supply caused by chlorination.
The efficacy of chlorination to prevent and check epidemics of water-borne typhoid has never been doubted. Innumerable instances could be cited in which the prompt treatment of large public supplies has promptly checked outbreaks that threatened to assume serious proportions and there is no doubt that the extremely low typhoid morbidity rate on the Western Front of the European battlefield is partially due to the extensive and rigorous chlorination measures that have been instigated. Prophylactic vaccination and the prompt isolation of typhoid carriers have largely contributed to the wonderful results obtained but due credit must also be given to the systematic purification and treatment of water supplies. Similar results have been obtained at training camps in Canada and in other countries by effective treatment with either liquid chlorine or hypochlorite.
Since the inception of water chlorination in America in 1908, the merit of the method has been very generally recognized[144] throughout the Continent but was regarded with scepticism in Europe, except as a temporary expedient, until the results obtained by the military forces compelled more general recognition. Before the war, chlorination of water supplies in England was only practised in a few isolated and relatively unimportant instances; in 1917, practically the whole supply of London was chlorinated and at Worcester a similar treatment has been recommended to enable the slow sand filters to be operated at higher rates without reducing the quality of the water supplied to the consumers.
Use and Abuse of Chlorine. Inasmuch as chlorination has no beneficial effect on water except the reduction of the bacterial content it should be used for this purpose only and under such conditions as permit the operations to be under full control at all times. The supplies that can be most efficiently and safely treated are those that are relatively constant in chemical composition and bacterial pollution. Changes in volume can be dealt with by automatic apparatus but sudden changes in organic and bacterial content require a change of dosage that cannot be made by any mechanical appliance. Long experience and accurate meteorological records may in some cases enable those in charge of chlorination plants to anticipate changes in the conditions of the water supply, but it is always preferable to provide a positive method of preventing sudden changes by using chlorination merely as an adjunct to other processes of purification. Unpurified waters that are objectionable on account of their bacterial content only are very rare, as the cause that produces the bacterial pollution usually produces other conditions that are equally objectionable though not so dangerous to health. Sudden storms in summer, or sudden thaws in winter, usually cause large increments in turbidity accompanied by soil washings that often carry appreciable quantities of fæcal matter into surface water supplies. Lake supplies often suffer in the same manner and sewage, which[145] during normal conditions is carried safely away from water intakes, obtains access to the supply. If the dosage is maintained at a level sufficiently high to meet these abnormal conditions, complaints as to taste and odour would ensue, and in general, such a practice is impossible. Some supplies have been chlorinated successfully for years but the principle of using chlorination as the first and last line of defence cannot be recommended. Success can only be obtained by eternal vigilance and the responsibility for results is more than water works officials should be called upon to assume.
Chlorination is an invaluable adjunct to other forms of water purification and it is not improbable that, in the future, filter plants will be designed to remove æsthetic objections at the lowest possible cost and that chlorination will be relied upon for bacterial reduction. Chlorination is the simplest, most economical, and efficient process by which the removal of bacteria can be accomplished and there is no valid reason why it should not be used for that purpose.
The popularity of this process has suffered through the efforts of over zealous enthusiasts who have been unable either to recognize its limitations or to appreciate the fact that a domestic water supply should be something more than a palatable liquid that does not contain pathogenic organisms. Every system of water purification has its limited sphere of utility and chlorination is no exception to the rule.
[1] Weldon and Powell. Eng. Rec., 1910, 61, 621.
[2] Clark and De Gage, 41st Annual Rpt. Mass. State B. of H. 1910.
[3] Houston. 12th Research Rpt. Metropolitan Water Board, London.
[4] Ellms. Eng. Rec., 1911, 63, 388.
[5] Johnson. Eng. Rec., 1911, 64, No. 16.
[6] Jennings. 8th Inter. Congr. Appl. Chem., 26, 215.
[7] Longley. J. Amer. Waterworks Assoc., 1915, 2, 679.
[8] Young. J. Amer. Public Health Assoc., 1914, 4, 310.
Reagents. 1. Tolidine solution. One gram of o-tolidine, purified by recrystallization from alcohol, is dissolved in 1 litre of 10 per cent hydrochloric acid.
2. Copper sulphate solution. Dissolve 1.5 grams of copper sulphate and 1 c.cm. of concentrated sulphuric acid in distilled water and dilute the solution to 100 c.cms.
3. Potassium bichromate solution. Dissolve 0.025 gram of potassium bichromate and 0.1 c.cm. of concentrated sulphuric acid in distilled water and dilute the solution to 100 c.cms.
Procedure. Mix 1 c.cm. of the tolidine reagent with 100 c.cms. of the sample in a Nessler tube and allow the solution to stand at least five minutes. Small amounts of free chlorine give a yellow and larger amounts an orange colour.
For quantitative determination compare the colour with that of standards in similar tubes prepared from the solutions of copper sulphate and potassium bichromate. The amounts of solution for various standards are indicated in the following table:
| Chlorine. Parts per million. |
Solution of Copper Sulphate. c.cms. |
Solution of Potassium Bichromate. c.cms. |
|
| 0 | .01 | 0.0 | 0.8 |
| .02 | 0.0 | 2.1 | |
| .03 | 0.0 | 3.2 | |
| .04 | 0.0 | 4.3 | |
| .05 | 0.4 | 5.5 | |
| .06 | 0.8 | 6.6 | |
| .07 | 1.2 | 7.5 | |
| .08 | 1.5 | 8.7 | |
| .09 | 1.7 | 9.0 | |
| .10 | 1.8 | 10.0 | |
| .20 | 1.9 | 20.0 | |
| .30 | 1.9 | 30.0 | |
| .40 | 2.0 | 38.0 | |
| .50 | 2.0 | 45.0 | |
A
Adams, 66, 82
B
Bassenge, 9
Baxter, 4
Berge, 9
Berthollet, 1
Bevan, 29
Bonjean, 36
Bray, 24
Breteau, 26
Bucholtz, 5
C
Catlett, 99
Clark, 53, 133
Comte, 47
Cross, 29
Cruikshank, 3
D
Dakin, 22, 28, 129
Darnall, 89
Davy, 1
DeGage, 53, 133
DeMorveau, 3
Dibden, 6
Diénert, 48
Dienheim-Brochoki, 105
Dowell, 24
Dunbar, 6
Dunham, 129
Dupré, 5
Dusch, 4
E
Ellms, 34, 83, 84, 133
Elmanovitsch, 36
Elsner, 6
Evans, 84
F
Faraday, 103
Fischer, 16
Forcrand, 103
Fuller, G. W., 11
G
Gascard, 47
Griffen, 17, 79
H
Haberkorn, 5
Hale, 80, 100
Harrington, 34, 65
Hauser, 83, 84
Hedallen, 17, 79
Heise, 36
Henry, 2
Hermite, 5
Hewlett, 9
Hooker, 72
Horrocks, 48
Houston, 8, 59, 71, 133
Hsu, 21
J
Jackson, 91, 99
Jakowkin, 26
Jennings, 135
Johnson, 11, 134
Jordan, H. E., 57
K
Kanthack, 6
Kauffman, 9
Kellerman, 7
[152]Kershaw, 107
Kienle, 65, 66, 90, 99
Kimberly, 7
Klein, 5
Koch, 4
Kolessnikoff, 16
Kranejuhl, 7
Kuhn, 5
Kurpjuivat, 7
L
Landolt, 105
Langer, 10
Laroche, 47
Lavoisier, 1, 15
Leal, 16
Lehmann, 101
LeRoy, 83
Letton, 64
Longley, 43, 135
Lunge, 105
Lyon, 24
M
Marshall, 102
Massy, 48
Meadows, 112, 114
McCrady, 130
McGowan, 8
McLintock, 5
Mohler, 31
Mohr, 79
Moor, 9
Muspratt, 126
N
Nesfield, 8, 89
Nissen, 30
Norton, 21
Novey, 23
Noyes, 24
O
Ornstein, 90
Orticoni, 36
P
Pedler, 103
Percy, 3
Pettenkofer, 101
Phelps, 7, 17, 82
Pitcher, 112
Plucker, 10
Powell, 132
Pratt, 7
Proskauer, 6, 16
R
Rabs, 110
Race, 36, 110, 116
Raschig, 115
Rickard, 108
Rideal, E. K., 84
Rideal, S., 6, 9, 21,
22, 60, 115, 116
Roscoe, 5
Roozeboom, 103
Rouquette, 36
Ruffer, 5
S
Sandman, 56
Scheele, 1, 15
Schroder, 4
Schuder, 10
Schumacher, 7
Schumburg, 10
Schwann, 4
Schwartz, 7
Semmelweiss, 4
Sickenberger, 9
Smeeton, 53
Smith, 126
T
Tennant, 2
Thomas, 53, 56
Thresh, 87
Tiernan, 92
Tolman, 111
Traube, 9
V
Valeski, 36
Von Loan, 90
W
Walden, 132
Walker, 87
Wallace, 92
[153]Wallis, 83
Warouzoff, 16
Watt, 2, 3, 15, 106
Webster, 5, 105
Wesbrook, 31, 44, 53
West, 91, 99, 136
Whittaker, 31
Winkler, 84
Winogradoff, 16
Winslow, 110
Woodhead, 7
Woolf, 5
Y
Young, 138
Z
Zirn, 6
A
Absorption of chlorine by water, 35
Abuse of chlorination, 144
Acids, effect of, 19, 21
Action of chlorine, 16
Admixture, effect of, 39
Aftergrowths, 55
accelerated growth, 58
B. coli in, 57
effect of liquid chlorine, 99
views as to nature of, 56
Algæ, effect of chlorine on, 133
Alkalies, effect of, 19, 20
Allen-Moore cell, 111
Ammonia, and chlorine, 24
and sodium hypochlorite, 114
effect on bleach, 21
effect on oxidising action, 21
soda process, 2
Antichlors, 86
Antiseptics, early work on, 3
chlorine as an, 50
Application of chlorine, point of, 43
Auto-suggestion, 62
B
B. choleræ suis, 31
B. cloacæ, 31
B. coli, aftergrowths, 57
in sewage, 6, 7
in water, 9, 28, 31
standard, 46
viability of, 52, 55
B. cuticularis, 53
B. fæcalis alkaligenes, 31
B. enteritidis, 31
B. enteritidis sporogenes, 53
B. lactis ærogenes, 31
B. subtilis, 53
B. tetani, 9
B. typhosus, 9, 10, 30, 31
Bacteria surviving chlorination, 50
aftergrowths, 55
nature of, 53
spores, 57
Benzidine, 83
Bleach, analysis of solution, 79
as deodourant, 3, 6
as sewage disinfectant, 6, 7
at Adrian, 11
at Boonton, 11, 16
at Bubbly Creek, 11
composition, 14
decomposition of, 25
discovery, 2
germicidal velocity, 20, 21
hydrolysis, 18, 19
production, 3
stability of, 17
toxic action, 22
treatment, 72
control of, 78
cost, 86
dosage regulation, 75
in France, 78
losses in, 81
mixing tank, 73
plant design, 72
storage tank, 75
Brest experiments, 5
[156]C
Carnallite, 1
Chicago, typhoid rate, 138
Chloramine, 114
at Denver, 124, 126
at Ottawa, 28, 116
contact period, 123
cost of, 124
decomposition of, 126
experimental results, 119
germicidal power, 116
operation of process, 126
plant design, 120
preparation of, 115
ratio of chlorine and ammonia, 116, 122
tastes and odours, 28, 64, 117
toxic action, 22, 29
Chlorides, effect of, 20
Chlorine, and ammonia, 24, 25
discovery of, 1
disinfection, effect of pabulum, 4
general reactions, 28
hydrate, 103
detection of, 81
effect on flowers, 68
estimation of, 81
in sanitary work, 4
medicinal dose, 67
oxygen equivalent, 23
liquid, 89
advantages of, 97
cost of treatment, 101
disadvantages of, 101
germicidal efficiency, 99
machines, 89
peroxide, 9
water, 102
corrosion of pipes, 69
damage to seeds, 68
decomposition of, 15
heat of formation, 27
Chlorometer, 84
Chloros, 8
Chlorozone, 105
Colour, effect on dosage, 33
Columbus, typhoid rates, 137
Complaints, 62
Contact period, effect on dosage, 44
effect on taste, 43
usual practice, 45
Cost of bleach plant, 85
bleach treatment, 86
liquid chlorine treatment, 101
Crossness experiments, 5
D
Dayton cell, 107
DeChlor filters, 87
Denver, chloramine treatment, 124, 126
Dichloramine, 128
Disinfectants, 50
Disinfection, early views of, 3
Dosage, 30
determination of, 46
effect of, admixture, 39
colour, 33
contact period, 43
initial contamination, 32
light, 45
oxidisable matter, 32
standard of purity, 30, 32
temperature, 34, 36
turbidity, 45
for military work, 48
regulation of bleach, 75
relation to oxygen absorbed, 36
tanks, 75
E
Eau de Javelle, 3, 47
Electrical conductivity of treated water, 70
Electrolysed sea water, 5
Electrolytic hypochlorite, 2, 104
Bradford, 5
Brest, 5
Brewster, 6, 105
cost of, 113
[157]Electrolytic hydrochlorite, Crossness, 5
discovery of, 3
diaphragm cells, 110
early use of, 5
efficiency of, 109
Havre, 5
non-diaphragm cells, 106
Electrozone, Brewster, 6
Maidenhead, 6
Tonetta Creek, 6
F
Filter effluents, chlorination of, 34
Filters, effect on beds, 60
effect on runs, 132
Fish, effect on, 8, 67, 68
G
Germicidal velocity, effect of acids, 21
alkalies, 20
ammonia, 21
chlorides, 20
Guildford, chlorination at, 9
H
Haas and Oettel cell, 108
Halazone, 128
Hardness, effect of chlorine on, 132
Havre experiments, 5
Hermite fluid, 5
Hexamethyl-p-aminotriphenylmethane, 83
Historical, 1
Hooghly River, 7
Hydrazine, 126
Hydrogen peroxide, 24
Hydrolysis of hypochlorites, effect of, acids, 19
alkalies, 19
chlorides, 20
Hygienic results, 134
Hypochlorous acid, 17
decomposition of, 24, 25, 26
hydrolytic constant, 18
I
Initial contamination, effect on dosage, 32
Intestinal organisms, viability of, 52
Iodoform taste, 65
Iron salts, effect on dosage, 33
J
Jersey City, court case, 11, 16
K
Kellner cell, 108
L
Labarraque solution, 105
Leavitt-Jackson machine, 91
Leblanc process, 2
Light, effect on dosage, 45
Lincoln, chlorination at, 8, 59
Liquid chlorine, advantages of, 97
and tastes, 65
effect of temperature on, 95
machines, 89
dry feed, 94
E. B. G. Co., 91
Leavitt-Jackson, 91
operation of, 95
Wallace and Tiernan, 92
L’Orient, experiments at, 5
M
M. agilis, 53
Maidstone, use of bleach at, 8
Margin of safety for taste and odour, 64
Material for bleach plants, 74
Military work, bleach method for, 78
chlorine water, 103
dosage for, 47, 48, 78
early European, 10
liquid chlorine, 102
typhoid reduction, 143
use of chlorine in, 8
Mixing tank for bleach, 73
[158]Moisture, effect on chlorine gas, 16
Montreal, dosage at, 34
electrolytic cells, 112
N
Nascent oxygen hypothesis, 17
Nelson cell, 111
Neva River, 36
New Orleans, typhoid rates, 137
New York, bacteria surviving treatment, 53
bleach efficiency, 100
liquid chlorine plant, 97
Nitrites, effect on dosage, 33
Nitrogen trichloride, 24, 128
O
Odours, effect of contact period on, 43
nature of, 63
Ottawa, aftergrowths at, 57
bleach plant efficiency, 100
chloramine plant, 120
chloramine results, 121
sludge trouble, 65
typhoid rates, 140
Oxidisable matter, effect on dosage, 32, 36
Oxychloride, Guildford, 9
Middlekerke, 9
Ostend, 9
Ozone, 24
P
Philadelphia and chlorination, 136
Pipe corrosion, 69
Pittsburg report, 71
Plumbo solvency, 71
P. mirabilis, 31
Potassium permanganate, 23
Puerperal fever in Vienna, 4
Pumps, for admixture, 41
R
Red Bank, sewage disinfection at, 7
Reversed ratio of counts, 54
S
Sewage disinfection at Baltimore,
Berlin, 7
Boston, 7
Brewster, 6
Hamburg, 6
Maidenhead, 6
Sludge, as cause of complaints, 65
Sodium bisulphite, 86
Sodium chloride, deposits, 1
decomposition of, 106
Sodium hypochlorite, 105
decomposition of, 26
effect of ammonia on, 21
hydrolysis of, 26
Sodium thiosulphate, 87
Standard of purity, 30
Storage tanks, 75
Sulphuretted hydrogen, 33
Sylvine, 1
T
Tannin, 67
Tastes, effect of contact period on nature of, 63
Temperature, effect on absorption of chlorine, 35, 38
bleach deterioration, 72
dosage, 34, 36
germicidal velocity, 38
pressure of liquid chlorine, 96
tastes and odours, 66
Thermophylic organisms, 54
Tolidine, 82
Toxic action of chlorine, 22, 29
Turbidity, effect on dosage, 45
effect of chlorine on, 132
U
Use of chlorination, 144
W
Water mains, disinfection of, 8
Well water, 7
Worcester, chlorination at, 11
Worthing experiments, 5
For convenience a list of the Wiley Special Subject Catalogues, envelope size, has been printed. These are arranged in groups—each catalogue having a key symbol. (See Special Subject List Below.) To obtain any of these catalogues, send a postal using the key symbols of the Catalogues desired.
1—Agriculture. Animal Husbandry. Dairying. Industrial Canning and Preserving.
2—Architecture. Building. Masonry.
3—Business Administration and Management. Law. Industrial Processes: Canning and Preserving; Oil and Gas Production; Paint; Printing; Sugar Manufacture; Textile.
4a General; Analytical, Qualitative and Quantitative; Inorganic; Organic.
4b Electro- and Physical; Food and Water; Industrial; Medical and Pharmaceutical; Sugar.
5a Unclassified and Structural Engineering.
5b Materials and Mechanics of Construction, including: Cement and Concrete; Excavation and Earthwork; Foundations; Masonry.
5c Railroads; Surveying.
5d Dams; Hydraulic Engineering; Pumping and Hydraulics; Irrigation Engineering; River and Harbor Engineering; Water Supply.
5e Highways; Municipal Engineering; Sanitary Engineering; Water Supply. Forestry. Horticulture, Botany and Landscape Gardening.
6—Design. Decoration. Drawing: General; Descriptive Geometry; Kinematics; Mechanical.
7—General and Unclassified; Batteries; Central Station Practice; Distribution and Transmission; Dynamo-Electro Machinery; Electro-Chemistry and Metallurgy; Measuring Instruments and Miscellaneous Apparatus.
8—Astronomy. Meteorology. Explosives. Marine and Naval Engineering. Military. Miscellaneous Books.
9—General; Algebra; Analytic and Plane Geometry; Calculus; Trigonometry; Vector Analysis.
10a General and Unclassified; Foundry Practice; Shop Practice.
10b Gas Power and Internal Combustion Engines; Heating and Ventilation; Refrigeration.
10c Machine Design and Mechanism; Power Transmission; Steam Power and Power Plants; Thermodynamics and Heat Power.
11—Mechanics.
12—Medicine. Pharmacy. Medical and Pharmaceutical Chemistry. Sanitary Science and Engineering. Bacteriology and Biology.
13—General; Assaying; Excavation, Earthwork, Tunneling, Etc.; Explosives; Geology; Metallurgy; Mineralogy; Prospecting; Ventilation.
End of the Project Gutenberg EBook of Chlorination of Water, by Joseph  Race

*** END OF THIS PROJECT GUTENBERG EBOOK CHLORINATION OF WATER ***

***** This file should be named 37389-h.htm or 37389-h.zip *****
This and all associated files of various formats will be found in:
        http://www.gutenberg.org/3/7/3/8/37389/

Produced by Bryan Ness, Harry Lamé and the Online
Distributed Proofreading Team at http://www.pgdp.net (This
book was produced from scanned images of public domain
material from the Google Print project.)


Updated editions will replace the previous one--the old editions
will be renamed.

Creating the works from public domain print editions means that no
one owns a United States copyright in these works, so the Foundation
(and you!) can copy and distribute it in the United States without
permission and without paying copyright royalties.  Special rules,
set forth in the General Terms of Use part of this license, apply to
copying and distributing Project Gutenberg-tm electronic works to
protect the PROJECT GUTENBERG-tm concept and trademark.  Project
Gutenberg is a registered trademark, and may not be used if you
charge for the eBooks, unless you receive specific permission.  If you
do not charge anything for copies of this eBook, complying with the
rules is very easy.  You may use this eBook for nearly any purpose
such as creation of derivative works, reports, performances and
research.  They may be modified and printed and given away--you may do
practically ANYTHING with public domain eBooks.  Redistribution is
subject to the trademark license, especially commercial
redistribution.


*** START: FULL LICENSE ***

THE FULL PROJECT GUTENBERG LICENSE
PLEASE READ THIS BEFORE YOU DISTRIBUTE OR USE THIS WORK

To protect the Project Gutenberg-tm mission of promoting the free
distribution of electronic works, by using or distributing this work
(or any other work associated in any way with the phrase "Project
Gutenberg"), you agree to comply with all the terms of the Full Project
Gutenberg-tm License (available with this file or online at
http://gutenberg.org/license).


Section 1.  General Terms of Use and Redistributing Project Gutenberg-tm
electronic works

1.A.  By reading or using any part of this Project Gutenberg-tm
electronic work, you indicate that you have read, understand, agree to
and accept all the terms of this license and intellectual property
(trademark/copyright) agreement.  If you do not agree to abide by all
the terms of this agreement, you must cease using and return or destroy
all copies of Project Gutenberg-tm electronic works in your possession.
If you paid a fee for obtaining a copy of or access to a Project
Gutenberg-tm electronic work and you do not agree to be bound by the
terms of this agreement, you may obtain a refund from the person or
entity to whom you paid the fee as set forth in paragraph 1.E.8.

1.B.  "Project Gutenberg" is a registered trademark.  It may only be
used on or associated in any way with an electronic work by people who
agree to be bound by the terms of this agreement.  There are a few
things that you can do with most Project Gutenberg-tm electronic works
even without complying with the full terms of this agreement.  See
paragraph 1.C below.  There are a lot of things you can do with Project
Gutenberg-tm electronic works if you follow the terms of this agreement
and help preserve free future access to Project Gutenberg-tm electronic
works.  See paragraph 1.E below.

1.C.  The Project Gutenberg Literary Archive Foundation ("the Foundation"
or PGLAF), owns a compilation copyright in the collection of Project
Gutenberg-tm electronic works.  Nearly all the individual works in the
collection are in the public domain in the United States.  If an
individual work is in the public domain in the United States and you are
located in the United States, we do not claim a right to prevent you from
copying, distributing, performing, displaying or creating derivative
works based on the work as long as all references to Project Gutenberg
are removed.  Of course, we hope that you will support the Project
Gutenberg-tm mission of promoting free access to electronic works by
freely sharing Project Gutenberg-tm works in compliance with the terms of
this agreement for keeping the Project Gutenberg-tm name associated with
the work.  You can easily comply with the terms of this agreement by
keeping this work in the same format with its attached full Project
Gutenberg-tm License when you share it without charge with others.

1.D.  The copyright laws of the place where you are located also govern
what you can do with this work.  Copyright laws in most countries are in
a constant state of change.  If you are outside the United States, check
the laws of your country in addition to the terms of this agreement
before downloading, copying, displaying, performing, distributing or
creating derivative works based on this work or any other Project
Gutenberg-tm work.  The Foundation makes no representations concerning
the copyright status of any work in any country outside the United
States.

1.E.  Unless you have removed all references to Project Gutenberg:

1.E.1.  The following sentence, with active links to, or other immediate
access to, the full Project Gutenberg-tm License must appear prominently
whenever any copy of a Project Gutenberg-tm work (any work on which the
phrase "Project Gutenberg" appears, or with which the phrase "Project
Gutenberg" is associated) is accessed, displayed, performed, viewed,
copied or distributed:

This eBook is for the use of anyone anywhere at no cost and with
almost no restrictions whatsoever.  You may copy it, give it away or
re-use it under the terms of the Project Gutenberg License included
with this eBook or online at www.gutenberg.org

1.E.2.  If an individual Project Gutenberg-tm electronic work is derived
from the public domain (does not contain a notice indicating that it is
posted with permission of the copyright holder), the work can be copied
and distributed to anyone in the United States without paying any fees
or charges.  If you are redistributing or providing access to a work
with the phrase "Project Gutenberg" associated with or appearing on the
work, you must comply either with the requirements of paragraphs 1.E.1
through 1.E.7 or obtain permission for the use of the work and the
Project Gutenberg-tm trademark as set forth in paragraphs 1.E.8 or
1.E.9.

1.E.3.  If an individual Project Gutenberg-tm electronic work is posted
with the permission of the copyright holder, your use and distribution
must comply with both paragraphs 1.E.1 through 1.E.7 and any additional
terms imposed by the copyright holder.  Additional terms will be linked
to the Project Gutenberg-tm License for all works posted with the
permission of the copyright holder found at the beginning of this work.

1.E.4.  Do not unlink or detach or remove the full Project Gutenberg-tm
License terms from this work, or any files containing a part of this
work or any other work associated with Project Gutenberg-tm.

1.E.5.  Do not copy, display, perform, distribute or redistribute this
electronic work, or any part of this electronic work, without
prominently displaying the sentence set forth in paragraph 1.E.1 with
active links or immediate access to the full terms of the Project
Gutenberg-tm License.

1.E.6.  You may convert to and distribute this work in any binary,
compressed, marked up, nonproprietary or proprietary form, including any
word processing or hypertext form.  However, if you provide access to or
distribute copies of a Project Gutenberg-tm work in a format other than
"Plain Vanilla ASCII" or other format used in the official version
posted on the official Project Gutenberg-tm web site (www.gutenberg.org),
you must, at no additional cost, fee or expense to the user, provide a
copy, a means of exporting a copy, or a means of obtaining a copy upon
request, of the work in its original "Plain Vanilla ASCII" or other
form.  Any alternate format must include the full Project Gutenberg-tm
License as specified in paragraph 1.E.1.

1.E.7.  Do not charge a fee for access to, viewing, displaying,
performing, copying or distributing any Project Gutenberg-tm works
unless you comply with paragraph 1.E.8 or 1.E.9.

1.E.8.  You may charge a reasonable fee for copies of or providing
access to or distributing Project Gutenberg-tm electronic works provided
that

- You pay a royalty fee of 20% of the gross profits you derive from
     the use of Project Gutenberg-tm works calculated using the method
     you already use to calculate your applicable taxes.  The fee is
     owed to the owner of the Project Gutenberg-tm trademark, but he
     has agreed to donate royalties under this paragraph to the
     Project Gutenberg Literary Archive Foundation.  Royalty payments
     must be paid within 60 days following each date on which you
     prepare (or are legally required to prepare) your periodic tax
     returns.  Royalty payments should be clearly marked as such and
     sent to the Project Gutenberg Literary Archive Foundation at the
     address specified in Section 4, "Information about donations to
     the Project Gutenberg Literary Archive Foundation."

- You provide a full refund of any money paid by a user who notifies
     you in writing (or by e-mail) within 30 days of receipt that s/he
     does not agree to the terms of the full Project Gutenberg-tm
     License.  You must require such a user to return or
     destroy all copies of the works possessed in a physical medium
     and discontinue all use of and all access to other copies of
     Project Gutenberg-tm works.

- You provide, in accordance with paragraph 1.F.3, a full refund of any
     money paid for a work or a replacement copy, if a defect in the
     electronic work is discovered and reported to you within 90 days
     of receipt of the work.

- You comply with all other terms of this agreement for free
     distribution of Project Gutenberg-tm works.

1.E.9.  If you wish to charge a fee or distribute a Project Gutenberg-tm
electronic work or group of works on different terms than are set
forth in this agreement, you must obtain permission in writing from
both the Project Gutenberg Literary Archive Foundation and Michael
Hart, the owner of the Project Gutenberg-tm trademark.  Contact the
Foundation as set forth in Section 3 below.

1.F.

1.F.1.  Project Gutenberg volunteers and employees expend considerable
effort to identify, do copyright research on, transcribe and proofread
public domain works in creating the Project Gutenberg-tm
collection.  Despite these efforts, Project Gutenberg-tm electronic
works, and the medium on which they may be stored, may contain
"Defects," such as, but not limited to, incomplete, inaccurate or
corrupt data, transcription errors, a copyright or other intellectual
property infringement, a defective or damaged disk or other medium, a
computer virus, or computer codes that damage or cannot be read by
your equipment.

1.F.2.  LIMITED WARRANTY, DISCLAIMER OF DAMAGES - Except for the "Right
of Replacement or Refund" described in paragraph 1.F.3, the Project
Gutenberg Literary Archive Foundation, the owner of the Project
Gutenberg-tm trademark, and any other party distributing a Project
Gutenberg-tm electronic work under this agreement, disclaim all
liability to you for damages, costs and expenses, including legal
fees.  YOU AGREE THAT YOU HAVE NO REMEDIES FOR NEGLIGENCE, STRICT
LIABILITY, BREACH OF WARRANTY OR BREACH OF CONTRACT EXCEPT THOSE
PROVIDED IN PARAGRAPH 1.F.3. YOU AGREE THAT THE FOUNDATION, THE
TRADEMARK OWNER, AND ANY DISTRIBUTOR UNDER THIS AGREEMENT WILL NOT BE
LIABLE TO YOU FOR ACTUAL, DIRECT, INDIRECT, CONSEQUENTIAL, PUNITIVE OR
INCIDENTAL DAMAGES EVEN IF YOU GIVE NOTICE OF THE POSSIBILITY OF SUCH
DAMAGE.

1.F.3.  LIMITED RIGHT OF REPLACEMENT OR REFUND - If you discover a
defect in this electronic work within 90 days of receiving it, you can
receive a refund of the money (if any) you paid for it by sending a
written explanation to the person you received the work from.  If you
received the work on a physical medium, you must return the medium with
your written explanation.  The person or entity that provided you with
the defective work may elect to provide a replacement copy in lieu of a
refund.  If you received the work electronically, the person or entity
providing it to you may choose to give you a second opportunity to
receive the work electronically in lieu of a refund.  If the second copy
is also defective, you may demand a refund in writing without further
opportunities to fix the problem.

1.F.4.  Except for the limited right of replacement or refund set forth
in paragraph 1.F.3, this work is provided to you 'AS-IS' WITH NO OTHER
WARRANTIES OF ANY KIND, EXPRESS OR IMPLIED, INCLUDING BUT NOT LIMITED TO
WARRANTIES OF MERCHANTIBILITY OR FITNESS FOR ANY PURPOSE.

1.F.5.  Some states do not allow disclaimers of certain implied
warranties or the exclusion or limitation of certain types of damages.
If any disclaimer or limitation set forth in this agreement violates the
law of the state applicable to this agreement, the agreement shall be
interpreted to make the maximum disclaimer or limitation permitted by
the applicable state law.  The invalidity or unenforceability of any
provision of this agreement shall not void the remaining provisions.

1.F.6.  INDEMNITY - You agree to indemnify and hold the Foundation, the
trademark owner, any agent or employee of the Foundation, anyone
providing copies of Project Gutenberg-tm electronic works in accordance
with this agreement, and any volunteers associated with the production,
promotion and distribution of Project Gutenberg-tm electronic works,
harmless from all liability, costs and expenses, including legal fees,
that arise directly or indirectly from any of the following which you do
or cause to occur: (a) distribution of this or any Project Gutenberg-tm
work, (b) alteration, modification, or additions or deletions to any
Project Gutenberg-tm work, and (c) any Defect you cause.


Section  2.  Information about the Mission of Project Gutenberg-tm

Project Gutenberg-tm is synonymous with the free distribution of
electronic works in formats readable by the widest variety of computers
including obsolete, old, middle-aged and new computers.  It exists
because of the efforts of hundreds of volunteers and donations from
people in all walks of life.

Volunteers and financial support to provide volunteers with the
assistance they need, are critical to reaching Project Gutenberg-tm's
goals and ensuring that the Project Gutenberg-tm collection will
remain freely available for generations to come.  In 2001, the Project
Gutenberg Literary Archive Foundation was created to provide a secure
and permanent future for Project Gutenberg-tm and future generations.
To learn more about the Project Gutenberg Literary Archive Foundation
and how your efforts and donations can help, see Sections 3 and 4
and the Foundation web page at http://www.pglaf.org.


Section 3.  Information about the Project Gutenberg Literary Archive
Foundation

The Project Gutenberg Literary Archive Foundation is a non profit
501(c)(3) educational corporation organized under the laws of the
state of Mississippi and granted tax exempt status by the Internal
Revenue Service.  The Foundation's EIN or federal tax identification
number is 64-6221541.  Its 501(c)(3) letter is posted at
http://pglaf.org/fundraising.  Contributions to the Project Gutenberg
Literary Archive Foundation are tax deductible to the full extent
permitted by U.S. federal laws and your state's laws.

The Foundation's principal office is located at 4557 Melan Dr. S.
Fairbanks, AK, 99712., but its volunteers and employees are scattered
throughout numerous locations.  Its business office is located at
809 North 1500 West, Salt Lake City, UT 84116, (801) 596-1887, email
business@pglaf.org.  Email contact links and up to date contact
information can be found at the Foundation's web site and official
page at http://pglaf.org

For additional contact information:
     Dr. Gregory B. Newby
     Chief Executive and Director
     gbnewby@pglaf.org


Section 4.  Information about Donations to the Project Gutenberg
Literary Archive Foundation

Project Gutenberg-tm depends upon and cannot survive without wide
spread public support and donations to carry out its mission of
increasing the number of public domain and licensed works that can be
freely distributed in machine readable form accessible by the widest
array of equipment including outdated equipment.  Many small donations
($1 to $5,000) are particularly important to maintaining tax exempt
status with the IRS.

The Foundation is committed to complying with the laws regulating
charities and charitable donations in all 50 states of the United
States.  Compliance requirements are not uniform and it takes a
considerable effort, much paperwork and many fees to meet and keep up
with these requirements.  We do not solicit donations in locations
where we have not received written confirmation of compliance.  To
SEND DONATIONS or determine the status of compliance for any
particular state visit http://pglaf.org

While we cannot and do not solicit contributions from states where we
have not met the solicitation requirements, we know of no prohibition
against accepting unsolicited donations from donors in such states who
approach us with offers to donate.

International donations are gratefully accepted, but we cannot make
any statements concerning tax treatment of donations received from
outside the United States.  U.S. laws alone swamp our small staff.

Please check the Project Gutenberg Web pages for current donation
methods and addresses.  Donations are accepted in a number of other
ways including checks, online payments and credit card donations.
To donate, please visit: http://pglaf.org/donate


Section 5.  General Information About Project Gutenberg-tm electronic
works.

Professor Michael S. Hart is the originator of the Project Gutenberg-tm
concept of a library of electronic works that could be freely shared
with anyone.  For thirty years, he produced and distributed Project
Gutenberg-tm eBooks with only a loose network of volunteer support.


Project Gutenberg-tm eBooks are often created from several printed
editions, all of which are confirmed as Public Domain in the U.S.
unless a copyright notice is included.  Thus, we do not necessarily
keep eBooks in compliance with any particular paper edition.


Most people start at our Web site which has the main PG search facility:

     http://www.gutenberg.org

This Web site includes information about Project Gutenberg-tm,
including how to make donations to the Project Gutenberg Literary
Archive Foundation, how to help produce our new eBooks, and how to
subscribe to our email newsletter to hear about new eBooks.