The Project Gutenberg EBook of Prevalence of Imprisonment in the U.S.
Population, 1974-2001, by Thomas P. Bonczar

This eBook is for the use of anyone anywhere at no cost and with
almost no restrictions whatsoever.  You may copy it, give it away or
re-use it under the terms of the Project Gutenberg License included
with this eBook or online at www.gutenberg.org


Title: Prevalence of Imprisonment in the U.S. Population, 1974-2001

Author: Thomas P. Bonczar

Release Date: June 23, 2009 [EBook #29211]

Language: English

Character set encoding: ISO-8859-1

*** START OF THIS PROJECT GUTENBERG EBOOK IMPRISONMENT, 1974-2001 ***


Produced by Al Haines
At yearend 2001 over 5.6 million U.S. adults had ever served time in State or Federal prison
* Of adults in 2001 who had ever served time in prison, nearly as many were black (2,166,000) as were white (2,203,000). An estimated 997,000 were Hispanic.
  ----------------------------------------------------------------------

  At yearend 2001, over 5.6 million U.S. residents had ever served time
  in State or Federal prison

  U.S. residents                                      Percent of adult
  ever incarcerated            Number                  U.S. residents

                    1974        1991        2001     1974   1991   2001

    Total         1,819,000   3,437,000   5,618,000   1.3%   1.8%   2.7%

  Male            1,677,000   3,142,000   5,037,000   2.3    3.4    4.9
    White           837,000   1,395,000   1,978,000   1.4    1.9    2.6
    Black           595,000   1,181,000   1,936,000   8.7   12.0   16.6
    Hispanic         94,000     392,000     911,000   2.3    4.9    7.7

  Female            142,000     295,000     581,000   0.2%   0.3%   0.5%
    White            86,000     139,000     225,000   0.1    0.2    0.3
    Black            51,000     109,000     231,000   0.6    0.9    1.7
    Hispanic          8,000      30,000      86,000   0.2    0.4    0.7

    White           922,000   1,533,000   2,203,000   0.8%   1.1%   1.4%
    Black           646,000   1,290,000   2,166,000   4.5    6.2    8.9
    Hispanic        102,000     422,000     997,000   1.3    2.7    4.3


  U.S. adult resident population

                    1974              1991               2001

    Total       145,356,000       187,982,751        210,207,901

  Male           69,217,000        90,362,099        101,492,258
    White        57,704,209        69,718,665         74,217,435
    Black         6,593,640         9,465,170         11,287,707
    Hispanic      3,923,600         8,022,134         11,452,968

  Female         76,133,000        97,620,652        108,715,643
    White        63,173,779        75,415,364         78,956,773
    Black         7,813,782        11,222,468         13,178,900
    Hispanic      4,074,628         7,655,854         11,496,534

  White         120,878,496       145,134,029        153,174,207
  Black          14,406,407        20,687,638         24,466,606
  Hispanic        7,998,062        15,677,988         22,949,502

  Note: Because of estimation and other rounding procedures, some
  detail may not add to totals and may not match precisely totals
  in other tables.

  ----------------------------------------------------------------------
* The rate of ever having gone to prison among adult black males(16.6%) was over twice as high as among adult Hispanic males (7.7%) and over 6 times as high as among adult white males (2.6%).
* U.S. residents ages 35 to 39 in 2001 were more likely to have gone to prison (3.8%) than any other age group, up from 2.3% in 1991.
* An estimated 22% of black males ages 35 to 44 in 2001 had ever been confined in State or Federal prison, compared to 10.0% of Hispanic males and 3.5% of white males in the same age group.
If incarceration rates remain unchanged, 6.6% of U.S. residents born in 2001 will go to prison at some time during their lifetime
  ----------------------------------------------------------------------

  If incarceration rates remain unchanged, 6.6% of U.S. residents born
  in 2001 will go to prison at some time during their lifetime

    Percent ever going to prison during lifetime,
    born in--
                1974      1991      2001
    Total        1.9%      5.2%      6.6%

  Male           3.6       9.1      11.3
    White        2.2       4.4       5.9
    Black       13.4      29.4      32.2
    Hispanic     4.0      16.3      17.2

  Female         0.3%      1.1%      1.8%
    White        0.2       0.5       0.9
    Black        1.1       3.6       5.6
    Hispanic     0.4       1.5       2.2

    White        1.2%      2.5%      3.4%
    Black        7.0      16.5      18.6
    Hispanic     2.2       9.5      10.0

  ----------------------------------------------------------------------
* About 1 in 3 black males, 1 in 6 Hispanic males, and 1 in 17 white males are expected to go to prison during their lifetime, if current incarceration rates remain unchanged.
* For women, the chances of going to prison were 6 times greater in 2001 (1.8%) than in 1974 (0.3%); for men, the chances of going to prison were over 3 times greater in 2001 (11.3%) than in 1974 (3.6%).
At yearend 2001 there were 1,319,000 adults confined in State or Federal prison and an estimated 4,299,000 living former prisoners. A total of 5,618,000 U.S. adult residents, or about 1 in every 37 U.S. adults, had ever served time in prison. Estimates of the prevalence of imprisonment in the U.S. population, presented here for the first time, are based on a demographic model incorporating rates of mortality and first incarceration in prison.
Between 1974 and 2001, the prevalence of imprisonment increased by nearly 3.8 million. This included a 1.1 million increase in the number of adults in prison (up from 216,000) and a nearly 2.7 million increase in the number of living former prisoners (up from 1,603,000).
If rates of first incarceration remain unchanged, 6.6% of all persons born in the United States in 2001 will go to State or Federal prison during their lifetime, up from 5.2% in 1991, and 1.9% in 1974. Unlike the prevalence of ever having gone to prison, which estimates the extent of past experiences, the lifetime likelihood of going to prison is an estimate of the chances of future incarceration, given unchanged rates of first incarceration and mortality.
4.3 million U.S. residents in 2001 were former prisoners
Of the estimated 5.6 million adults in the United States who had been incarcerated in State or Federal prison at some time before yearend 2001, nearly 4.3 million were no longer in prison (table 1). Former prisoners accounted for 77% of all adult residents who had ever been confined in prison.
  ----------------------------------------------------------------------

  Table 1. Prevalence of incarceration in a State or Federal prison, by
  current and former prisoners, 1974-2001

                 Current and former prisoners ever incarcerated in a State
                 or Federal prison--

                 1974        1979        1986        1991        1997        2001

  Number incarcerated

    Total   1,819,000   2,100,000   2,667,000   3,437,000   4,652,000   5,618,000
  Current     216,000     302,000     524,000     788,000   1,171,000   1,319,000
  Former    1,603,000   1,798,000   2,143,000   2,649,000   3,481,000   4,299,000

  Ever incarcerated rate*

    Total       1,251       1,308       1,516       1,828       2,336       2,673
  Current         149         188         298         419         588         628
  Former        1,102       1,120       1,218       1,409       1,748       2,045

  Note: Numbers of current adult prisoners from National Prisoner Statistics
  data series.  Former prisoner statistics based on inmate survey data.
  Estimates were rounded to the nearest 1,000.  See Methodology for
  estimation procedures.

  *The number ever incarcerated per 100,000 adult U.S. residents.


  U.S. adult resident population

      1974          1986          1991          1997         2001

  145,356,000   175,886,630   187,982,751   199,121,734   210,207,901

  ----------------------------------------------------------------------
Persons ages 35 to 44 comprised the largest age group, accounting for 3 out of 10 former prisoners at yearend 2001 (1,280,000). Former prisoners were older than those currently in State or Federal prison, with 49% of former prisoners age 45 or older compared to 13% of persons confined on December 31, 2001. Current prisoners outnumbered former prisoners only among those ages 18 to 24 (254,000 compared with 155,000).
  ----------------------------------------------------------------------

  Number of adults with prison experience, 2001

                     Former        Current
  Age               inmates        inmates

    Total         4,299,000      1,319,000
  18-24             155,000        254,000
  25-34             775,000        511,000
  35-44           1,280,000        385,000
  45-54           1,002,000        130,000
  55-64             509,000         30,000
  65 or older       578,000          9,000

  Note: See Methodology for estimation procedures.

  ----------------------------------------------------------------------
More than two-thirds of former prisoners no longer under correctional supervision
At yearend 2001 former prisoners included 731,147 persons on parole, an estimated 437,000 persons on probation who had either served part of their current sentence in prison or been confined in prison on a previous sentence, and an estimated 166,000 jail inmates who had served a previous sentence in prison. An estimated 3 million former prisoners were no longer under correctional supervision as of yearend 2001.
  ----------------------------------------------------------------------

  Former State and Federal prisoners, 2001

                               Number      Percent

    Total                   4,299,000        100.0%

  Under supervision         1,334,000         31.0
    Parole                    731,000         17.0
    Probation                 437,000         10.2
    Jail                      166,000          3.9

  Not under supervision     2,965,000         69.0

  Note: Estimates rounded to nearest 1,000.

  ----------------------------------------------------------------------
Demographic techniques used to create prevalence estimates
Estimates of the prevalence of ever having gone to prison were derived from generation life table techniques. The prevalence of ever having gone to prison includes adults currently in prison and living former prisoners.
One-day counts of the number of adults in prison are available through the National Prisoner Statistics program (NPS). Collected annually since 1926, the NPS provides a count at yearend of persons held in Federal and State prisons.
To obtain the number of persons who had ever gone to prison, separate generation life tables were prepared for persons alive between 1974 and 2001. These tables model the first incarceration and mortality experience of each birth cohort as it proceeded through life. Estimates were made of the number of persons going to prison for the first time, by year of age, and the number who had been incarcerated and survived to each later age.
Rates of first incarceration during a 12-month period were developed from prison inmate surveys conducted in 1974, 1979, 1986, 1991, and 1997, a period during which admission rates increased after many years of relative stability.
Prevalence estimates for selected calendar years represent a sum of the contribution of each birth cohort to the total number of adults alive who had ever gone to prison. The number of former prisoners was obtained by subtracting the number of prisoners at yearend (NPS) from the total.
Estimates exclude admissions to local jails, due to the absence of data needed to calculate first admissions to jail. (See Methodology for estimation procedures and limitations.)
1 in 37 adult U.S. residents in 2001 had ever served time in prison
The 5.6 million adult U.S. residents who were current and former prisoners, represented an increase of 3.8 million since 1974. At yearend 2001, 2,673 persons per 100,000 adult U.S. residents had ever gone to prison, up from 1,251 per 100,000 adult residents in 1974. Overall, approximately 1 in 37 adult residents in 2001 had ever served time in a State or Federal prison.
As a percent of all adults who had ever gone to a State or Federal prison, the number of former prisoners has steadily declined (from 88% in 1974 to 77% in 2001). The decline occurred as the number of adults confined in prison at yearend grew by 1.1 million -- a 6-fold increase. Over the 27-year period the number of adult prison inmates rose from 216,000 to 1,319,000. By yearend 2001, there were 628 prison inmates per 100,000 adult residents, up from 149 in 1974.
Between 1974 and 2001 the number of former prisoners living in the United States more than doubled, from 1,603,000 to 4,299,000. Relative to the adult population, the number of former prisoners totaled 2,045 per 100,000 adult U.S. residents in 2001, up from 1,102 per 100,000 in 1974. At yearend 2001, 1 in every 49 adults in the United States was a former prisoner.
Two-thirds of the increase in number ever incarcerated due to rise in first incarceration rates
Nearly two-thirds of the 3.8 million increase in the number of adults ever incarcerated in prison between 1974 and 2001 occurred as a result of an increase in the rates of first incarceration. In 1974 the number of persons admitted to prison for the first time totaled 44 per 100,000 adult residents. By 2001 the rate had nearly tripled, reaching 129 first admissions per 100,000 adults.
Over 40% of the total increase in first incarceration rates occurred between 1986 and 1991. First incarceration rates increased from 73 per 100,000 in 1986 to 111 in 1991.
About a third of the 3.8 million increase in the number ever incarcerated occurred as a result of growth in the U.S. resident population. Based on estimates from the U.S. Census Bureau, the number of residents 18 and older increased from 145 million in 1974 to 210 million in 2001. Had the rates of first incarceration remained stable at 1974 levels, the number of adults who had ever gone to prison would have increased by an estimated 1.3 million.
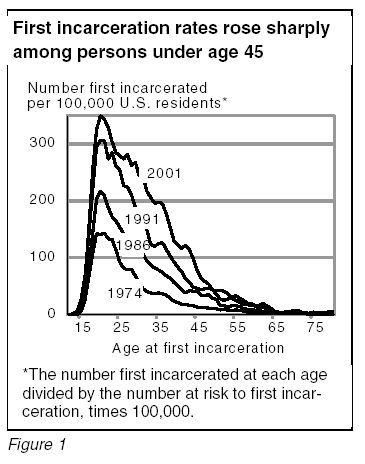
In every year, the rates of first incarceration varied by age (figure 1). In 2001 sharply higher first incarceration rates were found for each older birth cohort up to a peak of 350 per 100,000 at age 20. These rates then dropped steadily with each older age category.
  ----------------------------------------------------------------------

  Figure 1

  First incarceration rates rose sharply among persons under age 45

  Number first incarcerated per 100,000 U.S. residents.*

  Age at first
  incarceration         1974     1986     1991     2001

  12                       0        0        0        0
  13                       0        0        1        0
  14                       1        0        6        0
  15                       6        8       27       12
  16                      25       29       67       58
  17                      66       81      139      152
  18                     107      143      219      254
  19                     142      203      295      325
  20                     140      217      307      350
  21                     143      209      306      344
  22                     133      188      274      329
  23                     132      172      285      304
  24                     113      164      261      285
  25                      92      153      254      280
  26                      81      142      227      274
  27                      79      128      224      282
  28                      79      116      210      262
  29                      68      116      189      268
  30                      55      112      179      244
  31                      45      107      164      243
  32                      40       93      148      217
  33                      38       87      123      206
  34                      36       82      120      196
  35                      38       78      125      198
  36                      36       74      126      195
  37                      34       68      114      177
  38                      28       64      103      153
  39                      23       56       92      129
  40                      21       50       83      123
  41                      18       43       75      116
  42                      18       38       63      122
  43                      16       42       56      114
  44                      15       41       48       98
  45                      13       41       46       77
  46                      12       34       44       65
  47                      12       33       45       58
  48                      11       35       46       53
  49                      10       28       44       43
  50                      10       26       35       42
  51                       8       15       27       42
  52                       9       16       25       41
  53                       7       12       27       36
  54                       7       16       30       28
  55                       8       15       33       25
  56                       7       14       28       21
  57                       6       10       25       18
  58                       4        9       19       17
  59                       4        9       19       16
  60                       2        7       15       15
  61                       2        5       10       16
  62                       3        5       12       19
  63                       3        7       12       15
  64                       4        7       11       11
  65                       3        5        5        4
  66                       2        2        4        2
  67                       2        2        3        3
  68                       3        5        3        4
  69                       2        4        5        5
  70                       2        3        7        5
  71                       2        2        7        6
  72                       2        2        4        4
  73                       1        2        3        1
  74                       0        0        2        0
  75                       0        0        4        0
  76                       0        0        2        3
  77                       0        0        2        3
  78                       0        0        2        3
  79                       0        0        5        0
  80                       0        0        5        0

  *The number first incarcerated at each age divided by the number at
  risk to first incarceration, times 100,000.

  Note: 3-year averages were used to smooth age-specific rates.

  ----------------------------------------------------------------------
Between 1974 and 2001 the rate of first incarceration rose in nearly every age-specific category. The largest increases occurred among younger age cohorts -- those that already had high first incarceration rates. The peak incarceration rate increased by over 200 persons per 100,000 (from 143 at age 21 in 1974, to 350 at age 20 in 2001). Rates increased even among persons age 45 or older.
In 2001, 3 out of 10 adults ever incarcerated were age 35 to 44
Persons between ages 35 and 44 accounted for the largest number of current and former prisoners at yearend 2001 (table 2). Born between 1957 and 1966, these persons turned 18 in the late 1970s and early 1980s when first incarceration rates began to climb. Between 1974 and 2001, the number ever incarcerated in this age group rose from 324,000 to 1.67 million.
Among persons between ages 25 and 34, the number ever incarcerated nearly quadrupled (from 343,000 in 1974 to 1.29 million in 2001). While persons in this age group also experienced rising first incarceration rates, they were subject to these rates for a smaller portion of their lifespan than those ages 35 to 44.
As a percent of those ever incarcerated, persons ages 35 to 44 increased from 18% in 1974 to 30% by 2001; persons age 25 to 34 increased from 19% in 1974 to 23% in 2001.
  ----------------------------------------------------------------------

  Table 1. Prevalence of incarceration in a State or Federal prison, by
  current and former prisoners, 1974-2001

                 Current and former prisoners ever incarcerated in a State
                 or Federal prison--

                 1974        1979        1986        1991        1997        2001

  Number incarcerated

    Total   1,819,000   2,100,000   2,667,000   3,437,000   4,652,000   5,618,000
  Current     216,000     302,000     524,000     788,000   1,171,000   1,319,000
  Former    1,603,000   1,798,000   2,143,000   2,649,000   3,481,000   4,299,000

  Ever incarcerated rate*

    Total       1,251       1,308       1,516       1,828       2,336       2,673
  Current         149         188         298         419         588         628
  Former        1,102       1,120       1,218       1,409       1,748       2,045

  Note: Numbers of current adult prisoners from National Prisoner Statistics
  data series.  Former prisoner statistics based on inmate survey data.
  Estimates were rounded to the nearest 1,000.  See Methodology for
  estimation procedures.

  *The number ever incarcerated per 100,000 adult U.S. residents.


  U.S. adult resident population

      1974          1986          1991          1997         2001

  145,356,000   175,886,630   187,982,751   199,121,734   210,207,901

  ----------------------------------------------------------------------
Prevalence rates up sharply among persons under age 50
Between 1974 and 2001, the rise in first incarceration rates had the largest effects on younger age groups. The percent of persons ever incarcerated tripled among persons ages 25 to 29 (from 1.0% in 1974 to 3.1% in 2001)and more than doubled among persons ages 30 to 34 (from 1.3% to 3.7%) and persons ages 35 to 39 (from 1.4% to 3.8%) (table 3).
  ----------------------------------------------------------------------

  Table 3. Percent of adult population ever incarcerated in a State or
  Federal prison, by age, 1974-2001

                Percent of adult population ever incarcerated in a State
                or Federal prison

  Age           1974      1979      1986      1991      1997      2001

    Total        1.3%      1.3%      1.5%      1.8%      2.3%      2.7%
  18-19          0.3       0.3       0.4       0.5       0.6       0.6
  20-24          0.7       0.8       1.0       1.3       1.8       1.8
  25-29          1.0       1.2       1.6       2.1       2.7       3.1
  30-34          1.3       1.3       1.8       2.3       3.2       3.7
  35-39          1.4       1.4       1.7       2.3       3.1       3.8
  40-44          1.5       1.5       1.7       2.1       2.9       3.6
  45-49          1.5       1.5       1.7       1.9       2.5       3.2
  50-54          1.5       1.5       1.7       1.8       2.2       2.6
  55-59          1.5       1.6       1.6       1.8       2.0       2.2
  60-64          1.5       1.5       1.6       1.6       1.9       2.0
  65 or older    1.5       1.5       1.5       1.6       1.6       1.7

  Note: Percents by age were based on intercensal resident population
  estimates from the U.S. Census Bureau.  See Methodology for data
  sources.


  U.S. adult resident population

                     1974          1979          1986          1991          1997          2001

    Total     145,356,000   160,463,000   175,886,630   187,982,751   199,121,734   210,207,901
  18-19         8,196,000     8,698,000     7,571,080     7,562,252     7,629,647     8,349,428
  20-24        18,757,000    21,096,000    21,147,811    19,756,380    18,078,783    19,863,153
  25-29        16,429,000    19,078,000    21,742,173    21,509,229    19,529,293    18,057,849
  30-34        13,644,000    16,960,000    20,167,953    22,482,213    21,434,194    19,971,052
  35-39        11,400,000    13,591,000    17,839,473    20,486,038    22,851,041    21,801,103
  40-44        11,355,000    11,522,000    14,185,094    18,553,907    21,376,552    23,144,035
  45-49        11,843,000    11,211,000    11,658,854    14,135,160    18,558,879    20,879,652
  50-54        11,958,000    11,725,000    10,868,729    11,410,881    14,518,458    18,117,187
  55-59        10,386,000    11,582,000    11,210,396    10,345,736    11,434,732    14,092,339
  60-64         9,327,000     9,867,000    10,902,949    10,518,068     9,913,280    11,049,281
  65 or older  22,061,000    25,133,000    28,592,118    31,222,887    33,796,875    34,882,826

  Note: Because of estimation and other rounding procedures, some detail may
  not add to totals and may not match precisely totals in other tables.

  ----------------------------------------------------------------------
In contrast, the rise in the percents ever incarcerated was more modest among persons 50 or older. Although these age groups also experienced rising first incarceration rates, they were exposed at older ages when first incarceration rates are low. Persons age 65 and older were the least affected by the increases in first incarceration rates, with percents ever incarcerated rising from 1.5% in 1974 to 1.7% in 2001.
  ----------------------------------------------------------------------

  Table 4. Number of adults ever incarcerated in a State or Federal
  prison, by gender, race, and Hispanic origin, 1974-2001

                 Number of adults ever incarcerated in a State or Federal prison

                     1974        1979        1986        1991        1997        2001
  Gender
    Male        1,677,000   1,934,000   2,449,000   3,142,000   4,205,000   5,037,000
    Female        142,000     165,000     217,000     295,000     447,000     581,000

  Race/Hispanic origin
    White*        922,000   1,052,000   1,286,000   1,533,000   1,909,000   2,203,000
      Male        837,000     958,000   1,173,000   1,395,000   1,724,000   1,978,000
      Female       86,000      94,000     113,000     139,000     185,000     225,000

    Black*        646,000     766,000     963,000   1,290,000   1,784,000   2,166,000
      Male        595,000     704,000     881,000   1,181,000   1,615,000   1,936,000
      Female       51,000      62,000      82,000     109,000     170,000     231,000

    Hispanic      102,000     125,000     234,000     422,000     721,000     997,000
      Male         94,000     116,000     217,000     392,000     664,000     911,000
      Female        8,000      10,000      17,000      30,000      57,000      86,000

  Note: Estimates were based on separate generation life tables that
  incorporate first incarceration and mortality rates for each age
  group.  Estimates were rounded to the nearest 1,000.  See Methodology
  for estimation procedures.

  *Excludes persons of Hispanic origin.

  ----------------------------------------------------------------------
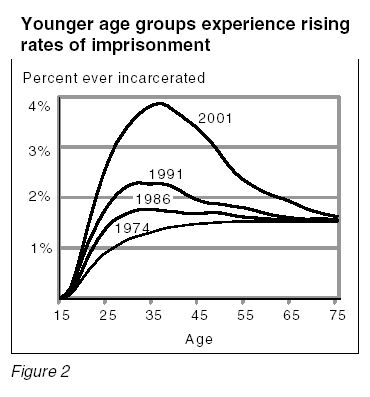
These changes in the percents ever incarcerated by age reflect rising rates of first incarceration and the age of each of these birth cohorts when the increases occurred. In the future, the percents ever incarcerated will rise among older age groups as more recent cohorts experience the full impact of current levels of first incarceration rates throughout their lifetimes (figure 2).
  ----------------------------------------------------------------------

  Figure 2

  Younger age groups experience rising rates of imprisonment

            Percent ever incarcerated

  Age    1974     1986     1991     2001

  15      0.0      0.0      0.0      0.0
  16      0.0      0.0      0.1      0.0
  17      0.1      0.1      0.2      0.2
  18      0.2      0.2      0.4      0.5
  19      0.3      0.5      0.7      0.8
  20      0.5      0.7      1.0      1.1
  21      0.6      0.9      1.1      1.5
  22      0.7      1.0      1.4      1.8
  23      0.8      1.2      1.5      2.2
  24      0.9      1.3      1.7      2.4
  25      0.9      1.4      1.8      2.7
  26      1.0      1.5      2.0      2.9
  27      1.1      1.6      2.1      3.1
  28      1.1      1.6      2.2      3.3
  29      1.2      1.7      2.2      3.4
  30      1.2      1.7      2.3      3.5
  31      1.2      1.8      2.3      3.6
  32      1.3      1.8      2.3      3.7
  33      1.3      1.8      2.3      3.8
  34      1.3      1.8      2.3      3.8
  35      1.3      1.8      2.3      3.9
  36      1.4      1.8      2.3      3.9
  37      1.4      1.7      2.3      3.9
  38      1.4      1.7      2.3      3.8
  39      1.4      1.7      2.2      3.8
  40      1.4      1.7      2.2      3.7
  41      1.5      1.7      2.1      3.6
  42      1.5      1.7      2.1      3.6
  43      1.5      1.7      2.0      3.5
  44      1.5      1.7      2.0      3.4
  45      1.5      1.7      1.9      3.4
  46      1.5      1.7      1.9      3.3
  47      1.5      1.7      1.9      3.2
  48      1.5      1.7      1.9      3.1
  49      1.5      1.7      1.9      3.0
  50      1.5      1.7      1.9      2.8
  51      1.5      1.7      1.9      2.7
  52      1.5      1.7      1.8      2.6
  53      1.5      1.6      1.8      2.5
  54      1.5      1.6      1.8      2.4
  55      1.5      1.6      1.8      2.3
  56      1.5      1.6      1.8      2.3
  57      1.5      1.6      1.8      2.2
  58      1.5      1.6      1.7      2.2
  59      1.5      1.6      1.7      2.1
  60      1.5      1.6      1.7      2.1
  61      1.5      1.6      1.7      2.0
  62      1.5      1.6      1.6      2.0
  63      1.5      1.6      1.6      2.0
  64      1.5      1.6      1.6      2.0
  65      1.5      1.6      1.6      1.9
  66      1.5      1.6      1.6      1.9
  67      1.5      1.6      1.6      1.8
  68      1.5      1.6      1.6      1.8
  69      1.5      1.6      1.6      1.8
  70      1.5      1.6      1.6      1.7
  71      1.5      1.5      1.6      1.7
  72      1.5      1.5      1.6      1.7
  73      1.5      1.5      1.6      1.7
  74      1.5      1.5      1.6      1.6
  75      1.5      1.5      1.6      1.6

  ----------------------------------------------------------------------
More males than females and more blacks and Hispanics than whites had ever served time in prison
Nearly 9 times as many men (5,037,000) as women (581,000) had ever been incarcerated in a State or Federal prison at yearend 2001. As a percentage of all persons ever confined in prison, women increased from 7.8% in 1974 to 10.3% in 2001.
At yearend 2001 nearly as many blacks (2,166,000) as whites (2,203,000) had ever served time in prison; Hispanics numbered about half of either group (997,000). Together, blacks (39%) and Hispanics (18%) constituted a majority of those who had ever served time in prison in 2001. Whites accounted for 39% of all those ever incarcerated in 2001, down from 51% in 1974.
Over the 27-year period, the share of those who are black and Hispanic among persons ever incarcerated increased. The number of Hispanics rose nearly 10-fold (up from 102,000 in 1974) and the number of blacks more than tripled (up from 646,000), while the number of whites more than doubled (up from 922,000). As a result, blacks rose from 36% to 39% of all persons ever incarcerated, while Hispanics rose from 6% to 18%.
Nearly 17% of adult black males had ever served time in prison
In 2001 an estimated 16.6% of adult black males were current or former State or Federal prisoners -- a rate that was twice that of Hispanic males (7.7%), and 6 times that of white males (2.6%) (table 5).
  ----------------------------------------------------------------------

  Table 5. Percent of adult population ever incarcerated in a State or
  Federal prison, by gender, race, and Hispanic origin, 1974-2001

            Percent of adult population ever incarcerated in a State
            or Federal prison

                  1974    1979    1986    1991    1997    2001

  Gender
    Male           2.3%    2.4%    2.8%    3.4%    4.3%    4.9%
    Female         0.2     0.2     0.2     0.3     0.4     0.5

  Race/Hispanic origin
    White*         0.8%    0.8%    0.9%    1.1%    1.3%    1.4%
        Male       1.4     1.5     1.7     1.9     2.3     2.6
        Female     0.1     0.1     0.1     0.2     0.2     0.3

    Black*         4.5%    4.6%    5.2%    6.2%    7.9%    8.9%
        Male       8.7     8.9     9.9    12.0    15.0    16.6
        Female     0.6     0.7     0.8     0.9     1.3     1.7

    Hispanic       1.3%    1.4%    2.0%    2.7%    3.8%    4.3%
        Male       2.3     2.6     3.6     4.9     6.7     7.7
        Female     0.2     0.2     0.3     0.4     0.6     0.7

  Note: Percents were based on intercensal resident population estimates
  from the U.S. Census Bureau.  See Methodology for data sources.

  *Excludes persons of Hispanic origin.


  U.S. adult resident population

            1974            1979            1986            1991            1997            2001

  Gender
    Male        69,217,000    76,388,000    83,973,550    90,362,099    95,948,130   101,492,258
    Female      76,133,000    84,072,000    91,913,080    97,620,652   103,173,604   108,715,643

  Race/Hispanic origin
    White*     120,878,496   132,166,671   140,455,378   145,134,029   149,184,485   153,174,207
      Male      57,704,209    63,114,508    67,150,845    69,718,665    71,989,995    74,217,435
      Female    63,173,779    69,055,203    73,304,533    75,415,364    77,194,490    78,956,773

  Black*        14,406,407    16,544,671    18,682,074    20,687,638    22,627,733    24,466,606
      Male       6,593,640     7,543,858     8,517,413     9,465,170    10,401,742    11,287,707
      Female     7,813,782     8,999,844    10,164,661    11,222,468    12,225,991    13,178,900

  Hispanic       7,998,062     8,854,010    11,956,854    15,677,988    19,181,910    22,949,502
      Male       3,923,600     4,353,052     6,003,930     8,022,134     9,674,049    11,452,968
      Female     4,074,628     4,500,532     5,952,924     7,655,854     9,507,861    11,496,534

  Note: Because of estimation and other rounding procedures, some detail
  may not add to totals and may not match precisely totals in other tables.

  ----------------------------------------------------------------------
Female rates, though significantly lower, reveal similar racial and ethnic disparities. Adult black females were nearly 2 1/2 times more likely than adult Hispanic females and 5 1/2 times more likely than adult white females to have ever served time in State or Federal prison.
Among adult residents in 2001, an estimated 1.7% of black females, 0.7% of Hispanic females and 0.3% of white females had ever been incarcerated in a prison.
Among both men and women who had ever been confined in prison in 2001, blacks outnumbered whites in each age category under age 45; whites outnumbered blacks in nearly every age category 45 or older (table 6). The percentage of blacks declined steadily among each older age group (dropping from 44% among those ages 18 to 24 to 29% among persons 65 or older). The percentage of Hispanics also declined among older age groups (dropping from 24% among those ages 18 to 24 to 8% among those age 65 or older). In contrast, at yearend 2001 the percentage white among all adults ever incarcerated increased from 27% of those ages 18 to 24 to 52% among persons age 65 or older.
  ----------------------------------------------------------------------

  Table 6. Number ever incarcerated in a State or Federal prison, by
  gender, race, Hispanic origin, and age, 2001

                 Number of adults ever incarcerated in a State or Federal prison,
                 by age--

                   18-24       25-34       35-44       45-54      55-64      65 or
                                                                             older

  Gender
    Male         385,000   1,157,000   1,460,000   1,014,000    492,000    529,000
    Female        24,000     129,000     205,000     118,000     47,000     59,000

  Race/Hispanic origin
    White*       112,000     391,000     628,000     497,000    271,000    304,000
      Male       104,000     351,000     555,000     452,000    248,000    269,000
      Female       8,000      41,000      73,000      45,000     23,000     35,000

    Black*       181,000     567,000     681,000     406,000    162,000    169,000
      Male       172,000     509,000     597,000     361,000    146,000    151,000
      Female       9,000      58,000      84,000      45,000     16,000     18,000

    Hispanic      99,000     295,000     309,000     181,000     69,000     46,000
      Male        93,000     271,000     279,000     165,000     63,000     41,000
      Female       6,000      24,000      3,0000      16,000      6,000      5,000

  Note: Estimates were rounded to the nearest 1,000.  See Methodology
  for estimation procedures."

  *Excludes persons of Hispanic origin.

  ----------------------------------------------------------------------
Regardless of gender, race or Hispanic origin, prevalence rates highest among persons age 35 to 44
Although there was wide variation by race, Hispanic origin, and gender, within each subgroup, persons ages 35 to 44 had the highest percents ever incarcerated in 2001. Among men, the percent ever incarcerated rose for each age group to a peak of 6.5% of those ages 35 to 44 and then declined to 3.1% of those age 65 or older (table 7).
  ----------------------------------------------------------------------

  Table 7. Percent of adult population ever incarcerated in a State or
  Federal prison, by gender, race, Hispanic origin, ang age, 2001

            Percent of adult population ever incarcerated in a State
            or Federal prison, by age--"

               18-24    25-34    35-44    45-54    55-64   65 or older

  Gender
    Male         2.7%     6.0%     6.5%     5.3%     4.0%     3.1%
    Female       0.2      0.7      0.9      0.6      0.3      0.2

  Race/Hispanic origin
    White*       0.6%     1.6%     2.0%     1.7%     1.4%     1.1%
      Male       1.1      2.8      3.5      3.1      2.5      2.0
      Female     0.1      0.3      0.5      0.3      0.2      0.2

    Black*       4.4%    10.9%    12.1%     9.5%     6.7%     5.9%
      Male       8.5     20.4     22.0     17.7     13.0     11.6
      Female     0.4      2.1      2.8      1.9      1.1      0.9

    Hispanic     2.2%     5.1%     5.8%     5.2%     3.6%     2.2%
      Male       4.0      9.0     10.0      9.5      6.6      4.1
      Female     0.3      0.8      1.1      0.9      0.6      0.3

  Note: Percents were based on intercensal resident population
  estimates from the U.S. Census Bureau.  See Methodology for data
  sources.

  *Excludes persons of Hispanic origin.


  U.S. adult resident population, 2001

                     18-24        25-34        35-44        45-54        55-64        65 or
                                                                                      older

  Gender
    Male        14,417,325    8,939,186   22,389,203   19,117,478   12,022,028   14,607,040
    Female      13,795,256   19,089,714   22,555,935   19,879,361   13,119,592   20,275,786

  Race/Hispanic origin
    White*      18,303,498   24,885,780   31,782,158   29,517,823   19,800,209   28,884,741
      Male       9,375,574   12,489,397   15,944,122   14,647,562    9,615,049   12,145,733
      Female     8,927,925   12,396,383   15,838,036   14,870,261   10,185,160   16,739,009

    Black*       4,076,908    5,196,820    5,624,914    4,297,967    2,409,671    2,860,327
      Male       2,008,858    2,472,112    2,666,839    1,963,452    1,043,119    1,133,328
      Female     2,068,051    2,724,708    2,958,076    2,334,515    1,366,552    1,726,999

    Hispanic     4,394,592    5,737,009     5,334091    3,448,416    1,936,521    2,098,875
      Male       2,299,849    2,940,171     2,734938    1,696,233      896,361      885,418
      Female     2,094,743    2,796,838     2,599153    1,752,183    1,040,160    1,213,457

  Note: Because of estimation and other rounding procedures, some
  detail may not add to totals and may not match precisely totals
  in other tables.

  ----------------------------------------------------------------------
There was a similar pattern among women, though the percents were lower than for men. An estimated 0.9% of women ages 35 to 44 had ever been in prison, compared to 0.2% for women ages 18 to 24 and age 65 or older.
When rates were estimated separately by race and Hispanic origin, the variations among age groups remained unchanged. In every gender and racial/ethnic group in 2001, the percent of ever having been incarcerated was lowest among the youngest group (those ages 18 to 24)and the oldest age group (age 65 or older).
Among persons ages 35 to 44, more than 22.0% of black males had ever been incarcerated in prison, over twice as high as Hispanic males (10.0%), and over 6 times higher than white males (3.5%). In this same age group, black women (2.8%) were over twice as likely as Hispanic women (1.1%), and nearly 6 times as likely as white women (0.5%) to have been in prison.
Impact of rising first incarceration rate varies by birth cohort
Persons born prior to 1940 were nearly unaffected by the rising first incarceration rates of the 1980's and 1990's. At younger ages (up to the age of 40), the prevalence rates at 5-year age intervals were the same for persons born in 1935 as in 1910 (table 8). The rising rates of first incarceration increased the prevalence of incarceration among those born in 1935 as they reached age 45. Similarly, the prevalence rates rose for those born in 1930 as they reached age 50.
  ----------------------------------------------------------------------

  Table 8. Percent of adults ever incarcerated in a State or Federal
  prison, by year of birth and age

            Percent of adults ever incarcerated in a State or Federal prison, by age--

  Year
  born      20      25      30      35      40      45      50      55      60      65      70      75

  1910      0.4%   0.9%    1.2%    1.3%    1.4%    1.5%    0.5%    1.5%    1.5%    1.5%    1.5%    1.5%
  1915      0.4    0.9     1.2     1.3     1.4     1.5     1.5     1.5     1.5     1.5     1.5     1.6
  1920      0.4    0.9     1.2     1.3     1.4     1.5     1.5     1.5     1.6     1.6     1.6     1.6
  1925      0.4    0.9     1.2     1.3     1.4     1.5     1.5     1.6     1.6     1.6     1.6     1.6
  1930      0.4    0.9     1.2     1.3     1.4     1.5     1.6     1.6     1.7     1.7     1.7    +1.7+
  1935      0.4    0.9     1.2     1.3     1.4     1.6     1.7     1.8     1.8     1.9    +1.9     1.9+
  1940      0.4    0.9     1.2     1.3     1.5     1.7     1.8     2.0     2.0    +2.1     2.1     2.1+
  1945      0.4    0.9     1.2     1.4     1.7     1.9     2.1     2.3    +2.3     2.4     2.4     2.4+
  1950      0.4    1.0     1.4     1.7     2.1     2.4     2.7    +2.8     2.9     2.9     2.9     2.9+
  1955      0.5    1.1     1.7     2.2     2.7     3.2    +3.4     3.6     3.6     3.7     3.7     3.7+
  1960      0.6    1.4     2.1     2.9     3.5    +4.0     4.3     4.4     4.4     4.5     4.5     4.5+
  1965      0.7    1.7     2.8     3.7    +4.4     4.9     5.2     5.3     5.3     5.3     5.4     5.4+
  1970      0.9    2.2     3.4    +4.4     5.1     5.6     5.8     5.9     6.0     6.0     6.0     6.0+
  1975      1.1    2.6    +3.9     4.9     5.7     6.1     6.4     6.5     6.5     6.5     6.5     6.5+
  1980      1.2   +2.7     4.0     5.0     5.7     6.2     6.4     6.5     6.6     6.6     6.6     6.6+

  Note: Based on constant age-specific first incarceration rates after
  2001 (bolded type--indicated with plus (+) signs).

  ----------------------------------------------------------------------
Among persons born after 1935, the effects of rising first incarceration rates occurred at increasingly younger ages. Persons born in 1955 were the first to record higher prevalence rates at all ages, compared to persons born in prior years. At age 45 the percent ever having been in prison reached 3.2% for persons born in 1955 -- more than double the percent at that age among persons born in 1930 or earlier.
The greatest rise occurred in the percents having been incarcerated among the most recent cohorts. For persons born in 1975, 2.6% had been to prison by age 25, nearly equal to the percent among persons born in 1950 who had been to prison by age 50 (2.7%).
Projections for years after 2001 indicate the percent ever incarcerated will rise at an accelerated pace. If rates of first incarceration remain at 2001 levels, 5.4% of persons born in 1965 are expected to have gone to prison by age 75, more than three times the 1.7% of persons born in 1930.
The projected rise in the percent ever incarcerated slows among persons in later cohorts. Of those born in 1970, 6.0% are expected to have been in prison by age 75, compared to 6.5% of those born in 1975, and 6.6% of those born in 1980.
3.4% of adults projected to have served time in prison by 2010
The prevalence of having been to prison will rise among the U.S. adult population as more birth cohorts experience the full impact of current levels of first incarceration. Assuming that current age-specific rates of first incarceration remain at 2001 levels, the number of adults having ever served time in prison is projected to rise to 7.7 million by 2010. A total of 3.4% of the adult population (1 in 29 persons age 18 or older) is expected to have served time in prison.
  ----------------------------------------------------------------------

  Projected prevalence of having gone to State or Federal prison*

  Year           Number    Percent

  2001        5,618,000      2.7%
  2002        5,856,000      2.8
  2003        6,095,000      2.8
  2004        6,332,000      2.9
  2005        6,568,000      3.0
  2006        6,804,000      3.1
  2007        7,040,000      3.1
  2008        7,275,000      3.2
  2009        7,511,000      3.3
  2010        7,745,000      3.4

  *Based on prevalence estimates for exact ages through 2001 and
  projections for exact ages from 2002 through 2010.  See
  Methodology for estimation procedures.


             Projected adult
  Year     resident population

  2001        210,207,901
  2002        212,427,944
  2003        214,688,268
  2004        216,918,713
  2005        219,144,044
  2006        221,409,946
  2007        223,754,193
  2008        226,155,771
  2009        228,520,785
  2010        230,792,746

  ----------------------------------------------------------------------
Lifetime likelihood estimates of going to prison differ from current prevalence estimates
The lifetime likelihood of going to prison is an estimate of the percentage of all persons in a birth cohort expected to go to prison over the course of a lifetime. In contrast, the prevalence of ever having gone to prison is an estimate of the percentage who have ever gone to prison among just the surviving members of all birth cohorts over a specific period.
Estimates of the lifetime likelihood of going to prison project the percentage of persons at birth expected to go to prison, if the entire cohort were subject to a fixed set of rates of first admission to prison and mortality over an entire lifetime. In calculating these estimates, incarceration and mortality rates are fixed at the time of "birth" of the cohort.
Standard life table techniques were used to prepare estimates of the lifetime likelihood of going to prison based on rates of first incarceration during a 12-month period derived from inmate surveys conducted in 1974, 1979, 1986, 1991, and 1997. (See Lifetime Likelihood of Going to State or Federal Prison, NCJ 160092, March 1997, for a description of previous estimates.)
6.6% of persons born in 2001 will go to prison, if current rates of first incarceration remain unchanged
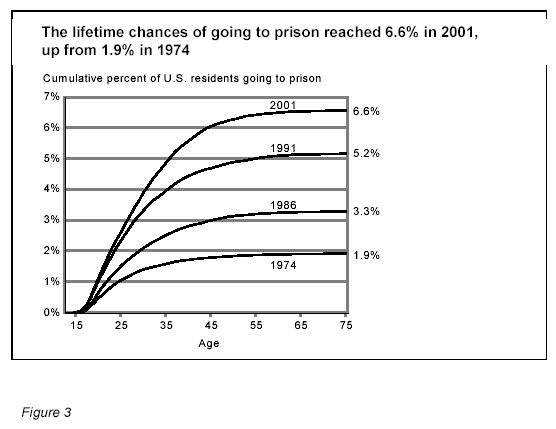
If rates of first incarceration and mortality in 2001 remain unchanged, nearly 1 in 15 persons born in 2001 (6.6%) will go to State or Federal prison during their lifetime (figure 3).
  ----------------------------------------------------------------------

  Figure 3

  The lifetime chances of going to prison reached 6.6% in 2001,
  up from 1.9% in 1974

         Cumulative percent of U.S. residents
         going to prison

  Age    1974     1986     1991     2001

  13      0.0      0.0      0.0      0.0
  14      0.0      0.0      0.0      0.0
  15      0.0      0.0      0.0      0.0
  16      0.0      0.0      0.1      0.0
  17      0.1      0.1      0.2      0.2
  18      0.2      0.2      0.4      0.4
  19      0.3      0.4      0.7      0.8
  20      0.5      0.7      1.1      1.1
  21      0.6      0.9      1.3      1.5
  22      0.7      1.1      1.6      1.8
  23      0.9      1.2      1.9      2.1
  24      1.0      1.4      2.1      2.4
  25      1.1      1.5      2.4      2.6
  26      1.1      1.7      2.6      2.9
  27      1.2      1.8      2.8      3.1
  28      1.3      1.9      3.0      3.4
  29      1.4      2.0      3.2      3.6
  30      1.4      2.1      3.3      3.9
  31      1.5      2.2      3.5      4.1
  32      1.5      2.3      3.6      4.3
  33      1.5      2.4      3.7      4.5
  34      1.6      2.5      3.9      4.7
  35      1.6      2.5      4.0      4.9
  36      1.6      2.6      4.1      5.1
  37      1.7      2.7      4.2      5.2
  38      1.7      2.7      4.3      5.4
  39      1.7      2.8      4.4      5.5
  40      1.7      2.8      4.5      5.6
  41      1.7      2.9      4.5      5.7
  42      1.8      2.9      4.6      5.8
  43      1.8      2.9      4.6      5.9
  44      1.8      3.0      4.7      6.0
  45      1.8      3.0      4.7      6.1
  46      1.8      3.0      4.7      6.1
  47      1.8      3.1      4.8      6.2
  48      1.8      3.1      4.8      6.2
  49      1.8      3.1      4.9      6.2
  50      1.8      3.1      4.9      6.3
  51      1.9      3.2      4.9      6.3
  52      1.9      3.2      4.9      6.4
  53      1.9      3.2      5.0      6.4
  54      1.9      3.2      5.0      6.4
  55      1.9      3.2      5.0      6.4
  56      1.9      3.2      5.0      6.4
  57      1.9      3.2      5.1      6.5
  58      1.9      3.2      5.1      6.5
  59      1.9      3.2      5.1      6.5
  60      1.9      3.3      5.1      6.5
  61      1.9      3.3      5.1      6.5
  62      1.9      3.3      5.1      6.5
  63      1.9      3.3      5.1      6.5
  64      1.9      3.3      5.1      6.5
  65      1.9      3.3      5.1      6.6
  66      1.9      3.3      5.1      6.6
  67      1.9      3.3      5.2      6.6
  68      1.9      3.3      5.2      6.6
  69      1.9      3.3      5.2      6.6
  70      1.9      3.3      5.2      6.6
  71      1.9      3.3      5.2      6.6
  72      1.9      3.3      5.2      6.6
  73      1.9      3.3      5.2      6.6
  74      1.9      3.3      5.2      6.6
  75      1.9      3.3      5.2      6.6

  ----------------------------------------------------------------------
Unlike the yearend 2001 prevalence rate of 2.7%, which represents the cumulative result of the past incarceration experiences of the living adult population, the lifetime likelihood is a hypothetical projection of the future if a birth cohort were to experience a fixed set of rates of first incarceration and mortality over a lifetime.
Between 1974 and 2001, the lifetime chances of going to State or Federal prison for U.S. residents overall in- creased from 1.9% to 6.6%. Each estimate summarized the effects of first incarceration and mortality during a 12-month period in 1974, 1986, 1991, and 2001. The estimates do not take into account changes in rates of first incarceration or mortality that occur after the "birth" of the hypothetical cohort. As a result of steadily rising rates of first incarceration from 1974 to 2001, the lifetime chances of going to prison for persons born in 1974 will be higher than 1.9%. Based on rates of first incarceration through 2001, an estimated 2.6% of persons born in 1975 had already been incarcerated by age 25.
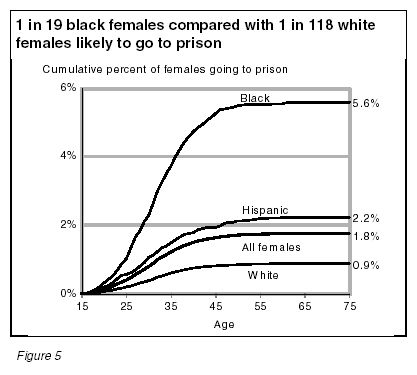
6 times higher lifetime chance of going to prison in 2001 for men than for women
Based on rates of first incarceration in 2001, the lifetime chances for men of going to prison are 6 times greater than those for women (table 9). A male has a 11.3% (or 1 in 9) chance in his life-time of going to prison, while a female has a 1.8% (or 1 in 56) chance. An estimated 9.6% of men and 1.5% of women are expected to go to prison by age 40, as first incarceration rates riserapidly, then decline with advancing age (figures 4 and 5).
  ----------------------------------------------------------------------

  Table 9. Lifetime chances of going to State or Federal prison for
  the first time, by gender, race, and Hispanic orign, 1974-2001

                   Percent of resident population expected to go to
                   State or Federal prison for the first time, by
                   year--

                  1974     1979     1986     1991     1997     2001

  Gender
    Male           3.6%     4.1%     6.0%     9.1%    10.6%    11.3%
    Female         0.3      0.4      0.6      1.1      1.5      1.8

  Race/Hispanic origin
    White*         1.2%     1.4%     2.0%     2.5%     3.1      3.4%
      Male         2.2      2.5      3.6      4.4      5.4      5.9
      Female       0.2      0.2      0.3      0.5      0.7      0.9

    Black*         7.0%     7.2%     9.3%    16.5%    17.7     18.6%
      Male        13.4     13.4     17.4     29.4     31.0     32.2
      Female       1.1      1.4      1.8      3.6      4.9      5.6

    Hispanic       2.2%     3.3%     6.2%     9.5%    10.5     10.0%
      Male         4.0      6.0     11.1     16.3     18.0     17.2
      Female       0.4      0.4      0.9      1.5      2.2      2.2

  Note: Percents represent the chances of being admitted to State or
  Federal prison during a lifetime.

  Estimates were obtained by applying age-specific first incarceration
  and mortality rates for each group to a hypothetical population of
  100,000 births.  See Methodology.

  *Excludes persons of Hispanic origin.

  ----------------------------------------------------------------------
----------------------------------------------------------------------
Figure 4
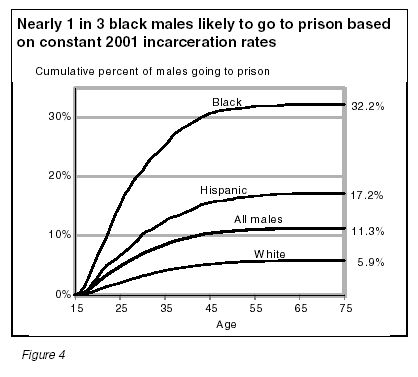
+Nearly 1 in 3 black males likely to go to prison
based on constant 2001 incarceration rates+
Cumulative percent of males going to prison
Age Total White Black Hispanic
13 0.0 0.0 0.0 0.0
14 0.0 0.0 0.0 0.0
15 0.0 0.0 0.0 0.0
16 0.1 0.0 0.3 0.1
17 0.3 0.1 1.3 0.3
18 0.8 0.3 3.0 1.0
19 1.4 0.5 4.9 2.1
20 2.1 0.8 6.7 3.0
21 2.7 1.2 8.2 4.1
22 3.3 1.5 9.8 5.0
23 3.8 1.6 11.8 5.5
24 4.3 1.8 13.7 6.0
25 4.7 2.1 15.1 6.7
26 5.2 2.3 16.9 7.2
27 5.6 2.5 18.0 7.9
28 6.1 2.8 19.3 8.6
29 6.5 3.0 20.2 9.3
30 6.9 3.3 21.0 10.3
31 7.2 3.4 22.2 10.8
32 7.6 3.6 23.2 11.0
33 7.9 3.8 23.8 11.5
34 8.1 4.0 24.5 12.0
35 8.4 4.1 25.2 12.5
36 8.7 4.3 26.1 13.0
37 9.0 4.4 27.2 13.2
38 9.2 4.6 27.7 13.4
39 9.4 4.7 28.2 13.8
40 9.6 4.7 28.6 14.1
41 9.7 4.9 29.1 14.4
42 9.9 5.0 29.5 14.8
43 10.1 5.1 30.0 15.2
44 10.3 5.2 30.3 15.4
45 10.4 5.2 30.7 15.6
46 10.5 5.3 30.8 15.8
47 10.6 5.3 31.1 15.9
48 10.6 5.4 31.2 15.9
49 10.7 5.5 31.3 16.1
50 10.7 5.5 31.4 16.1
51 10.8 5.5 31.5 16.4
52 10.9 5.6 31.6 16.5
53 10.9 5.7 31.7 16.6
54 11.0 5.7 31.8 16.7
55 11.0 5.7 31.9 16.8
56 11.0 5.7 32.0 16.8
57 11.1 5.7 32.0 16.9
58 11.1 5.8 32.0 16.9
59 11.1 5.8 32.0 17.0
60 11.1 5.8 32.0 17.1
61 11.2 5.8 32.1 17.1
62 11.2 5.8 32.2 17.1
63 11.2 5.8 32.2 17.1
64 11.2 5.8 32.2 17.2
65 11.2 5.9 32.2 17.2
66 11.2 5.9 32.2 17.2
67 11.2 5.9 32.2 17.2
68 11.2 5.9 32.2 17.2
69 11.2 5.9 32.2 17.2
70 11.2 5.9 32.2 17.2
71 11.3 5.9 32.2 17.2
72 11.3 5.9 32.2 17.2
73 11.3 5.9 32.2 17.2
74 11.3 5.9 32.2 17.2
75 11.3 5.9 32.2 17.2
----------------------------------------------------------------------
  ----------------------------------------------------------------------

  Figure 5

  1 in 19 black females compared with 1 in 118 white
  females likely to go to prison

         Cumulative percent of females
         going to prison

  Age    Total    White    Black   Hispanic

  13      0.0      0.0      0.0      0.0
  14      0.0      0.0      0.0      0.0
  15      0.0      0.0      0.0      0.0
  16      0.0      0.0      0.0      0.0
  17      0.0      0.0      0.1      0.1
  18      0.1      0.0      0.1      0.1
  19      0.1      0.0      0.2      0.1
  20      0.1      0.1      0.3      0.2
  21      0.2      0.1      0.4      0.3
  22      0.2      0.1      0.5      0.3
  23      0.3      0.1      0.7      0.5
  24      0.3      0.2      0.9      0.5
  25      0.4      0.2      1.0      0.6
  26      0.5      0.2      1.4      0.6
  27      0.5      0.3      1.7      0.7
  28      0.6      0.3      1.8      0.8
  29      0.7      0.4      2.1      0.9
  30      0.8      0.4      2.3      1.1
  31      0.9      0.4      2.7      1.1
  32      1.0      0.5      3.0      1.2
  33      1.1      0.5      3.3      1.3
  34      1.1      0.6      3.5      1.4
  35      1.2      0.6      3.7      1.5
  36      1.3      0.6      4.0      1.6
  37      1.3      0.7      4.2      1.7
  38      1.4      0.7      4.4      1.7
  39      1.4      0.7      4.6      1.8
  40      1.5      0.8      4.7      1.8
  41      1.5      0.8      4.9      1.9
  42      1.6      0.8      4.9      1.9
  43      1.6      0.8      5.1      1.9
  44      1.6      0.8      5.2      1.9
  45      1.6      0.8      5.3      1.9
  46      1.7      0.8      5.4      2.0
  47      1.7      0.8      5.4      2.1
  48      1.7      0.8      5.4      2.1
  49      1.7      0.8      5.5      2.1
  50      1.7      0.9      5.5      2.1
  51      1.7      0.9      5.5      2.1
  52      1.7      0.9      5.5      2.1
  53      1.7      0.9      5.5      2.2
  54      1.7      0.9      5.5      2.2
  55      1.7      0.9      5.5      2.2
  56      1.7      0.9      5.5      2.2
  57      1.7      0.9      5.5      2.2
  58      1.7      0.9      5.6      2.2
  59      1.7      0.9      5.6      2.2
  60      1.7      0.9      5.6      2.2
  61      1.8      0.9      5.6      2.2
  62      1.8      0.9      5.6      2.2
  63      1.8      0.9      5.6      2.2
  64      1.8      0.9      5.6      2.2
  65      1.8      0.9      5.6      2.2
  66      1.8      0.9      5.6      2.2
  67      1.8      0.9      5.6      2.2
  68      1.8      0.9      5.6      2.2
  69      1.8      0.9      5.6      2.2
  70      1.8      0.9      5.6      2.2
  71      1.8      0.9      5.6      2.2
  72      1.8      0.9      5.6      2.2
  73      1.8      0.9      5.6      2.2
  74      1.8      0.9      5.6      2.2
  75      1.8      0.9      5.6      2.2

  ----------------------------------------------------------------------
In 2001, the chances of going to prison were highest among black males (32.2%)and Hispanic males (17.2%) and lowest among white males (5.9%). The lifetime chances of going to prison among black females (5.6%) were nearly as high as for white males. Hispanic females (2.2%) and white females (0.9%) had much lower chances of going to prison.
As a result of changes in first incarceration and mortality rates between 1974 and 2001, black males experienced a greater increase in the chances of going to prison over the course of a lifetime than any other group (from 13.4% in 1974 to 32.2% in 2001). Hispanic males experienced the second largest increase (from 4.0% in 1974 to 17.2% in 2001). White males experienced a smaller increase (from 2.2% in 1974 to 5.9% in 2001).
The lifetime chances of going to prison increased more rapidly for black females (from 1.1% in 1974 to 5.6% in 2001) than for white males. Hispanic females (from 0.4% in 1974 to 2.2% in 2001) and white females (from 0.2% in 1974 to 0.9% in 2001) had smaller increases in their lifetime chances of going to prison.
At every age men have higher chances of going to prison than women, and blacks and Hispanics have higher chances than whites. Based on current rates of first incarceration, an estimated 6.7% of black males will enter State or Federal prison by the time they are age 20, compared to 3.0% of Hispanic males and 0.8% of white males.
Methodology
Life table techniques
Life table techniques previously used to illustrate the implications of prevailing incarceration rates in 1991 have been extended to model the incarceration experience of actual generations of U.S. residents. (See Lifetime Likelihood of Going to State or Federal Prison, NCJ 160092, March 1997.) These generation life tables provide the data needed to estimate the number of living persons who have ever been incarcerated.
A generation life table traces a birth cohort of 100,000 persons through their entire lives, subjecting them to the observed age-specific mortality and incarceration rates which they encountered in each subsequent calendar year of life. The procedure is known as a double-decrement life table because there are two forms of exit from the initial 100,000 birth cohort. The procedure yields estimates of the number of persons in the birth cohort who are incarcerated for the first time each year or who die.
At each year of age, the estimated number of living persons ever incarcerated is equal to the number of persons identified as a prisoner for the first time that year plus the number of surviving members of the birth cohort who were prisoners in prior years. The age-specific prevalence rate for members of the birth cohort is obtained by dividing the surviving number of persons ever incarcerated by the number of members of the 100,000 birth cohort who have survived to the current age (including both those never incarcerated and those ever incarcerated).
  ----------------------------------------------------------------------

  Appendix table 1.  Calculating the number of persons ever
  incarcerated in State or Federal prison, 2001

                 Prevalence of ever going to prison, 2001

                           U.S. resident
                             population,
  Year of     Age in            2000[a]      Percent[b]   Number[c]
  birth       2001               (1)           (2)          (3)

  1983-1901   18 or older    210,207,901       2.673     5618000

  2001-1988   0-13            56,557,383       0.000           0
  1987        14               4,063,179       0.000           0
  1986        15               4,071,585       0.000           0
  1985        16               4,083,677       0.036       1,000
  1984        17               4,117,221       0.174       7,000
  1983        18               4,022,021       0.453      18,000
  1982        19               4,327,407       0.794      34,000
  1981        20               4,264,552       1.146      49,000
  1980        21               4,140,721       1.510      63,000
  1979        22               3,935,452       1.845      73,000
  1978        23               3,756,052       2.155      81,000
  1977        24               3,766,377       2.428      91,000
  1976        25               3,643,765       2.676      97,000
  1975        26               3,572,926       2.911     104,000
  1974        27               3,579,019       3.082     110,000
  1973        28               3,386,129       3.252     110,000
  1972        29               3,876,011       3.360     130,000
  1971        30               3,989,205       3.506     140,000
  1970        31               4,032,301       3.584     145,000
  1969        32               3,993,019       3.689     147,000
  1968        33               3,899,282       3.764     147,000
  1967        34               4,057,246       3.824     155,000
  1966        35               4,110,892       3.857     159,000
  1965        36               4,182,093       3.895     163,000
  1964        37               4,416,302       3.887     172,000
  1963        38               4,265,440       3.840     164,000
  1962        39               4,826,377       3.778     182,000
  1961        40               4,725,422       3.692     174,000
  1960        41               4,634,371       3.641     169,000
  1959        42               4,597,285       3.563     164,000
  1958        43               4,518,648       3.507     158,000
  1957        44               4,668,310       3.439     161,000
  1956        45               4,464,137       3.356     150,000
  1955        46               4,227,667       3.267     138,000
  1954        47               4,192,570       3.180     133,000
  1953        48               3,863,432       3.068     119,000
  1952        49               4,131,847       2.953     122,000
  1951        50               3,838,209       2.819     108,000
  1950        51               3,595,173       2.688      97,000
  1949        52               3,516,992       2.584      91,000
  1948        53               3,497,820       2.475      87,000
  1947        54               3,668,994       2.397      88,000
  1946        55               3,180,818       2.341      74,000
  1945        56               2,746,790       2.280      63,000
  1944        57               2,788,492       2.220      62,000
  1943        58               2,665,273       2.173      58,000
  1942        59               2,710,967       2.131      58,000
  1941        60               2,398,614       2.086      50,000
  1940-1931   61-70           19,778,402        ...      377,000
  1930-1901   71 or older     23,755,091        ...      384,000

  [a] The number of U.S. residents on December 31, 2001, by age, were
  based on projections for July 1, 2000, and July 1, 2001.

  (See Projections of the Resident Population by Age, Sex,, Race and
  Hispanic Origin: 1999 to 2100, U.S. Census Bureau, NP-D1-A, middle
  series.)  The data were adjusted for the undercount in the 1990
  decennial census.

  [b] Based on separate generation life tables starting in the year of
  birth of the persons at each year of age.  (See Appendix tables 2
  and 3 for calculations for selected years of birth.)

  [c] Estimates were calculated by multiplying column (1) by column (2)
  and rounded to the nearest 1,000.

  ... Not shown, because all calculations were based on rates for single
  years of age.

  ----------------------------------------------------------------------
To model the incarceration experience of the adult resident population in 2001, a separate generation life table was needed for each birth cohort born from 1901 to 1983. For example, of those born in 1980 and alive in 2001, an estimated 1.510% had ever gone to prison (Appendix table 1, column 2). Multiplying by 4,140,721 U.S. residents age 21 in 2001 (column 1), produced an estimate of 63,000 persons, age 21 in 2001, who had ever been incarcerated (column 3).
Similarly, the generation life table for the 1970 birth cohort produced an estimated prevalence of 3.584% among those age 31 in 2001. Multiplying by 4,032,301 U.S. residents age 31 in 2001 resulted in an estimated 145,000 persons age 31 in 2001 who had ever been incarcerated. The estimated 5,618,000 adults ever incarcerated in 2001 was obtained by summing the number of persons ever incarcerated, age 18 or older. Dividing by the adult resident population of 210,207,901 yielded an estimated prevalence of ever having gone to prison of 2.673% in 2001.
Estimating prevalence of imprisonment in the United States
To illustrate the application of generation life table techniques resulting in the 1.510% rate of ever having gone to prison among persons born in 1980, consider the following calculations:
1. Estimates of the number of persons in a population of 100,000 born in 1980 who died during each age interval were obtained by multiplying the age-specific mortality rate (Appendix table 2, column 2) by the number of persons alive and not previously incarcerated at each age (column 1).
* For example, among persons who reached age 21 without having been previously incarcerated, a total of 92 were estimated to have died (column 3) before reaching age 22 (that is, 96,607 times the mortality rate of 0.000955).
2. The number of persons in the 1980 cohort who were at risk to incarceration during an age interval was then calculated by subtracting the number dying from the number of persons who were alive and not previously incarcerated at the beginning of the age interval (column 1 minus column 3).
* An estimated 96,515 of the persons who survived to age 21 without being incarcerated were at risk to first incarceration at age 21.
3. The number of persons in the original 100,000 population estimated to have been admitted to prison at each age (column 5) was then obtained by multiplying the age-specific first admission rates (column 4)by the number of persons alive and not previously incarcerated.
* Among persons born in 1980 who had not been previously incarcerated by age 21, 343 were estimated to have been incarcerated before they reached age 22 (that is, 96,515 times the first incarceration rate of .003557).
4. The number of living persons at each age who had ever gone to prison was then calculated by summing the number going to prison for the first time during that year of age (column 5) plus the number of members of the 1980 birth cohort who previously went to prison and survived until the next year of age (column 6 times the survival rate, not shown).
* Of the 1,132 persons who had gone to prison and reached age 20, 1,131 survived to reach age 21. An additional 343 persons were expected to be incarcerated for the first time before reaching age 22 (for a cumulative total of 1,474).
5. The percent of persons at each specific age who had ever gone to prison (column 7) was then calculated by dividing the number of persons who had ever gone to prison and were still alive (column 6) by all persons who were still alive (including persons never incarcerated plus ever incarcerated).
* Among persons age 21, the prevalence rate was 1.510%, obtained by dividing 1,474 (column 6) by 97,646 (column 1 minus columns 3 and 5, plus 1,474), times 100%.
Prevalence rates for other birth cohorts were calculated using similar procedures. For example, to estimate the percent of persons age 31 in 2001 who had ever gone to prison, the calculations were applied to the 1970 birth cohort. However, the rates of first incarceration (column 4) and mortality (column 2) used in the calculations were unique to the birth cohort. (Note the differences between Appendix tables 2 and 3.)
  ----------------------------------------------------------------------

  +Appendix table 2.  Estimating the prevalence of imprisonment in the
  U.S. population for persons born in 1980+

                          Population of 100,000 births, 1980, reduced by mortality and
                          incarceration in each successive year of age


                        Number alive
                        and not                                   Rate of first                     Surviving
                        incarcerated                              admission to      Expected        cumulative
                        at beginning    Number       Expected     State or          number of       number of
  Age at                of age          dying per    number of    Federal prison    first           first            Prevalence
  first                 interval        100,000      deaths[a]    per 100,000       admissions[b]   admissions[c]    percent[d]
  admission    Year        (1)            (2)           (3)           (4)               (5)            (6)              (7)

  0-13         1980-93    100,000         ...          1,732           0                 0              0              0.000%
  14           1994        98,268         44              43           1                 1              1              0.001
  15           1995        98,224         57              56           5                 5              6              0.006
  16           1996        98,163         73              72          39                38             44              0.045
  17           1997        98,053         84              83         135               132            176              0.180
  18           1998        97,838         93              91         283               277            453              0.462
  19           1999        97,470         93              91         346               337            789              0.806
  20           2000        97,043         94              91         355               344           1132              1.158
  21           2001        96,607         96              92         356               343           1474              1.510


  Note: Calculations for ages 0 to 13 were based on data for each
  single year of age and then grouped for presentation.

  ... Not shown, because calculations were based on rates for single
  years of age.

  [a] To estimate the number expected to die at each year of age,
  age-specific mortality rates(column 2) were multiplied by the number
  of persons alive and not previously incarcerated (column 1).

  [b] To estimate the number expected to go to prison at each year of
  age, age-specific first admission rates (column 4) were multiplied
  by the number of persons surviving (column 1 minus column 3).

  [c] To estimate the surviving number of first admissions, the number
  of first admissions from the x-th year of age (column 5) were added
  to the number of surviving first admissions from the x-1 year of age.
  Mortality rates for ex-prisoners by age were based on mortality rates
  in the general population and adjusted to reflect higher ex-prisoner
  mortality.

  [d]To estimate the prevalence percent, this procedure was followed.

  The surviving number of persons ever incarcerated (column 6) was
  divided by the total number of surviving persons never incarcerated
  (column 1 minus both columns 3 and 5) and persons ever incarcerated
  (column 6), times 100%.

  ----------------------------------------------------------------------
  ----------------------------------------------------------------------

  Appendix table 3.  Estimating the prevalence of imprisonment in the
  U.S. population for persons born in 1970

                               Population of 100,000 births, 1970, reduced by mortality and
                               incarceration in each successive year of age

                            Number alive                            Rate of first
                            and not                                 admission                       Surviving
                            incarcerated                            to State        Expected        cumulative
                            at beginning   Number      Expected     or Federal      number of       number of
                            of age         dying per   number of    prison per      first           first           Prevalence
  Age at first              interval       100,000     deaths[a]    100,000         admissions[b]   admissions[c]   percent[d]
  admission       Year           (1)          (2)        (3)          (4)              (5)              (6)            (7)

  0-13         1970-83      100,000         ...        2,099             0               0                0           0.000%
  14           1984          97,901         49            48             1               1                1           0.001
  15           1985          97,852         62            61             0               0                1           0.001
  16           1986          97,791         73            71            24              23               24           0.025
  17           1987          97,697         86            84            74              73               97           0.099
  18           1988          97,539         96            94           186             181              278           0.285
  19           1989          97,265        102            99           265             258              535           0.549
  20           1990          96,907        107           103           331             320              855           0.878
  21           1991          96,484        110           107           266             257            1,110           1.142
  22           1992          96,121        113           109           305             293            1,402           1.444
  23           1993          95,719        111           106           272             260            1,660           1.711
  24           1994          95,353        108           103           279             266            1,924           1.985
  25           1995          94,984        104            99           230             218            2,139           2.210
  26           1996          94,668        100            94           232             219            2,356           2.436
  27           1997          94,354        100            94           217             205            2,558           2.648
  28           1998          94,055         97            92           257             241            2,796           2.897
  29           1999          93,722        102            95           218             204            2,997           3.108
  30           2000          93,422        104            97           275             257            3,250           3.374
  31           2001          93,068        110           102           218             203            3,448           3.584

  Note: Calculations for ages 0 to 13 were based on data for each
  single year of age and then grouped for presentation.

  ... Not shown, because calculations were based on rates for
  single years of age.

  [a] To estimate the number expected to die at each year of age,
  age-specific mortality rates(column 2) were multiplied by the number
  of persons alive and not previously incarcerated (column 1).

  [b] To estimate the number expected to go to prison at each year of
  age, age-specific first admission rates (column 4) were multiplied
  by the number of persons surviving (column 1 minus column 3).

  [c] To estimate the surviving number of first admissions, the number
  of first admissions from the x-th year of age (column 5) were added
  to the number of surviving first admissions from the x-1 year of age.
  Mortality rates for ex-prisoners by age were based on mortality rates
  in the general population and adjusted to reflect higher ex-prisoner
  mortality.

  [d] To estimate the prevalence percent, this procedure was followed.
  The surviving number of persons ever incarcerated (column 6) was
  divided by the total number of surviving persons never incarcerated
  (column 1 minus both columns 3 and 5) and persons ever incarcerated
  (column 6), times 100%.

  ----------------------------------------------------------------------
Limitations
1. The data in this report are restricted to incarcerations in State or Federal prison. Excluded are prior incarcerations in local jails and juvenile facilities because of the lack of data needed to estimate the number of first admissions to these forms of correctional supervision.
2. Estimates of the number of first admissions are subject to sampling and nonsampling errors. Because the numbers of first admissions are based on a sample rather than a complete enumeration, the estimated number of first admissions may vary depending on the size of the estimate and the base population for each demographic group.
Nonsampling error can be attributed to many sources, such as nonresponse, differences in interpretation of questions, recall difficulties, and processing errors. Among inmates, the number of first admissions may be slightly overestimated because of underreporting of criminal histories. The full extent of nonsampling error is unknown.
3. No comparable inmate survey was conducted prior 1974 to enable the calculation of first incarceration rates prior to this date. First incarceration rates in 1970 and earlier were estimated to be 80% of each age-specific rate of first incarceration in 1974.
If first incarceration rates in 1970 and earlier had averaged 90% of each age-specific first incarceration rate in 1974, the estimated number of adults alive in 2001 who had ever gone to prison would have been 1.9% higher (5,723,000). Alternatively, if earlier first incarceration rates had averaged 70% of 1974 rates, the estimated number of persons ever to have been incarcerated in 2001 would have been-1.9% lower (5,513,000).
4. Mortality rate schedules for prisoners were not available. Compared with the general population, mortality rates for prisoners were estimated to be 20% higher for adults under age 65, and the same for those age 65 and older. The estimate was based on the lower overall educational attainment of prisoners, and longitudinal studies documenting the relationship between mortality and educational attainment.
If mortality rates for adults ever incarcerated, under age 65 were instead 40% higher than that of the general population, the estimated prevalence of ever having gone to prison in 2001 would be 5,567,000 (-0.9% less). If mortality rates for prisoners had been equal to that of the general population, the estimated prevalence would have been 0.9% higher in 2001 (5,670,000).
5. Comparable mortality rates prior to 1976 were not available. However, there is minimal effect of declining mortality rates since 1900 on the estimated number of persons ever incarcerated. Prevalence rates are only affected to the extent that there may have been a different decline in mortality among those ever incarcerated (the numerator) compared with all surviving members of a birth cohort (the denominator). Furthermore, prevalence rates were applied to estimates of the U.S. resident population (which fully reflect declines in mortality).
6. Age-specific incarceration rates do not incorporate a forecast of future rates of imprisonment, which may be affected by changes in criminal behavior, law enforcement, and in sentencing policies. Consequently, the lifetime likelihood of incarceration, 2001, and projected prevalence rates for 2002 and beyond may be different.
A fuller description of the methodological techniques used in preparing this report is available upon request from the author.
The Bureau of Justice Statistics is the statistical agency of the U.S. Department of Justice. Lawrence A. Greenfeld is director. BJS Special Reports address a specific topic in depth from one or many data sets that cover many topics.
Thomas P. Bonczar wrote this report, under the supervision of Allen J. Beck. Tom Hester and Carolyn C. Williams edited the report. Jayne E. Robinson administered final production.
August 2003, NCJ 197976
This report in portable document format and in ASCII, its tables, and related statistical data are available at the BJS World Wide Web Internet site: http://www.ojp.usdoj.gov/bjs/
askbjs AT ojp.usdoj.gov
(202) 307-0765
End of the Project Gutenberg EBook of Prevalence of Imprisonment in the U.S.
Population, 1974-2001, by Thomas P. Bonczar

*** END OF THIS PROJECT GUTENBERG EBOOK IMPRISONMENT, 1974-2001 ***

***** This file should be named 29211-h.htm or 29211-h.zip *****
This and all associated files of various formats will be found in:
        https://www.gutenberg.org/2/9/2/1/29211/

Produced by Al Haines

Updated editions will replace the previous one--the old editions
will be renamed.

Creating the works from public domain print editions means that no
one owns a United States copyright in these works, so the Foundation
(and you!) can copy and distribute it in the United States without
permission and without paying copyright royalties.  Special rules,
set forth in the General Terms of Use part of this license, apply to
copying and distributing Project Gutenberg-tm electronic works to
protect the PROJECT GUTENBERG-tm concept and trademark.  Project
Gutenberg is a registered trademark, and may not be used if you
charge for the eBooks, unless you receive specific permission.  If you
do not charge anything for copies of this eBook, complying with the
rules is very easy.  You may use this eBook for nearly any purpose
such as creation of derivative works, reports, performances and
research.  They may be modified and printed and given away--you may do
practically ANYTHING with public domain eBooks.  Redistribution is
subject to the trademark license, especially commercial
redistribution.


*** START: FULL LICENSE ***

THE FULL PROJECT GUTENBERG LICENSE
PLEASE READ THIS BEFORE YOU DISTRIBUTE OR USE THIS WORK

To protect the Project Gutenberg-tm mission of promoting the free
distribution of electronic works, by using or distributing this work
(or any other work associated in any way with the phrase "Project
Gutenberg"), you agree to comply with all the terms of the Full Project
Gutenberg-tm License (available with this file or online at
https://gutenberg.org/license).


Section 1.  General Terms of Use and Redistributing Project Gutenberg-tm
electronic works

1.A.  By reading or using any part of this Project Gutenberg-tm
electronic work, you indicate that you have read, understand, agree to
and accept all the terms of this license and intellectual property
(trademark/copyright) agreement.  If you do not agree to abide by all
the terms of this agreement, you must cease using and return or destroy
all copies of Project Gutenberg-tm electronic works in your possession.
If you paid a fee for obtaining a copy of or access to a Project
Gutenberg-tm electronic work and you do not agree to be bound by the
terms of this agreement, you may obtain a refund from the person or
entity to whom you paid the fee as set forth in paragraph 1.E.8.

1.B.  "Project Gutenberg" is a registered trademark.  It may only be
used on or associated in any way with an electronic work by people who
agree to be bound by the terms of this agreement.  There are a few
things that you can do with most Project Gutenberg-tm electronic works
even without complying with the full terms of this agreement.  See
paragraph 1.C below.  There are a lot of things you can do with Project
Gutenberg-tm electronic works if you follow the terms of this agreement
and help preserve free future access to Project Gutenberg-tm electronic
works.  See paragraph 1.E below.

1.C.  The Project Gutenberg Literary Archive Foundation ("the Foundation"
or PGLAF), owns a compilation copyright in the collection of Project
Gutenberg-tm electronic works.  Nearly all the individual works in the
collection are in the public domain in the United States.  If an
individual work is in the public domain in the United States and you are
located in the United States, we do not claim a right to prevent you from
copying, distributing, performing, displaying or creating derivative
works based on the work as long as all references to Project Gutenberg
are removed.  Of course, we hope that you will support the Project
Gutenberg-tm mission of promoting free access to electronic works by
freely sharing Project Gutenberg-tm works in compliance with the terms of
this agreement for keeping the Project Gutenberg-tm name associated with
the work.  You can easily comply with the terms of this agreement by
keeping this work in the same format with its attached full Project
Gutenberg-tm License when you share it without charge with others.

1.D.  The copyright laws of the place where you are located also govern
what you can do with this work.  Copyright laws in most countries are in
a constant state of change.  If you are outside the United States, check
the laws of your country in addition to the terms of this agreement
before downloading, copying, displaying, performing, distributing or
creating derivative works based on this work or any other Project
Gutenberg-tm work.  The Foundation makes no representations concerning
the copyright status of any work in any country outside the United
States.

1.E.  Unless you have removed all references to Project Gutenberg:

1.E.1.  The following sentence, with active links to, or other immediate
access to, the full Project Gutenberg-tm License must appear prominently
whenever any copy of a Project Gutenberg-tm work (any work on which the
phrase "Project Gutenberg" appears, or with which the phrase "Project
Gutenberg" is associated) is accessed, displayed, performed, viewed,
copied or distributed:

This eBook is for the use of anyone anywhere at no cost and with
almost no restrictions whatsoever.  You may copy it, give it away or
re-use it under the terms of the Project Gutenberg License included
with this eBook or online at www.gutenberg.org

1.E.2.  If an individual Project Gutenberg-tm electronic work is derived
from the public domain (does not contain a notice indicating that it is
posted with permission of the copyright holder), the work can be copied
and distributed to anyone in the United States without paying any fees
or charges.  If you are redistributing or providing access to a work
with the phrase "Project Gutenberg" associated with or appearing on the
work, you must comply either with the requirements of paragraphs 1.E.1
through 1.E.7 or obtain permission for the use of the work and the
Project Gutenberg-tm trademark as set forth in paragraphs 1.E.8 or
1.E.9.

1.E.3.  If an individual Project Gutenberg-tm electronic work is posted
with the permission of the copyright holder, your use and distribution
must comply with both paragraphs 1.E.1 through 1.E.7 and any additional
terms imposed by the copyright holder.  Additional terms will be linked
to the Project Gutenberg-tm License for all works posted with the
permission of the copyright holder found at the beginning of this work.

1.E.4.  Do not unlink or detach or remove the full Project Gutenberg-tm
License terms from this work, or any files containing a part of this
work or any other work associated with Project Gutenberg-tm.

1.E.5.  Do not copy, display, perform, distribute or redistribute this
electronic work, or any part of this electronic work, without
prominently displaying the sentence set forth in paragraph 1.E.1 with
active links or immediate access to the full terms of the Project
Gutenberg-tm License.

1.E.6.  You may convert to and distribute this work in any binary,
compressed, marked up, nonproprietary or proprietary form, including any
word processing or hypertext form.  However, if you provide access to or
distribute copies of a Project Gutenberg-tm work in a format other than
"Plain Vanilla ASCII" or other format used in the official version
posted on the official Project Gutenberg-tm web site (www.gutenberg.org),
you must, at no additional cost, fee or expense to the user, provide a
copy, a means of exporting a copy, or a means of obtaining a copy upon
request, of the work in its original "Plain Vanilla ASCII" or other
form.  Any alternate format must include the full Project Gutenberg-tm
License as specified in paragraph 1.E.1.

1.E.7.  Do not charge a fee for access to, viewing, displaying,
performing, copying or distributing any Project Gutenberg-tm works
unless you comply with paragraph 1.E.8 or 1.E.9.

1.E.8.  You may charge a reasonable fee for copies of or providing
access to or distributing Project Gutenberg-tm electronic works provided
that

- You pay a royalty fee of 20% of the gross profits you derive from
     the use of Project Gutenberg-tm works calculated using the method
     you already use to calculate your applicable taxes.  The fee is
     owed to the owner of the Project Gutenberg-tm trademark, but he
     has agreed to donate royalties under this paragraph to the
     Project Gutenberg Literary Archive Foundation.  Royalty payments
     must be paid within 60 days following each date on which you
     prepare (or are legally required to prepare) your periodic tax
     returns.  Royalty payments should be clearly marked as such and
     sent to the Project Gutenberg Literary Archive Foundation at the
     address specified in Section 4, "Information about donations to
     the Project Gutenberg Literary Archive Foundation."

- You provide a full refund of any money paid by a user who notifies
     you in writing (or by e-mail) within 30 days of receipt that s/he
     does not agree to the terms of the full Project Gutenberg-tm
     License.  You must require such a user to return or
     destroy all copies of the works possessed in a physical medium
     and discontinue all use of and all access to other copies of
     Project Gutenberg-tm works.

- You provide, in accordance with paragraph 1.F.3, a full refund of any
     money paid for a work or a replacement copy, if a defect in the
     electronic work is discovered and reported to you within 90 days
     of receipt of the work.

- You comply with all other terms of this agreement for free
     distribution of Project Gutenberg-tm works.

1.E.9.  If you wish to charge a fee or distribute a Project Gutenberg-tm
electronic work or group of works on different terms than are set
forth in this agreement, you must obtain permission in writing from
both the Project Gutenberg Literary Archive Foundation and Michael
Hart, the owner of the Project Gutenberg-tm trademark.  Contact the
Foundation as set forth in Section 3 below.

1.F.

1.F.1.  Project Gutenberg volunteers and employees expend considerable
effort to identify, do copyright research on, transcribe and proofread
public domain works in creating the Project Gutenberg-tm
collection.  Despite these efforts, Project Gutenberg-tm electronic
works, and the medium on which they may be stored, may contain
"Defects," such as, but not limited to, incomplete, inaccurate or
corrupt data, transcription errors, a copyright or other intellectual
property infringement, a defective or damaged disk or other medium, a
computer virus, or computer codes that damage or cannot be read by
your equipment.

1.F.2.  LIMITED WARRANTY, DISCLAIMER OF DAMAGES - Except for the "Right
of Replacement or Refund" described in paragraph 1.F.3, the Project
Gutenberg Literary Archive Foundation, the owner of the Project
Gutenberg-tm trademark, and any other party distributing a Project
Gutenberg-tm electronic work under this agreement, disclaim all
liability to you for damages, costs and expenses, including legal
fees.  YOU AGREE THAT YOU HAVE NO REMEDIES FOR NEGLIGENCE, STRICT
LIABILITY, BREACH OF WARRANTY OR BREACH OF CONTRACT EXCEPT THOSE
PROVIDED IN PARAGRAPH F3.  YOU AGREE THAT THE FOUNDATION, THE
TRADEMARK OWNER, AND ANY DISTRIBUTOR UNDER THIS AGREEMENT WILL NOT BE
LIABLE TO YOU FOR ACTUAL, DIRECT, INDIRECT, CONSEQUENTIAL, PUNITIVE OR
INCIDENTAL DAMAGES EVEN IF YOU GIVE NOTICE OF THE POSSIBILITY OF SUCH
DAMAGE.

1.F.3.  LIMITED RIGHT OF REPLACEMENT OR REFUND - If you discover a
defect in this electronic work within 90 days of receiving it, you can
receive a refund of the money (if any) you paid for it by sending a
written explanation to the person you received the work from.  If you
received the work on a physical medium, you must return the medium with
your written explanation.  The person or entity that provided you with
the defective work may elect to provide a replacement copy in lieu of a
refund.  If you received the work electronically, the person or entity
providing it to you may choose to give you a second opportunity to
receive the work electronically in lieu of a refund.  If the second copy
is also defective, you may demand a refund in writing without further
opportunities to fix the problem.

1.F.4.  Except for the limited right of replacement or refund set forth
in paragraph 1.F.3, this work is provided to you 'AS-IS' WITH NO OTHER
WARRANTIES OF ANY KIND, EXPRESS OR IMPLIED, INCLUDING BUT NOT LIMITED TO
WARRANTIES OF MERCHANTIBILITY OR FITNESS FOR ANY PURPOSE.

1.F.5.  Some states do not allow disclaimers of certain implied
warranties or the exclusion or limitation of certain types of damages.
If any disclaimer or limitation set forth in this agreement violates the
law of the state applicable to this agreement, the agreement shall be
interpreted to make the maximum disclaimer or limitation permitted by
the applicable state law.  The invalidity or unenforceability of any
provision of this agreement shall not void the remaining provisions.

1.F.6.  INDEMNITY - You agree to indemnify and hold the Foundation, the
trademark owner, any agent or employee of the Foundation, anyone
providing copies of Project Gutenberg-tm electronic works in accordance
with this agreement, and any volunteers associated with the production,
promotion and distribution of Project Gutenberg-tm electronic works,
harmless from all liability, costs and expenses, including legal fees,
that arise directly or indirectly from any of the following which you do
or cause to occur: (a) distribution of this or any Project Gutenberg-tm
work, (b) alteration, modification, or additions or deletions to any
Project Gutenberg-tm work, and (c) any Defect you cause.


Section  2.  Information about the Mission of Project Gutenberg-tm

Project Gutenberg-tm is synonymous with the free distribution of
electronic works in formats readable by the widest variety of computers
including obsolete, old, middle-aged and new computers.  It exists
because of the efforts of hundreds of volunteers and donations from
people in all walks of life.

Volunteers and financial support to provide volunteers with the
assistance they need are critical to reaching Project Gutenberg-tm's
goals and ensuring that the Project Gutenberg-tm collection will
remain freely available for generations to come.  In 2001, the Project
Gutenberg Literary Archive Foundation was created to provide a secure
and permanent future for Project Gutenberg-tm and future generations.
To learn more about the Project Gutenberg Literary Archive Foundation
and how your efforts and donations can help, see Sections 3 and 4
and the Foundation web page at https://www.pglaf.org.


Section 3.  Information about the Project Gutenberg Literary Archive
Foundation

The Project Gutenberg Literary Archive Foundation is a non profit
501(c)(3) educational corporation organized under the laws of the
state of Mississippi and granted tax exempt status by the Internal
Revenue Service.  The Foundation's EIN or federal tax identification
number is 64-6221541.  Its 501(c)(3) letter is posted at
https://pglaf.org/fundraising.  Contributions to the Project Gutenberg
Literary Archive Foundation are tax deductible to the full extent
permitted by U.S. federal laws and your state's laws.

The Foundation's principal office is located at 4557 Melan Dr. S.
Fairbanks, AK, 99712., but its volunteers and employees are scattered
throughout numerous locations.  Its business office is located at
809 North 1500 West, Salt Lake City, UT 84116, (801) 596-1887, email
business@pglaf.org.  Email contact links and up to date contact
information can be found at the Foundation's web site and official
page at https://pglaf.org

For additional contact information:
     Dr. Gregory B. Newby
     Chief Executive and Director
     gbnewby@pglaf.org


Section 4.  Information about Donations to the Project Gutenberg
Literary Archive Foundation

Project Gutenberg-tm depends upon and cannot survive without wide
spread public support and donations to carry out its mission of
increasing the number of public domain and licensed works that can be
freely distributed in machine readable form accessible by the widest
array of equipment including outdated equipment.  Many small donations
($1 to $5,000) are particularly important to maintaining tax exempt
status with the IRS.

The Foundation is committed to complying with the laws regulating
charities and charitable donations in all 50 states of the United
States.  Compliance requirements are not uniform and it takes a
considerable effort, much paperwork and many fees to meet and keep up
with these requirements.  We do not solicit donations in locations
where we have not received written confirmation of compliance.  To
SEND DONATIONS or determine the status of compliance for any
particular state visit https://pglaf.org

While we cannot and do not solicit contributions from states where we
have not met the solicitation requirements, we know of no prohibition
against accepting unsolicited donations from donors in such states who
approach us with offers to donate.

International donations are gratefully accepted, but we cannot make
any statements concerning tax treatment of donations received from
outside the United States.  U.S. laws alone swamp our small staff.

Please check the Project Gutenberg Web pages for current donation
methods and addresses.  Donations are accepted in a number of other
ways including including checks, online payments and credit card
donations.  To donate, please visit: https://pglaf.org/donate


Section 5.  General Information About Project Gutenberg-tm electronic
works.

Professor Michael S. Hart was the originator of the Project Gutenberg-tm
concept of a library of electronic works that could be freely shared
with anyone.  For thirty years, he produced and distributed Project
Gutenberg-tm eBooks with only a loose network of volunteer support.


Project Gutenberg-tm eBooks are often created from several printed
editions, all of which are confirmed as Public Domain in the U.S.
unless a copyright notice is included.  Thus, we do not necessarily
keep eBooks in compliance with any particular paper edition.


Most people start at our Web site which has the main PG search facility:

     https://www.gutenberg.org

This Web site includes information about Project Gutenberg-tm,
including how to make donations to the Project Gutenberg Literary
Archive Foundation, how to help produce our new eBooks, and how to
subscribe to our email newsletter to hear about new eBooks.