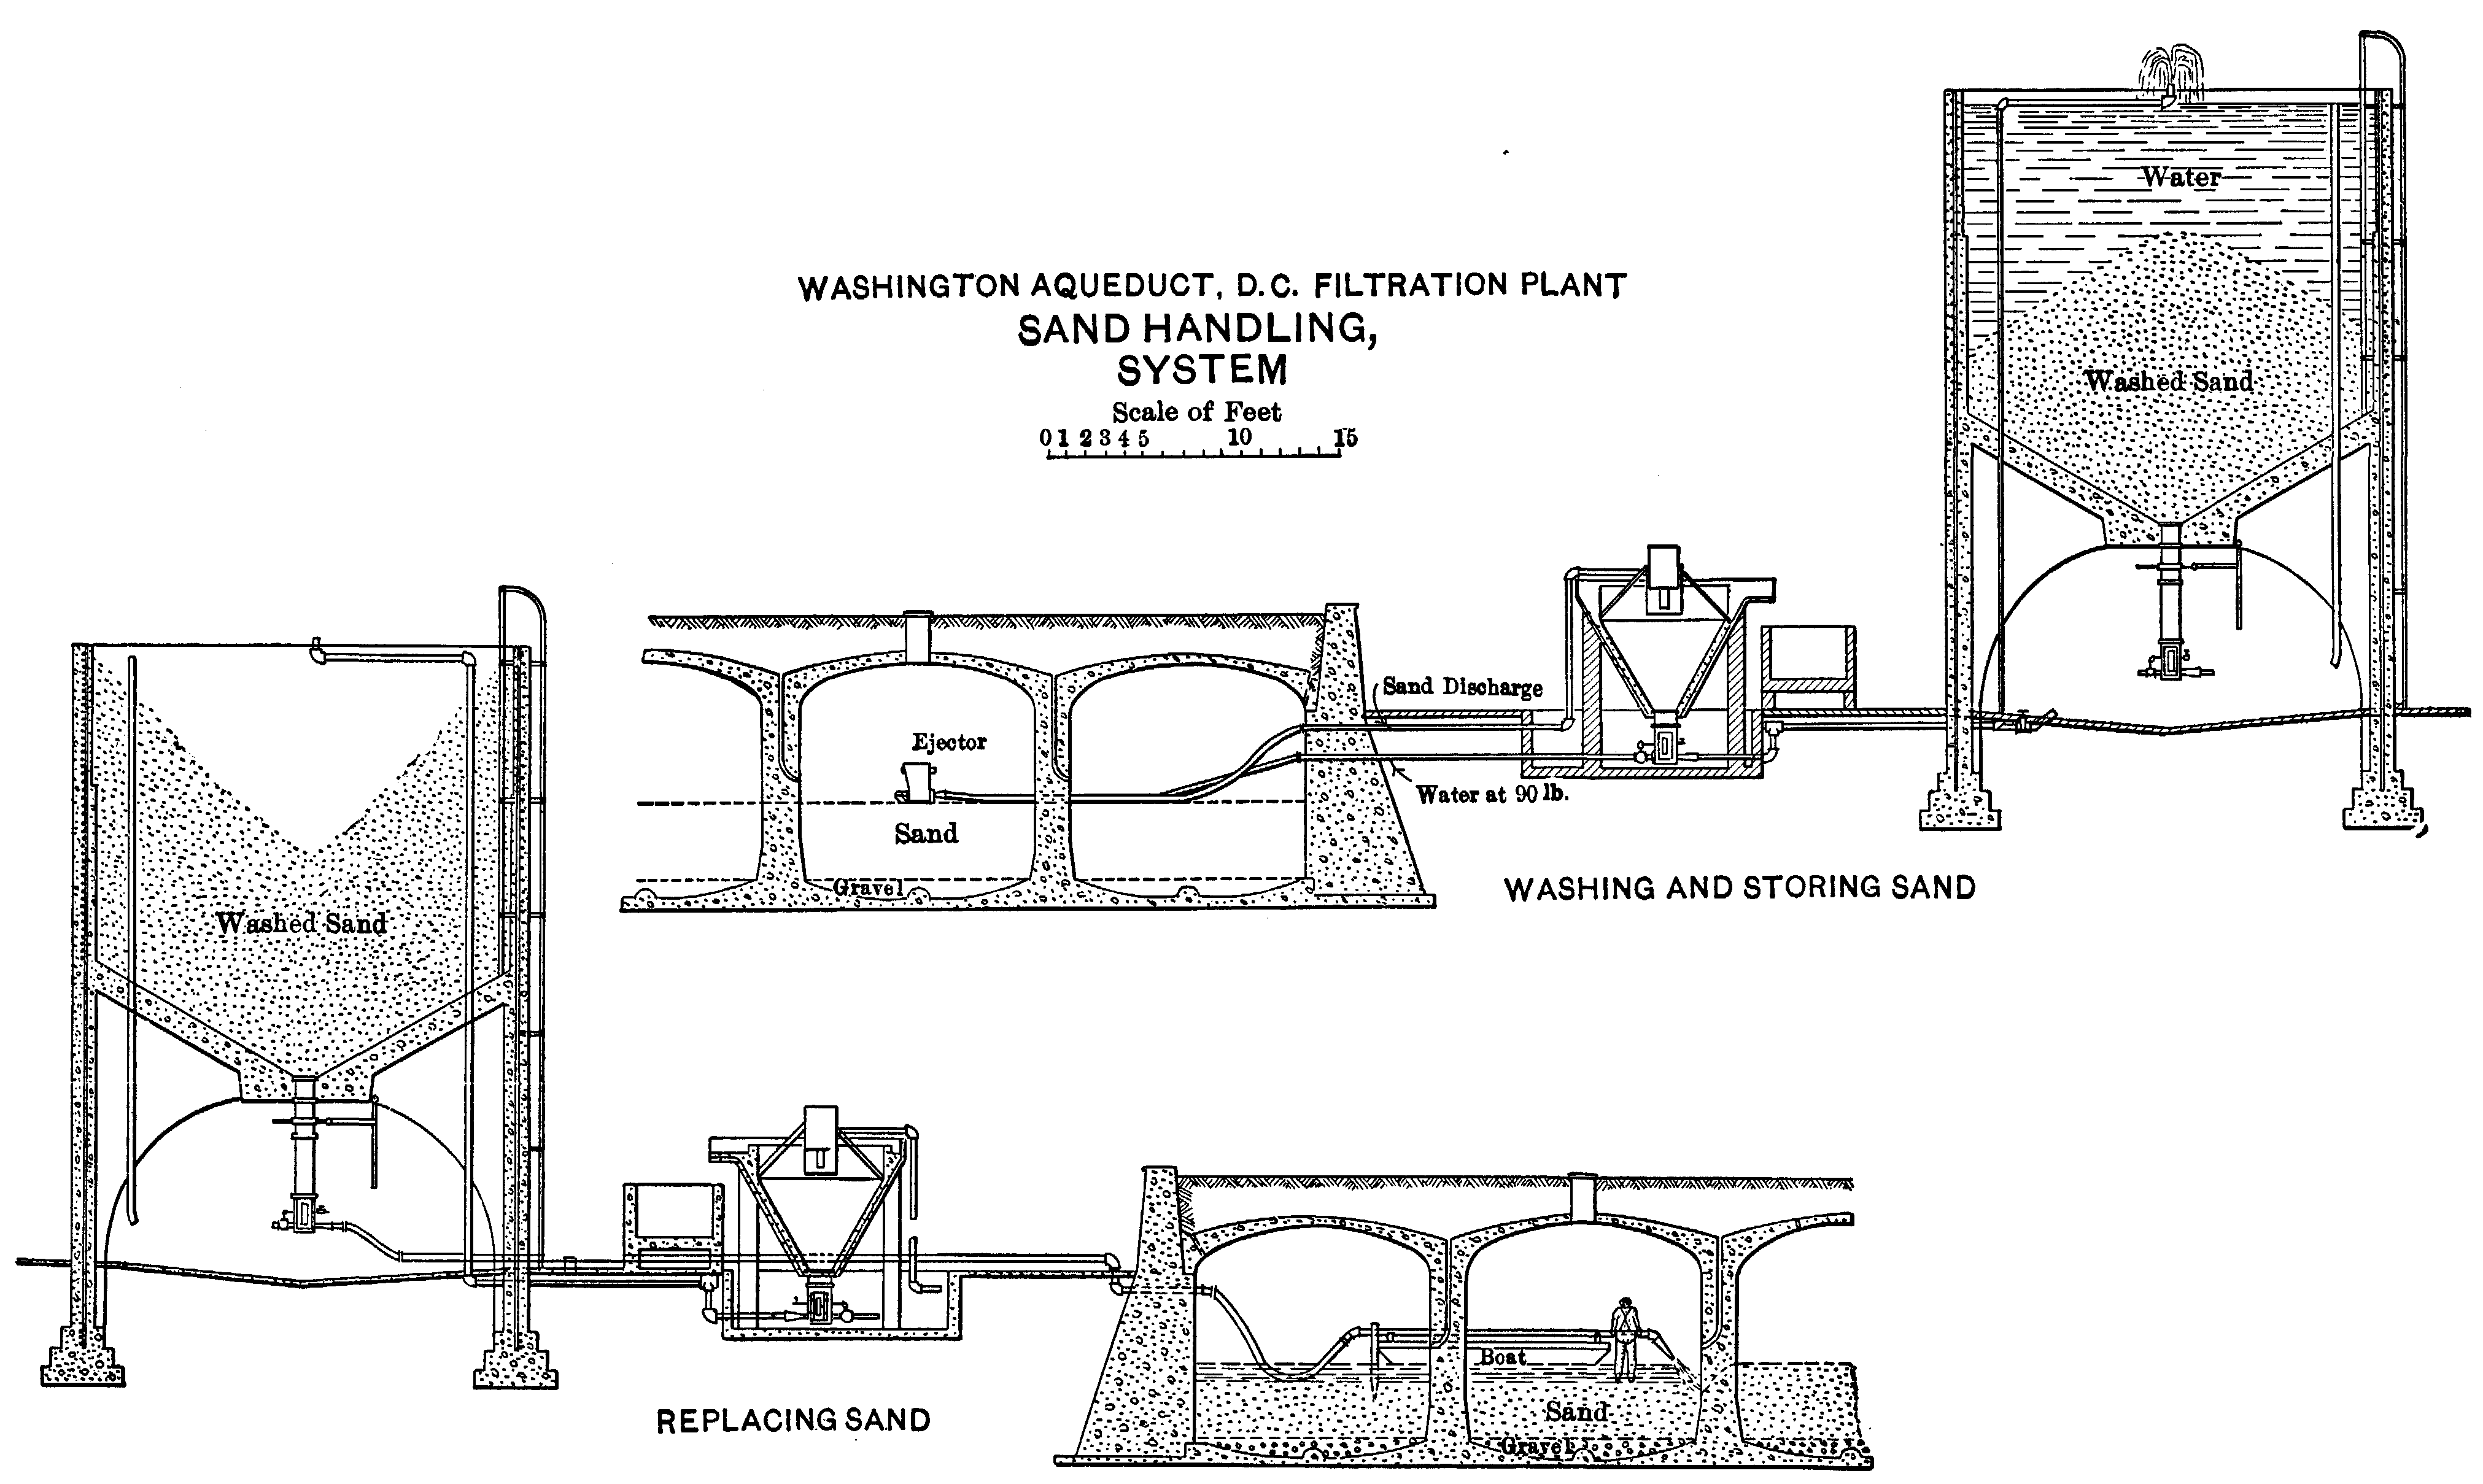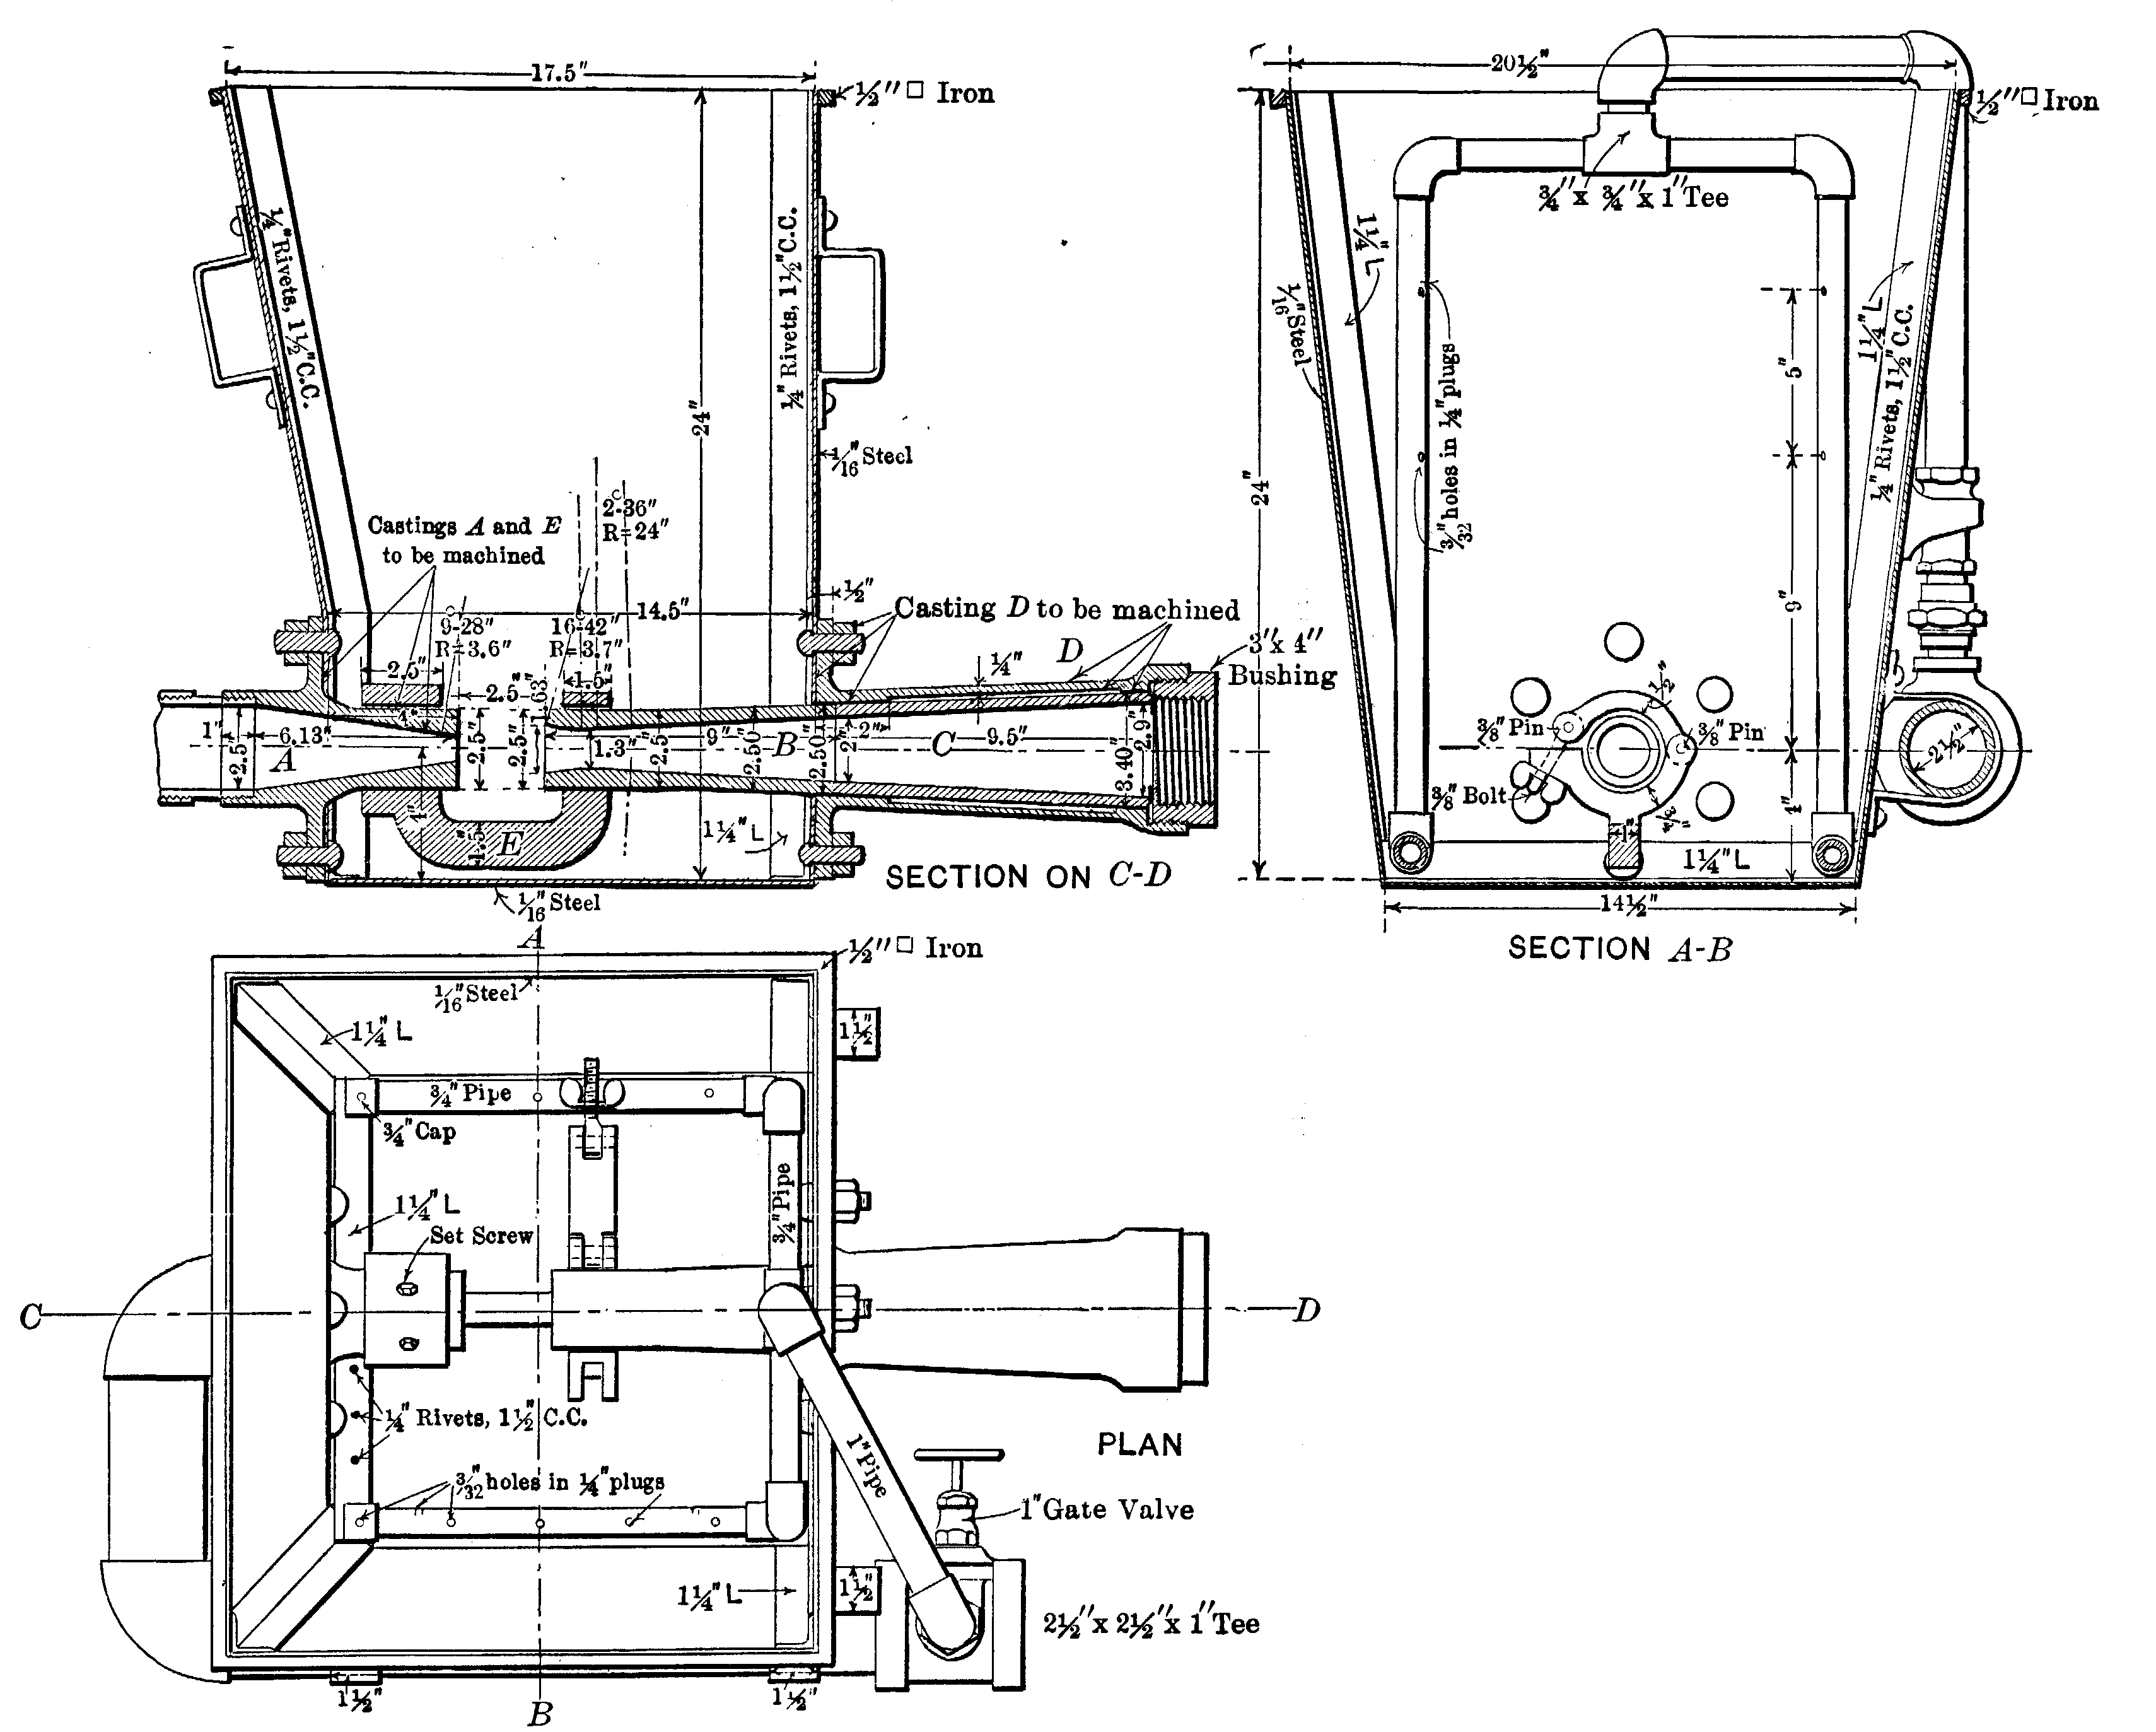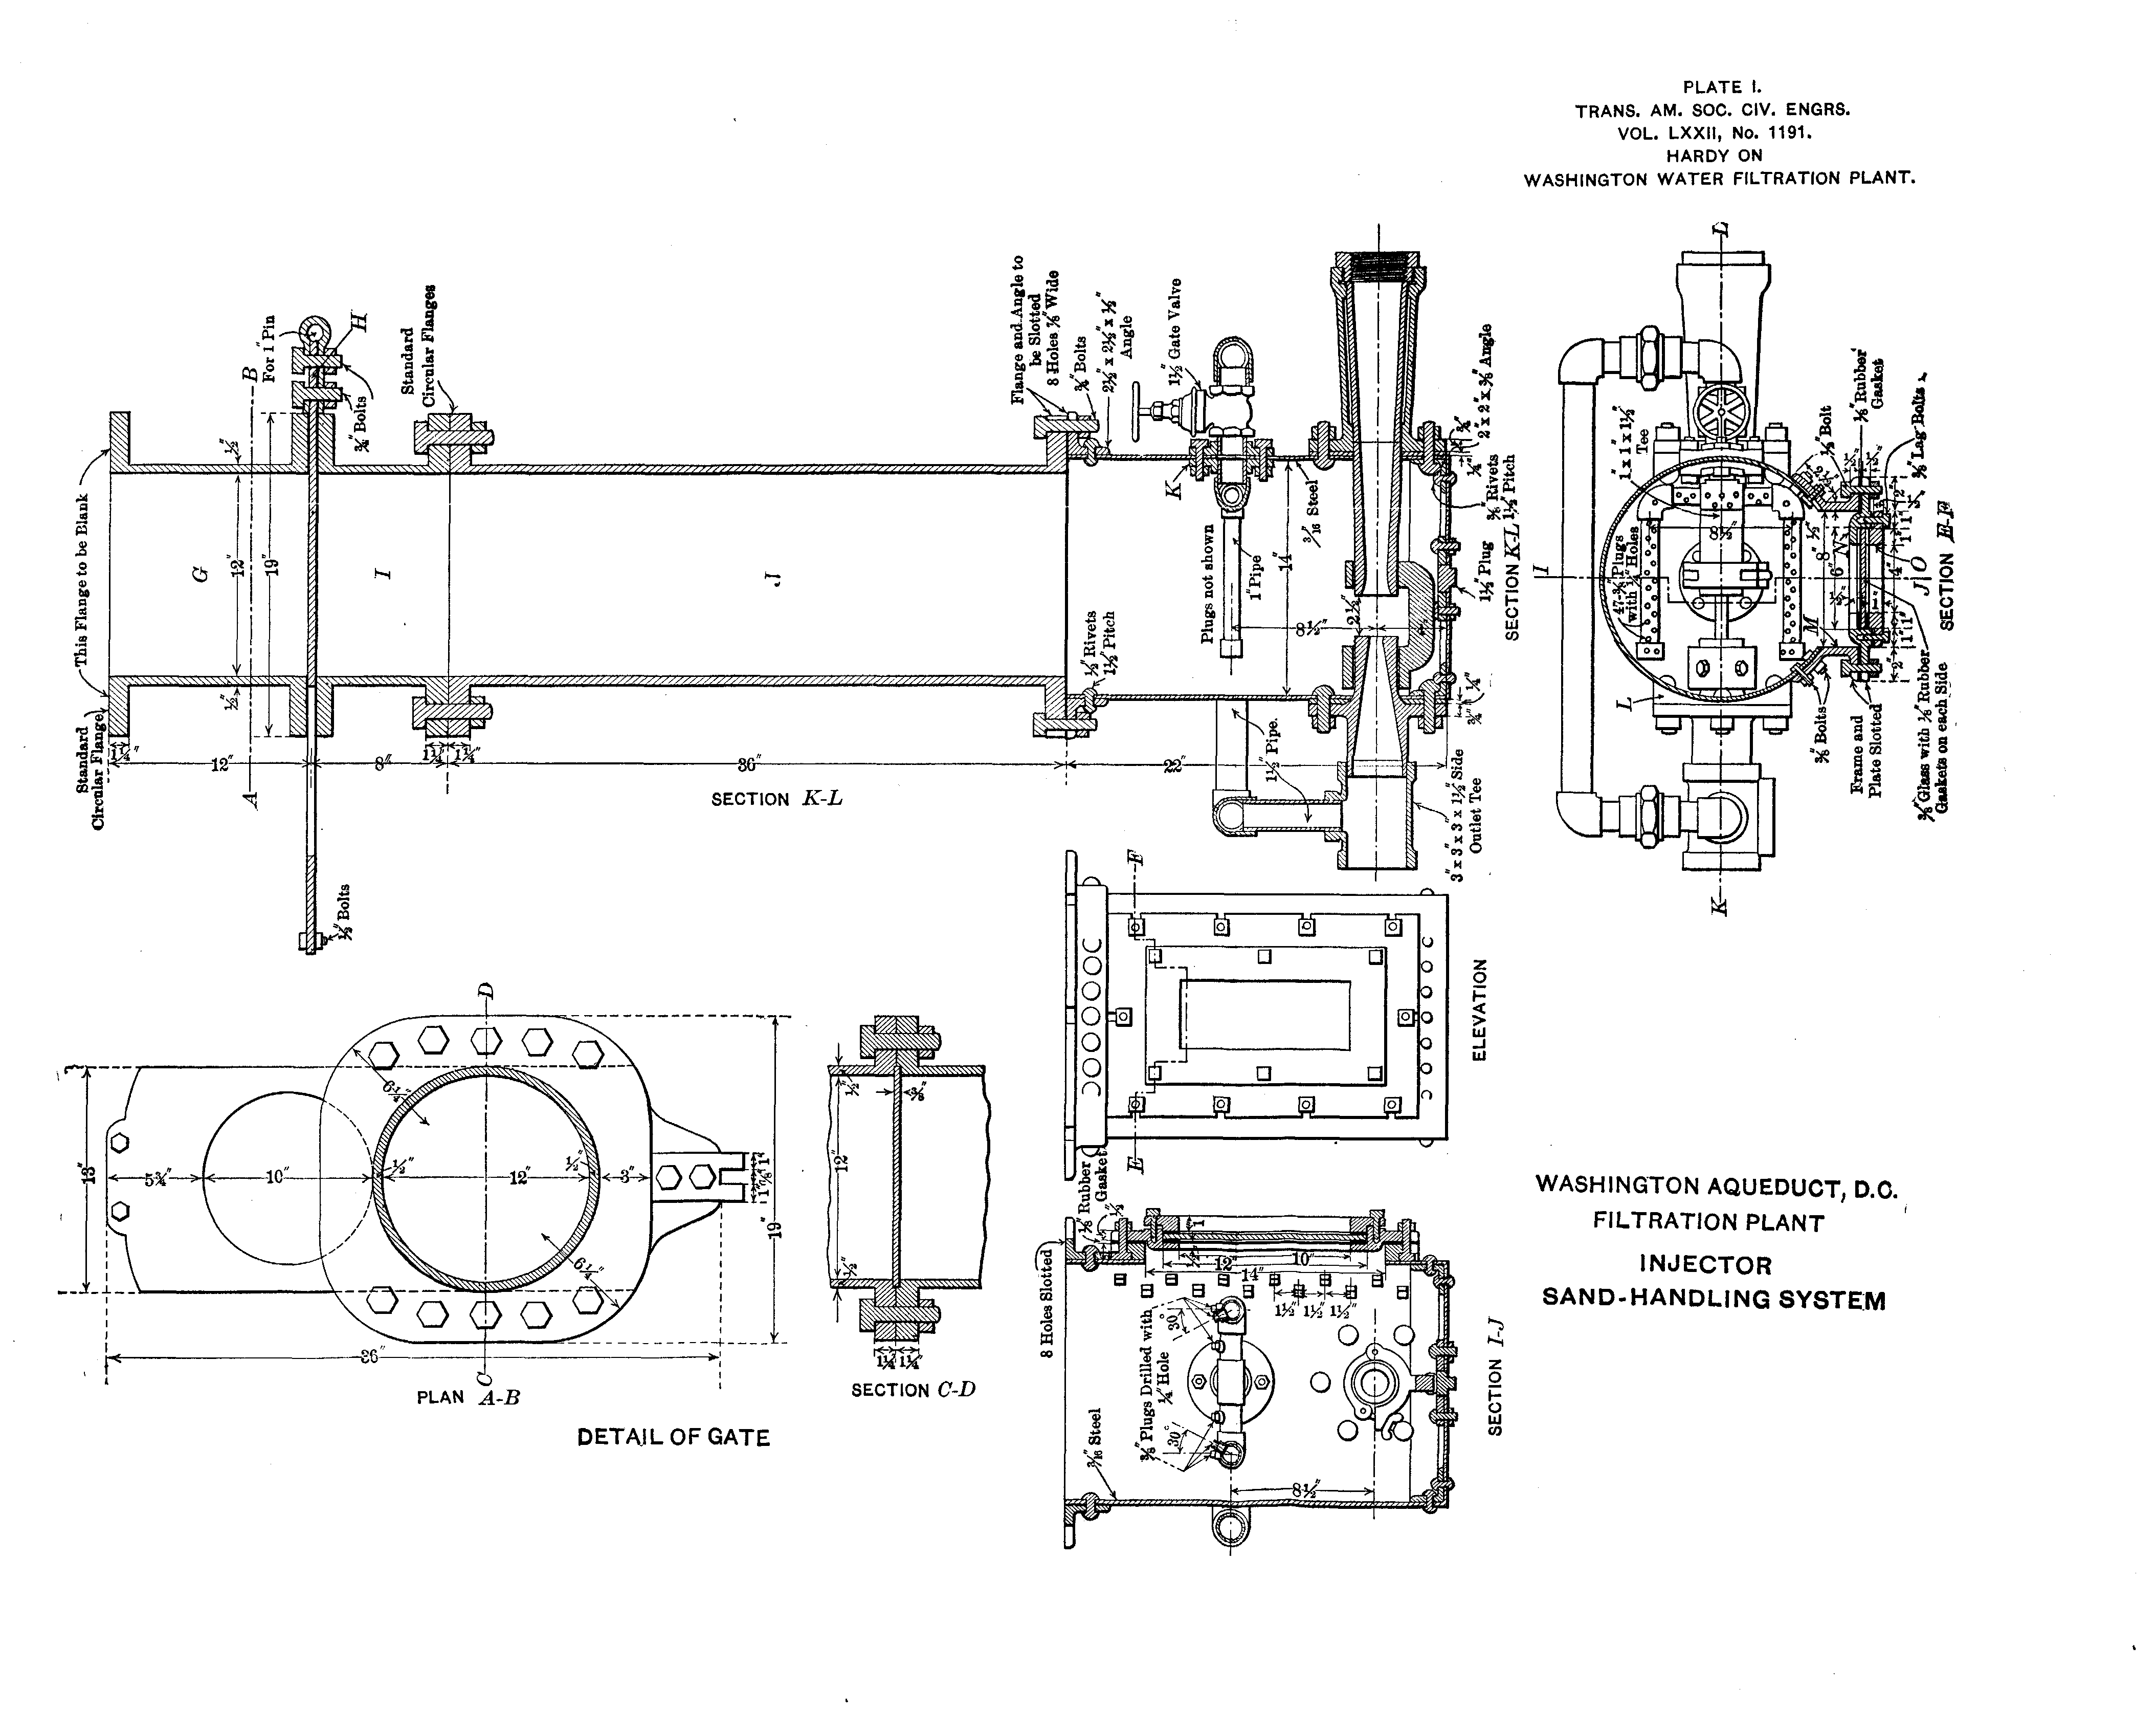
Plate 1: Washington Aqueduct, D. C. Filtration Plant Injector Sand-Handling System
The Project Gutenberg EBook of Transactions of the American Society of
Civil Engineers, vol. LXXII, June, 1911, by E. D. Hardy

This eBook is for the use of anyone anywhere at no cost and with
almost no restrictions whatsoever.  You may copy it, give it away or
re-use it under the terms of the Project Gutenberg License included
with this eBook or online at www.gutenberg.org


Title: Transactions of the American Society of Civil Engineers, vol. LXXII, June, 1911
       Water Purification Plant, Washington, D. C. Results of Operation.  Paper No. 1191.

Author: E. D. Hardy

Release Date: December 27, 2008 [EBook #27632]

Language: English

Character set encoding: ISO-8859-1

*** START OF THIS PROJECT GUTENBERG EBOOK SOC. CIVIL ENGINEERS, JUNE 1911 ***


Produced by Juliet Sutherland, Christina and the Online
Distributed Proofreading Team at https://www.pgdp.net
The Washington filtration plant has already been fully described.2 At the time that paper was written (November, 1906), the filtration plant had been in operation for only about 1 year. It has now been in continuous operation for 5 years, and many data on the cost, efficiency, and methods of operation, have accumulated in the various records and books which have been kept. It is thought that a brief review of the results, and a summary of the records in tabular form, will be of interest to the members of the Society, and it is also hoped that the discussion of this paper will bring out the comparative results of operation of other filter plants. As a matter of convenience, the following general description of the plant is given.
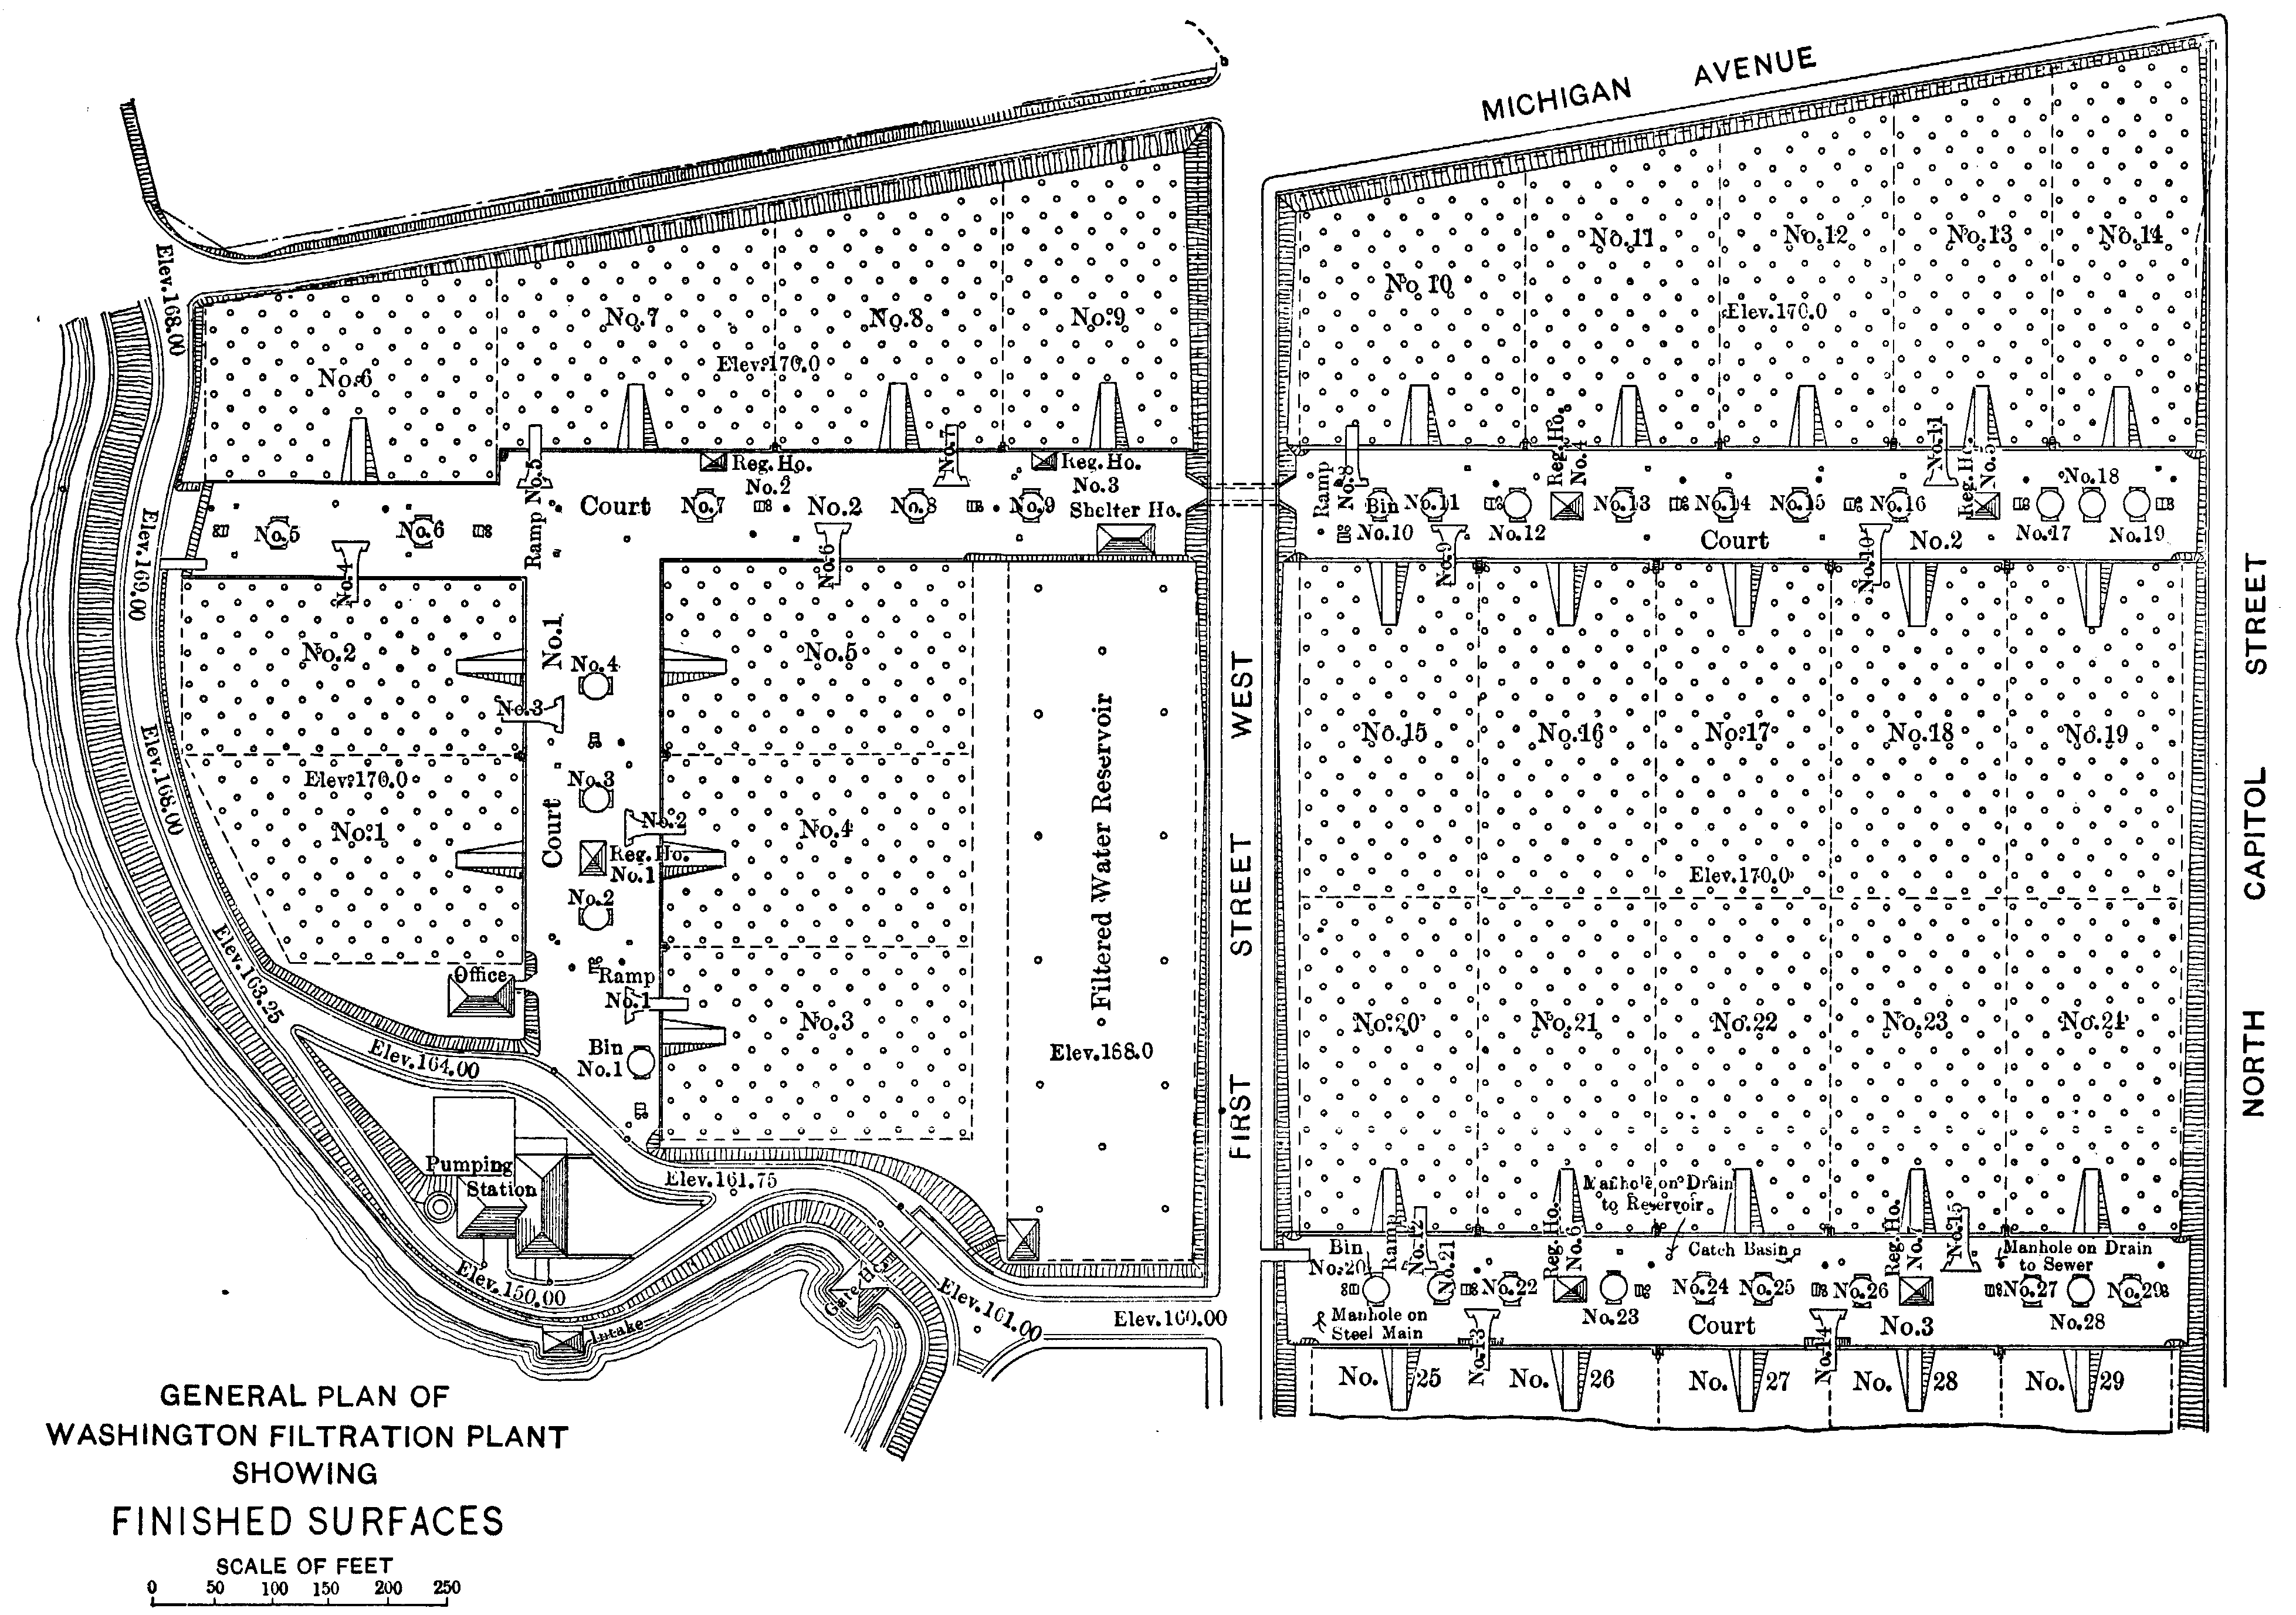
Description of the Filtration Plant.—The Washington filtration plant was completed and put in operation in October, 1905. It consists of a pumping station for raising the water from the McMillan Park Reservoir to the filter beds; 29 filters of the slow sand type, having an effective area of 1 acre each; the filtered-water reservoir, having a capacity of about 15,000,000 gal.; and the necessary piping and valves for carrying water, controlling rates of filtration, etc.
In the pumping station, there are three centrifugal pumps, which are directly connected to tandem compound engines; two sand‑washer pumps; three small electric generating sets for furnishing electric light; and four 200‑h.p., water-tube boilers.
Each of the centrifugal pumps has a nominal capacity of 40,000,000 gal. per day when pumping against a head of 21 ft., and each sand‑washer pump has a capacity of 2,500,000 gal. when pumping against a head of 250 ft. The electric light engines and generators supply the current for lighting the pumping station, the office and laboratory and other buildings, and also the courts and interior of the filter beds, and for operating a machine‑shop.
The filters and filtered‑water reservoir are built entirely of concrete masonry. The floors are of inverted groined arches on which rest the piers for supporting the groined arch vaulting. All this concrete work is similar to that in the Albany, Philadelphia, and Pittsburg filters.
The filters contain, on an average, 40 in. of filter sand and 12 in. of filter gravel. The gravel is graded from coarse to fine; the lower and coarser part acts as part of the under‑drain system, and the upper and finest layer supports the filter sand. The raw water from the pumps is carried to the filters through riveted steel rising mains which have 20‑in. cast‑iron branches for supplying the individual filters. The filtered water is collected in the under‑drainage system of the several filter beds, and is carried through 20‑in., cast‑iron pipes to the regulator‑houses. These regulator‑houses contain the necessary valves, registering apparatus, etc., for regulating the rate of filtration, showing the loss of head, shutting down a filter, filling a filter with filtered water from the under‑drains, and for turning the water back into the raw‑water reservoir, or wasting it into the sewer. From the regulator‑houses, the filtered water flows directly to thefiltered‑water reservoir. Generally, five filters are controlled from one house, but there are two cases where the regulator‑houses are smaller, and only two filters are controlled from each.
The dirty sand removed from the filters is carried by a portable ejector through one or more lengths of 3‑in. hose and a fixed line of 4‑in. pipe, to the sand washers. From the sand washers, the washed sand is carried to the reinforced concrete storage bins, each of which has a capacity of 250 cu. yd., and is at such an elevation that carts may be driven under it and loaded through a gate.
Until April, 1909, the sand was replaced in the filters by carts which were filled through the gates in the sand bins. It was then hauled to the top of the filter beds and dumped through the manholes on the chutes, which could be revolved in any direction. These chutes were used to prevent the sand from being unduly compacted in the vicinity of the manholes, and to facilitate spreading it in the filters. Since April, 1909, all the sand has been replaced by the hydraulic method. An ejector is placed under the gate in the sand bin, and the sand is carried in a reverse direction from the bin through the 4‑in. piping and one or more lengths of hose to the filter bed. This process has lowered the cost of re‑sanding considerably, and present indications are that it will prove entirely satisfactory in every way.
The average effective size and uniformity coefficient of the filters are shown in Table 1.
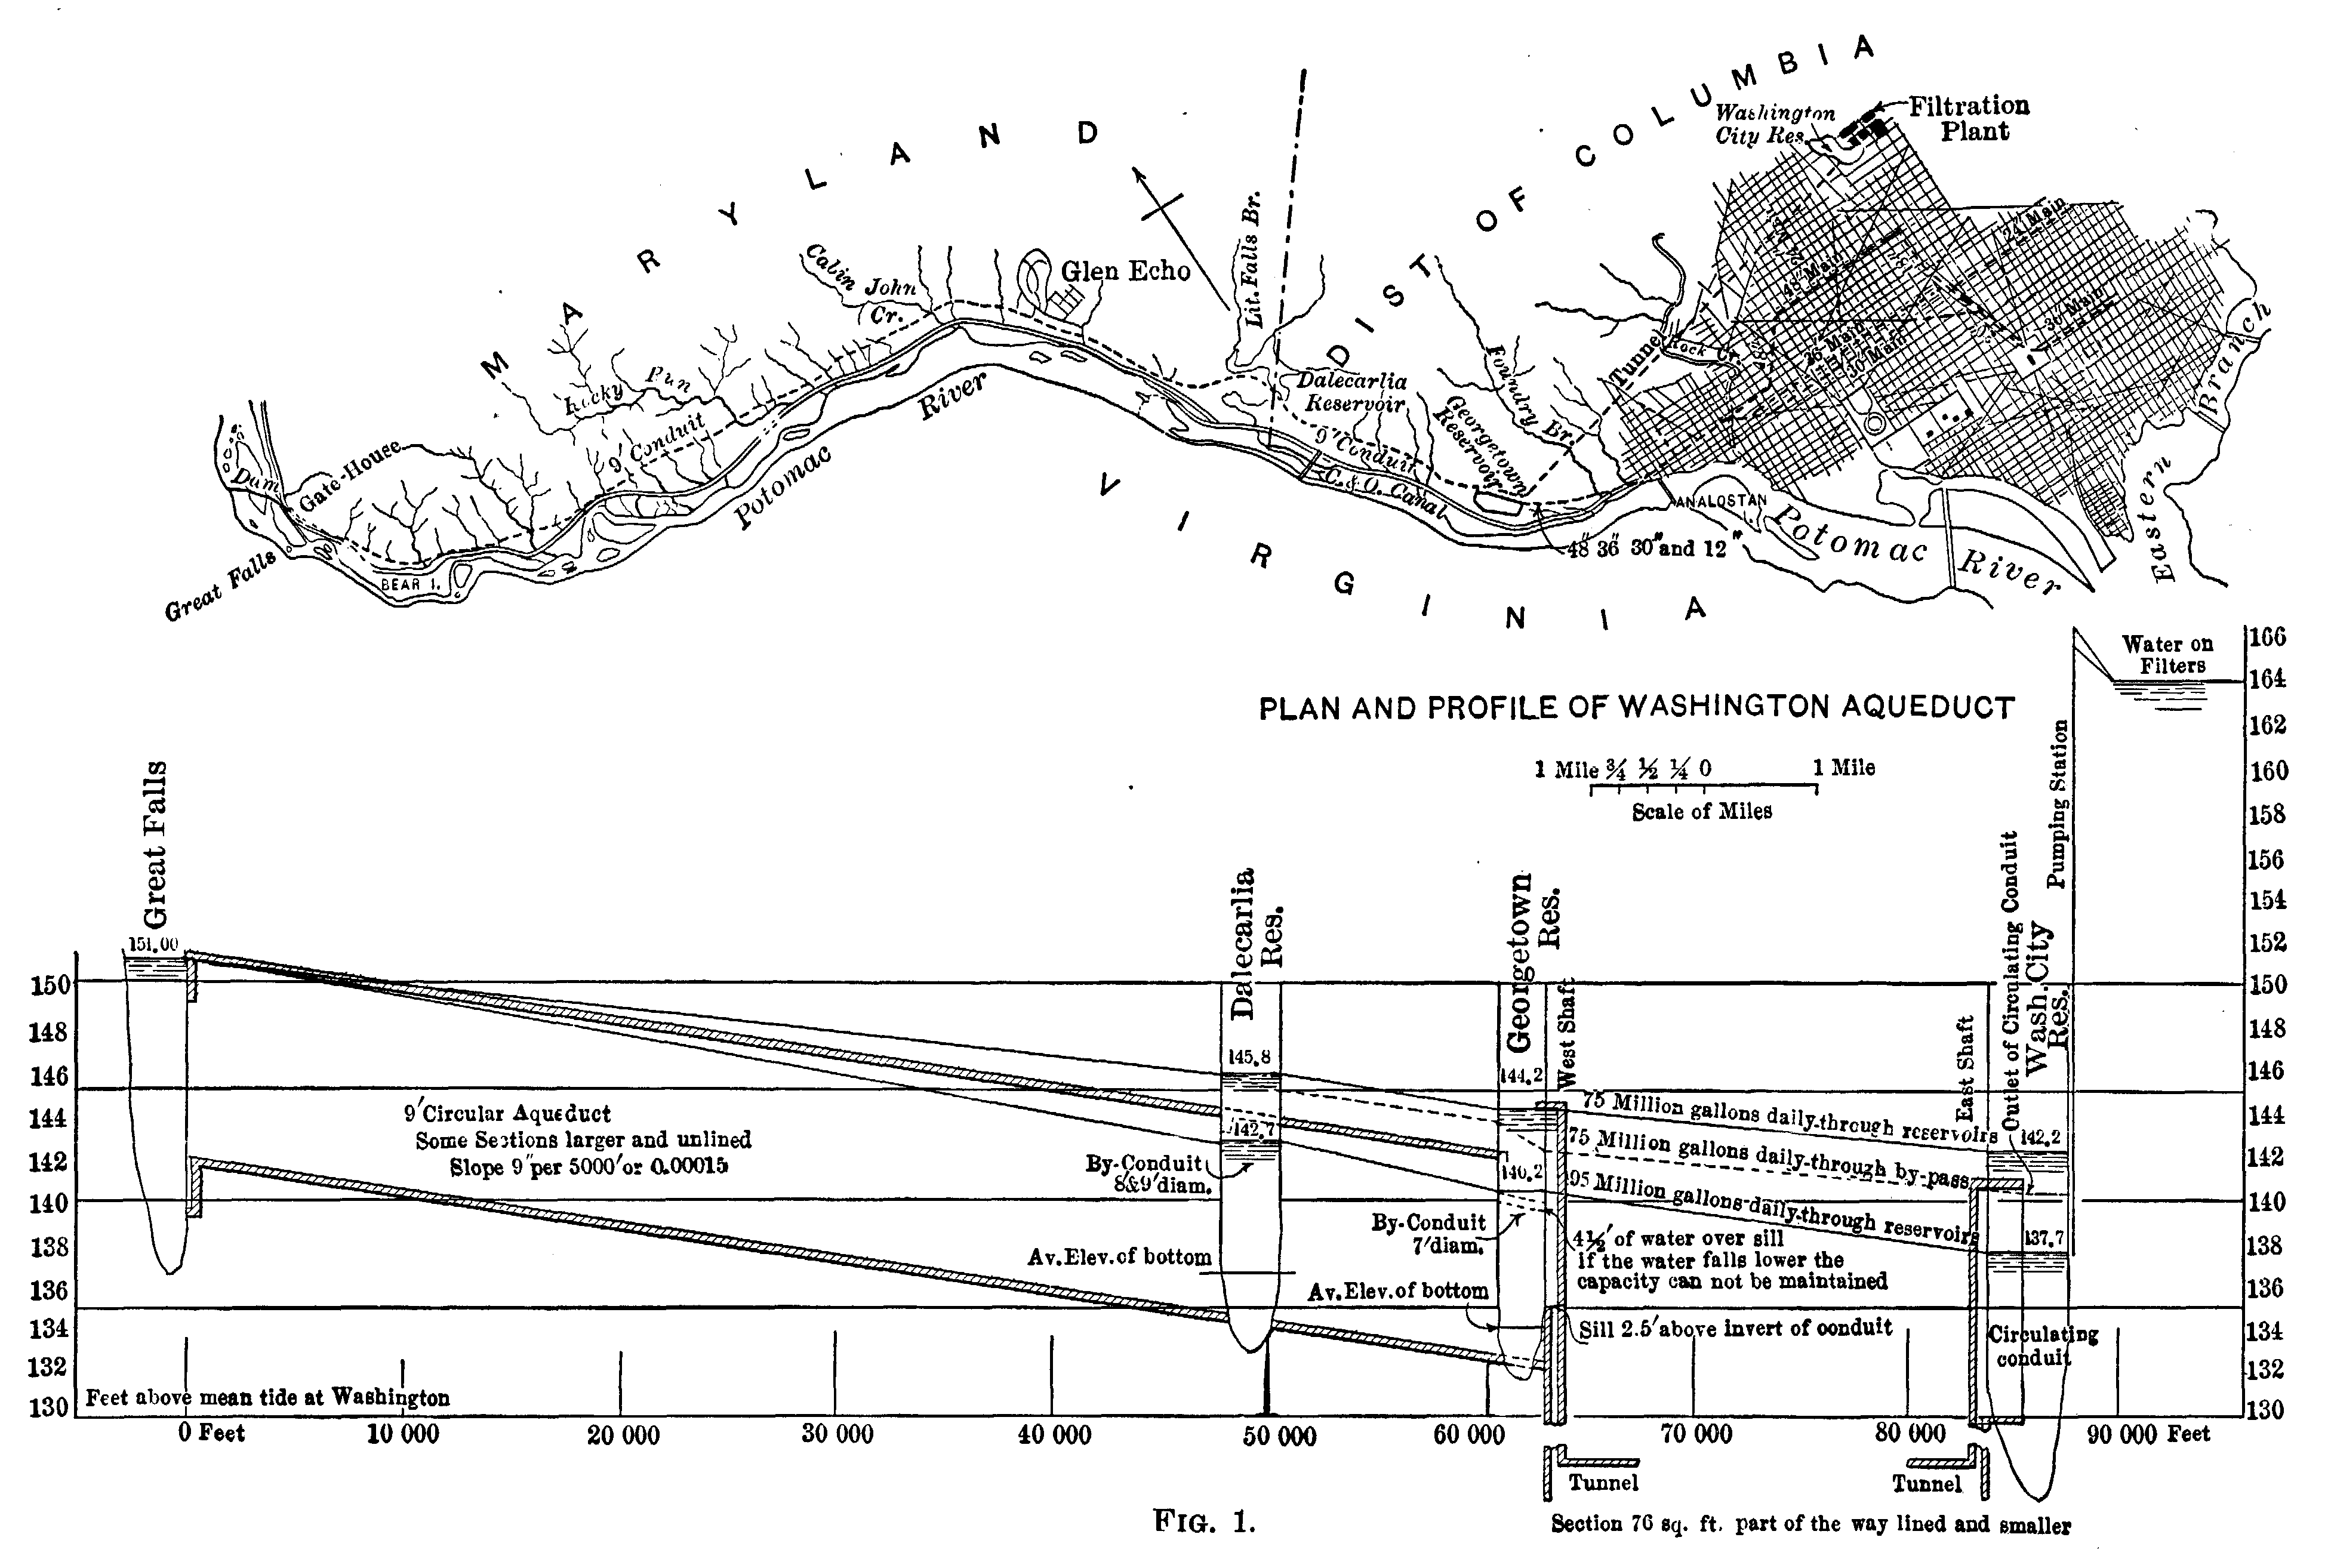
Description of Washington Aqueduct.—The water supply of Washington is taken from the Potomac River, at Great Falls, about 16 miles above the city. At that place, a dam has been built across the river, which holds the water at an elevation of 150.5 ft. above mean tide at Washington. From Great Falls the water flows by gravity for a distance of 16 miles through a 9‑ft. conduit, three reservoirs, and a tunnel. From McMillan Park Reservoir, the last of the three, the water is lifted by centrifugal pumps about 21 ft. to the filters. After passing through the filters, it flows to the filtered‑water reservoir, and later to the city mains. In its passage from Great Falls to the filters, the water flows through three settling reservoirs, which have already been referred to. These reservoirs are known as the Dalecarlia, the Georgetown, and the McMillan Park Reservoirs, and have available capacities of 141,000,000, 140,000,000, and 180,000,000 gal., respectively.
Turbidity.—The Potomac River water is rather turbid, the turbidity being caused by very fine particles of clay. The river is subject to sudden fluctuations, it being no uncommon thing to have a turbidity of 100 one day, and 1,000 the next. The high turbidity usually disappears about as rapidly as it comes, and is seldom higher than 500 for more than 5 days at a time. It is frequently the case, however, that a succession of waves of high turbidity will appear so close together that the effect of one has not disappeared before that of another is felt.
The clarification of the water supply begins at the dam at Great Falls. Here it is a clarification by exclusion, for when an excessive quantity of mud appears in the river water, the gates are closed, and the muddy water is allowed to flow over the dam and form mud‑bars in the Lower Potomac, while the city is supplied from the water stored in the three settling reservoirs. Until a comparatively recent date, the excessively muddy water was never excluded, having been taken, like other decrees of Providence, as it came.
During the summer of 1907, the practice of shutting out water with a turbidity of 500 or more was established for the warm months. This practice was discontinued during the cold months, as it was feared that a very high consumption of water might occur at the time of low water in the reservoirs, and so cause a partial famine. During the winter of 1909‑10, however, the gates were closed, as was the practice throughout the summer months.
When the reservoirs are well filled, and the consumption of water is less than 70,000,000 gal. per day, it is safe to close the gates at Great Falls for a period of about 4 days.
While a considerable reduction in turbidity is effected in each of the reservoirs, the bulk of the mud is deposited at the upper end of Dalecarlia Reservoir. This reservoir had become so completely filled, that, in 1905, it was necessary to dredge a channel through the deposit, in order to allow the water to pass it. During the summers of 1907 and 1908, a 10‑in. hydraulic dredge removed more than 100,000 cu. yd. of mud which had been deposited in this reservoir. The mud deposited in Georgetown and McMillan Park Reservoirs is so fine that the accumulation of many years is not very noticeable in its effect on the depth of water.
The particles of clay which remain in the water after its passage through the three reservoirs, are so exceedingly small that they do not settle out in any reasonable length of time. Even the filtration of the water through one or more slow sand filters occasionally fails to remove the last trace of turbidity. This is especially true in the colder months, and not a winter has passed when the water supply has not been noticeably turbid at some time.
A general idea of the quantity of mud contained in the river water, the quantity excluded by closing the gates at Great Falls, and that removed by sedimentation and filtration, may be gained from Table 2, which is, of course, only a rough approximation.
Table 2 also shows that the gates were closed 10.50% of the time, thereby excluding 40.06% of the total suspended matter which otherwise would have entered the system.
The turbidities, bacterial counts, and chemical analyses of numerous samples of water are shown in Tables 3, 4, 5, and 6. The amount of work done in the pumping station, average consumption of water, death rate from typhoid fever, and filter runs are shown in Tables 7, 8, 9, and 10.
Raking.—At the time the filters were first put in service, the sand bins had not been completed, and, consequently, the work of cleaning the filters was carried on in the old‑fashioned way of scraping by hand and wheeling out the sand in barrows. This method of cleaning was used from October, 1905, to April, 1906; then the regular sand‑handling system was commenced.
At times, during the first two summers the filters were in operation, considerable difficulty was experienced in keeping them cleaned as fast as was necessary to provide an ample supply of filtered water. For a short period in each summer it was found necessary to organize night shifts, and keep the work of cleaning in progress for from 16 to 24 hours per day.
In order to relieve the situation at such times, the expedient of raking was tried. This was first attempted with the filters filled with water; the effluent was first shut off in order to prevent a downward flow of water, and the filter was then raked or harrowed from boats. This method was not satisfactory, however, as the work was neither as uniform nor as thorough as necessary. Later, the filters were drained to the necessary depth, and the surface of the sand was thoroughly stirred with iron garden rakes. The filters were then filled with filtered water through the under‑drains and put in service.
This latter method proved so satisfactory that it has been resorted to at all times when the work was at all pressing. When the runs were of short duration, and the depth to which the mud had penetrated the filter sand was slight, a raking seemed to be nearly as effective in restoring the filter capacity as a scraping; it could be done in 8 hours by 3 laborers, and there seemed to be no ill effects from lowered efficiency.
| Month. | Great Falls. | Reservoirs: | ||||||||
|---|---|---|---|---|---|---|---|---|---|---|
| Dalecarlia Outlet. | Gerogetown Outlet. | McMillan Park Outlet. | Filtered water. | |||||||
| Max. | Ave. | Max. | Ave. | Max. | Ave. | Max. | Ave. | Max. | Ave. | |
| 1905. | ||||||||||
| October | 100 | 36 | 40 | 21 | 32 | 18 | 20 | 11 | 4 | 1 |
| November | 35 | 19 | 34 | 19 | 22 | 14 | 14 | 11 | 3 | 1 |
| December | 1,500 | 199 | 250 | 84 | 150 | 74 | 95 | 39 | 14 | 6 |
| 1906. | ||||||||||
| January | 700 | 94 | 180 | 60 | 120 | 60 | 85 | 52 | 20 | 12 |
| February | 120 | 45 | 85 | 41 | 55 | 29 | 35 | 22 | 5 | 3 |
| March | 1,750 | 272 | 350 | 181 | 120 | 56 | 90 | 46 | 8 | 6 |
| April | 1,270 | 167 | 180 | 72 | 95 | 58 | 75 | 46 | 12 | 7 |
| May | 600 | 56 | 50 | 20 | 45 | 16 | 34 | 10 | 3 | 2 |
| June | 1,700 | 303 | 500 | 125 | 450 | 94 | 180 | 41 | 13 | 2 |
| July | 1,000 | 130 | 180 | 54 | 150 | 47 | 250 | 43 | 13 | 3 |
| August | 1,530 | 375 | 250 | 112 | 95 | 66 | 65 | 45 | 5 | 2 |
| September | 120 | 33 | 180 | 34 | 95 | 28 | 75 | 25 | 7 | 2 |
| October | 1,025 | 127 | 110 | 37 | 60 | 24 | 55 | 21 | 1 | 1 |
| November | 160 | 27 | 75 | 20 | 45 | 16 | 24 | 13 | 1 | 1 |
| December | 600 | 69 | 110 | 31 | 80 | 28 | 80 | 26 | 8 | 2 |
| 1907. | ||||||||||
| January | 400 | 135 | 150 | 70 | 110 | 75 | 70 | 53 | 11 | 7 |
| February | 55 | 26 | 26 | 15 | 36 | 16 | 40 | 17 | 5 | 2 |
| March | 950 | 248 | 180 | 77 | 130 | 70 | 90 | 57 | 7 | 4 |
| April | 200 | 47 | 80 | 33 | 60 | 30 | 45 | 24 | 4 | 2 |
| May | 130 | 29 | 40 | 18 | 26 | 15 | 14 | 9 | 1 | 1 |
| June | 400 | 104 | 160 | 48 | 75 | 32 | 40 | 18 | 1 | 1 |
| July | 600 | 114 | 130 | 61 | 78 | 47 | 45 | 31 | 1 | 1 |
| August | 800 | 73 | 130 | 35 | 85 | 26 | 30 | 14 | 1 | 0 |
| September | 600 | 129 | 1 | 1 | 150 | 51 | 70 | 28 | 1 | 0 |
| October | 75 | 32 | 1 | 1 | 65 | 28 | 75 | 26 | 4 | 0 |
| November | 300 | 97 | 1 | 1 | 100 | 45 | 45 | 23 | 2 | 1 |
| December | 680 | 135 | 1 | 1 | 180 | 61 | 100 | 46 | 10 | 4 |
| 1908. | ||||||||||
| January | 2,100 | 202 | 340 | 73 | 250 | 82 | 160 | 65 | 20 | 7 |
| February | 3,000 | 302 | 300 | 52 | 150 | 52 | 75 | 32 | 7 | 4 |
| March | 300 | 91 | 150 | 78 | 100 | 68 | 65 | 42 | 5 | 4 |
| April | 75 | 23 | 65 | 41 | 37 | 27 | 26 | 20 | 3 | 2 |
| May | 2,000 | 172 | 130 | 48 | 85 | 37 | 50 | 20 | 1 | 1 |
| June | 400 | 40 | 70 | 29 | 40 | 24 | 30 | 18 | 1 | 1 |
| July | 1,500 | 149 | ... | 74 | 170 | 44 | 75 | 15 | 0 | 0 |
| August | 900 | 129 | 200 | 1 | 150 | 56 | 85 | 39 | 2 | 1 |
| September | 75 | 24 | 1 | 1 | 50 | 19 | 35 | 18 | 0 | 0 |
| October | 95 | 20 | 1 | 1 | 55 | 18 | 28 | 15 | 0 | 0 |
| November | 24 | 11 | 1 | 1 | 20 | 11 | 19 | 10 | 0 | 0 |
| December | 20 | 9 | 17 | 11 | 14 | 9 | 10 | 7 | 0 | 0 |
| 1909. | ||||||||||
| January | 400 | 72 | 95 | 32 | 60 | 23 | 25 | 16 | 4 | 1 |
| February | 650 | 194 | 120 | 64 | 90 | 51 | 55 | 35 | 4 | 3 |
| March | 250 | 51 | 1 | 1 | 90 | 44 | 60 | 37 | 8 | 4 |
| April | 750 | 98 | 1 | 1 | 130 | 42 | 76 | 31 | 2 | 1 |
| May | 480 | 57 | 1 | 1 | 30 | 19 | 30 | 12 | 2 | 1 |
| June | 650 | 141 | 1 | 1 | 120 | 51 | 80 | 30 | 1 | 0 |
| July | 400 | 48 | 1 | 1 | 215 | 46 | 120 | 35 | 2 | 1 |
| August | 180 | 23 | 1 | 1 | 50 | 17 | 18 | 9 | 0 | 0 |
| September | 26 | 16 | 24 | 14 | 1 | 1 | 25 | 6 | 0 | 0 |
| October | 14 | 10 | 15 | 10 | 11 | 9 | 8 | 4 | 0 | 0 |
| November | 11 | 9 | 11 | 8 | 10 | 8 | 6 | 4 | 0 | 0 |
| December | 600 | 63 | 110 | 31 | 80 | 28 | 50 | 15 | 3 | 0 |
| 1910. | ||||||||||
| January | 3,000 | 357 | 200 | 58 | 150 | 53 | 115 | 30 | 5 | 2 |
| February | 3,000 | 143 | 150 | 55 | 120 | 50 | 100 | 36 | 7 | 4 |
| March | 210 | 36 | 100 | 35 | 95 | 38 | 100 | 43 | 9 | 5 |
| April | 350 | 55 | 100 | 25 | 55 | 18 | 25 | 8 | 1 | 02 |
| May | 300 | 33 | 55 | 19 | 50 | 17 | 28 | 13 | 1 | 02 |
| June | 1,500 | 246 | 180 | 42 | 110 | 37 | 50 | 16 | 1 | 02 |
| Fiscal years. | ||||||||||
| 1905-062 | 1,750 | 133 | 500 | 70 | 450 | 47 | 180 | 31 | 20 | 5 |
| 1906-07 | 1,530 | 114 | 250 | 46 | 150 | 37 | 250 | 29 | 13 | 2 |
| 1907-08 | 3,000 | 117 | 340 | 53 | 250 | 45 | 160 | 31 | 20 | 2 |
| 1908-09 | 1,500 | 79 | 200 | 50 | 170 | 32 | 85 | 22 | 8 | 1 |
| 1909-10 | 2,100 | 86 | 200 | 30 | 215 | 29 | 120 | 18 | 9 | 1 |
| Month. | Reservoirs: | ||||
|---|---|---|---|---|---|
| Dalecarlia Inlet. | Dalecarlia Outlet. | Georgetown Outlet. | McMillan Park Outlet. | Filtered water. | |
| 1905. | |||||
| October | ... | ... | ... | 210 | 80 |
| November | ... | ... | ... | 150 | 27 |
| December | ... | 15,500 | ... | 3,800 | 60 |
| 1906. | |||||
| January | ... | 2,800 | ... | 1,500 | 39 |
| February | 2,900 | 4,100 | 1,800 | 550 | 16 |
| March | 1,800 | 1,100 | 900 | 650 | 19 |
| April | 3,300 | 1,700 | 700 | 400 | 22 |
| May | 425 | 210 | 95 | 65 | 17 |
| June | 7,900 | 4,600 | 325 | 220 | 17 |
| July | 13,500 | 600 | 475 | 160 | 26 |
| August | 8,700 | 1,100 | 1,200 | 190 | 14 |
| September | 425 | 250 | 140 | 135 | 14 |
| October | 2,300 | 950 | 650 | 270 | 16 |
| November | 1,800 | 1,100 | 1,200 | 220 | 12 |
| December | 6,900 | 3,800 | 3,600 | 700 | 45 |
| 1907. | |||||
| January | 4,400 | 2,400 | 2,200 | 950 | 70 |
| February | 1,000 | 950 | 1,000 | 700 | 45 |
| March | 11,500 | 8,300 | 7,200 | 3,600 | 65 |
| April | 3,700 | 2,100 | 1,400 | 475 | 21 |
| May | 750 | 350 | 325 | 130 | 26 |
| June | 2,300 | 1,000 | 600 | 100 | 18 |
| July | 2,700 | 575 | 350 | 160 | 17 |
| August | 3,000 | 275 | 425 | 80 | 17 |
| September | 6,200 | 1 | 1,900 | 230 | 32 |
| October | 1,400 | 1 | 950 | 275 | 27 |
| November | 8,900 | 1 | 6,600 | 1,500 | 27 |
| December | 16,000 | 1 | 9,600 | 4,300 | 190 |
| 1908. | |||||
| January | 11,000 | 8,700 | 9,400 | 3,700 | 190 |
| February | 11,500 | 6,000 | 5,000 | 2,800 | 75 |
| March | 4,600 | 4,000 | 2,900 | 1,300 | 30 |
| April | 700 | 450 | 250 | 120 | 13 |
| May | 9,500 | 1,100 | 650 | 325 | 17 |
| June | 750 | 120 | 110 | 95 | 12 |
| July | 4,900 | ... | 400 | 150 | 8 |
| August | 1,600 | 325 | 300 | 100 | 12 |
| September | 325 | 1 | 200 | 80 | 11 |
| October | 375 | 1 | 325 | 140 | 8 |
| November | 550 | 1 | 300 | 200 | 12 |
| December | 800 | 750 | 375 | 170 | 23 |
| 1909. | |||||
| January | 11,000 | 2,700 | 1,600 | 700 | 31 |
| February | 8,000 | 3,500 | 2,400 | 1,300 | 60 |
| March | 3,800 | 1 | 2,600 | 1,000 | 39 |
| April | 2,200 | 1 | 1,400 | 550 | 12 |
| May | 900 | 1 | 350 | 140 | 16 |
| June | 3,400 | 1 | 1,200 | 170 | 21 |
| July | 550 | 1 | 500 | 250 | 33 |
| August | 400 | 1 | 325 | 55 | 18 |
| September | 325 | 240 | 1 | 70 | 18 |
| October | 350 | 275 | 250 | 130 | 20 |
| November | 600 | 500 | 500 | 180 | 13 |
| December | 21,000 | 9,100 | 5,900 | 4,500 | 250 |
| 1910. | |||||
| January | 76,000 | 78,000 | 88,000 | 52,000 | 800 |
| February | 45,000 | 35,500 | 31,000 | 17,500 | 350 |
| March | 9,900 | 7,600 | 7,400 | 4,800 | 80 |
| April | 7,900 | 4,100 | 3,500 | 650 | 29 |
| May | 1,230 | 810 | 830 | 448 | 28 |
| June | 3,660 | 930 | 800 | 324 | 27 |
| Fiscal years: | |||||
| 1905-06 | 3,3002 | 4,3003 | 7504 | 8502 | 332 |
| 1906-07 | 4,900 | 1,900 | 1,700 | 650 | 31 |
| 1907-08 | 6,360 | 2,700 | 2,900 | 1,300 | 55 |
| 1908-09 | 3,400 | 2,000 | 950 | 400 | 21 |
| 1909-10 | 14,300 | 13,900 | 10,900 | 6,890 | 143 |
| Month. | Great Falls, or Dalecarlia Reservoir Inlet. | Dalecarlia Reservoir Outlet. | Georgetown Reservoir. | McMillan Park Reservoir (applied water). | Filtered water reservoir. | Tap water from various parts of city. | ||||||||||
|---|---|---|---|---|---|---|---|---|---|---|---|---|---|---|---|---|
| 10 c.c. | 1 c.c. | 0.1 c.c. | 10 c.c. | 1 c.c. | 0.1 c.c. | 10 c.c. | 1 c.c. | 0.1 c.c. | 10 c.c. | 1 c.c. | 0.1 c.c. | 10 c.c. | 1 c.c. | 10 c.c. | 1 c.c. | |
| 1906. | ||||||||||||||||
| January1 | 55.6 | 38.9 | 22.2 | 69.2 | 23.1 | 7.7 | 56.0 | 40.0 | 8.0 | 55.6 | 22.2 | 0 | 7.2 | 0 | ... | ... |
| February | 33.3 | 26.7 | 6.7 | 26.1 | 17.4 | 8.7 | 30.4 | 13.0 | 4.4 | 8.3 | 4.2 | 0 | 0 | 0 | ... | ... |
| March | 50.0 | 12.5 | 0 | 45.5 | 18.2 | 0 | 20.8 | 8.3 | 0 | 18.5 | 7.4 | 3.7 | 0 | 0 | 0 | 0 |
| April | 72.2 | 33.3 | 16.7 | 95.5 | 50.0 | 4.6 | 59.1 | 22.7 | 4.6 | 32.0 | 8.0 | 0 | 4.0 | 0 | 0 | 0 |
| May | 20.0 | 8.0 | 4.0 | 20.0 | 12.0 | 0 | 7.8 | 0 | 0 | 0 | 0 | 0 | 0 | 0 | 0 | 0 |
| June | 57.7 | 38.5 | 19.2 | 40.0 | 32.0 | 8.0 | 50.0 | 34.6 | 0 | 23.1 | 7.7 | 3.8 | 0 | 0 | 3.1 | 0 |
| July | 65.0 | 50.0 | 5.0 | 60.0 | 25.0 | 10.0 | 15.0 | 5.0 | 5.0 | 9.5 | 0 | 0 | 4.8 | 0 | ... | ... |
| August | 84.6 | 69.2 | 61.5 | 88.5 | 65.4 | 34.6 | 80.0 | 57.7 | 23.1 | 63.0 | 33.3 | 0 | 7.4 | 3.7 | 11.9 | 5.1 |
| September | 50.0 | 10.0 | 0 | 30.0 | 10.0 | 10.0 | 40.0 | 10.0 | 0 | 32.0 | 12.0 | 0 | 8.0 | 0 | 3.1 | 0 |
| October | 60.0 | 30.0 | 10.0 | 55.5 | 33.3 | 0 | 80.0 | 60.0 | 20.0 | 48.1 | 22.2 | 3.7 | 3.7 | 0 | 13.0 | 3.7 |
| November | 37.5 | 0 | 0 | 25.0 | 12.5 | 12.5 | 37.5 | 25.0 | 0 | 20.0 | 12.0 | 0 | 8.0 | 0 | 0 | 0 |
| December | 55.5 | 44.5 | 0 | 66.7 | 44.5 | 22.2 | 66.7 | 22.2 | 0 | 20.8 | 8.3 | 4.2 | 16.7 | 8.3 | 7.5 | 0 |
| 1907. | ||||||||||||||||
| January | 77.8 | 33.3 | 22.2 | 66.7 | 33.3 | 0 | 55.5 | 55.5 | 22.2 | 69.3 | 34.6 | 3.8 | 19.2 | 11.5 | 14.0 | 0 |
| February | 37.5 | 25.0 | 0 | 12.5 | 0 | 0 | 37.5 | 12.5 | 0 | 17.4 | 4.4 | 0 | 0 | 0 | 2.9 | 0 |
| March | 87.5 | 50.0 | 0 | 75.0 | 37.5 | 0 | 50.0 | 25.0 | 0 | 30.8 | 7.7 | 0 | 0 | 0 | 2.1 | 0 |
| April | 44.5 | 11.1 | 11.1 | 66.7 | 22.2 | 11.1 | 77.8 | 11.1 | 11.1 | 46.1 | 19.2 | 3.8 | 3.8 | 0 | 3.2 | 0 |
| May | 91.3 | 65.2 | 17.4 | 88.9 | 33.3 | 0 | 87.5 | 50.0 | 12.5 | 23.1 | 0 | 0 | 0 | 0 | 1.4 | 0 |
| June | 80.0 | 68.0 | 24.0 | 87.5 | 62.5 | 0 | 66.7 | 44.5 | 11.1 | 40.0 | 8.0 | 0 | 0 | 0 | 0 | 0 |
| July | 42.3 | 30.8 | 19.2 | 25.0 | 12.5 | 0 | 22.2 | 22.2 | 0 | 3.8 | 0 | 0 | 0 | 0 | 1.4 | 1.4 |
| August | 48.1 | 29.6 | 3.7 | 33.3 | 16.7 | 16.7 | 36.4 | 18.2 | 0 | 14.8 | 3.7 | 0 | 0 | 0 | 0 | 0 |
| September | 62.5 | 54.1 | 25.0 | ... | ... | ... | 41.7 | 33.3 | 16.7 | 16.0 | 4.0 | 0 | 4.0 | 0 | 1.7 | 0 |
| October | 51.9 | 40.8 | 7.4 | ... | ... | ... | 53.3 | 40.0 | 6.7 | 38.7 | 25.8 | 9.7 | 6.5 | 0 | 12.5 | 2.8 |
| November | 80.0 | 64.0 | 24.0 | ... | ... | ... | 72.7 | 54.5 | 0 | 58.6 | 17.3 | 3.5 | 0 | 0 | 4.9 | 0 |
| December | 56.0 | 48.0 | 16.0 | ... | ... | ... | 46.2 | 38.5 | 7.7 | 45.2 | 29.0 | 0 | 19.3 | 3.2 | 12.9 | 4.3 |
| 1908. | ||||||||||||||||
| January | 46.2 | 30.8 | 15.4 | 50.0 | 12.5 | 0 | 33.3 | 0 | 0 | 22.6 | 9.7 | 3.2 | 3.2 | 0 | 1.9 | 1.9 |
| February | 12.5 | 0 | 0 | 25.0 | 0 | 0 | 12.5 | 0 | 0 | 0 | 0 | 0 | 0 | 0 | 0 | 0 |
| March | 38.5 | 19.2 | 7.7 | 44.4 | 11.1 | 0 | 11.1 | 0 | 0 | 9.7 | 0 | 0 | 0 | 0 | 0 | 0 |
| April | 15.4 | 7.7 | 0 | 0 | 0 | 0 | 0 | 0 | 0 | 6.7 | 3.3 | 0 | 0 | 0 | 0 | 0 |
| May | 76.0 | 52.0 | 40.0 | 87.5 | 50.0 | 12.5 | 33.3 | 22.2 | 0 | 45.1 | 16.2 | 0 | 0 | 0 | 0 | 0 |
| June | 7.7 | 0 | 0 | 0 | 0 | 0 | 11.1 | 0 | 0 | 0 | 0 | 0 | 0 | 0 | 0 | 0 |
| July | 26.9 | 15.4 | 11.5 | 22.2 | 22.2 | 0 | 11.1 | 0 | 0 | 6.4 | 6.4 | 0 | 0 | 0 | 0 | 0 |
| August | 46.2 | 26.9 | 3.9 | 44.4 | 33.3 | 0 | 62.5 | 25.0 | 12.5 | 12.9 | 3.2 | 0 | 0 | 0 | 1.6 | 0 |
| September | 20.0 | 8.0 | 4.0 | 42.9 | 28.6 | 1.4 | 22.2 | 11.1 | 0 | 16.7 | 10.0 | 0 | 0 | 0 | 4.3 | 0 |
| October | 18.4 | 3.7 | 0 | 0 | 0 | 0 | 9.1 | 0 | 0 | 9.7 | 6.4 | 3.2 | 0 | 0 | 0 | 0 |
| November | 13.0 | 0 | 0 | 28.6 | 0 | 0 | 11.1 | 0 | 0 | 6.6 | 0 | 0 | 0 | 0 | 0 | 0 |
| December | 11.5 | 7.7 | 3.8 | 0 | 0 | 0 | 12.5 | 0 | 0 | 3.2 | 0 | 0 | 0 | 0 | 0 | 0 |
| 1909. | ||||||||||||||||
| January | 12.0 | 8.0 | 0 | 30.0 | 10.0 | 0 | 0 | 0 | 0 | 3.2 | 3.2 | 0 | 3.2 | 0 | 0 | 0 |
| February | 52.1 | 47.8 | 47.8 | 28.6 | 14.3 | 0 | 37.5 | 0 | 0 | 7.1 | 3.6 | 3.6 | 0 | 0 | 3.4 | 3.4 |
| March | 69.4 | 34.6 | 3.8 | 50.0 | 25.0 | 0 | 44.5 | 11.1 | 0 | 32.3 | 19.4 | 3.2 | 6.5 | 0 | 2.8 | 1.4 |
| April | 42.3 | 15.4 | 3.9 | 33.3 | 22.2 | 11.1 | 44.4 | 22.2 | 11.1 | 36.6 | 10.0 | 0 | 0 | 0 | 0 | 0 |
| May | 88.4 | 26.1 | 4.3 | 50.0 | 12.5 | 0 | 33.3 | 0 | 0 | 12.9 | 3.2 | 0 | 0 | 0 | 0 | 0 |
| June | 85.0 | 60.0 | 25.0 | 60.0 | 40.0 | 10.0 | 44.4 | 33.3 | 11.1 | 53.3 | 20.0 | 0 | 0 | 0 | 1.4 | 0 |
| July | 34.8 | 8.7 | 4.4 | ... | ... | ... | 33.3 | 11.1 | 0 | 25.8 | 12.9 | 0 | 0 | 0 | 0 | 0 |
| August | 50.0 | 15.4 | 7.7 | ... | ... | ... | 40.0 | 10.0 | 0 | 22.6 | 6.5 | 3.2 | 0 | 0 | 0 | 0 |
| September | 43.5 | 21.8 | 8.7 | 25.0 | 25.0 | 12.5 | 0 | 0 | 0 | 13.3 | 3.3 | 0 | 0 | 0 | 0 | 0 |
| October | 36.4 | 13.6 | 0 | 18.2 | 0 | 0 | 0 | 0 | 0 | 3.2 | 0 | 0 | 0 | 0 | 0 | 0 |
| November | 4.5 | 0 | 0 | 10.0 | 0 | 0 | 0 | 0 | 0 | 0 | 0 | 0 | 0 | 0 | 0 | 0 |
| December | 38.5 | 23.1 | 7.7 | 36.4 | 36.4 | 18.2 | 33.3 | 22.2 | 11.1 | 29.0 | 22.6 | 0 | 9.7 | 6.5 | 7.3 | 1.5 |
| 1910. | ||||||||||||||||
| January | 72.0 | 48.0 | 24.0 | 44.5 | 33.3 | 11.1 | 75.0 | 25.0 | 0 | 61.3 | 35.5 | 9.7 | 5.8 | 3.2 | 15.9 | 3.2 |
| February | 47.8 | 43.5 | 17.4 | 63.2 | 21.1 | 5.3 | 40.0 | 30.0 | 5.0 | 32.2 | 7.1 | 0 | 3.6 | 0 | 0 | 0 |
| March | 33.3 | 14.8 | 0 | 30.8 | 11.1 | 3.7 | 29.6 | 22.2 | 7.4 | 12.9 | 3.2 | 0 | 0 | 0 | 0 | 0 |
| April | 41.7 | 33.3 | 20.8 | 40.0 | 32.0 | 16.0 | 38.5 | 23.1 | 15.4 | 23.3 | 13.3 | 0 | 0 | 0 | 0 | 0 |
| May | 47.8 | 17.4 | 0 | 52.0 | 20.0 | 0 | 36.0 | 16.0 | 4.0 | 16.1 | 12.9 | 0 | 0 | 0 | 0 | 0 |
| June | 95.5 | 86.4 | 31.8 | 80.8 | 46.2 | 19.2 | 64.0 | 28.0 | 8.0 | 43.3 | 6.7 | 0 | 0 | 0 | 1.4 | 0 |
| Fiscal years: | ||||||||||||||||
| 1905-06 | 35.2 | 19.4 | 9.3 | 0.0 | 3.2 | 5.2 | 6.4 | 4.9 | 1.7 | 4.3 | 8.3 | .8 | .3 | 1.8 | 1.3 | 0 |
| 1906-07 | 61.5 | 43.6 | 9.2 | 7.7 | 9.2 | 2.3 | 1.1 | 9.8 | 0.7 | 2.5 | 3.0 | .4 | .5 | 2.1 | 5.4 | 1.0 |
| 1907-08 | 44.6 | 31.3 | 3.0 | 2.3 | 2.3 | 3.1 | 4.4 | 2.1 | 4.1 | 2.2 | 9.4 | .4 | .8 | 0.3 | 3.1 | 0.9 |
| 1908-09 | 38.9 | 20.3 | 8.4 | 0.0 | 5.0 | 0 | 7.4 | 8.5 | 2.8 | 6.7 | 7.1 | .8 | .8 | 0 | 1.2 | 0.4 |
| 1909-10 | 45.5 | 26.9 | 0.1 | 5.3 | 4.0 | 8.8 | 7.9 | 9.8 | 6.2 | 3.6 | 0.4 | .1 | .3 | 0.8 | 2.2 | 0.4 |
| Reservoirs. | Turbidity1 | Ammonia. | Nitrogen as: | Hardness | Alkalinity | Chlorine | |||
|---|---|---|---|---|---|---|---|---|---|
| Free | Albuminoid | Total | Nitrites | Nitrates | |||||
| Dalecarlia inlet | 2,100 | 0.034 | 0.264 | 0.280 | 0.0070 | 0.45 | 120.0 | 106.0 | 5.4 |
| Dalecarlia outlet2 | 200 | 0.034 | 0.180 | 0.206 | 0.0050 | 0.70 | 115.0 | 105.8 | 5.7 |
| Georgetown outlet3 | 215 | 0.030 | 0.182 | 0.182 | 0.0060 | 0.60 | 115.0 | 105.0 | 4.9 |
| McMillan Park outlet | 120 | 0.028 | 0.126 | 0.154 | 0.0060 | 0.65 | 118.0 | 104.4 | 4.2 |
| Filtered water | 9 | 0.016 | 0.078 | 0.086 | 0.0010 | 0.70 | 119.5 | 106.3 | 4.5 |
| Reservoirs. | Turbidity1 | Ammonia. | Nitrogen as: | Hardness | Alkalinity | Chlorine | |||
|---|---|---|---|---|---|---|---|---|---|
| Free | Albuminoid | Total | Nitrites | Nitrates | |||||
| Dalecarlia inlet | 7 | 0.000 | 0.016 | 0.016 | 0.0000 | 0.00 | 52.9 | 39.5 | 1.0 |
| Dalecarlia outlet2 | 7 | 0.000 | 0.040 | 0.040 | 0.0000 | 0.00 | 54.3 | 38.2 | 0.9 |
| Georgetown outlet3 | 7 | 0.000 | 0.044 | 0.044 | 0.0000 | 0.00 | 51.4 | 40.6 | 0.7 |
| McMillan Park outlet | 2 | 0.000 | 0.010 | 0.010 | 0.0010 | 0.00 | 51.4 | 38.5 | 0.2 |
| Filtered water | 0 | 0.000 | 0.000 | 0.000 | 0.0000 | 0.00 | 52.9 | 40.3 | 0.4 |
| Reservoirs. | Turbidity1 | Ammonia. | Nitrogen as: | Hardness | Alkalinity | Chlorine | |||
|---|---|---|---|---|---|---|---|---|---|
| Free | Albuminoid | Total | Nitrites | Nitrates | |||||
| Dalecarlia inlet | 86 | 0.006 | 0.167 | 0.113 | 0.0027 | 0.19 | 93.2 | 81.4 | 2.9 |
| Dalecarlia outlet2 | 30 | 0.008 | 0.106 | 0.114 | 0.0023 | 0.18 | 95.5 | 79.5 | 3.4 |
| Georgetown outlet3 | 29 | 0.005 | 0.101 | 0.106 | 0.0027 | 0.18 | 93.4 | 80.9 | 2.9 |
| McMillan Park outlet | 18 | 0.004 | 0.077 | 0.081 | 0.0027 | 0.17 | 94.0 | 83.0 | 2.7 |
| Filtered water | 1 | 0.002 | 0.027 | 0.029 | 0.0000 | 0.19 | 94.9 | 84.0 | 2.8 |
| Month. | Million gallons pumped: | Lift to filters. | Pressure at sandwasher pumps, per square inche. | Coal consumed per day in tons. | Station duty, per 100 lb. of coal consumed. | |||||||||
|---|---|---|---|---|---|---|---|---|---|---|---|---|---|---|
| To filters. | To sand washers. | |||||||||||||
| Max. | Min. | Ave. | Max. | Min. | Ave. | Max. | Min. | Ave. | Max. | Min. | Ave. | |||
| 1909. | ||||||||||||||
| July | 76.16 | 57.65 | 64.05 | 1.140 | 0.298 | 0.730 | 24.18 | 110.0 | 13.4 | 8.4 | 10.8 | 67.8 | 52.3 | 61.4 |
| August | 69.31 | 54.44 | 61.42 | 0.629 | 0.157 | 0.441 | 22.18 | 110.0 | 12.4 | 8.0 | 10.1 | 64.2 | 49.5 | 56.6 |
| September | 66.02 | 52.82 | 69.32 | 0.831 | 0.207 | 0.572 | 22.26 | 110.0 | 12.7 | 8.7 | 10.5 | 61.0 | 48.9 | 55.1 |
| October | 78.50 | 48.12 | 59.18 | 0.761 | 0.060 | 0.467 | 21.84 | 110.0 | 13.4 | 8.0 | 10.3 | 59.6 | 49.1 | 53.6 |
| November | 64.92 | 49.83 | 55.25 | 0.468 | 0.141 | 0.272 | 20.49 | 110.0 | 11.3 | 7.9 | 9.2 | 55.6 | 45.7 | 51.1 |
| December | 67.83 | 48.32 | 56.77 | 0.307 | 0.039 | 0.174 | 20.54 | 110.0 | 10.3 | 8.5 | 9.5 | 61.0 | 45.4 | 50.4 |
| 1910. | ||||||||||||||
| January | 70.04 | 51.02 | 62.49 | 0.499 | 0.008 | 0.156 | 22.43 | 110.0 | 12.7 | 9.1 | 10.4 | 59.6 | 49.8 | 54.9 |
| February | 70.79 | 55.19 | 60.28 | 0.284 | 0.041 | 0.173 | 21.44 | 112.3 | 12.3 | 8.7 | 10.2 | 57.4 | 44.8 | 51.5 |
| March | 59.11 | 51.64 | 56.04 | 0.409 | 0.063 | 0.171 | 19.76 | 120.0 | 10.5 | 7.8 | 9.2 | 53.2 | 45.2 | 49.8 |
| April | 66.53 | 53.79 | 58.32 | 0.715 | 0.167 | 0.474 | 20.78 | 120.0 | 11.1 | 8.1 | 9.7 | 58.7 | 47.2 | 53.7 |
| May | 61.93 | 54.55 | 57.76 | 0.525 | 0.059 | 0.251 | 20.30 | 120.0 | 10.1 | 7.4 | 8.8 | 60.7 | 48.1 | 54.9 |
| June | 70.49 | 50.42 | 58.37 | 0.281 | 0.124 | 0.207 | 21.19 | 117.3 | 12.3 | 7.4 | 9.1 | 60.1 | 49.9 | 54.4 |
| Fiscal years: | ||||||||||||||
| 1909-10 | 78.50 | 48.12 | 59.19 | 1.140 | 0.008 | 0.373 | 21.45 | 113.3 | 13.4 | 7.4 | 9.8 | 67.8 | 44.8 | 54.0 |
| 1905-061 | 80.59 | 57.18 | 66.07 | 2.062 | 0.089 | 0.747 | 21.71 | 107.4 | 14.8 | 6.4 | 8.9 | 79.6 | 48.2 | 62.8 |
| 1906-07 | 80.29 | 57.44 | 66.89 | 2.120 | 0.023 | 0.580 | 21.60 | 120.8 | 15.0 | 7.0 | 10.0 | 71.6 | 46.5 | 58.6 |
| 1907-08 | 80.38 | 54.35 | 64.91 | 0.735 | 0.017 | 0.347 | 22.20 | 125.0 | 12.0 | 7.2 | 9.6 | 70.7 | 51.3 | 60.3 |
| 1908-09 | 78.93 | 47.83 | 61.47 | 0.875 | 0.060 | 0.453 | 22.52 | 122.3 | 13.2 | 7.0 | 10.0 | 74.0 | 45.7 | 57.7 |
| Fiscal Year. | Name of coal used. | Cost per ton. | Duty per 100 lb. of coal consumed. | Cost of coal per 1,000,000 ft-lb. of work performed. |
|---|---|---|---|---|
| 1905‑06 | George's Creek Big Vein | $3.34 | 62.8 | $0.00238 |
| 1906‑07 | George's Creek Big Vein | 3.43 | 58.6 | 0.00261 |
| 1907‑08 | George's Creek Big Vein | 3.75 | 60.3 | 0.00278 |
| 1908‑09 | Orenda | 3.47 | 57.7 | 0.00268 |
| 1909‑10 | Orenda | 3.152 | 54.0 | 0.00255 |
The length of runs, depth of scraping, etc., after the scraping or raking, are shown in Tables 10 and 11.
Sand Handling.—For the first three years of operation, the sand was carried from the sand bins in carts and dumped through the numerous manholes of the filters on chutes which could be revolved in various directions, in order to facilitate the spreading of the sand evenly over the surface of the filter.
About a year ago, however, this method was changed, by substituting sand ejectors for the carts. By this method, an ejector is either attached to, or placed directly under, the outlet gate of the sand bin, the gate is opened, and the ejector is started. From this ejector, the sand is carried back through the line of 4‑in. fixed pipe, and one or more lengths of 3‑in. hose, to the point of discharge in the filter bed which is being re‑sanded.
| Fiscal year. | July. | August. | September. | October. | November. | December. | January. | February. | March. | April. | May. | June. | Total. |
|---|---|---|---|---|---|---|---|---|---|---|---|---|---|
| 1896‑97 | 8 | 15 | 25 | 25 | 18 | 16 | 13 | 4 | 4 | 4 | 6 | 9 | 147 |
| 1897‑98 | 10 | 16 | 18 | 10 | 9 | 18 | 8 | 4 | 2 | 9 | 6 | 20 | 130 |
| 1898‑99 | 24 | 22 | 22 | 28 | 21 | 16 | 10 | 4 | 7 | 6 | 3 | 6 | 169 |
| 1899‑1900 | 9 | 38 | 30 | 28 | 27 | 26 | 17 | 6 | 8 | 10 | 5 | 12 | 193 |
| 1901‑02 | 16 | 33 | 28 | 21 | 22 | 16 | 19 | 8 | 12 | 9 | 13 | 9 | 206 |
| 1902‑03 | 21 | 39 | 25 | 32 | 19 | 20 | 9 | 5 | 9 | 6 | 6 | 3 | 194 |
| 1903‑04 | 17 | 26 | 18 | 19 | 8 | 14 | 5 | 5 | 6 | 10 | 8 | 8 | 144 |
| 1904‑05 | 16 | 22 | 25 | 14 | 11 | 9 | 11 | 1 | 5 | 7 | 1 | 3 | 125 |
| 1905‑061 | 15 | 30 | 23 | 26 | 14 | 6 | 6 | 4 | 5 | 4 | 10 | 9 | 152 |
| 1906‑07 | 21 | 32 | 21 | 25 | 17 | 4 | 7 | 6 | 4 | 6 | 7 | 2 | 152 |
| 1907‑08 | 10 | 18 | 17 | 19 | 11 | 7 | 4 | 1 | 1 | 8 | 8 | 3 | 107 |
| 1908‑09 | 15 | 13 | 23 | 17 | 16 | 13 | 16 | 8 | 3 | 8 | 7 | 7 | 146 |
| 1909‑10 | 12 | 12 | 17 | 12 | 12 | 2 | 3 | 4 | 7 | 5 | 5 | 4 | 95 |
| Average | 15.3 | 25.5 | 22.9 | 21.5 | 16.6 | 13.1 | 9.6 | 4.4 | 5.8 | 6.7 | 6.4 | 7.5 | 155.4 |
| Fiscal year. | July. | August. | September. | October. | November. | December. | January. | February. | March. | April. | May. | June. | Annual death rate. |
|---|---|---|---|---|---|---|---|---|---|---|---|---|---|
| 1896‑97 | 35 | 65 | 109 | 109 | 78 | 70 | 56 | 17 | 17 | 17 | 26 | 39 | 53 |
| 1897-98 | 43 | 69 | 78 | 43 | 39 | 78 | 31 | 17 | 8 | 38 | 25 | 85 | 46 |
| 1898-99 | 102 | 93 | 93 | 119 | 89 | 68 | 42 | 17 | 29 | 25 | 12 | 26 | 59 |
| 1899‑1900 | 37 | 158 | 125 | 116 | 112 | 108 | 69 | 24 | 33 | 41 | 20 | 49 | 74 |
| 1900-01 | 82 | 167 | 118 | 102 | 114 | 69 | 28 | 8 | 32 | 8 | 16 | 40 | 65 |
| 1901-02 | 64 | 132 | 112 | 84 | 88 | 64 | 75 | 31 | 47 | 35 | 51 | 35 | 68 |
| 1902-03 | 83 | 153 | 98 | 126 | 75 | 79 | 35 | 19 | 35 | 23 | 23 | 12 | 63 |
| 1903-04 | 66 | 100 | 69 | 73 | 31 | 54 | 19 | 19 | 23 | 38 | 30 | 30 | 46 |
| 1904-05 | 61 | 83 | 95 | 53 | 42 | 34 | 41 | 4 | 19 | 26 | 4 | 11 | 39 |
| 1905-06 | 56 | 111 | 85 | 97 | 52 | 22 | 22 | 15 | 18 | 15 | 36 | 33 | 47 |
| 1906-07 | 69 | 105 | 69 | 82 | 56 | 13 | 24 | 20 | 13 | 20 | 24 | 7 | 42 |
| 1907-08 | 35 | 64 | 60 | 67 | 39 | 25 | 14 | 4 | 4 | 28 | 28 | 11 | 32 |
| 1908-09 | 53 | 45 | 80 | 60 | 56 | 45 | 56 | 28 | 10 | 28 | 24 | 24 | 43 |
| 1909-10 | 42 | 42 | 60 | 42 | 42 | 7 | 11 | 14 | 24 | 17 | 17 | 14 | 28 |
| Average monthly death rate. | 59 | 99 | 89 | 84 | 65 | 53 | 38 | 24 | 22 | 26 | 24 | 30 | ... |
In re‑sanding a filter, it is first filled with water to the proposed depth of the sand layer. The outlet end of the hose is connected to a 3‑in. pipe which is supported on a boat, and the sand is discharged through this pipe at the point required. Work is first begun at the far end of the filter, and it is gradually filled by swinging the boat from side to side and backing it by degrees to the front end.
At first it was feared that a small quantity of mud would be deposited on the surface of the old sand, and that this mud would ultimately cause subsurface clogging. For this reason, when this method was first adopted, a man was required to rake the sand very thoroughly in front of the discharge. Later, it was found that by giving the end of the discharge pipe a slope of about 45° downward from the horizontal, the force of the current of sand and water could be depended on to cut the old surface of sand to any required depth, and move it ahead together with the new sand, thus completely breaking up the possible mud layer between the old and new sand layers. After having used this method almost exclusively for 15 months, in which time eleven filters have been re‑sanded, and 24,531 cu. yd. of sand have been replaced, there seems to be no indication of an increased initial loss of head. The sand is very compact, and has no apparent tendency to separate into different sizes. The general appearance is similar to that of very fine sand on the seashore. The filters re‑sanded in this way have been considerably more efficient than those in which the sand was replaced with carts, and as yet, no harmful results have been noted. The rate at which the sand is replaced is shown in Table 12, and the cost of labor for sand handling is given in detail in Table 14, which shows that quite a perceptible saving has been effected by the hydraulic method.
The figures showing the cost for sand handling do not include any charge for the quantity of water used, that item having been carried on the pumping‑station account.
The cost for pumping water for sand handling, including all labor, materials, and repairs, amounts to $0.06 per cu. yd. of sand ejected and washed, and $0.03 per cu. yd. for replacing.
In addition to the water used for carrying the sand which is being replaced, it is customary to keep a slight upward flow in the filter, thus using about 500,000 gal. of filtered water per day for this purpose. Assuming the value of this water to be the total cost for pumping, filtering, etc., or $3.80 per 1,000,000 gal., the cost per cubic yard of sand replaced would be about $0.02 when one ejector is used, and $0.01 when two are in operation.
It is not considered absolutely necessary to have an upward flow of water in the filter which is being re‑sanded, and it is not always done. It was used, however, as an additional safeguard against the formation of a stratum of mud between the old and new layers of sand while the hydraulic method was in an experimental stage.
The quantities of sand removed from the filters per scraping and the rates of sand handling are shown in Tables 11 and 12.
Cost of Operation.—It is frequently difficult to compare the relative cost of corresponding items for different plants, because of the different methods of dividing the cost and the varying opinions of the officials as to what should properly be charged to each item.
In order that the data may be in sufficient detail to permit it to be rearranged to compare with other plants, a list of employees and charges for supplies is given in Table 13. This list accounts for the entire appropriation for the care and maintenance of the filtration plant, including pumping the water to the filters, parking and caring for the grounds, buildings, roads, sidewalks, etc. The cost for the various items per million gallons pumped to the filters is shown in Table 14, and the cost per cubic yard of sand handled in Table 15.
Preliminary Treatment.—Before the present filtration plant was designed, Rudolph Hering, George W. Fuller, and Allen Hazen, Members, Am. Soc. C. E., made an investigation and report. This report was dated February 18th, 1901, and contained the following paragraph:
Notwithstanding this opinion, considerable prejudice existed among the citizens of Washington against the use of a coagulant, and, as finally passed, the bill providing for the construction of the filters did not include an appropriation for the coagulant.
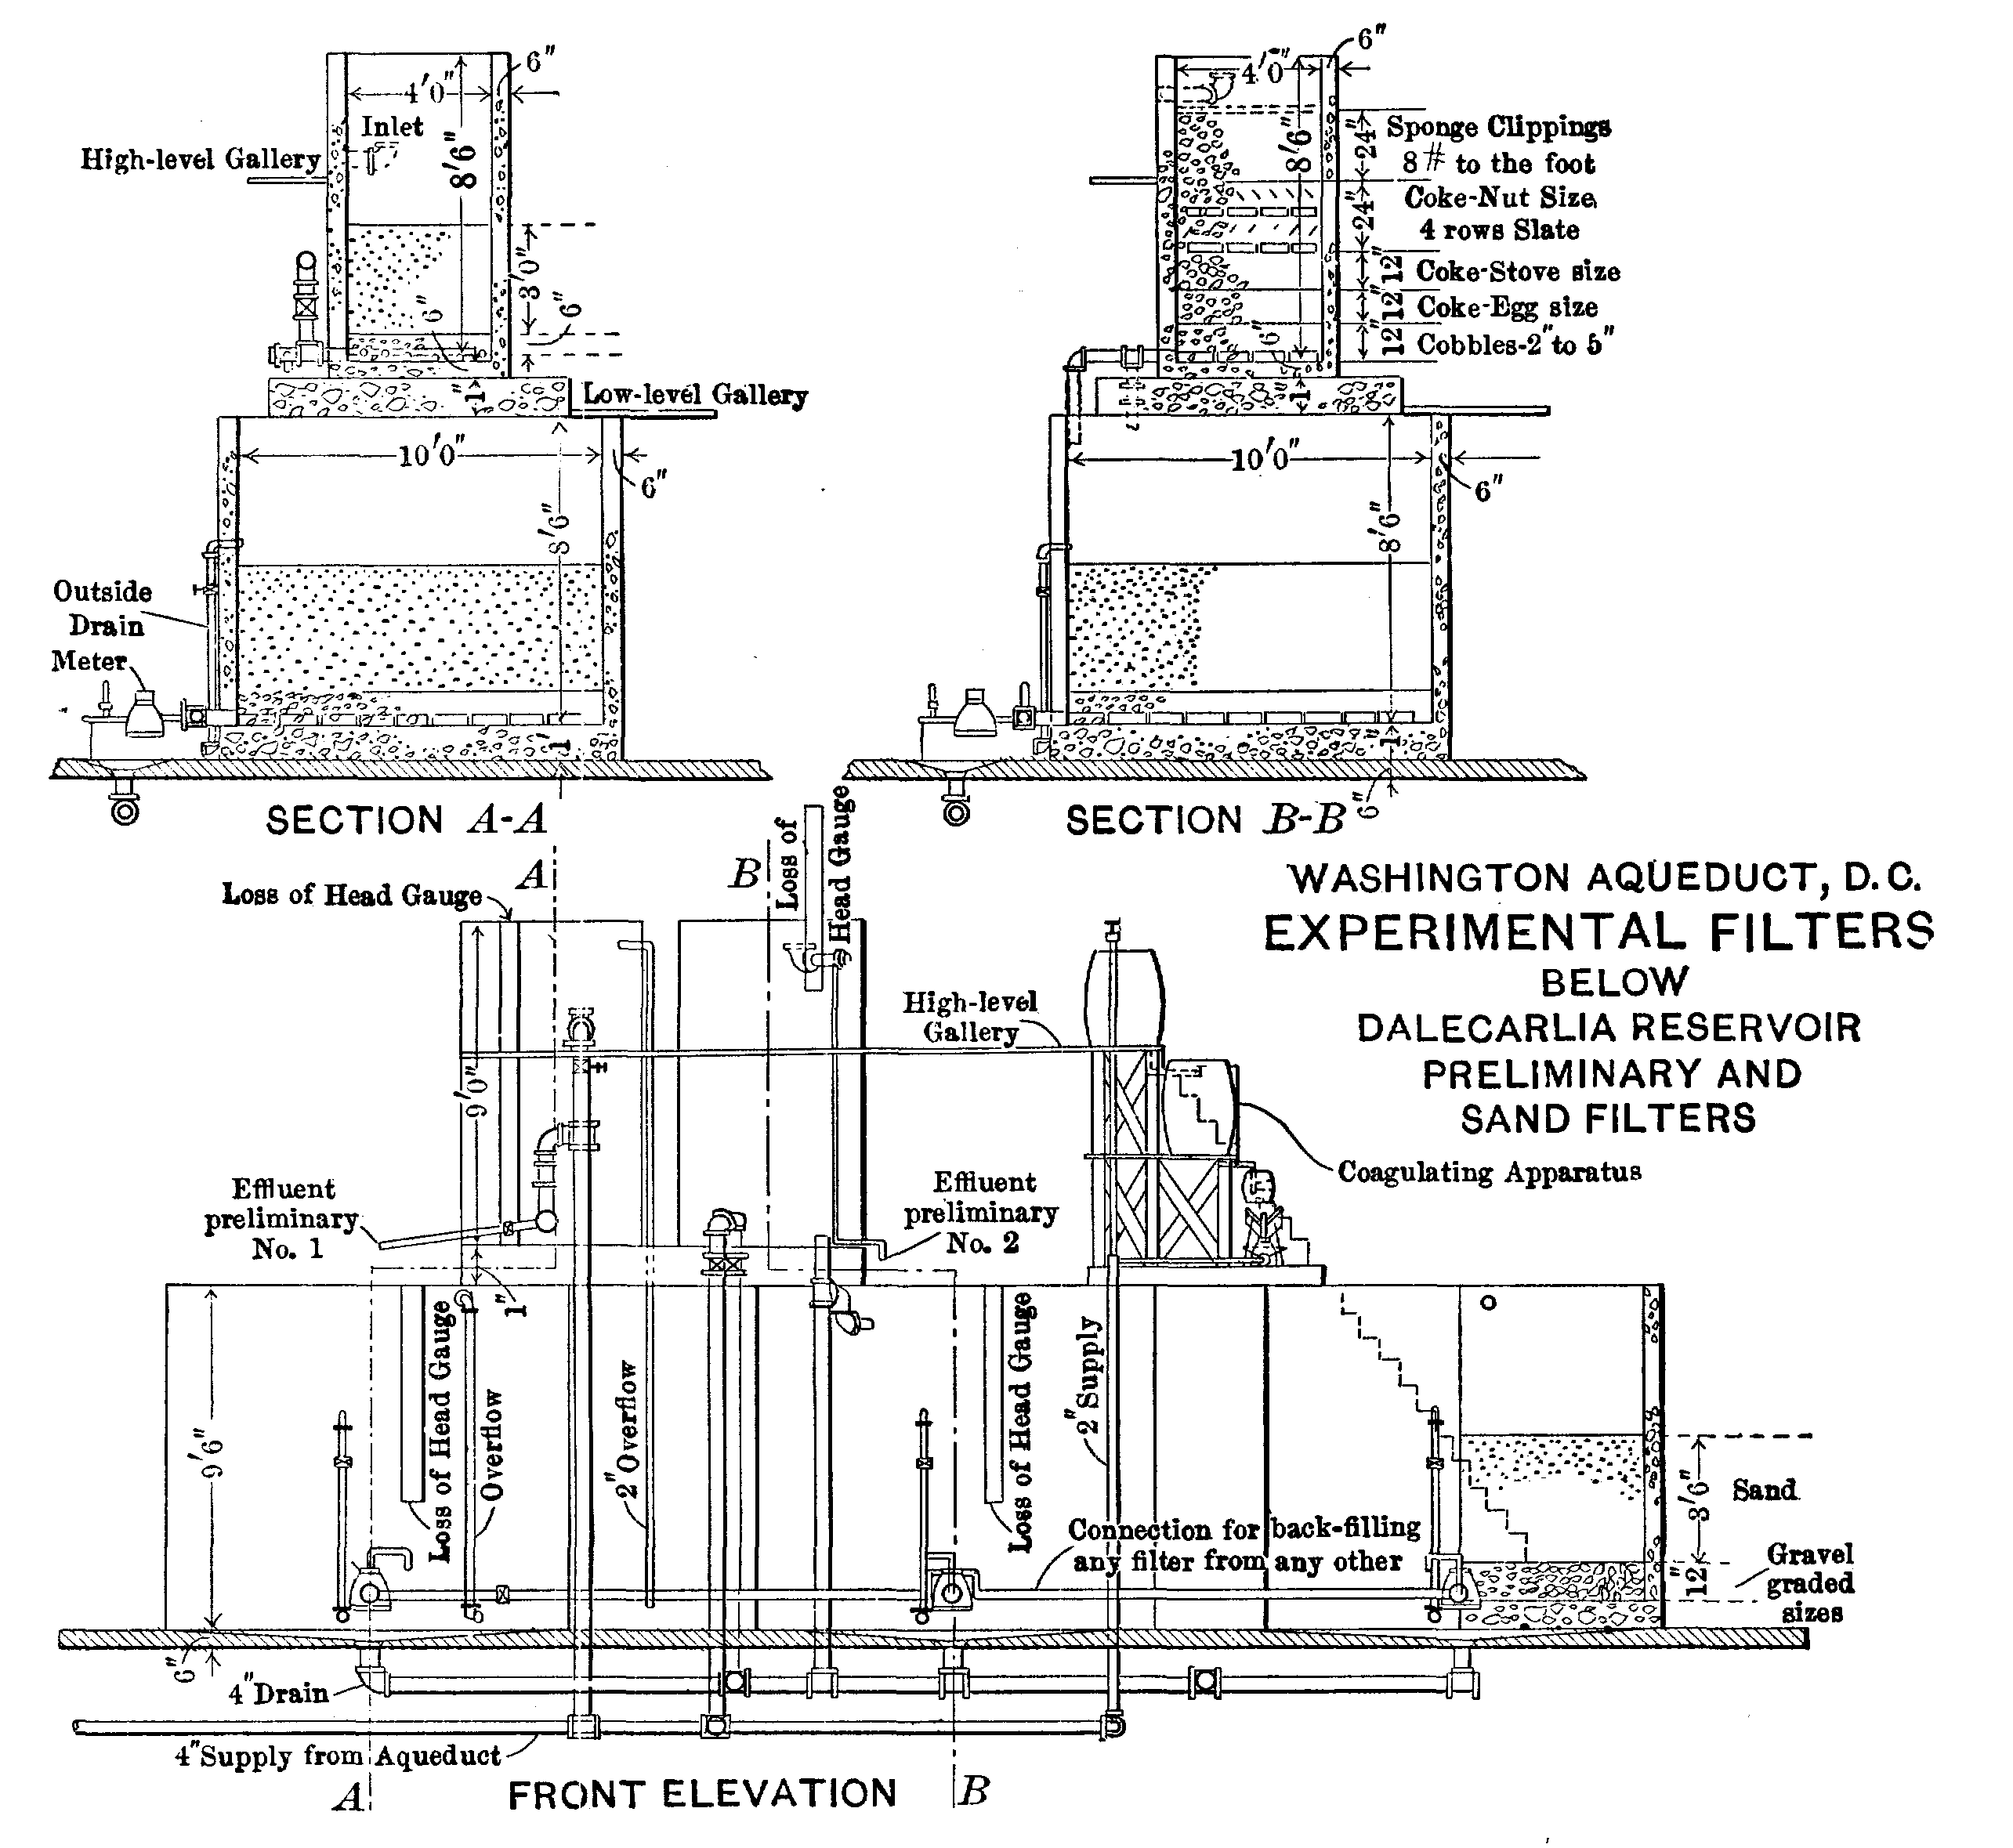
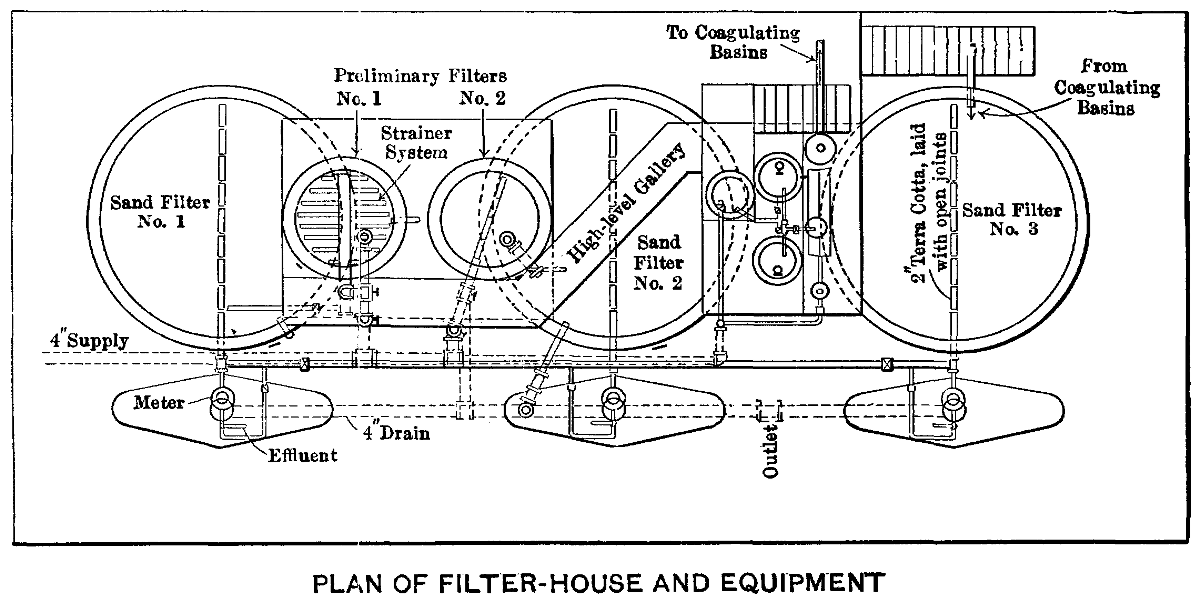
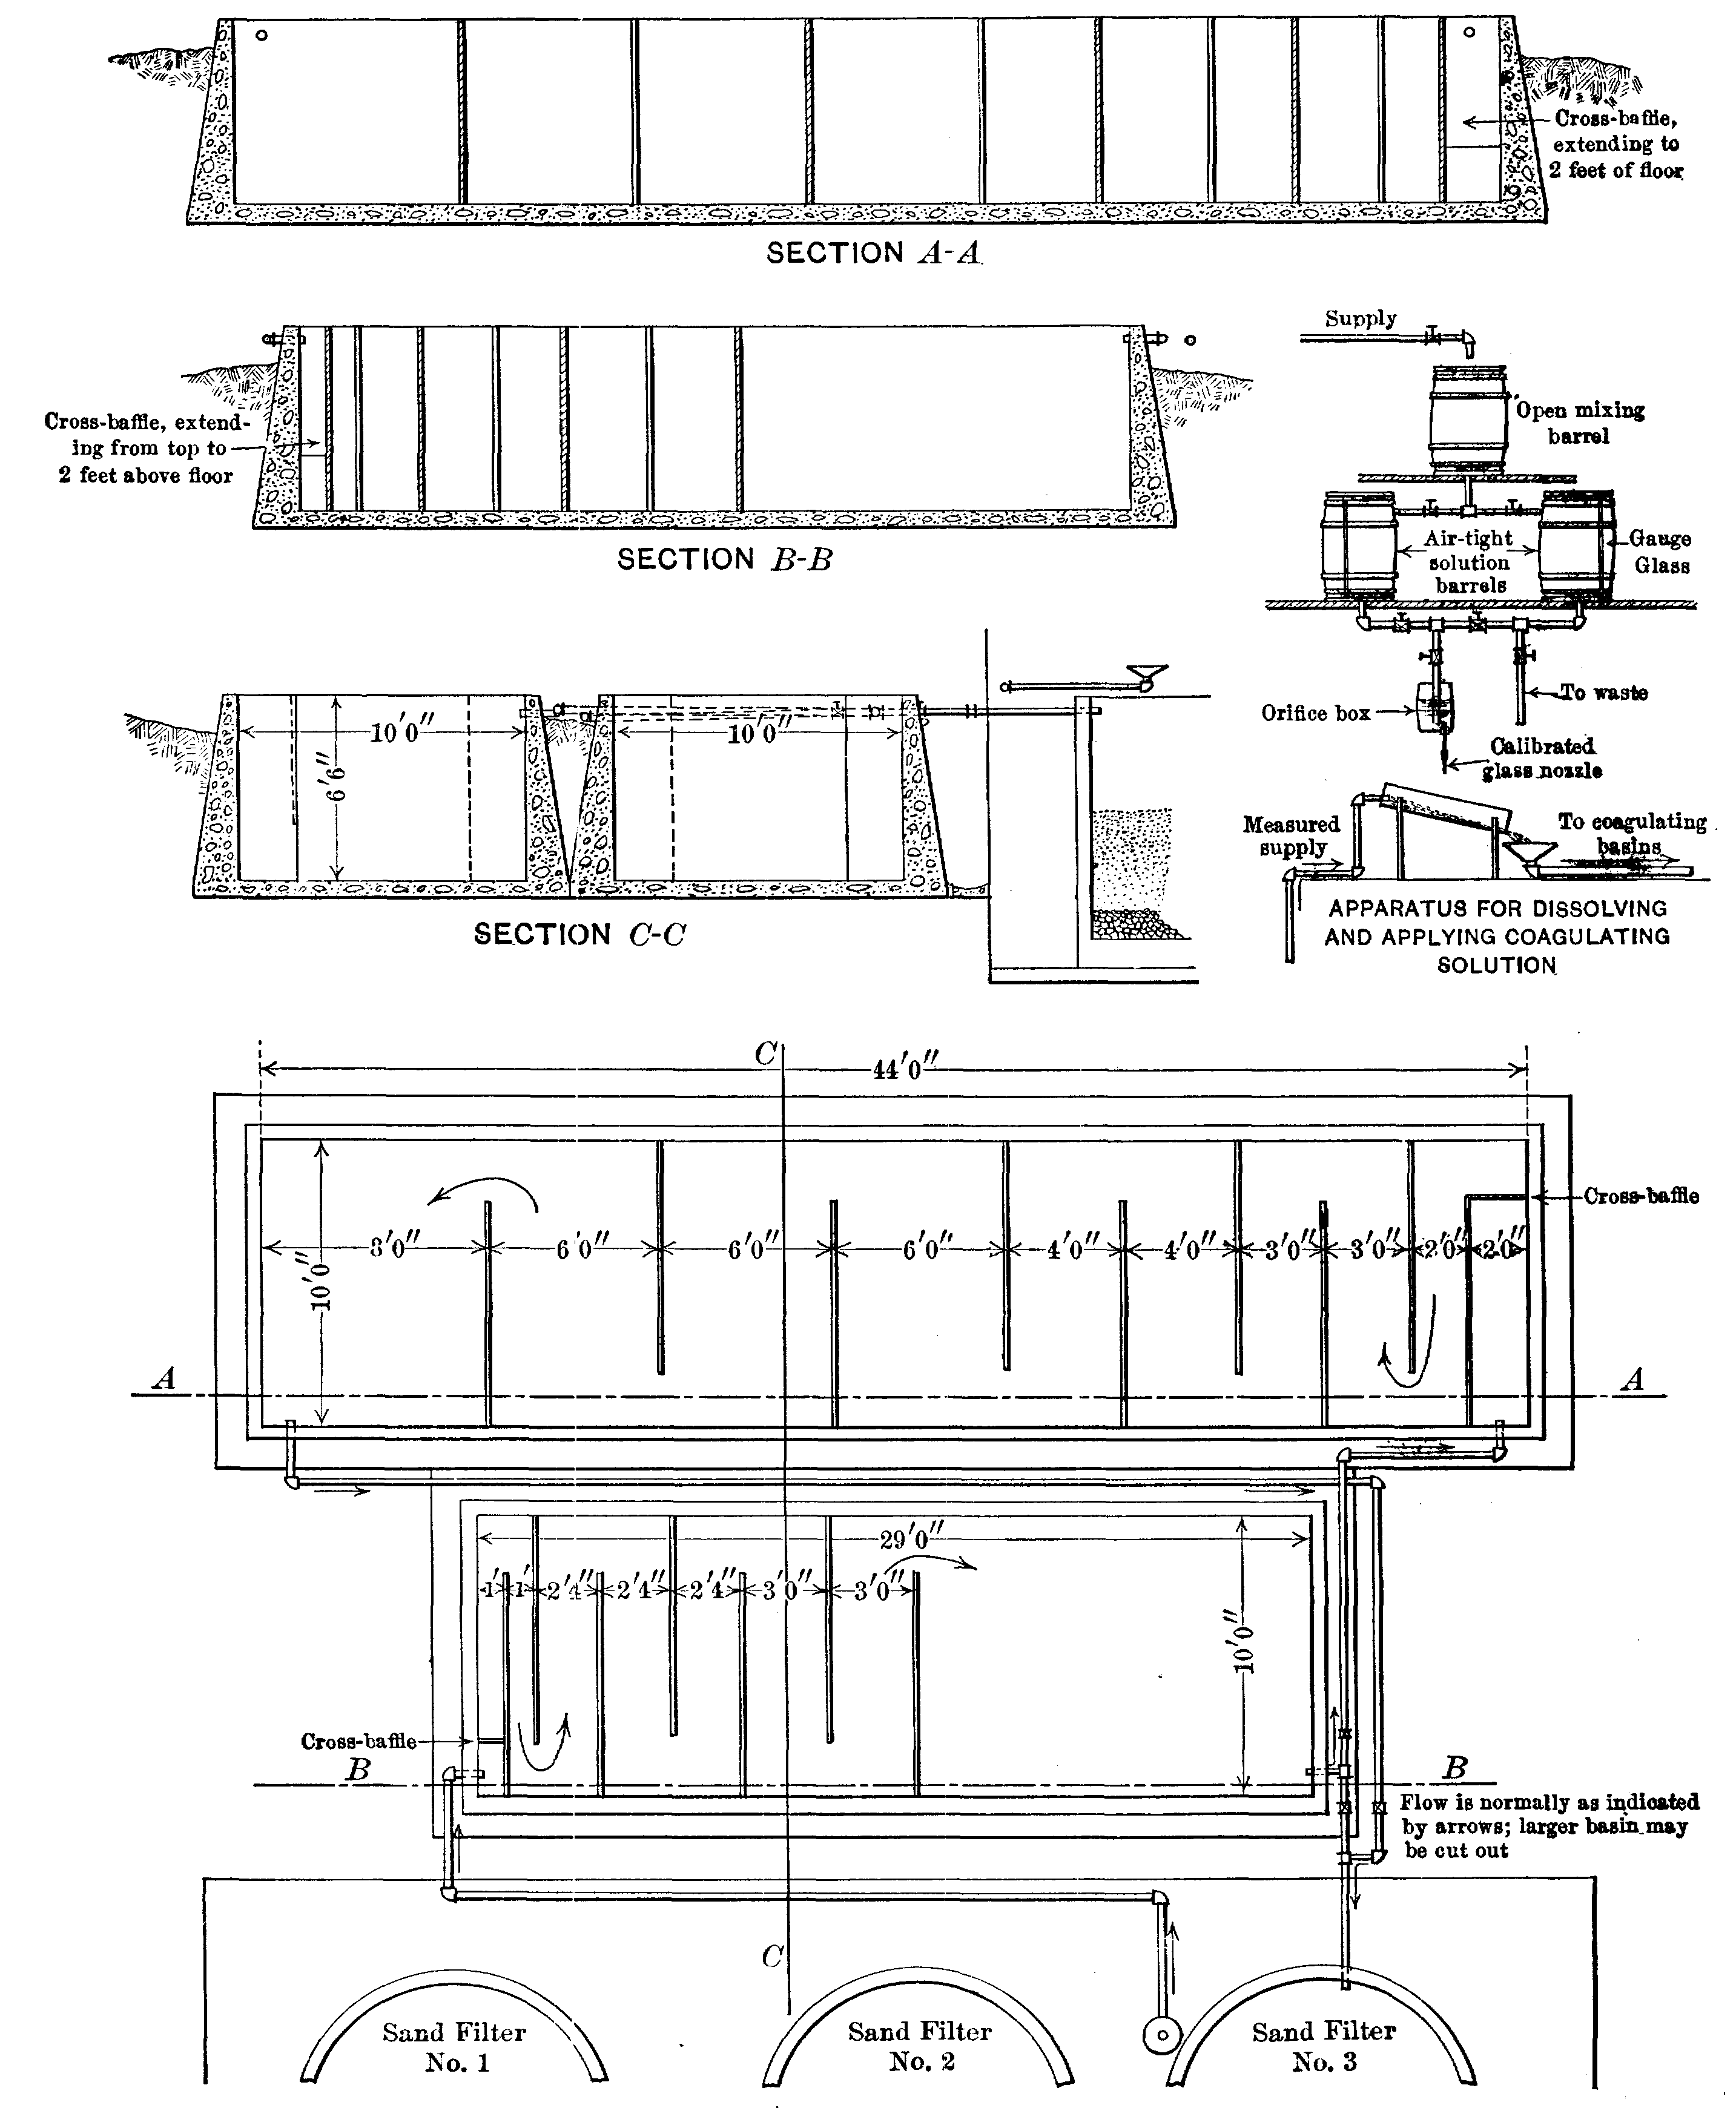
The results obtained from operating the filters being such as to justify the conclusions in the report referred to, an experimental plant was constructed for the purpose of studying the efficiency of various methods of preliminary treatment of the water. This plant consisted of three cylindrical concrete filter tanks, each 10 ft. in diameter. These tanks were filled with the layers of gravel and sand necessary to make them represent as accurately as possible the large slow sand units of the main filtration plant. Means were also provided for giving a preliminary treatment to the water supplying each of these experimental slow sand filters. In two cases, the preliminary treatment was rapid filtration, while the third consisted of sedimentation and coagulation. The sedimentation tank was of sufficient size, when compared with the area of the experimental slow sand filter, to represent the Georgetown and McMillan Park Reservoirs when used in connection with the large filters. The first preliminary filter was very similar in construction and operation to a mechanical filter. The sand for this filter was taken from the main filters, and, consequently, was finer than is generally used in mechanical filters. The second preliminary filter was a Maignen scrubber. It consisted of a cylindrical concrete tank, 4 ft. in diameter and 8‑1/2 ft. deep, which contained 12 in. of cobble‑stones on the bottom, then, successively, 12 in. of egg‑size coke, 12 in. of stove‑size coke, 24 in. of nut‑size coke, and 24 in. of sponge clippings as the final or top layer.
| Month. | Office and laboratory. | Pumping station. | Filter Operations: | Parking (care of grounds). | Experimental filters. | Main office. | Total. | |
|---|---|---|---|---|---|---|---|---|
| Sand handling. | Repairs, etc. | |||||||
| 1909. | ||||||||
| July | $0.73 | $0.57 | $0.86 | ... | $0.31 | ... | $0.15 | $2.62 |
| August | 0.75 | 0.64 | 0.59 | ... | 0.71 | ... | 0.14 | 2.83 |
| September | 0.83 | 0.67 | 0.80 | ... | 0.51 | ... | 0.17 | 2.98 |
| October | 0.72 | 0.66 | 0.73 | ... | 0.34 | ... | 0.08 | 2.53 |
| November | 0.87 | 0.76 | 0.42 | ... | 0.38 | ... | 0.18 | 2.61 |
| December | 0.90 | 0.69 | 0.27 | ... | 0.40 | ... | 0.12 | 2.38 |
| 1910. | ||||||||
| January | 0.81 | 0.63 | 0.33 | ... | 0.14 | ... | 0.10 | 2.01 |
| February | 0.94 | 0.74 | 0.35 | $0.07 | 0.11 | ... | 0.16 | 2.37 |
| March | 0.92 | 0.81 | 0.30 | 0.07 | 0.18 | ... | 0.13 | 2.41 |
| April | 0.93 | 0.83 | 0.49 | 0.03 | 0.36 | ... | 0.13 | 2.77 |
| May | 0.86 | 0.72 | 0.36 | 0.03 | 0.55 | ... | 0.18 | 2.70 |
| June | 0.88 | 0.67 | 0.38 | ... | 0.38 | ... | 0.12 | 2.43 |
| Average | 0.84 | 0.70 | 0.27 | 10.25 | 0.36 | ... | 0.14 | 2.56 |
| Fiscal years: | ||||||||
| 1905‑1906 | 0.45 | 0.45 | 0.47 | 0.02 | 0.01 | ... | 0.09 | 1.49 |
| 1906‑1907 | 0.57 | 0.57 | 0.58 | 0.21 | 0.07 | $0.03 | 0.04 | 2.07 |
| 1907‑1908 | 0.70 | 0.56 | 0.42 | 0.32 | 0.15 | 0.09 | 0.09 | 2.36 |
| 1908‑1909 | 0.72 | 0.61 | 0.41 | 0.34 | 0.22 | 0.01 | 0.13 | 2.44 |
| Month. | Office and laboratory. | Pumping station. | Filter Operations: | Parking (care of grounds). | Experimental filters. | Main office. | Total. | |
|---|---|---|---|---|---|---|---|---|
| Sand handling. | Repairs, etc. | |||||||
| 1909. | ||||||||
| July | ... | ... | $0.01 | ... | ... | ... | ... | $0.01 |
| August | $0.01 | ... | ... | ... | $0.07 | ... | $0.01 | 0.09 |
| September | 0.05 | $0.31 | 0.04 | ... | 0.01 | ... | 0.03 | 0.44 |
| October | 0.08 | 0.11 | 0.13 | ... | 0.46 | ... | 0.02 | 0.80 |
| November | 0.13 | 0.78 | 0.10 | ... | 0.34 | ... | 0.02 | 1.37 |
| December | 0.03 | 0.17 | 0.05 | ... | 0.01 | ... | 0.05 | 0.31 |
| 1910. | ||||||||
| January | 0.12 | 0.74 | 0.14 | ... | 0.01 | ... | ... | 1.01 |
| February | 0.07 | 1.88 | 0.18 | ... | 0.01 | ... | 0.01 | 2.15 |
| March | 0.26 | 0.28 | 0.01 | ... | ... | ... | ... | 0.55 |
| April | 0.18 | 1.22 | 0.10 | ... | 0.29 | ... | 0.02 | 1.81 |
| May | 0.06 | 0.72 | 0.02 | ... | 0.11 | ... | 0.02 | 0.98 |
| June | 0.54 | 2.23 | ... | 2$2.16 | 0.46 | ... | 0.04 | 5.43 |
| Average | 0.13 | 0.69 | 0.02 | 30.21 | 0.17 | ... | 0.02 | 1.24 |
| Fiscal years. | ||||||||
| 1905‑1906 | 0.04 | 0.59 | 0.02 | ... | ... | ... | ... | 0.65 |
| 1906‑1907 | 0.03 | 0.67 | 0.08 | 0.20 | 0.02 | ... | ... | 1.00 |
| 1907‑1908 | 0.05 | 0.54 | 0.04 | 0.07 | 0.06 | ... | 0.01 | 0.77 |
| 1908‑1909 | 0.10 | 0.69 | 0.05 | 0.18 | 0.18 | ... | 0.02 | 1.22 |
| Month. | Office and laboratory. | Pumping station. | Filter Operations: | Parking (care of grounds). | Experimental filters. | Main office. | Total. | |
|---|---|---|---|---|---|---|---|---|
| Sand handling. | Repairs, etc. | |||||||
| 1909. | ||||||||
| July | $0.73 | $0.57 | $0.87 | ... | $0.31 | ... | $0.15 | $2.63 |
| August | 0.76 | 0.64 | 0.59 | ... | 0.78 | ... | 0.15 | 2.92 |
| September | 0.88 | 0.98 | 0.84 | ... | 0.52 | ... | 0.20 | 3.42 |
| October | 0.80 | 0.77 | 0.86 | ... | 0.80 | ... | 0.10 | 3.33 |
| November | 1.00 | 1.54 | 0.52 | ... | 0.72 | ... | 0.20 | 3.98 |
| December | 0.93 | 0.86 | 0.32 | ... | 0.41 | ... | 0.17 | 2.69 |
| 1910. | ||||||||
| January | 0.93 | 1.37 | 0.47 | ... | 0.15 | ... | 0.10 | 3.02 |
| February | 1.01 | 2.62 | 0.53 | $0.07 | 0.12 | ... | 0.17 | 4.52 |
| March | 1.18 | 1.09 | 0.31 | 0.07 | 0.18 | ... | 0.13 | 2.96 |
| April | 1.11 | 2.05 | 0.59 | 0.03 | 0.65 | ... | 0.15 | 4.58 |
| May | 0.92 | 1.44 | 0.38 | 0.03 | 0.66 | ... | 0.20 | 3.63 |
| June | 1.42 | 2.90 | 0.38 | 2.16 | 0.84 | ... | 0.16 | 7.86 |
| Average. | 0.97 | 1.39 | 0.29 | 0.46 | 0.58 | ... | 0.16 | 3.80 |
| Fiscal years: | ||||||||
| 1905‑1906 | 0.49 | 1.04 | 0.49 | 0.02 | 0.01 | ... | 0.09 | 2.14 |
| 1906‑1907 | 0.60 | 1.24 | 0.66 | 0.41 | 0.09 | $0.03 | 0.04 | 3.07 |
| 1907‑1908 | 0.75 | 1.13 | 0.46 | 0.39 | 0.21 | 0.09 | 0.10 | 3.13 |
| 1908‑1909 | 0.82 | 1.30 | 0.46 | 0.52 | 0.40 | 0.01 | 0.15 | 3.66 |
The two preliminary filters were operated at a rate of about 50,000,000 gal. per acre per day, and the three slow sand filters at rates of from 3,000,000 to 4,000,000 gal. per day.
This plant was put in service during the early part of February, 1907, and was kept in practically continuous operation until the end of July, 1908.
| Month. | Scraping. | Ejecting. | Washing. | Smoothing. | Raking. | Re-Sanding. | Total. |
|---|---|---|---|---|---|---|---|
| 1909. | |||||||
| July | $0.08 | $0.15 | $0.03 | $0.01 | ... | $0.10 | $0.37 |
| August | 0.07 | 0.15 | 0.03 | 0.01 | ... | 0.11 | 0.37 |
| September | 0.07 | 0.17 | 0.03 | 0.01 | ... | 0.17 | 0.45 |
| October | 0.06 | 0.15 | 0.03 | 0.01 | ... | 0.09 | 0.34 |
| November | 0.10 | 0.23 | 0.02 | 0.02 | ... | ... | 0.37 |
| December | 0.12 | 0.25 | 0.04 | 0.02 | ... | 0.08 | 0.51 |
| 1910. | |||||||
| January | 0.10 | 0.19 | ... | 0.02 | ... | ... | 0.31 |
| February | 0.07 | 0.15 | ... | 0.01 | ... | 0.09 | 0.32 |
| March | 0.06 | 0.11 | ... | 0.02 | ... | 0.08 | 0.27 |
| April | 0.07 | 0.09 | 0.03 | 0.01 | ... | 0.05 | 0.25 |
| May | 0.06 | 0.09 | 0.03 | 0.01 | ... | 0.06 | 0.25 |
| June | 0.06 | 0.12 | ... | 0.01 | ... | 0.10 | 0.29 |
| Average | 0.07 | 0.14 | 0.02 | 0.01 | ... | 0.10 | 0.34 |
| Fiscal years: | |||||||
| 1905‛06 | 0.07 | 0.35 | 0.04 | 0.07 | ... | 0.14 | 0.67 |
| 1906‑07 | 0.06 | 0.19 | 0.03 | 0.02 | ... | 0.17 | 0.47 |
| 1907‑08 | 0.09 | 0.15 | 0.03 | 0.01 | ... | 0.14 | 0.42 |
| 1908‑09 | 0.06 | 0.14 | 0.03 | 0.01 | ... | 0.13 | 0.37 |
For convenience in referring to the different systems, the combined rapid and slow sand filter will be designated as Filter Plant No. 1, the combined Maignen scrubber and slow sand filter as Filter Plant No. 2, and the combined coagulating basin and slow sand basin as Filter Plant No. 3.
The length of run of Filter Plant No. 1 was relatively long at first. The rapid rate of filtration, however, tended to carry the clay, which was suspended in the applied water, to a considerable depth in the filtering material, so that the runs gradually decreased in length until they were reduced to about three days. Unfortunately, it was necessary to use unfiltered water for washing, which, together with the great penetration from the applied water, finally made it necessary to remove all the filtering materials, and wash them.
Although this preliminary filter was operated at a high rate, its efficiency was quite satisfactory. In fact, at times when the applied water was comparatively good, very little work was left for the slow sand filter. At times of high turbidity, however, some of the exceedingly fine mud in the applied water passed through this filter, as well as the slow sand filter connected with it, and it proved to be absolutely impossible to produce a clear effluent at all times with this combination.
Filter Plant No. 2 proved more economical and convenient in operation, but somewhat less efficient than Filter Plant No. 1. Neither filter could be depended on to give a clear effluent when the applied water was turbid.
In the operation of Filter Plant No. 3, sulphate of alumina was used when the applied water contained too much turbidity to be treated satisfactorily by slow sand filters.
When the water was comparatively clear, either one of the three systems, or slow sand filtration alone, was entirely satisfactory. At times of high turbidity, however, Filter Plant No. 3 was the only one which could be depended on to produce a clear effluent.
A fair comparison between the results of the three systems when treating turbid water in January, 1908, is given in Table 16.
Table 16 shows very clearly that neither Filter Plant No. 1 nor No. 2 would prove at all satisfactory when treating turbid water, while No. 3 could be depended on under all conditions. The results of operation are shown in detail in Tables 17, 18, and 19. It will be noticed in Table 17, that on March 10th, 1908, Filter Plant No. 1 was put out of service and a Puech system of preliminary filters was substituted for it.
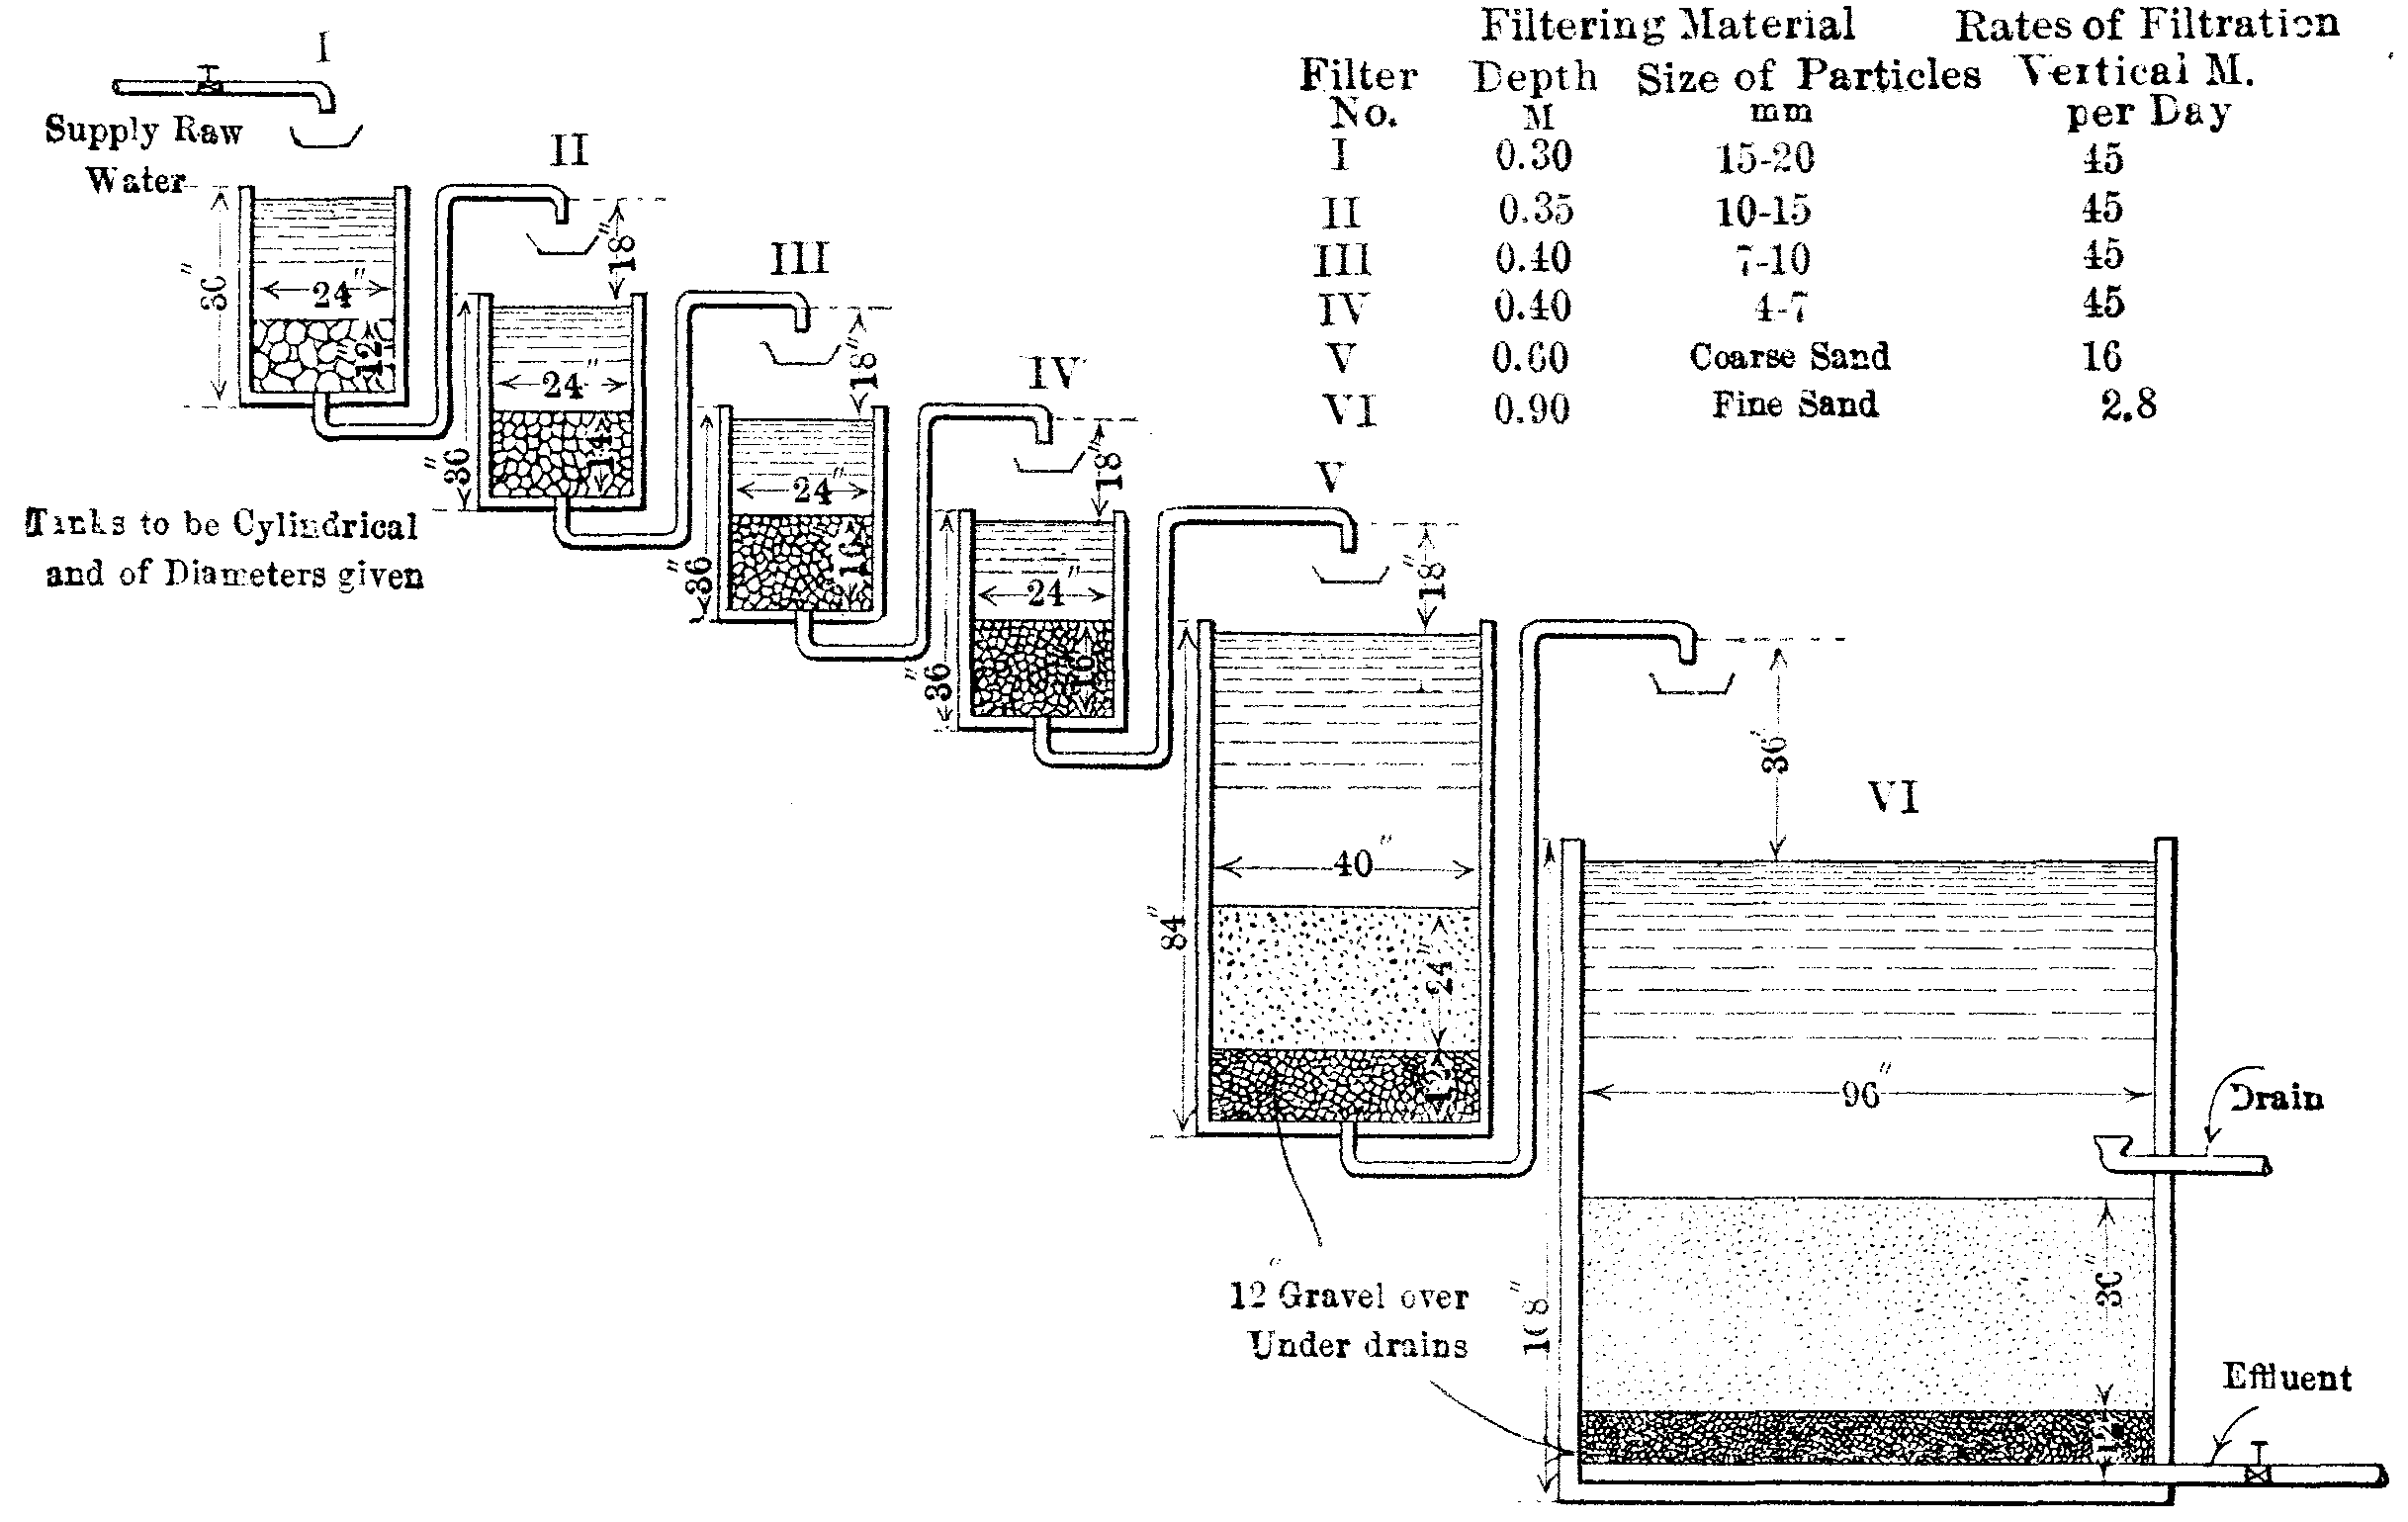
The Puech preliminary filters consisted of five units containing gravel of varying sizes through which the water was filtered successively before it was finally applied to the final slow sand filter. A general idea of this system may be obtained by referring to Figure 8.
It is unfortunate that this system was not in operation in January, 1908, when the water was cold and turbid. The results, however, indicate that it would be no more successful than either Filter Plant No. 1 or No. 2.
Experimental Rate Studies.—In September, 1908, an experimental plant consisting of six small filters was put in operation. The object of these experiments was to study the relative efficiencies and cost for the operation of slow sand filters when operated at different rates.
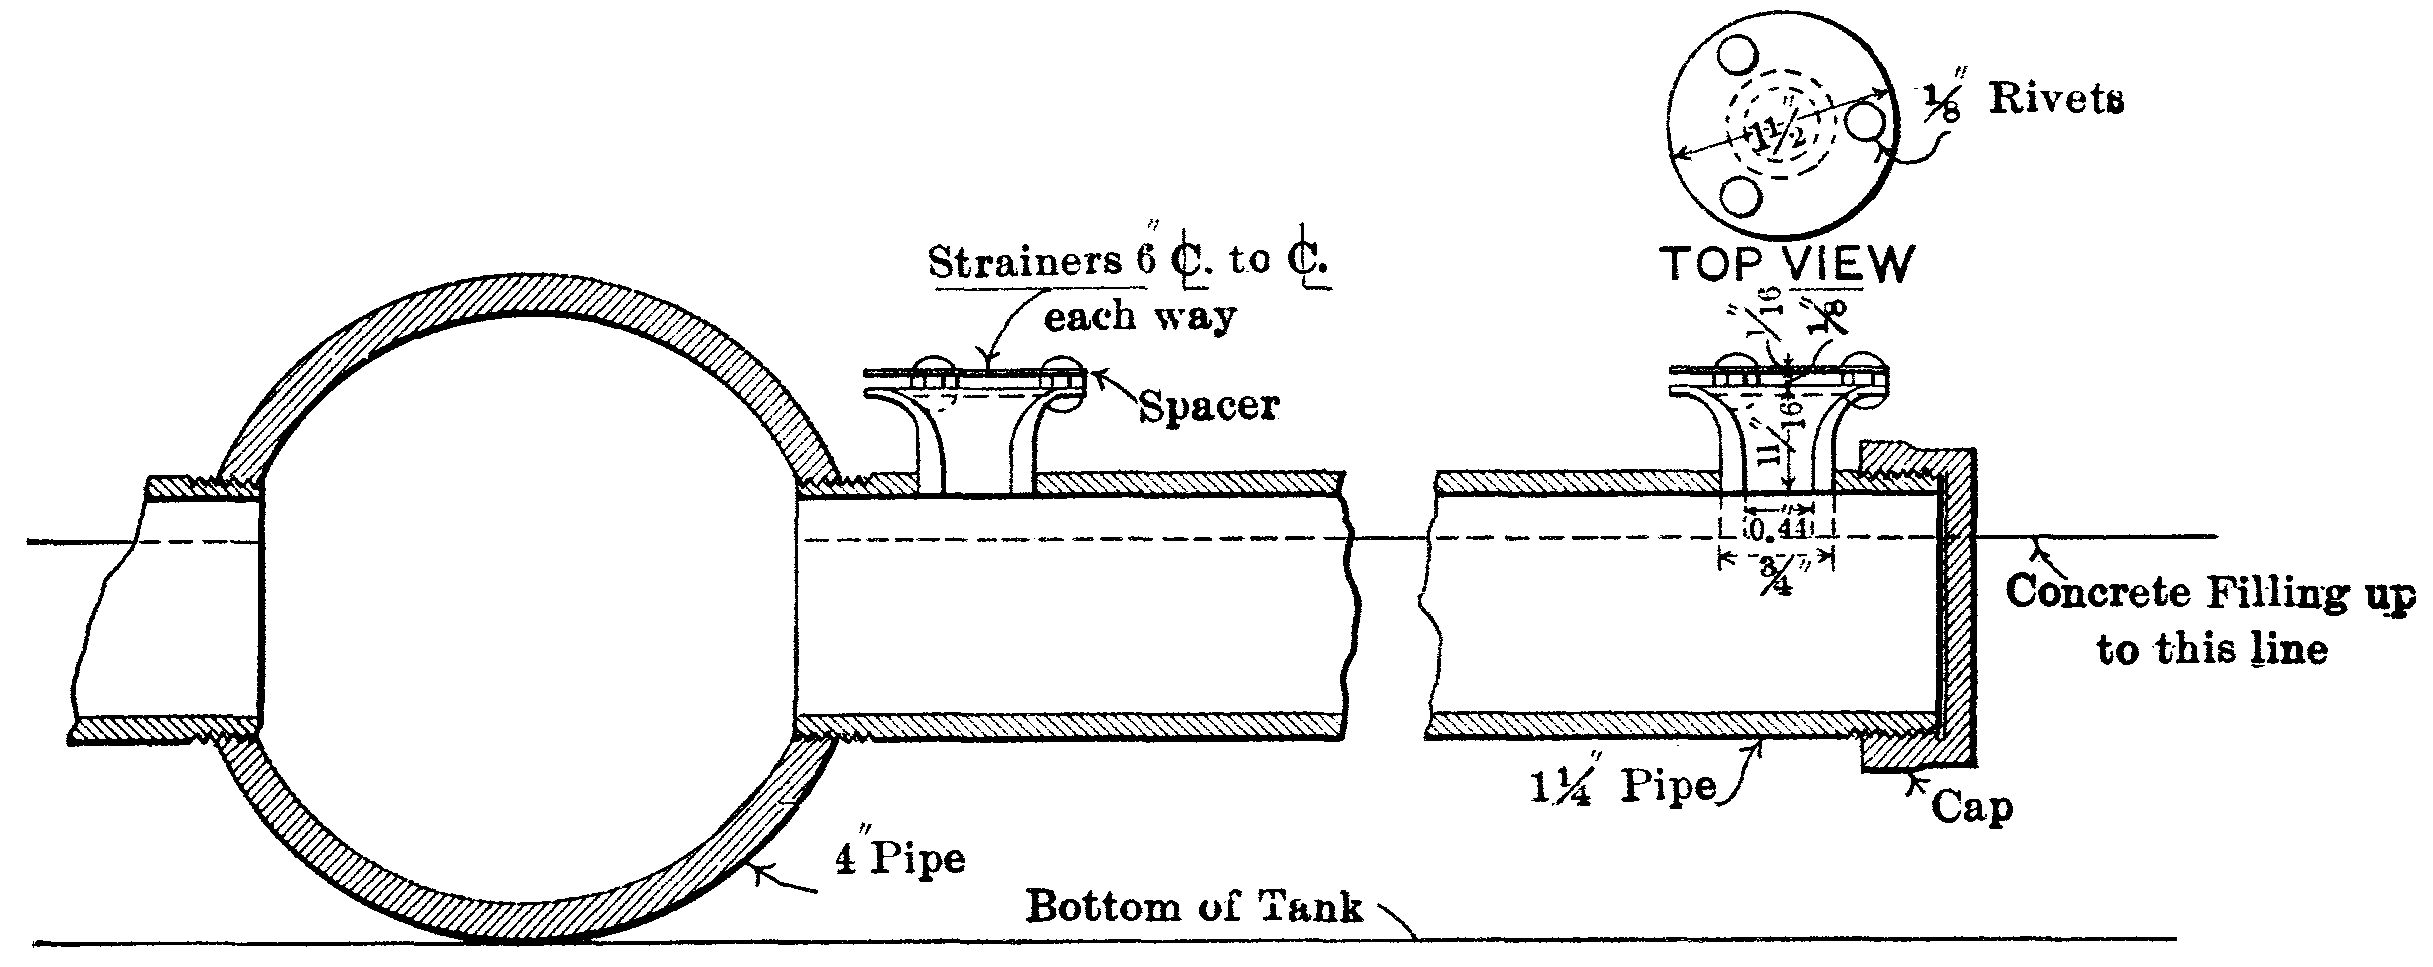
The units of the plant consisted of cylindrical galvanized‑iron tanks 4 ft. in diameter and 9 ft. high. The filter sand in these tanks was taken from the supply for the main filters. It was supported on gravel layers and supplied with under‑drains of suitable sizes for the proposed rate of flow in each case.
The units of the experimental plant were designated as Nos. 1, 2, 3, 4, 5, and 6, and it was the original intention to operate them at rates of 1,000,000, 3,000,000, 6,000,000, 10,000,000, 30,000,000, and 100,000,000 gal. per acre daily, respectively.
This schedule of rates was carried out in a general way with all the filters, with the exception of Nos. 5 and 6. For these, the rates were found to be higher than could be maintained for any great length of time, owing to the deeper penetration of the mud in the filter sand, which caused high initial losses of head, short runs, and deep scrapings. A rate of about 30,000,000 gal. was maintained in the case of Filter No. 5 from the time it was started on September 9th, 1908, until November 8th, 1909, when it was reduced to about 17,000,000 gal., which rate was maintained thereafter until the filter was shut down in February, 1910.
In the case of Filter No. 6, it was found impossible to maintain a rate of 100,000,000 gal. for more than a very few days at a time. It was started at about this rate, however, at the beginning of each run, and kept as high as possible for the remainder of the time during the first seven runs. At the end of the seventh run, on October 17th, 1908, the filter was given a very deep scraping and re‑sanded.
The layer of clean sand restored the original capacity, and the filter was operated as before, but with gradually decreasing rates until December, 1908, when the rate was reduced to about 40,000,000 gal. Even this lower rate was too high to be maintained without removing and replacing a large part of the sand. The rates, therefore, gradually decreased to about 23,000,000 gal. on March 13th, 1909, when the filter was again re‑sanded. After this re‑sanding the rate was reduced to about 20,000,000 gal., and the filter was operated at approximately that rate until it was again re‑sanded on November 13th, 1909, when the rate was again reduced to about 14,000,000 gal., which was maintained until the filter was put out of service on February 28th, 1910.
This experimental plant was in service from September, 1908, to the latter part of February, 1910, or for about 1‑1/2 years, and the leading results are summarized in Table 20.
| Date. | Puech system: | Final filter. | Turbidity. | Bacteria. | |||||||||
|---|---|---|---|---|---|---|---|---|---|---|---|---|---|
| Rates, millions of gallons per acre daily. | Rate, millions of gallons per acre daily. | Loss of head. | Applied water. | Effluent, preliminary filter. | Effluent, final filter. | Applied water. | Effluent, preliminary filter. | Effluent, final filter. | |||||
| 1908. | |||||||||||||
| Mar. 11 | 265 | 170 | 90 | 53 | 18 | 2.99 | 0.53 | 155 | 80 | 7 | 6,500 | 8,500 | 490 |
| Mar. 12 | 265 | 170 | 90 | 53 | 18 | 2.99 | 0.60 | 135 | 70 | 7 | 5,900 | 6,000 | 360 |
| Mar. 13 | 265 | 170 | 90 | 53 | 18 | 3.00 | 0.60 | 122 | 52 | 6 | 1,900 | 1,700 | 140 |
| Mar. 14 | 265 | 170 | 90 | 53 | 18 | 3.00 | 0.61 | 97 | 40 | 5 | 1,800 | 1,600 | 130 |
| Mar. 15 | 265 | 170 | 90 | 53 | 18 | 2.99 | 0.64 | 77 | 31 | 4 | Sunday. | ||
| Mar. 16 | 265 | 170 | 90 | 53 | 18 | 3.00 | 0.69 | 65 | 26 | 3 | 1,400 | 1,200 | 50 |
| Mar. 17 | 241 | 155 | 82 | 48 | 16 | 2.99 | 0.71 | 59 | 19 | 3 | 900 | 200 | 45 |
| Mar. 18 | 252 | 162 | 86 | 50 | 17 | 2.99 | 0.75 | 67 | 22 | 2 | 1,000 | 700 | 33 |
| Mar. 19 | 241 | 155 | 82 | 48 | 16 | 2.99 | 0.78 | 60 | 21 | 2 | ... | 800 | 44 |
| Mar. 20 | 294 | 189 | 100 | 59 | 20 | 2.99 | 0.85 | 57 | 18 | 2 | 1,300 | 650 | 37 |
| Mar. 21 | 279 | 179 | 95 | 56 | 19 | 2.99 | 0.92 | 67 | 21 | 2 | 800 | 600 | 34 |
| Mar. 22 | 265 | 170 | 90 | 53 | 18 | 2.99 | 0.99 | 80 | 27 | 2 | Sunday. | ||
| Mar. 23 | 265 | 170 | 90 | 53 | 18 | 2.99 | 1.06 | 90 | 32 | 2 | 4,600 | 1,300 | 33 |
| Mar. 24 | 265 | 170 | 90 | 53 | 18 | 2.99 | 1.12 | 82 | 34 | 3 | 2,500 | 950 | 38 |
| Mar. 25 | 265 | 170 | 90 | 53 | 18 | 2.99 | 1.18 | 67 | 27 | 3 | 1,600 | ... | 30 |
| Mar. 26 | 265 | 170 | 90 | 53 | 18 | 2.99 | 1.22 | 60 | 20 | 3 | 550 | 400 | 24 |
| Mar. 27 | 265 | 170 | 90 | 53 | 18 | 3.00 | 1.23 | 59 | 18 | 2 | 950 | 360 | 28 |
| Mar. 28 | 265 | 170 | 90 | 53 | 18 | 3.00 | 1.25 | 51 | 14 | 2 | 650 | 230 | 18 |
| Mar. 29 | 265 | 170 | 90 | 53 | 18 | 2.99 | 1.28 | 31 | 6 | 2 | Sunday. | ||
| Mar. 30 | 265 | 170 | 90 | 53 | 18 | 2.99 | 1.36 | 30 | 5 | 1 | 500 | 160 | 25 |
| Mar. 31 | 265 | 170 | 90 | 53 | 18 | 2.99 | 1.43 | 39 | 7 | 1 | 750 | 140 | 26 |
| April 1 | 265 | 170 | 90 | 53 | 18 | 3.00 | 1.48 | 44 | 9 | 1 | 750 | 60 | 41 |
| April 2 | 265 | 170 | 90 | 53 | 18 | 2.99 | 1.56 | 42 | 9 | 1 | 1,100 | 140 | 26 |
| April 3 | 318 | 204 | 108 | 64 | 22 | 2.99 | 1.63 | 41 | 8 | 1 | 1,500 | 47 | 11 |
| April 4 | 294 | 189 | 100 | 59 | 20 | 2.99 | 1.70 | 54 | 13 | 1 | 700 | 80 | 35 |
| April 5 | 279 | 179 | 95 | 56 | 19 | 3.00 | 1.73 | 50 | 13 | 1 | Sunday. | ||
| April 6 | 279 | 179 | 95 | 56 | 19 | 2.99 | 1.76 | 41 | 9 | 1 | 440 | 65 | 17 |
| April 7 | 265 | 170 | 90 | 53 | 18 | 3.00 | 1.78 | 35 | 6 | 1 | 650 | 65 | 34 |
| April 8 | 265 | 170 | 90 | 53 | 18 | 3.00 | 1.79 | 39 | 6 | 1 | 550 | 44 | 10 |
| April 9 | 265 | 170 | 90 | 53 | 18 | 3.00 | 1.79 | 40 | 6 | 1 | 390 | 30 | 25 |
| April 10 | 265 | 170 | 90 | 53 | 18 | 3.00 | 1.77 | 40 | 6 | 1 | 500 | 27 | 16 |
| April 11 | 265 | 170 | 90 | 53 | 18 | 3.00 | 1.78 | 45 | 7 | 1 | 430 | 28 | 28 |
| April 12 | 265 | 170 | 90 | 53 | 18 | 2.99 | 1.80 | 52 | 11 | 1 | Sunday. | ||
| April 13 | 265 | 170 | 90 | 53 | 18 | ... | 1.81 | 50 | 10 | 1 | 490 | 17 | 26 |
| April 14 | Shut down on account of losing water when aqueduct was drained; also cleaned coarse sand filter. Started April 22d. | ||||||||||||
| April 23 | 241 | 155 | 82 | 48 | 16 | ... | 1.82 | 29 | 4 | 1 | 140 | 600 | 38 |
| April 24 | 241 | 155 | 82 | 48 | 16 | 3.00 | 1.87 | 21 | 3 | 1 | 200 | 1,000 | 13 |
| April 25 | 241 | 155 | 82 | 48 | 16 | 2.99 | 1.95 | 20 | 3 | 1 | 85 | 180 | 25 |
| April 26 | 252 | 162 | 86 | 50 | 17 | 3.00 | 1.95 | 24 | 3 | 1 | Sunday. | ||
| April 27 | 241 | 155 | 82 | 48 | 16 | 3.00 | 1.93 | 18 | 2 | 1 | 95 | 35 | 23 |
| April 28 | 241 | 155 | 82 | 48 | 16 | 3.00 | 1.96 | 20 | 2 | 1 | 70 | 24 | 18 |
| April 29 | 241 | 155 | 82 | 48 | 16 | 2.99 | 1.97 | 24 | 3 | 1 | 110 | 21 | 24 |
| April 30 | 241 | 155 | 82 | 48 | 16 | 2.99 | 2.03 | 21 | 2 | 1 | 70 | 25 | 6 |
| May 1 | 241 | 155 | 82 | 48 | 16 | 3.00 | 2.07 | 32 | 4 | 1 | 130 | 20 | 18 |
| May 2 | 241 | 155 | 82 | 48 | 16 | 2.99 | 2.12 | 26 | 3 | 1 | 140 | 16 | 12 |
| May 3 | 241 | 155 | 82 | 48 | 16 | 2.99 | 2.17 | 22 | 3 | 1 | Sunday. | ||
| May 4 | 241 | 155 | 82 | 48 | 16 | 3.00 | 2.19 | 19 | 2 | 1 | 85 | 30 | 17 |
| May 5 | 241 | 155 | 82 | 48 | 16 | 3.00 | 2.20 | 18 | 2 | 1 | 130 | 33 | 9 |
| May 6 | 241 | 155 | 82 | 48 | 16 | 2.99 | 2.23 | 18 | 2 | 1 | 230 | 55 | 6 |
| May 7 | 252 | 162 | 86 | 50 | 17 | 3.00 | 2.24 | 19 | 2 | 1 | 160 | 75 | 10 |
| May 8 | 241 | 155 | 82 | 48 | 16 | 3.00 | 2.25 | 19 | 2 | 1 | 375 | 55 | 8 |
| May 9 | 318 | 204 | 108 | 64 | 22 | 2.99 | 2.29 | 18 | 2 | 1 | 1,200 | 12 | 9 |
| May 10 | 318 | 204 | 108 | 64 | 22 | 2.99 | 2.30 | 30 | 3 | 1 | Sunday. | ||
| May 11 | 265 | 170 | 90 | 53 | 18 | 2.99 | 2.33 | 60 | 10 | 1 | 2,800 | 130 | 11 |
| May 12 | 252 | 162 | 86 | 50 | 17 | 2.99 | 2.39 | 70 | 15 | 1 | 2,900 | 135 | 9 |
| May 13 | 241 | 155 | 82 | 48 | 16 | 3.00 | 2.41 | 66 | 14 | 1 | 1,800 | 110 | 16 |
| May 14 | 265 | 170 | 90 | 53 | 18 | 3.00 | 2.38 | 45 | 7 | 1 | 2,700 | 65 | 18 |
| May 15 | 252 | 162 | 86 | 50 | 17 | 3.00 | 2.41 | 39 | 5 | 1 | 950 | 45 | 14 |
| May 16 | 241 | 155 | 82 | 48 | 16 | 3.00 | 2.41 | 49 | 7 | 1 | 800 | 32 | 10 |
| May 17 | 241 | 155 | 82 | 48 | 16 | 3.01 | 2.34 | 46 | 7 | 1 | Sunday. | ||
| May 18 | 241 | 155 | 82 | 48 | 16 | 3.00 | 2.31 | 31 | 4 | 1 | 700 | 26 | 6 |
| May 19 | 252 | 162 | 86 | 50 | 17 | 3.00 | 2.26 | 36 | 4 | 1 | 375 | 28 | 17 |
| May 20 | 252 | 162 | 86 | 50 | 17 | 3.00 | 2.20 | 41 | 5 | 1 | 425 | 38 | 11 |
| May 21 | 344 | 221 | 117 | 69 | 23 | 3.00 | 2.18 | 30 | 3 | 1 | 300 | 25 | 9 |
| May 22 | 241 | 155 | 82 | 48 | 16 | 3.01 | 2.17 | 53 | 7 | 1 | 950 | 220 | 18 |
| May 23 | 265 | 170 | 90 | 53 | 18 | 2.99 | 2.25 | 127 | 38 | 1 | 2,400 | 600 | 21 |
| May 24 | 331 | 212 | 112 | 66 | 22 | 3.00 | 2.19 | 110 | 39 | 3 | Sunday. | ||
| May 25 | 318 | 204 | 108 | 64 | 22 | 3.01 | 2.02 | 90 | 25 | 3 | 600 | 300 | 40 |
| May 26 | 279 | 179 | 95 | 56 | 19 | 3.02 | 1.87 | 135 | 45 | 3 | 3,200 | 110 | 34 |
| May 27 | 265 | 170 | 90 | 53 | 18 | 3.01 | 1.63 | 110 | 39 | 3 | 14,500 | 320 | 45 |
| May 28 | 252 | 162 | 86 | 50 | 17 | 3.01 | 1.41 | 90 | 27 | 3 | 1,000 | 95 | 28 |
| May 29 | 252 | 162 | 86 | 50 | 17 | 3.01 | 1.24 | 70 | 17 | 3 | 1,100 | 150 | 26 |
| May 30 | 252 | 162 | 86 | 50 | 17 | 3.01 | 1.07 | 50 | 9 | 2 | Holiday. | ||
| May 31 | 241 | 155 | 82 | 48 | 16 | 3.01 | 1.03 | 34 | 4 | 2 | Sunday. | ||
| June 1 | 252 | 162 | 86 | 50 | 17 | 3.00 | 0.83 | 35 | 4 | 1 | ... | ... | ... |
| June 2 | 241 | 155 | 82 | 48 | 16 | 3.00 | 0.74 | 39 | 5 | 1 | ... | ... | ... |
| June 3 | 252 | 162 | 86 | 50 | 17 | 3.00 | 0.68 | 35 | 4 | 1 | ... | ... | ... |
| June 4 | 241 | 155 | 82 | 48 | 16 | 3.00 | 0.63 | 30 | 3 | 1 | ... | ... | ... |
| June 5 | 252 | 162 | 86 | 50 | 17 | 2.99 | 0.60 | 30 | 3 | 1 | ... | ... | ... |
| June 6 | 241 | 155 | 82 | 48 | 16 | 3.00 | 0.56 | 27 | 3 | 1 | ... | ... | ... |
| June 7 | 241 | 155 | 82 | 48 | 16 | 2.99 | 0.53 | 22 | 2 | 1 | ... | ... | ... |
| June 8 | 241 | 155 | 82 | 48 | 16 | 3.00 | 0.49 | 20 | 1 | 1 | ... | ... | ... |
| June 9 | 241 | 155 | 82 | 48 | 16 | 2.99 | 0.46 | 20 | 1 | 1 | ... | ... | ... |
| June 10 | 241 | 155 | 82 | 48 | 16 | 3.00 | 0.44 | 17 | 1 | 1 | ... | ... | ... |
| June 11 | 331 | 212 | 112 | 66 | 22 | 2.98 | 0.42 | 12 | 1 | 1 | ... | ... | ... |
| June 12 | 318 | 204 | 108 | 64 | 22 | 2.98 | 0.42 | 11 | 1 | 1 | ... | ... | ... |
| June 13 | 265 | 170 | 90 | 53 | 18 | 3.00 | 0.40 | 36 | 3 | 1 | ... | ... | ... |
| June 14 | 252 | 162 | 86 | 50 | 17 | 2.99 | 0.40 | 39 | 5 | 1 | ... | ... | ... |
| June 15 | 241 | 155 | 82 | 48 | 16 | 2.99 | 0.39 | 25 | 3 | 1 | ... | ... | ... |
| June 16 | 241 | 155 | 82 | 48 | 16 | 2.99 | 0.40 | 34 | 3 | 1 | ... | ... | ... |
| June 17 | 252 | 162 | 86 | 50 | 17 | 2.99 | 0.41 | 64 | 11 | 1 | ... | ... | ... |
| June 18 | 241 | 155 | 82 | 48 | 16 | 2.99 | 0.42 | 57 | 11 | 1 | ... | ... | ... |
| June 19 | 241 | 155 | 82 | 48 | 16 | 2.99 | 0.42 | 46 | 8 | 1 | ... | ... | ... |
| June 20 | 241 | 155 | 82 | 48 | 16 | 2.99 | 0.42 | 40 | 5 | 1 | ... | ... | ... |
| June 21 | 241 | 155 | 82 | 48 | 16 | 3.00 | 0.43 | 28 | 4 | 1 | ... | ... | ... |
| June 22 | 241 | 155 | 82 | 48 | 16 | 2.99 | 0.43 | 25 | 3 | 1 | ... | ... | ... |
| June 23 | 241 | 155 | 82 | 48 | 16 | 2.99 | 0.43 | 25 | 3 | 1 | ... | ... | ... |
| June 24 | 241 | 155 | 82 | 48 | 16 | 2.99 | 0.43 | 29 | 4 | 1 | ... | ... | ... |
| June 25 | 241 | 155 | 82 | 48 | 16 | 2.99 | 0.43 | 18 | 2 | 1 | ... | ... | ... |
| June 26 | 241 | 155 | 82 | 48 | 16 | 2.80 | 0.42 | 15 | 1 | 1 | ... | ... | ... |
| June 27 | 241 | 155 | 82 | 48 | 16 | 2.99 | 0.44 | 12 | 1 | 1 | ... | ... | ... |
| June 28 | 241 | 155 | 82 | 48 | 16 | 2.99 | 0.44 | 9 | 1 | 1 | ... | ... | ... |
| June 29 | 241 | 155 | 82 | 48 | 16 | 2.99 | 0.44 | 8 | 1 | 1 | ... | ... | ... |
| June 30 | 241 | 155 | 82 | 48 | 16 | 2.99 | 0.44 | 10 | 1 | 1 | ... | ... | ... |
| July 1 | 241 | 155 | 82 | 48 | 16 | 3.00 | 0.45 | 8 | 1 | 1 | 80 | 10 | 4 |
| July 2 | 241 | 155 | 82 | 48 | 16 | 3.00 | 0.46 | 8 | 1 | 0 | 290 | 24 | 5 |
| July 3 | 241 | 155 | 82 | 48 | 16 | 3.00 | 0.47 | 8 | 1 | 0 | 350 | 45 | 6 |
| July 4 | 241 | 155 | 82 | 48 | 16 | 2.99 | 0.49 | 9 | 1 | 0 | ... | ... | ... |
| July 5 | 305 | 195 | 103 | 61 | 21 | 3.00 | 0.51 | 10 | 1 | 0 | ... | ... | ... |
| July 6 | 241 | 155 | 82 | 48 | 16 | 3.00 | 0.51 | 9 | 1 | 0 | 300 | 36 | 7 |
| July 7 | 241 | 155 | 82 | 48 | 16 | 2.99 | 0.53 | 8 | 1 | 0 | 110 | 10 | 3 |
| July 8 | 252 | 162 | 86 | 50 | 17 | 3.00 | 0.53 | 9 | 1 | 0 | 85 | 22 | 2 |
| July 9 | 241 | 155 | 82 | 48 | 16 | 3.00 | 0.54 | 8 | 1 | 0 | 85 | 26 | 2 |
| July 10 | ... | ... | ... | ... | ... | ... | ... | ... | ... | ... | 200 | 3 | 5 |
| July 11 | 305 | 195 | 103 | 61 | 21 | 3.00 | 0.56 | 12 | 1 | 0 | 145 | 7 | 3 |
| July 12 | 241 | 155 | 82 | 48 | 16 | 2.99 | 0.58 | 11 | 1 | 0 | ... | ... | ... |
| July 13 | 241 | 155 | 82 | 48 | 16 | 3.00 | 0.60 | 10 | 1 | 0 | 115 | 34 | 55 |
| July 14 | 241 | 155 | 82 | 48 | 16 | 2.99 | 0.62 | 16 | 1 | 0 | 300 | 55 | 30 |
| July 15 | 241 | 155 | 82 | 48 | 16 | 2.99 | 0.64 | 17 | 1 | 0 | 180 | 32 | 23 |
| July 16 | 241 | 155 | 82 | 48 | 16 | 3.00 | 0.67 | 13 | 1 | 0 | 100 | 115 | 3 |
| July 17 | 241 | 155 | 82 | 48 | 16 | 2.99 | 0.71 | 10 | 1 | 0 | 65 | 275 | 5 |
| July 18 | 241 | 155 | 82 | 48 | 16 | 2.99 | 0.73 | 11 | 1 | 0 | 38 | 425 | 10 |
| July 19 | 241 | 155 | 82 | 48 | 16 | 3.00 | 0.76 | 12 | 1 | 0 | ... | ... | ... |
| July 20 | 241 | 155 | 82 | 48 | 16 | 2.99 | 0.79 | 10 | 1 | 0 | 95 | 90 | 70 |
| July 21 | 252 | 162 | 86 | 50 | 17 | 2.99 | 0.83 | 10 | 1 | 1 | 70 | 17 | 4 |
| July 22 | 241 | 155 | 82 | 48 | 16 | 2.99 | 0.87 | 13 | 1 | 1 | 440 | 8 | 5 |
| July 23 | 305 | 195 | 103 | 61 | 21 | 2.99 | 0.92 | 54 | 4 | 1 | 650 | 26 | 5 |
| July 24 | 331 | 212 | 111 | 66 | 22 | 2.98 | 0.99 | 305 | 61 | 1 | 1,650 | ... | ... |
| July 25 | 265 | 170 | 90 | 53 | 18 | 2.98 | 1.08 | 330 | 85 | 1 | 2,600 | 115 | 15 |
| July 26 | 252 | 162 | 86 | 50 | 17 | 2.98 | 1.21 | 290 | 77 | 2 | ... | ... | ... |
| July 27 | 305 | 195 | 103 | 61 | 21 | 2.98 | 1.40 | 335 | 87 | 2 | 35,000 | 250 | ... |
| July 28 | 252 | 162 | 86 | 50 | 17 | 2.98 | 1.68 | 170 | 52 | 2 | 1,200 | 1,350 | 15 |
| July 29 | 252 | 162 | 86 | 50 | 17 | 2.97 | 2.14 | 180 | 52 | 2 | 2,000 | 600 | 13 |
| July 30 | 252 | 162 | 86 | 50 | 17 | 2.97 | 2.65 | 237 | 56 | 2 | 800 | 1,300 | 12 |
| July 31 | 241 | 155 | 82 | 48 | 16 | 2.95 | 3.01 | 250 | 60 | 2 | 1,000 | 310 | 7 |
Allen Hazen, M. Am. Soc. C. E. (by letter).—This paper contains a most interesting and instructive record of the actual operation of a large filter plant, and also a record of a number of experiments. The author has described some useful arrangements for improving the efficiency or reducing the cost.
The utility of raking, as an intermediate treatment between scrapings, seems to have been clearly demonstrated. Its practical effect is to allow a greater quantity of water to be passed between scrapings, thereby saturating—if the term may be used—the surface layer with clay and other fine matter before removing it, instead of taking it off when only a thin surface layer of it has been thus saturated.
The large proportion of the total purification that takes place in passing through three reservoirs successively, holding in the aggregate a quantity of water equal to about 7 days' use, is very striking. Taking all the records, the percentage remaining after passing through these reservoirs, is as follows:
| Sediment for the year, 1909-1910, Table 2 | 17% |
| Turbidities, 5-year average, Table 3 | 25% |
| Bacteria, 5-year average, Table 4 | 24% |
| Bacteria, selected winter months with high numbers in the raw water | 20% |
| Bacteria, selected summer months with high numbers in the raw water | 2.5% |
There is considerable seasonal fluctuation in the results of settling and filtering, as is shown in Table 21.
The fluctuation in the efficiency of the plant as a whole by seasons is greater with the turbidity than with the bacteria. During the winter the effluent contains 3% of the turbidity of the raw water, and in summer only 0.3 per cent. Most of this difference is represented by the increased efficiency of the filters in summer, and only a little of it by the increased efficiency of settling. With bacteria, on the other hand, the seasonal fluctuation of the plant as a whole is comparatively small, but the settling and storage processes are much more efficient in summer than in winter, the filters being apparently less efficient. The writer believes that they are only apparently less efficient, and not really so, the explanation being that some bacteria always grow in the under‑drains and lower parts of the filter, and are washed away by the effluent. The average number of bacteria in summer in the settled water is 160 per cu. cm. and in the filtered water 18. These are very low numbers. It is the writer's view that nearly all of these 18 represent under‑drain bacteria, and practically bear no relation to those in the applied water, and, if this view is correct, the number of bacteria actually passing through the various processes is at all times less than the figures indicate. In the warmer part of the year the difference is a wide one, and the hygienic efficiency of the process is much greater than is indicated by the gross numbers of bacteria.
The reduction of the typhoid death rate has not been as great with the change in water supply as was the case at Lawrence, Albany, and other cities, apparently because the Potomac water before it was filtered was not the cause of a large part of the typhoid fever.
The sewage pollution of the Potomac is much less than that of the Merrimac and the Hudson, and it is perhaps not surprising that this relatively small amount of pollution was less potent in causing typhoid fever than the greater pollution of rivers draining more densely populated areas.
The method of replacing the washed sand hydraulically seems to have worked better than could have been reasonably anticipated, and the writer believes that this was due, in part, to the excellent method of manipulation described in the paper. It is his feeling, however, that part of the success is attributable to the very low uniformity coefficient of the sand. In other words, the sand grains are nearly all of the same size, due to the character of the stock from which the filter sand was prepared; and, therefore, there is much less opportunity for separation of the sand according to grain sizes than there would be with the filter sand which has been available in most other cases. Filter sand with a uniformity coefficient as low as that obtained at Washington has been rarely available for the construction of sand filters, and while the method of hydraulic return should certainly be considered, it will not be safe to assume that equally favorable results may be obtained with it with sands of high uniformity coefficients until actual favorable experience is obtained.
The writer believes that in calculating the cost of the water used in the plant itself the price chosen by the author, covering only the actual operating expenses of pumping and filtering, is too low. The capacity of the whole Washington Aqueduct system is reduced by whatever quantity is used in this way, and, in calculating the cost of sand handling, the value of the water used should be calculated on a basis which will cover the whole cost of the water, including all capital charges, depreciation, operating expenses, and all costs of every description. On this basis the water used in the sand‑handling operations would probably be worth five or more times the sum mentioned by the author.
The cost of operation of the plant has come within the estimates made in advance, and has certainly been most reasonable. The cost of filter operations has averaged only about 50 cents per million gallons, and is so low that it is obvious that the savings which may be made by introducing further labor‑saving appliances would be relatively small. It will be remembered that ten or fifteen years ago the cost of operating such filters under American conditions was commonly from $2 to $5 per million gallons.
The experiments represented by Tables 17 to 19, inclusive, serve to show that preliminary filtration, or multiple filtration, or any system of mechanical separation is incapable of entirely removing the finer clay particles which cause the residual turbidity in the effluent. They also show that this turbidity may be easily and certainly removed by the application of coagulant to the raw water during the occasional periods when its character is such as to require it.
These general propositions were understood by those responsible for the original design of the plant, as is shown by the author's quotations. These experiments, however, were necessary in order to demonstrate and bring home the conditions to those who thought differently, and who believed that full purification could be obtained by filtration alone, or by double filtration, without recourse to the occasional use of coagulant.
The experiments briefly summarized in Table 20 are of the greatest interest and importance. Six small filters, otherwise alike and like the large filters, all received the same raw water and were operated at different rates to determine the effect of rate on efficiency.
That the experimental results from the filter operating at the same rate as the large filters were on the whole somewhat inferior to those from the large filters for approximately the same period, may be attributed to the fact that the experimental filter was new while the large filters had been in service for some time and had thereby gained in efficiency. The greatest difference was in the coli results in Table 20, where it is shown that 24% of the 10‑cu. cm. effluent samples from the experimental filter contained coli, in comparison with only from 1 to 3% of such samples from the main filters.
The results from the experimental filter operating at a rate of 1,000,000 gal. per acre daily may fairly be excluded, as the effluent probably contained more under‑drain bacteria in proportion than filters operated at higher rates. The number of bacteria in the filter operating at a 3,000,000‑gal. rate were 1.7% of those in the applied water; for the filter operating twice as fast, the percentage was 2.4; and, for the one operating more than ten times as fast, was only 3.0; thus indicating a surprisingly small increase in the number of bacteria with increase in rate.
Further and more detailed study by the writer of the unpublished individual results, briefly summarized in Table 20, confirms the substantial accuracy of the comparison based on the average figures as stated in that table.
It must be kept in mind, in considering these results, that the number of bacteria in each case is made up of two parts, namely, those coming through the filter—which number is presumably greater as the rate is greater—and, second, those coming from harmless growths in the under‑drains and lower parts of the filter—the numbers of which per cubic centimeter are presumably less as the rate is greater—and these two parts, varying in opposite directions, may balance each other, as they seem to do in this case, through a considerable range. It may thus be that the number of bacteria really passing the filter varies much more with the rate than is indicated by the gross results.
It is also of interest to note that the sand filter (called a preliminary filter) in Table 18, filled with the same kind of sand, when operated at an average rate of 50,000,000 gal. per acre daily for a year, allowed 18% of the applied bacteria to pass, in comparison with 3% found in Filter No. 6 of Table 20, operated at an average rate of 38,000,000 gal. per acre daily.
There was one point of difference in the manipulation: the preliminary filter was washed by a reversed current of water, as mechanical filters are washed, while Filter No. 6 was cleaned by scraping off the surface layer, as is usual with sand filters. Whether the great difference in bacterial results with a relatively small difference in rate is to be attributed to this difference in manipulation the writer will not undertake to state.
If the experimental results of Table 20 indicate correctly the conditions which obtain in filtering Potomac water, then increasing the rate of filtration so as to double it, or more than double it, would make but little difference in the quality of the effluent as measured by the usual bacterial methods. If the increase in rate were accompanied by the preliminary filtration of the water, then, presumably, there would be little change in the quality of the effluent, and the maintenance of excellent results might be incorrectly attributed to the influence of the preliminary filter.
It would also seem that the apparatus which is sometimes used for determining and controlling the rate with more than the ordinary degree of precision is hardly justified by such experimental results as those presented by the author.
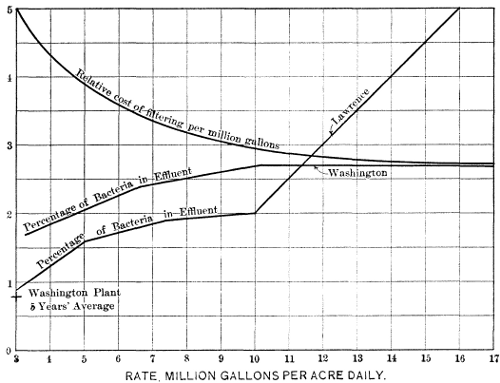
In contrast to these results may be mentioned those obtained by Mr. H. W. Clark,1 for experimental filters operated with Merrimac River water, at rates ranging from 3,000,000 to 16,000,000 gal. per acre daily. The results are the average of nearly two years of experimental work, the period having been nearly coincident with that covered by the author's experiments, and of many hundreds of bacterial analyses of each effluent, and form, with the author's experiments, the most thorough‑going studies of the effect of rate on efficiency that have come to the writer's attention.
Mr. Clark's results are given in Table 22.
It will be seen that the number of bacteria passing increases rapidly with the rate, and whether the total number of bacteria is considered or the B. coli results, the number passing is approximately in proportion to the rate. In other words, doubling the rate substantially doubles the number of bacteria in the effluent.
This is entirely in harmony with all the Lawrence experimental results extending over a period of 20 years. There have been occasional apparent exceptions, but, on the whole, experience with Merrimac River water has uniformly been that more bacteria pass as the rates are higher.
The theory sometimes advanced, that the efficiency of filtration is controlled to a certain extent by gelatinous films, and that, as far as thus controlled, is less dependent on rate, would not seem to be borne out by these results. The Merrimac River water, carrying large amounts of organic matter, would certainly seem better adapted to the formation of such films than the clay‑bearing Potomac water, comparatively free from organic matter; but it is the Potomac water which seems to show the least influence of rate on efficiency.
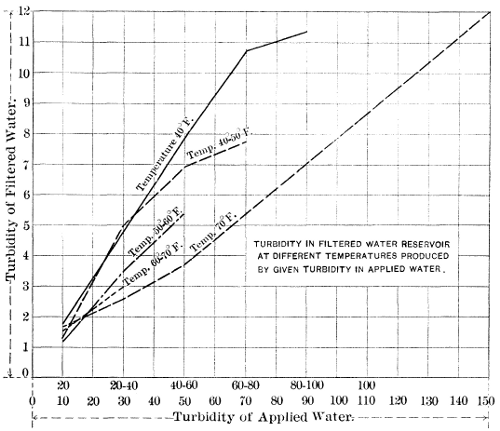
The experiments show that turbidity passes more freely at the higher rates with the Potomac water, as has also been found to be the case with other clay‑bearing waters.
In the last lines of Table 20 are given cost per million gallons for filtering at various rates. There is no discussion of these figures, and as they differ considerably from those which the writer has been accustomed to use, the calculation in Table 23, made three years ago for a particular case, may be of interest.
When the costs of pumping, pure‑water reservoirs usually necessary, etc., are taken into account (which add equally to the cost at all rates), the cost of filtering will vary less with the rate than is indicated.
The effect of rate on cost, as calculated in Table 23, and also the percentages of the bacteria of the raw water found in the effluents by the author and by Mr. Clark, are shown on Figure 10.
Considering all these results together, and also all the other evidence known to the writer bearing on this point, it seems clear that filters are not as sensitive to changes in rate, within reasonable limits, as has been frequently assumed; but, on the other hand, there is usually a substantial increase in the percentage of bacteria passing through a filter with increased rate.
Filters furnish relative, not absolute, protection against infectious matter in the raw water. The higher the bacterial efficiency, the more complete is this relative protection.
The cost of filtering does not decrease in inverse ratio to the rate, but at a much slower rate. This is especially true with rates of more than 5,000,000 or 6,000,000 gal. per acre daily.
In general, a rate of filtration may rationally be selected at which the value of the possible danger resulting from an increase in rate is equal to the saving that may be made in cost by its use. This point must be a matter of individual judgment. The tendency of the last few years has been to use higher rates, or, in other words, to cheapen the process and to tolerate a larger proportion of bacteria in the effluent. The use of auxiliary processes has been favorable to this, especially the use of chloride of lime, in connection with either the raw water or the effluent.
By the judicious use of this substance, efficiency may be maintained while using higher rates than would otherwise have been desirable.
The writer believes that there will be many cases where the added risk of using too high a rate is not worth the relatively small saving in cost that accompanies it.
George A. Johnson, Assoc. M. Am. Soc. C. E.—This paper contains information of an exceedingly interesting nature. There is comparatively little difficulty in obtaining accurate figures on the cost of construction of water purification works, but, with costs of operation of such works, it is different. The data available in published reports and papers are usually more or less fragmentary, and unexplained local conditions with reference to the character of the raw water, the cost of labor and supplies, and methods of apportioning these costs, introduce variables so wide as frequently to render the published figures almost useless for purposes of comparison.
Mr. Hardy's paper is noteworthy in that it presents certain relatively new features of slow sand filter operation which have been only lightly touched on in water purification literature up to the present time. These refer particularly to means whereby a filter may be continued in service without removing a portion of the surface layer of the filter surface itself when the available head has become exhausted, and to methods whereby washed sand may be expeditiously and more economically restored to the filter than has been the case hitherto.
Sand handling is the most important item of expense in the operation of a slow sand filter. Quite recently a charge of $1.50 per cu. yd. for sand scraping, transportation to sand washers, washing, and restoring to the filter, was not considered exorbitant, but the improved methods developed during recent years at Washington, Philadelphia, Albany, and more recently at Pittsburg (at all of which places hydraulic ejection plays an important part), have shown the feasibility of reducing this figure by nearly, if not quite, two‑thirds.
The practice observed at Washington of raking over the surface of the sand layer when the available head becomes exhausted, in order to avoid the cost and loss of time necessitated by shutting down the filter and scraping off the surface layer, is unquestionably one of the most striking advances in slow sand filter operation in recent years. In rapid sand filter operation, to prolong the period of service between washings, agitation of the filter surface has been used to advantage for many years. The full value of surface raking may not be generally appreciated, but the results which have followed a trial of this procedure at Washington, Philadelphia, and Pittsburg have shown that the output of filtered water between scrapings may be doubled or trebled thereby, with no injury to the filter itself or to the quality of the filtered water. The cost of raking over the surface of a 1‑acre slow sand filter unit is less than $10 at all the above‑mentioned places, which fact in itself shows the great saving in money and time effected by periodically substituting surface raking for scraping. Under ordinary conditions it has been found that a filter can be raked to advantage at least twice between scrapings.
In the case of filters thus raked, a deeper penetration of suspended matter into the sand layer is inevitable, but at Pittsburg, as at Washington, such penetration does not extend more than about 2 in. below the filter surface. When the filter is finally scraped, a deeper layer is removed, of course, but it is clearly more economical to remove a deep layer at one operation than to remove separately several thinner layers of an equal total thickness.
The lost‑time element is an important one, and at Washington this was the main reason for trying surface raking. It became necessary to increase the output of the filters, and the ordinary scraping consumed so much time that the sand‑handling force was increased, working day and night. The raking expedient introduced at this time overcame this, and Mr. Hardy states that it is still followed when the work is at all pressing. The speaker has found at Pittsburg, as Mr. Hardy has found at Washington, that raking is nearly if not quite as effective as scraping in restoring the filter capacity.
Eleven years ago the speaker was connected with the preliminary investigations into the best methods of purifying the Potomac River water for Washington. It then appeared that while for the greater part of the time during an average year the Potomac River could be classed among the clear waters of the East, there were periods when excessive turbidity made it necessary to consider carefully methods of preparatory treatment before this water could be filtered effectively and economically. As Mr. Hardy has said, considerable prejudice existed against the use of a coagulating chemical, and the expedient was therefore adopted of giving the water a long period of sedimentation in order to remove enough of the suspended matter to allow the clarified water to be treated on slow sand filters. The expert commission, consisting of Messrs. Hering, Fuller, and Hazen, recommended the occasional use of a coagulating chemical, but this recommendation was not carried out.
The Potomac River is somewhat peculiar, in that the turbidity of its waters, as shown by the results presented in Mr. Hardy's paper, ranges from 3,000 to practically nothing. The bacterial content also varies widely, and Mr. Hardy's tables show this variation to be from 76,000 to 325 per cu. cm. Such a water as this requires particularly careful preparatory treatment. The Dalecarlia Reservoir has a capacity of something like 2 days' storage, the Georgetown Reservoir the same, and the McMillan Park Reservoir nearly 3 days, making a total sedimentation of more than 7 days. Without the use of a coagulant, it is significant that during a period of five years, even with 7 days' sedimentation, the average maximum turbidity of the water delivered to the filters was 106 parts per million, and the maximum average turbidity in one month was 250 parts per million. The water filtration engineer can readily understand that waters as turbid as this cannot be treated economically and efficiently in slow sand filters. It would appear that coagulating works might advantageously have been installed at the entrance to the Dalecarlia Reservoir. If this had been done, and coagulant had been added to the water at times when it was excessively turbid, a considerably shorter period of subsequent sedimentation than now exists would in all probability have rendered the water at all times amenable to efficient and economical slow sand filter treatment.
The prejudice in Washington against the use of coagulants has also manifested itself in other localities, but the results which have been obtained during the past twenty years from rapid sand filters and from slow sand filters, treating waters previously coagulated with salts of iron or alumina, have shown how thoroughly unreasonable were these objections. In this connection it is interesting to note that there are in the United States more than 350 rapid sand filter plants, and that nearly 12% of the urban population of Continental United States is being supplied with water filtered through rapid sand filters, in connection with all of which a coagulating chemical is used in the preparatory treatment.
| City. | Typhoid Fever Death Rate per 100,000 Population. | |||||||
|---|---|---|---|---|---|---|---|---|
| 1906 | 1907 | 1908 | 1909 | 1910 | Average for six years, 1900-05, inclusive. | Average for five years, 1906-10, inclusive. | Average for 11 years, 1900-11, inclusive. | |
| Albany, N. Y. | 20 | 20 | 11 | 19 | 15 | 25 | 17 | 21 |
| Atlanta, Ga. | 50 | 64 | 47 | 44 | 43 | 65 | 50 | 58 |
| Baltimore, Md. | 34 | 41 | 31 | 23 | 41 | 36 | 34 | 35 |
| Boston, Mass. | 22 | 10 | 26 | 14 | 11 | 23 | 16 | 20 |
| Bridgeport, Conn. | 10 | 13 | 13 | 13 | 9 | 15 | 12 | 14 |
| Buffalo, N. Y. | 24 | 29 | 21 | 23 | 20 | 29 | 23 | 26 |
| Cambridge, Mass. | 18 | 10 | 10 | 9 | 12 | 18 | 12 | 15 |
| Chicago, Ill. | 18 | 18 | 15 | 12 | 14 | 27 | 16 | 22 |
| Cincinnati, Ohio | 71 | 46 | 19 | 13 | 6 | 54 | 31 | 44 |
| Cleveland, Ohio | 20 | 19 | 13 | 12 | 19 | 51 | 17 | 36 |
| Columbus, Ohio | 45 | 38 | 110 | 17 | 13 | 61 | 45 | 54 |
| Denver, Colo. | 68 | 67 | 58 | 24 | 30 | 37 | 49 | 42 |
| Detroit, Mich. | 22 | 28 | 22 | 19 | 16 | 17 | 22 | 19 |
| Grand Rapids, Mich. | 39 | 30 | 30 | 17 | 27 | 34 | 28 | 31 |
| Indianapolis, Ind. | 39 | 29 | 26 | 22 | 31 | 76 | 30 | 55 |
| Jersey City, N. J. | 20 | 14 | 10 | 8 | 10 | 19 | 12 | 16 |
| Kansas City, Mo. | 38 | 40 | 35 | 23 | 38 | 48 | 35 | 42 |
| Los Angeles, Cal. | 18 | 23 | 19 | 18 | 12 | 35 | 18 | 27 |
| Lowell, Mass. | 7 | 9 | 24 | 11 | 21 | 19 | 14 | 17 |
| Milwaukee, Wis. | 31 | 26 | 17 | 21 | 45 | 19 | 28 | 23 |
| Minneapolis, Minn. | 33 | 26 | 18 | 20 | 58 | 38 | 29 | 34 |
| Nashville, Tenn. | 66 | 85 | 62 | 53 | 48 | 54 | 58 | 56 |
| Newark, N. J. | 18 | 24 | 12 | 11 | 13 | 17 | 16 | 17 |
| New Haven, Conn. | 54 | 30 | 34 | 20 | 17 | 44 | 31 | 38 |
| New York, N. Y. | 15 | 17 | 12 | 12 | 12 | 19 | 14 | 17 |
| New Orleans, La. | 30 | 56 | 31 | 25 | 28 | 40 | 34 | 37 |
| Omaha, Nebr. | 28 | 24 | 22 | 31 | 75 | 20 | 36 | 27 |
| Paterson, N. J. | 4 | 11 | 10 | 5 | 7 | 25 | 7 | 17 |
| Philadelphia, Pa. | 74 | 60 | 36 | 22 | 17 | 47 | 42 | 45 |
| Pittsburg, Pa. | 141 | 135 | 531 | 131 | 121 | 132 | 71 | 104 |
| Richmond, Va. | 44 | 41 | 50 | 24 | 22 | 66 | 36 | 53 |
| Rochester, N. Y. | 17 | 16 | 12 | 9 | 13 | 15 | 13 | 14 |
| St Louis, Mo. | 18 | 16 | 15 | 15 | 14 | 33 | 16 | 25 |
| St Paul, Minn. | 21 | 17 | 12 | 20 | 20 | 14 | 18 | 16 |
| San Francisco, Cal. | ... | 57 | 27 | 17 | 15 | 20 | 29 | 24 |
| Scranton, Pa. | 11 | 76 | 11 | 11 | 14 | 18 | 35 | 26 |
| Syracuse, N. Y. | 10 | 16 | 15 | 12 | 30 | 14 | 17 | 15 |
| Toledo, Ohio | 45 | 36 | 40 | 31 | 32 | 36 | 37 | 36 |
| Worcester, Mass. | 12 | 14 | 10 | 8 | 16 | 17 | 12 | 15 |
| Washington, D. C. | 52 | 36 | 39 | 33 | 23 | 59 | 37 | 49 |
Attention has repeatedly been called to the fact that the relatively high typhoid death rate in Washington, since the filter plant was installed, was a possible indication that the filters were inefficient. It is true that there has not been the marked reduction in the typhoid death rate in Washington, following the installation of the water filtration works, that has been observed in other cities in America. For the six years prior to the date on which filtered water was supplied to the citizens of Washington, the average typhoid fever death rate was 59 per 100,000 population, as against 37 per 100,000 for the five years following, a reduction of 37 per cent. At Albany, N. Y., where the first modern slow sand filter was built in 1899, the typhoid death rate has been reduced by 75 per cent. At Cincinnati, Ohio, the average death rate from typhoid ranged around 50 per 100,000 for years, but since the installation of the filtration plant it has been reduced to a point which places that city, with respect to freedom from typhoid fever, at the head of all the large cities in America; in 1910 the death rate from typhoid in Cincinnati was 6 per 100,000. Similarly, at Columbus, Ohio, where the typhoid death rate before the installation of the filtration plant in 1906 was even higher than at Cincinnati, it was reduced to less than 13 per 100,000 in 1910, whereas, for the previous five years, it was 61 per 100,000. Philadelphia, before the installation of the filtration works, had a typhoid death rate of 60 or more per 100,000, and in 1910 the death rate from this disease was 17. Pittsburg, at least that part of it now supplied with filtered water, for years had a typhoid death rate of more than 130 per 100,000, but the present rate is about 12 per 100,000.
While it may perhaps seem unreasonable to single out Washington as a particular sufferer in this respect, it is highly probable that a large share of the typhoid is still caused by secondary infection, flies, impure milk, and private and public wells. The speaker remembers distinctly that ten years ago, when he made an investigation into the purity of the water of about 100 public wells in that city, a large number of them showed unmistakable evidence of being polluted with sewagic matter. Conclusive evidence would be secured to dispel any doubt as to the sanitary quality of the filtered product if hypochlorite of lime were added to the filtered water throughout one year or throughout the typhoid months. It seems strange to the speaker, that for this, if for no other reason, this safe and non‑injurious germicide has not as yet been used at Washington, in view of the fact that at the present time it is being used continuously or intermittently in the treatment of the water supplies of scores of the most important cities of this country, among which may be mentioned New York, Philadelphia, Cincinnati, Pittsburg, St. Louis, and Minneapolis.
Morris Knowles, M. Am. Soc. C. E. (by letter).—This description of the operation of the Washington Filtration Works is timely and of great interest. It is ten years since the writer, in collaboration with Charles Gilman Hyde, M. Am. Soc. C. E., presented a similar record for the Lawrence, Mass., filter. That paper was the first complete, detailed, and continuous history of the actions and results obtained for a long period of time with such a purification works. 1 Since then, the art of filtration has advanced in many ways, particularly in regard to the methods of cleaning slow sand filters and in the accompanying processes. It is well, therefore, again to take account of stock and see really what progress has been made. Therefore, Mr. Hardy's paper, giving a description of the operations of a system thoughtfully designed, after long consideration of the problem, and of operations carried on under efficient and economical administration, with thorough record of all details, should furnish a groundwork for the careful consideration of the question stated above.
The writer, using as a text some of the ideas given in the paper, but more particularly some of those becoming prevalent elsewhere, desires to discuss methods and costs of operation, especially in relation to sand handling; and to offer suggestions looking toward greater efficiency, as well as economy, in carrying out the standard and well‑tried methods.
Theory of Slow Sand Filtration.—First, what is the process of slow sand filtration? The answer to this question involves many factors, some of which are even yet but imperfectly understood. In the early history of filtration, at the time of the construction of the London filters, only the straining capacity of the sand bed, to remove gross particles, was known. Later, when the organic contents of water had become better understood, the chemical or oxidizing powers of the process were recognized as performing an important part. Finally, co‑existent with the discovery of the so‑called "germ theory of disease," a study of the bacterial action of filters resulted in the recognition of its importance. It is now universally thought that each of these factors performs its useful function; that the size of the sand, the amount of organic matter remaining on the surface of the bed, the turbidity of the applied water, and the bacterial content of the influent, are some of the things on which depends the determination of the relative importance of each.
Engineers have been taught to believe, by the German school of thought, that the film of organic matter on the surface of the sand plays a very important role in filtration. This Schmutzdecke, as it is called, has been considered so precious that stress has been placed on treating it with great care. It was not to be wholly removed at the time of cleaning, and it was not to be walked on, or indented, or in any other way consolidated or destroyed. In fact, in some cases, the wasting of the first water after cleaning has been advocated, for the reason that not a sufficient amount of this organic film would be left on top of the sand to begin the filtration process properly immediately after the cleaning.
In late years, however, there has been a tendency to depart from this fundamental doctrine of slow sand filtration. Various new processes for cleaning the sand surface have been advocated; some of these partly destroy and others completely exterminate any semblance of a bacterial film on the sand bed. These ideas, advanced without any real and serious discussion of their intrinsic merits, or their effects on the public health, are not founded on long continuous records of such results as are necessary to establish confidence in the final value of any of these methods.
Rapid advances along this line have been made more recently, notwithstanding the occurrence of notable instances of trouble and the resultant need of complete repair of filtration beds. Because of the rough treatment of the sand surface, a penetration of organic matter and filth into the bed had taken place. This caused deep clogging, prevented the usual yield of water, and brought about a lessened bacterial efficiency, due to the attempt to force water through the filters, and because some organic matter and growths in the lower part of the bed had furnished a breeding place for more bacteria.
All these endeavors to reduce the work of cleaning have been commendable, because scraping and sand handling are the items of greatest expense in slow sand filter maintenance. Every one has been desirous of minimizing this cost. However, as the writer will endeavor to show, it seems that attempts along this line should be with the idea of doing more economically, as well as efficiently, the things which one knows will accomplish the proper results, rather than unwisely to adopt new methods which have not been tried for a long enough period to determine their effect on the public health.
Pittsburg Methods.—When first taking up the problem of design in Pittsburg, in 1902, the writer had presented to him for consideration and adoption, a suggestion that a certain method of cleaning sand filters, which would involve the washing of the sand in place (similar to that recently tried at the Jerome Park Experiment Station, New York City), would be advisable and economical. The decision then made has never been regretted. As this plan involved such a complete departure from those principles which had been well tried and had proven successful, it was believed that it was not safe to adopt such a method on the municipal filtration works, from which the people were to derive their drinking water. There is more to be considered in such a problem than mere economy of operation; the economy of human life, the effect on which requires far longer than a few months of trial to determine, is a much more important factor. Believing that no one should depart, until after a long period of conclusive experimentation, from that principle which is known to be safe (viz., to take off a small portion of the clogging surface), the writer studied to determine more efficient and economical methods of accomplishing this end.
A device for scraping the material, in just the same way as with shovels, but more efficiently and more exactly, was developed by George P. Baldwin, M. Am. Soc. C. E., under the general supervision of the Bureau of Filtration, of which the writer was in charge. However, on account of the unfortunate and earlier arrangement of other constructive matters, which the City's Legal Department advised could not be changed without upsetting the contract, the entrance doors to the original forty‑six filters were not built large enough to permit the rapid and economical transfer of these machines, and, as this act takes so large a proportion of the total time of operation, it has not been found economical to use them. The additional ten filters, recently constructed, with doors especially designed and large enough to pass the machines, have not yet been placed in operation. This is said to be on account of lack of funds and of employees. Therefore, there has been no opportunity to demonstrate what the scraping machines can do, under the conditions for which they were designed to operate. The restoring machine, a complementary device in mechanical operation, which simply replaces the sand in the same condition that it would be if wheeled back, but, with a small percentage of moisture, has accomplished its purpose well and economically. The sand is placed in the filters so that there is no further settling; with a smooth surface, needing no additional adjustment; with absolutely no possibility of sub‑surface clogging; and with the filters starting off exceedingly well in operative results.
Washington Methods.—In Washington, it is stated that the filters are still cleaned by the old‑fashioned method of scraping with shovels, throwing the sand into piles, and afterward removing it with a movable ejector. Between scrapings there is also an occasional mid‑period action of raking the unwatered sand surface, for the purpose of stirring up the dirty film. This process does not remove any of the clogging material from the bed, but it is said that no injurious effects are produced, and that it is economical. It is stated that the so‑called "Brooklyn method," of stirring the surface of the sand while the water is on the bed, has been tried at Washington, but with unsatisfactory results. It seems to have been advocated with greater fervor in some other places.
The method of dry raking does not remove the dirty material, but loosens up the pores of the surface, and through this porosity permits clogging to penetrate deeper into the filter. The method of raking with water on the bed, although it removes some of the organic dirt, also permits deeper penetration of the remainder. The latest devised system of washing the sand in place, by upward spraying with water, called the "Blaisdell method," thoroughly destroys the Schmutzdecke above, and, at the same time, must permit the formation of a subsidiary one below. In the Nichols method, the material removed by shovel scraping is conveyed by an ejector to a portable separator, where it receives a single washing; the dirty water overflows to the sewer, while the washed sand is discharged through a hose and deposited on the recently scraped surface. As the latter is partly impregnated with impurities, there is, by this process, a tendency toward sub‑surface clogging.
All these processes are marked and serious departures from the well‑tried method of cleaning slow sand filters, which, it is well known, will operate successfully to purify polluted river waters and make them safe to drink. In all there is the danger that they have not been sufficiently and carefully tried, under scientific observation, as to results and possible effects on the public health, to be sure that the bacterial efficiency can long continue to be satisfactory, with the application of specifically infected waters. It is dangerous, and may even jeopardize the safety of human lives, to experiment on water which is furnished for drinking purposes. There is also the added danger, well known from past experience, that in a few years (it may be more or less, depending on the extent and intensity of the new workings) the filters will need renovation, partly, if not wholly, throughout the entire bed. Thus, considering the total cost during a long term of years, the apparently cheaper method may become the most expensive.
There is also an interesting query in regard to the Washington method of replacing sand in the filters, and it is worthy of most careful thought and attention. If the process described can be carried on with success and safety, it will prove to be a long and progressive step in the methods of operation. The difficulty, however, is in determining from any short‑term runs whether such a process can be continued permanently without impairing the efficiency of the sand bed. Apparently good conditions may change, after a few years' trial, and be followed by unsafe results and predicaments. This replacing of sand with whatever dirt and detritus may travel with it in the carrying water is certainly not equivalent to the care with which it has been understood that sand should be deposited in filters. It is not comparable with the care with which it is placed, when wheeled from a washer, where dirty water overflows the lip, or where it is placed by a machine restorer in the filter, where the transporting water also overflows the weir and is carried to the sewer.
These cheap and rapid methods of doing the work, advanced in the interests of economy, and the idea that sand filters, receiving polluting waters, can operate at higher rates than those which we have demonstrated, and, therefore, have been led to believe are safe, is a speeding up of the whole organization and of operating conditions. It is like speeding up a machine for the purpose of getting a greater output, with the usual result that fast running means quicker wearing out of both man and machine. Quicker operations generally mean carelessness in doing the work, especially in municipal service. Carelessness is engendered by the thought that such work can be handled in a rough and rapid way, and, further, by the ridicule of all these things, which we have learned to be careful about, as old‑fogyish, out‑of‑fashion, and archaic. Carelessness in operation breeds contempt for the art. Some of the less efficient filter plants, from the standpoint of effect on the public health, may reflect such ill‑considered methods.
Economy with Efficiency in Operation.—It is particularly important to find out whether one can secure the desired economy, and, at the same time, the required efficiency. The development of efficiency in every line of human endeavor is receiving much attention at present, and not the least cause for this is the growing recognition of the demand for a high standard of service for the expense caused. One of the first requirements is to have well‑defined ideals and standards. When one knows how to secure a good and safe result, it is unwise to depart therefrom for a mere whim, or to secure a supposedly lessened expense, unless other facts be also determined favorably. The desire for economy must be tempered by good sense, which means that one should be willing to change a method only when the wisdom of such has been clearly demonstrated. Efficient service can only be secured by strict discipline, accompanied by fair dealing. This means employing no more men than are actually necessary, paying them on the basis of the standard of service and output produced, taking an interest in the working conditions, and providing for their health and welfare.
About twelve years ago, the writer made some investigations of the efficiency of laboring gangs in scraping and handling sand at filter beds, 1 and found that ten men was the most economical number to use in scraping the surface of the Lawrence filter, as then built and operated. This result was determined by numerous studies of the output per man per minute, with different numbers of men working under different conditions. This same sort of study has been carried further by adepts in the art, in reference to shop and similar management, but one fails to find corresponding development along this line in municipal organization except by a few of the scattered Bureaus of Municipal Research. These results, also, have related to a few of the more common and general factors, such as determining the cost per mile, or per square yard, of street cleaned, or per million gallons of water pumped.
The cost of the management of water‑works, one of the largest factors of public enterprise, has never been investigated extensively and thoroughly. There is much possibility in planning for greater efficiency and in determining what can be accomplished under economical administration. Every one is aware of the multiplicity of men in municipal service. Some of these are entirely incompetent, others partly so; the recent appointees may be more efficient, but the majority of them gradually deteriorate under the subtle influence of the prevailing atmosphere, and each new incoming administration places more and more men on the work, without reason or necessity. All these tendencies have made the cost and maintenance of public work greater and greater, and, at the same time, have resulted in frequently and steadily decreasing the output and efficiency per employee.
The Washington situation, however, presents an admirable contrast to this, because of the methods of administration of the public works of the District of Columbia and their freedom from petty political influence. The limited number of employees has tended toward economy, and rendered this plant the envy of all who have desired to obtain good management. Its cost items have been looked on as a result long hoped for, but seldom obtained. It is to be regretted, therefore, that such an abrupt change in methods of removing clogging material and replacing sand has taken place without years of experimental trial on filters not furnishing drinking water to the public, and without an attempt, under such excellent conditions, to maintain the efficiency by a better labor output and by improved working and machine methods in the performance of the older and established order of doing things.
In preparing water for the use of the people, the realms of the unknown are so much larger than those which have been investigated and developed that there may be many undiscovered factors affecting the public health, and many ways in which it is dangerous to depart from well‑known and surely safe methods. Who can say that in some subtle and, at present, unknown manner, the failure in some places, where filtration is practiced, to reduce the death rate from typhoid fever may not be due to the introduction of radical departures from the older, slower, safer, and more efficient methods which have produced such excellent results, both in America and in Europe? Further, in cases where there has been a falling off in the typhoid death rate, the failure to secure an accompanying improvement in general health conditions, which follows so closely in communities supplied by water filtered in accordance with the more conservative principles, may be due to the introduction of some of these not thoroughly tried processes. Some day full information may be available as to the influence of these methods of plant operation on the health of the community. Until that time, is it not a much better policy to follow the principles which have been proven by many years of experience to produce safe results, and to make the foremost object the improvement of the methods of operation in accordance with these established truths?
There is opportunity for the upbuilding of greater efficiency in the conduct of employees and in securing the maximum output, by establishing more comfortable and healthful conditions than usually exist. The elimination of political influence from municipal service is also a task which challenges the people of to‑day, and the operating and managing engineer is in a position to perform an important part in accomplishing this end. The number of employees can be reduced to those actually needed, and the way opened for the employment of men who thoroughly understand the necessities of honesty and efficiency in the conduct of public affairs. It should be remembered that to design and construct well is only half the job; to operate economically and efficiently is even more of a problem than to build, and requires just as good talent, just as keen appreciation of the various problems, and is even more essential to public welfare. It seems to the writer that the logical development of the art of obtaining economy as well as efficiency should be along these lines, rather than to revolutionize methods, without having a long‑period test of their value, and at the same time allow political influences to control, to a large extent, the labor item.
Preliminary Treatment.—The decision as to the preliminary treatment of the Potomac River water before filtration is of interest, particularly because various other conclusions have been reached in different sections of the country. However, in the main, these decisions have been due to differences in the character of the waters, but it must be evident that they have sometimes been the result of ill‑considered action, or the desire to promote some special interest. The use of preliminary filters, which involves a large investment, is not always to be commended, particularly because at times of reasonably good water the removal of some of the organic matter is really injurious and lessens the effect of the final filters.
For a long time, the writer has believed that, where other things are equal, and where there is no important reason for double or preliminary filtration, long periods of storage, accompanied by the use of coagulant at times of severe and extreme muddiness, as planned at Washington, solves the problem in the most practical and economical way. It is true that the investment for a large storage basin may equal, or even exceed, that required for preliminary filters; but the influence of storage on the quality of raw water is never injurious, and, by ripening the condition of the water, may be greatly beneficial in the process of filtration.
The storage available in such a basin makes it possible to shut off the supply from the river during the worst conditions of the water. The duration of the most troublesome spells ordinarily does not exceed a few days, and it is usually possible to secure sufficient capacity in the basin to tide over these periods. Then again, long periods of storage, in addition to assisting in breaking up organic matter, permit the dying out of bacteria, particularly many of the pathogenic kind, and, therefore, the water is rendered much safer from this standpoint. In other words, there is additional insurance in long storage against the faulty and careless operation of incompetent filter employees. The addition of coagulant, especially the fact that only a very small investment of capital is required for the necessary apparatus for dosing the water, and that the cost of the coagulating materials has to be met only when used, seems to give the process, in a most satisfactory manner, the requirement for economical management and thoroughness in preparing the water for final filtration.
Parking Public Works.—It is disappointing that the author has not mentioned some of the steps contemplated in reference to the landscape treatment of the Washington filtration area. Probably every one has been impressed by the barren aspect of the works as they are approached, and as one looks over them. Recently, however, it is stated that some steps have been taken to lay out the grounds, treat the surface in an attractive manner, and make a park of the area. The writer has a firm opinion that when an investment is made for public works, it costs but little in addition to construct buildings along appropriate architectural lines, to treat the grounds in a pleasing manner, and to make the entire works a credit to the municipality from an artistic standpoint. When treated on broad lines, such areas become public parks, and afford open breathing places for the residents, and, if near centers of population, may well be equipped with playground facilities for the children. When thus developed they should have care, that the planting and equipment should not deteriorate and the last state become worse than the first.
The influence which these ever‑present examples of attractiveness have on the community is becoming better recognized by students of social progress, and there seems to be no doubt that spending money on such features is not only desirable from the artistic standpoint, but is justified on practical grounds as well. It is cheaper than to create parks, when necessity and demand can no longer be resisted, by buying property and occasionally tearing down buildings and constructing de novo. That this work is now being done in Washington, even after construction, is certainly a recognition of the advisability of original efforts in this direction.
George C. Whipple, M. Am. Soc. C. E. (by letter).—Mr. Hardy's paper is an excellent presentation of the results of the operation of the Washington water filtration plant from the time of its construction in 1905 until June, 1910. Papers of this character are altogether too infrequent, and the actual results from the filters now in use are not readily accessible in detailed form. Yet it is only by studying the results obtained by filters in actual use that improvements can be made and the art advanced.
Among the many important facts brought out by Mr. Hardy, only a few can be selected for discussion. One of these is the operation of filters under winter conditions. It is well known that the efficiency of sedimentation basins and filters is lower during winter than at other times, yet it is just at this season of the year that there is the greatest danger of typhoid fever and similar water‑borne diseases being transmitted by water. Most of the great typhoid epidemics have occurred during cold weather, and the very use of the term "winter cholera" is of significance. Apparently, typhoid bacilli and similar bacteria are capable of living and retaining their vitality longest during that season of the year. Just why this is so, bacteriologists have not satisfactorily explained. Doubtless many factors are involved. Because of the increased viscosity of the water, sedimentation takes place less readily at lower temperatures, and inasmuch as sand filtration is partly dependent on sedimentation, the efficiency tends to fall off in cold weather. During winter some of the external destroying agencies are less potent, such as the sterilizing effect of sunlight, and the presence and activity of some of the larger forms of microscopic organisms which prey on the bacteria. Another factor may be the greater amount of dissolved oxygen normally present in water during cold weather, as experiments have shown that dissolved oxygen favors longevity.
Still another reason for the larger numbers of bacteria that pass through a water filter during cold weather may be the effect that the low temperature has on the size of the bacteria themselves. A few experiments made recently by the writer appear to indicate that at low temperatures the gelatinous membrane which surrounds the bacterial cells tends to become somewhat contracted, thus decreasing the apparent size of the bacteria as seen under the microscope. Either this contraction occurs, or the cells themselves are smaller when they develop in the cold. It is possible also that low temperature affects the flagella of the organisms in the same way. It is not unreasonable to suppose that the effect of low temperature is to form what may be, in effect, a protective coating around the cells, which tends to make them smaller, less sticky, and less subject to outside influences. This would tend to make them pass through a filter more readily. In line with this idea also is the well‑known fact that disinfection is less efficient in cold water than in warm water.
Another way of viewing the matter is that cold retards the growth of bacteria on the filter, thus reducing the effect of the Schmutzdecke. Still another view of the greater danger from bacterial contamination in winter is the theory that cold prolongs the life of the bacteria by merely preventing them from living through their life cycle and reaching natural old age and death as rapidly as in warm weather.
Another topic in Mr. Hardy's paper which has interested the writer is that of preliminary filters. The experiments described at length indicate clearly that such devices would prove of little or no benefit under the conditions existing in Washington, and that when the river contains considerable amounts of suspended clay nothing less than chemical coagulation will suffice to treat the water so that the effluent will be perfectly clear. Preliminary filters have been used for a number of years at various places and with varying success. In few instances have they been operated for a sufficient length of time or been studied with sufficient care to determine fully their economy and efficiency as compared with other possible methods of preliminary treatment.
Among other experiments on this matter are those made at Albany, N. Y., and published by Wallace Greenalch, Assoc. M. Am. Soc. C. E., in the Fifty‑ninth Annual Report of the Bureau of Water for the year ending September 30th, 1909. The Hudson River water used at Albany is quite different in character from the Potomac River water used at Washington, as it is less turbid and contains rather more organic matter. The results obtained in these experiments showed that during the summer the number of bacteria in the effluent from the experimental sand filter used in connection with a preliminary filter did not differ widely from the number found in the effluent of the city filter where there was no other preliminary treatment than sedimentation. In the winter, however, the numbers of bacteria did not increase in the effluent from the experimental filter as they did in the effluent from the city filter. This is shown by Table 26, taken from the report mentioned.
Apparently, therefore, at Albany the benefits of the preliminary filter, as far as bacterial efficiency is concerned, would be confined to a short period of three or four months in each year. Under such circumstances it may well be questioned whether the advantages of preliminary filtration justify its cost.
On the diagram, Figure 11, will be found various data taken from the published records of the Albany filter, from 1899 to 1909. These data include: The numbers of bacteria before and after filtration; the percentage of bacteria remaining in the effluent; the average quantity of water filtered, in millions of gallons per day; the quantities of water filtered between scrapings; the turbidity of the raw water; the cost of filtration, including capital charges and cost of operation; and the typhoid death rates of the city per month. Several points are brought out conspicuously by this diagram. One is the uniformly low death rate from typhoid throughout the entire period. The filter was operated from 1899 until the fall of 1907 with raw water taken from what is known as the "Back Channel." Since then it has been taken from a new intake which extends into the Hudson River itself. Until the fall of 1908 the preliminary treatment consisted merely of sedimentation, but since then the water has received an additional preliminary treatment in mechanical filters operated without coagulant, along the lines of the experiments just mentioned. During this time the average rate of filtration of the sand filter has not changed materially, although it is said that the maximum rate has been increased since the preliminary filters were put in service. The study of the bacteriological analyses shows that the best results were obtained during 1902, 1903, and 1904. Since then the numbers of bacteria in both the raw and filtered water have increased. This was especially noticeable during the winters of 1907 and 1908 when the water was taken from the new intake. It will be interesting to compare the results after the preliminary filters have been operated for a long period to ascertain their normal effect on efficiency and on the increased yield.
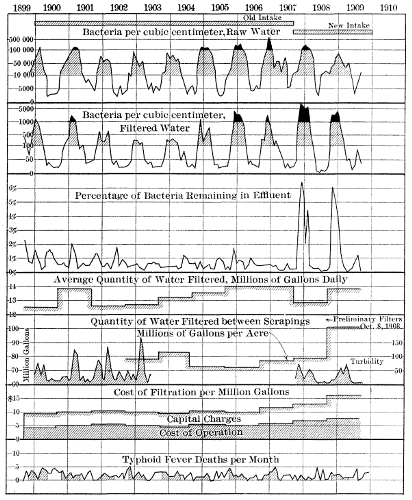
Another fact to be drawn from the plotted Albany data is the increase in the cost of filtration, both in capital charges and in operation. From 1899 until 1906 the cost of operation, including the cost of low‑lift pumping, was approximately $5 per million gallons of water filtered; and the total cost of filtration, including capital charges, was about $10 per million gallons. During the year ending September 30th, 1909, the cost of operation had increased to $7.63 per million gallons, and the total cost of filtration to $15.92 per million gallons, or approximately 50% in three years.
| Quantity of water tested. | Percentage of Samples Containing B. Coli. | |
|---|---|---|
| Raw. | Filtered. | |
| 0.1 cu. cm. | 0 | 0 |
| 1.0 cu. cm. | 20 | 0 |
| 10.0 cu. cm. | 40 | 0 |
As a matter of record, the results of a series of analyses made at Peekskill, N. Y., during 1910 are presented in Table 27. A sand filter was constructed for the water supply of this city in 1909, and put in operation in December. The filter has a capacity of 4,000,000 gal. per day. The supply is taken from Peekskill Creek, and the water receives about one week's nominal storage before flowing to the filters. An aerator is used before filtration during the summer, when algae are likely to develop in the reservoir. The filter was installed after an epidemic of typhoid which was apparently caused by an infection of the water supply. Normally, the water has been little contaminated, but the supply is subject to accidental contamination at any time, among other possible sources of infection being the camps of workmen now engaged in constructing the Catskill Aqueduct for New York City.
F. F. Longley, Assoc. M. Am. Soc. C. E. (by letter).—In this paper the author has presented a mass of data which will be welcomed by engineers engaged in water purification work, because complete operating records form a substantial basis for improvement in the art, and are often the inspiration for interesting discussions and the exchange of experiences of different observers whose views are mutually appreciated.
Recent tendencies in filtration engineering have been largely in the direction of reducing the cost of operation. A comparison of the operating costs of the earlier American plants of about a decade ago, with those here presented of the Washington plant, is very gratifying to those who have been intimately connected with the latter work. Through perfection in design and reasonable care in operation, the cost of filter cleaning, which is a very considerable part of the total cost, has been reduced to an unusually low figure, without any sacrifice in efficiency, and in the interests of the public health.
Table 14 shows that, from the first year, there has been a progressive increase in the total cost of operation per million gallons filtered, but this has not meant an increase in the annual total expenditure. The largest percentage of increase in any item has been in "Care of Grounds and Parking," and covers much‑desired landscape improvements. Aside from this, the principal factor affecting the table of costs has been the reduction in water consumption in the District of Columbia. Nothing pertaining to this reduction has produced any corresponding reduction in the force required for the maintenance and operation of the filtration plant, office and laboratory, and pumping station, though probably there has been some reduction in filter cleaning. Obviously, then, the total cost per million gallons would increase.
This decrease in consumption has been brought about by the elimination of waste in the distribution system, which is not in the same department as the filtration plant, but with regard to which a word may not be amiss in connection with this discussion.
The Washington Aqueduct was built half a century ago on lines which at that time were considered extraordinarily generous. Until recently, therefore, there has been no occasion for concern over the high rate of consumption. During recent years, however, the use and waste of water have increased, reaching a climax under unusual conditions in the winter of 1904‑05. The maximum capacity of the aqueduct system is about 90,000,000 gal. The maximum daily consumption at the time mentioned arose almost to 100,000,000 gal., with the result that, before normal conditions were restored, the reservoirs of the system were almost depleted.
This had a beneficial effect, as provision was made for an active campaign for reducing the waste of water, which was known to be very large. These investigations, using the pitometer, were begun in July, 1906, and have been pursued continuously since that time, with most excellent results. Up to January, 1909, leaks aggregating about 12,000,000 gal. per day were detected and eliminated, and about half the house services had still to be covered by the pitometer bureau.
Although this reduction in waste has brought about an apparent increase in the cost of filtration, its economical results have been far‑reaching. The causes which brought about this investigation also resulted in securing an appropriation for the study of the question of increased supply. The writer was in charge of these studies, and the most significant conclusion was that, owing to the excellent results of the efforts for waste restriction, the total consumption and waste of water in the district during the next few years would be far enough below the safe working capacity of the existing aqueduct system to make it entirely safe to postpone the construction of new works, involving the expenditure of several million dollars, in spite of the threatening conditions of a few years ago.
There has been so much controversy over typhoid fever in the District of Columbia that the writer hesitates to discuss this subject. Viewing the situation through the perspective of several years, however, it does not seem to be as hopeless as the criticisms of four or five years ago would lead one to believe.
In Table 9, showing the typhoid death rates, out of nine years given prior to 1905‑06, when the filters were started in operation, only one shows an annual death rate as low as the highest one since that year. Further than this, the annual average typhoid death rate for the period since that year has been one‑third lower than for a corresponding period before the filters were started.
The exhaustive researches of the Public Health and Marine Hospital Service into this whole question, covering a period of about four years, have raised the present filtered water supply of the District of Columbia above any well‑founded criticism. There has long been a strong and growing feeling that the water supply, before filtration was introduced, had been blamed for more than its share of the typhoid, and this is borne out by much evidence that has been presented from time to time.
It is not an unreasonable conjecture, therefore, that perhaps the reduction of one‑third in the total typhoid death rate may represent a much larger reduction in that part of the total which was due to polluted water alone; and that, as the authorities in the District of Columbia and in certain other cities, particularly in the South, are now recognizing, the fight against much of the remaining typhoid must be in the direction of the improvement of milk supplies, precautions against secondary infection, and attention to a large number of details surrounding the individual, which may effectively protect him against the insidious attack of the disease favored by unknown agencies.
The author refers to the difficulty encountered during the first two summers in keeping the filters cleaned fast enough to maintain the capacity of the plant. The real seriousness of this may be judged from the following facts. The average increase in loss of head on all the filters for the entire year, July 1st, 1906, to July 1st, 1907, was about 0.053 ft. per day. During the 1906 period of low capacity under discussion, the loss of head on twelve of the filters increased for a period of eight days at the average rate of 0.45 ft. per day, or about nine times the normal rate of increase. This difficulty was caused by the presence of large numbers of micro‑organisms in the applied water. During the first summer (1906) this fact was not recognized, but the sudden decrease in capacity was supposed to have been caused by the unusually high and long‑continued turbidity which prevailed during that summer in the Potomac River, and persisted in the water supplied to the filters even after about four days of sedimentation in the reservoirs. During the second summer (1907) the same phenomenon of suddenly and rapidly increasing losses of head appeared again, but without any unusual turbidity in the applied water. Investigation, however, showed the presence of large quantities of organisms, particularly melosira and synedra, in the applied water, and examinations in subsequent years have shown a periodic recurrence of these forms in quantities sufficient to cause the trouble mentioned. In June, 1907, examination showed repeatedly more than 1,000 and 1,500 standard units of melosira per cu. cm., and one count showed nearly 3,000 standard units.
Several expedients were tried in an effort to restore the rapidly decreasing capacity of the filters. One of the earlier conjectures as to the cause of the trouble was that it might be due to the accumulation of large quantities of air under the surface of the sand, as air had been observed bubbling up through the sand, especially in filters which had been in service for some time. The expedient was tried, therefore, of draining the water out of the sand and then re‑filling the filter in the usual manner from below, in the hope of driving out the entrained air. Presumably this treatment got rid of the air, but it did not restore the capacity of the filter, as the point of maximum resistance was in the surface of the sand and not below it.
As the author states, raking the filters was tried and found to give results which were satisfactory enough to meet the emergencies already referred to. When the filters were first put in operation, in the fall of 1905, the method of bringing back the capacity of a filter after the end of a run was to remove all the dirty sand to a depth determined by the marked discoloration caused by the penetration of the clay turbidity. This sometimes necessitated the removal of large quantities of sand at a cleaning, as the turbidity was exceedingly fine, and penetrated at times to a depth of 3 or 4 in.
With the idea of effecting an economy in the cost of cleaning the filters, a schedule of experiments was arranged shortly before July 1st, 1907. The general object of the experiments was to determine, first, the relative costs of all different methods tried; second, whether the removal of only a thin layer of sand, or the mere breaking up of the surface of the sand by thorough raking, would give the filter its proper capacity for the succeeding run; third, whether the filters under these treatments would maintain a high standard of quality in the effluents; fourth, whether the continued application of any less thorough method than the one then in use might materially affect the future capacity of the filters.
To this end the filters were divided into four groups which, during a period of about six months, were subjected to treatments as follows:
| Group A.— | Filters scraped deep at the end of each run; | |
| Group B.— | Filters scraped light at the end of each run; | |
| Group C.— | Filters raked at the end of each run, until raking failed to bring back the proper capacity; then they were scraped light, and at the end of the next run the raking was resumed; | |
| Group D.— | Light scrapings and rakings alternate at ends of runs. |
The term "deep scraping" means the removal of practically all the discolored sand, in accordance with the usual practice prior to the beginning of these experiments; "light scraping" means the removal of only a thin surface layer of sand. This depth has usually averaged about 3/8 in. "Raking" means the thorough breaking up of the clogged surface of the filter by iron‑toothed rakes, to a depth of about 1 or 2 in.
Results.—A general summary of the results of these experiments is given in Table 29, which also shows the relative costs of the different methods per million gallons of water filtered. A normal period of 9 months just prior to the beginning of these experiments shows a labor cost (corresponding to that in Table 29) of $0.29‑1/4 per million gallons filtered.
Capacity of Filters.—The capacity of the filters under the different methods of treatment are shown in a general way in Table 29 for days of service and millions of gallons filtered per run. This element by itself is decidedly in favor of the deep scrapings, and least in favor of the repeated rakings.
A clearer conception of the capacities of the filters under these different conditions may be obtained from the four diagrams, Figure 12, showing, for the four different groups, the average number of days of service of the successive runs. The diagram for Group A shows that the variations in the period of service of the filters scraped each time to clean sand follow a more or less definite curve from year to year. For the period covered by this curve, the tendency seems to be toward a slight decrease in capacity from year to year, as shown by the lower average maximum and minimum in the second year than in the first. Group B shows a sudden decrease in capacity following the first light scrapings and, since that time, a low but quite constant capacity. Group C shows a constantly decreasing capacity with successive rakings. The only significance attaching to the curve after the first raking is the prohibitively low capacity indicated, and the ineffectiveness of the measures taken to restore the capacity after the sixth raking. Group D, after the first raking, shows a prohibitively low and constantly decreasing capacity. The diagrams for C and D indicate a dangerous reduction in capacity if long persisted in. The method followed with Group C may be dismissed with the statement that it is entirely insufficient, and would be of use only in the rarest emergencies.
As far as the question of capacity is concerned, these diagrams indicate that a filter in normal condition may safely be raked once. It is believed that the constantly decreasing capacity shown in Group D is not due so much to the rakings as to the small quantities of sand removed at the alternate scrapings, and therefore it would not be proper to condemn this method of treatment without a further trial in which this defect was remedied. This view seems to be supported by the results of Group B. The low but approximately constant capacity there shown would undoubtedly have been higher if a greater depth of sand had been removed each time.
Quality of the Effluent.—The averages given in Table 29 show but little difference in the bacterial contents of the effluents from the four groups of filters. All are entirely satisfactory, and the differences in favor of one method or another are small. In looking for possible differences in the quality of the effluents from the four groups, it was thought that such differences might be most apparent at a time when the entire plant was working under the most adverse conditions. The bacterial counts, therefore, were summarized for the period from December 23d, 1907, to January 6th, 1908, inclusive, following a period of high turbidity and high bacteria in the raw water, with results as follows:
| Group............ | A | B | C | D | |
| Maximum....... | 204 | 178 | 189 | 206 | |
| Minimum........ | 61 | 45 | 62 | 57 | |
| Average......... | 120 | 107 | 104 | 155 |
The following is a summary of the turbidity results for a similar period:
| Group............ | A | B | C | D | |
| Maximum....... | 10.8 | 11.7 | 8.7 | 9.3 | |
| Minimum........ | 6.7 | 4.7 | 6.2 | 5.7 | |
| Average......... | 8.7 | 8.3 | 7.2 | 7.9 |
These numbers, though high, do not show any significant differences. All the averages for each group are less than the lowest maximum, and all are greater than the highest minimum, and therefore vary less than do the individual filters, from other causes, within the different groups.
Future Capacity of the Filters.—An indication of the dangers which might affect the future capacity of the filters was shown in the above discussion of the present capacity. A more effective way of showing this was obtained by a study of the initial resistances or losses of head in the four groups. A filter kept in ideal condition would show no increase in this initial loss of head from one run to the next. If there is such an increase, it means that at some future time measures more heroic than ordinarily used would be necessary to restore the proper capacity.
The average initial losses of head for the different groups are plotted on the diagram, Figure 13. Group A shows an initial loss of head, increasing gradually but slightly during more than two years of service. In Group B the initial loss of head increased in a manner similar to that in Group A, up to the time of the beginning of these experiments; after which the increase becomes more rapid. Groups C and D show conditions generally similar to Group B, with some variations which are self‑explanatory.
Conclusions.—The quality of the effluents from all four groups was satisfactory, and no consistent difference was apparent in favor of one or another method of treatment. The method pursued with Group C was entirely insufficient to maintain the capacity indefinitely. The methods pursued in Groups B and D were both insufficient, but would have been more effective if a greater depth of sand had been removed. The costs of treatment of Groups B and D were less than for Group A. It appears, then, that a treatment which would be more economical than the old method of Group A, and would still maintain the proper capacity, would be one similar to that of Groups B or D, with the removal of a quantity of sand greater than was done in the case of these two groups, but less than in the old method.
At the time the above results were summarized, it was proposed to proceed with the filter treatment along the lines just mentioned. The writer did not have an opportunity to study the subsequent results, as he was transferred to other work. A statement by the author of any new facts that may have come to light in this connection would be of interest.
Mention should be made, too, of another expedient that was used to hasten the restoration of the capacity of a filter, which proved to be a most useful one. The removal of the scraped sand from a filter was a matter of a good many hours' work, under the most favorable conditions. To get the filters quickly into service again, the dirty sand in a number of them was simply scraped from the surface, heaped into piles, and left there; then the water was turned in, and the filter was started again. This was done with some hesitation at first for fear the presence of the piles of dirty sand might cause high bacterial counts in the effluents of those filters. No such effect was observed, however, the counts being entirely normal throughout. The writer subsequently found the same treatment being applied as an emergency measure at the Torresdale plant, in Philadelphia, and, through the courtesy of the Chief Engineer of the Bureau of Filtration, was furnished with the bacterial counts through a number of runs made under these conditions, and there, too, the results were entirely normal.
There was practically no economy in this method, as the sand had ultimately to be ejected and washed. The piling up of the sand had the effect of reducing the effective filtering area by a small percentage, with a corresponding increase in the actual rate of filtration, but this was of trifling importance. The great benefit derived from the method was the saving of time in getting a filter back into service after scraping, and in this respect it was very valuable.
The first and most natural conception of the action of a sand filter is that the removal of impurities is effected by a straining action. This, of course, is perfectly true as far as it relates to a large part of the visible impurities. Much of this is gross enough to be intercepted and held at the surface of the sand. This very straining action is an accumulative one. After a quantity of suspended matter thus strained out mats itself on the surface of the sand, it in turn becomes a strainer, even better adapted than the clean sand surface which supports it for the removal of suspended matter from the water.
This, however, cannot explain certain features of the purification of water by a layer of sand. The removal of color, the reduction of nitrates, and certain other changes in the organic content of the water have for a long time been recognized as due to a bio‑chemical action carried on by certain bacteria in the sand. Both the straining action and this bio‑chemical action are not all‑sufficient for the explanation of certain phenomena, and it has been recognized, too, that sedimentation in the pores of the sand played a large part in the purification process in those cases in which it was apparent that the biological agencies were not the chief ones.
In the purification of water containing only insignificant quantities of suspended matter, but a relatively large amount of unstable organic matter, it will be conceded at once that the chief factor in the purification is the nitrification produced by the bacteria in the upper layers of the sand. On the other hand, the purification by sand filters of a hypothetical water containing no organic matter, but only finely‑divided mineral matter in suspension, could take place only by the physical deposition of the particles upon the sand grains. Between these two extremes lie all classes of water. In all problems of water purification by filtration through sand, both these factors—biological action and sedimentation—play their parts, assisting and supplementing each other, the relative importance of one factor or the other depending on the place of the particular water in question on the scale between the two extreme conditions just mentioned.
In Mr. Hazen's paper on "Sedimentation"1 there is an interesting development of the theory of the removal of suspended matter by sedimentation in the pores of a layer of sand. The factors influencing this removal are the rate of filtration, the effective size of the sand, and the temperature of the water. For the conditions at the Washington plant, it may be assumed that the first two of these factors are constant. The third factor, however, varies through wide limits, and the observations on the turbidity removal, and on the different phases of the filter operation of which the turbidity of the water is a factor under varying temperature conditions, together with the known relations between hydraulic values and temperatures of water, furnished good substantiative evidence that this highly‑induced sedimentation may be a considerable factor in the purification of the water as effected at this plant. This temperature relation, briefly stated, is as follows: For particles of a size so small that the viscosity of the water is the controlling factor in determining the velocity of their subsidence in still water, that velocity will vary directly as (T + 10) / 60, in which T is the temperature, in degrees, Fahrenheit. That is, when the temperature of the water is between 70° and 80° Fahr., a particle will settle with twice the velocity it would have if the water were near the freezing point.
The layer of sand in a slow sand filter may be considered as a very great number of small sedimentation basins communicating one with another, not in the manner of basins connected in series, but rather, as Mr. Hazen has expressed it, as a long series of compartments connected at one side only with a passageway in which a current is maintained. In any section of the sand layer there are areas through which the water passes with a velocity much greater than its mean velocity through the total area of voids, while there are other areas in which the velocity is very much less, perhaps in an almost quiescent state from time to time, greatly favoring the deposition of particles, but with a gentle intermittent circulation, displacing the settled or partly‑settled water and supplying from the main currents water containing more suspended matter particles to be removed. There is thus a considerable percentage of the total volume of voids in which the water is subjected to very favorable conditions for sedimentation, almost perfect stillness and an exceedingly small distance for a particle to settle before it strikes bottom on the surface of a grain of sand.
If sedimentation were the predominating factor in the purification of the water, we would then expect to find the following phenomena in the operation of the filters: A more rapid deposition of a given amount of sediment under summer temperature conditions than under winter, as the water passes through the sand, and therefore, for the former condition of higher temperature:
The operation of this plant during the first year and a half offered an excellent opportunity for the study of sedimentation in the sand, and the data in Table 30 are presented to show that certain of the phenomena of filter operation observed during this period seem to be fairly explicable by the physical theory of purification. These data are given only for the period of operation before the summer of 1907. At that time the experiments in filter cleaning already described were begun. Before that time, whenever a filter had been cleaned, all the discolored sand had been removed, leaving for the following run a new sand surface substantially in the perfect condition of a newly‑constructed filter. After that time the experimental methods of cleaning, and the new routine adopted as a result thereof, interfered with the tracing of the evidence as clearly as during the earlier periods.
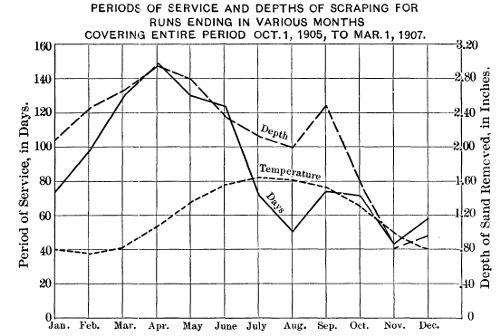
Table 30 and the corresponding diagram, Figure 14, show the general variations in the length of runs and depth of penetration, with the seasonal temperature changes. The increase in length of runs and quantity of sand removed under low temperature conditions is very marked. There is, however, a secondary maximum which appears, as the diagram shows, where a minimum for the year would be expected. This may have been an irregularity occurring this one year, which will not appear in the average of several years, and caused by some factor which has escaped observation. A careful analysis of the data at hand fails to show any explanation for it. It may exist in some of the little‑understood biological actions which have their maximum effect under warm‑water conditions, or it may be due—in some obscure way—to the liberation of air under the surface of the sand, accumulating with pressure enough to break the surface at innumerable points, thereby reducing the loss of head and extending the period of service. Some evidence was observed pointing to this explanation, but it was never conclusively proven.
The general effect of temperature changes on the rapidity of removal of the sediment and its consequent concentration in the sand layer, however, seems plainly evident.
In corroboration of the third point mentioned in the theoretical consideration of turbidity removal in the filters, the daily turbidities of the filtered water have been classified and summarized for different turbidities in the applied water, and also for different temperatures. The average turbidities thus obtained are given in Table 31.
| Turbidity of applied water. | Temperature, in Degrees, Fahrenheit. | ||||
|---|---|---|---|---|---|
| 40° | 40°‑50° | 50°‑60° | 60°‑70° | 70° | |
| 20 | 1.8 | 1.3 | 1.2 | 1.5 | 1.7 |
| 20-40 | 4.8 | 5.0 | 3.5 | 3.0 | 2.6 |
| 40-60 | 7.9 | 6.9 | 5.4 | ... | 3.7 |
| 60-80 | 10.7 | 7.7 | ... | ... | 5.4 |
| 80-100 | 11.3 | ... | ... | ... | ... |
| 100 | ... | ... | ... | ... | 12.01 |
The influence of the temperature of the water on the turbidity of the effluent is very pronounced. For a temperature of less than 40° Fahr. (actual average temperature about 35°), the turbidity of the filtered water for a given turbidity of the applied water is practically twice as great as for a temperature greater than 70° (actual average temperature about 75°). This fact fits in very nicely with the influence of temperature on sedimentation. Referring again to this temperature relation, as set forth on a previous page, the hydraulic subsiding value of a particle in water, of a size so small that viscosity is the controlling factor in its downward velocity, is approximately twice as great at 75° as at 35 degrees. We would then expect to find that, in order to obtain a given turbidity in the filtered water, a raw water may be applied at 75°, having twice the turbidity of the water applied at 35°, to produce the same turbidity; and further, as the turbidity of the filtered water, for a given temperature condition, varies quite directly in proportion to the turbidity in the applied water, it follows that an applied water of given turbidity will produce an effluent at 35° with a turbidity twice as great as at 75 degrees. This is quite in accordance with the facts obtained in actual operation, as indicated on the diagram, Figure 15.
Preliminary Treatment of the Water.—The most striking features of the bacterial results given in Table 4 are, first, the uniformly low numbers of bacteria in the filtered water during perhaps 8 or 9 months of the year, and the increase in numbers each winter. This is shown clearly in the analysis of bacterial counts in Table 32.
The tests for Bacillus Coli in Table 5 show results which correspond closely to these, with this organism detected only infrequently, except during the periods of high bacteria, and both of these are parallel to the turbidity variations in the filtered water. These variations follow closely the variations in the turbidity and in the bacterial content of the water applied to the filters.
By all standards of excellence, the sanitary quality of the water during the greater part of the time is beyond criticism. In view of the close parallelism of turbidity and bacterial results in the applied and in the filtered water, it is entirely logical to conclude that, if the quality of the applied water could be maintained continually through the winter as good as, or better than, it is during the summer, then the filtered water would be of the perfect sanitary quality desired throughout the entire year.
This was all foreseen ten years ago, when Messrs. Hering, Fuller, and Hazen recommended auxiliary works for preliminary treatment of the supply, although, as the author states, these works were not provided for in the original construction. As prejudice against the use of a coagulant seemed to be at the bottom of the opposition to the preliminary treatment, a campaign of education bearing on this point was instituted, in addition to the systematic studies of different preliminary methods to which the author refers. As a result of the combined efforts of all those interested in promoting this improvement, an appropriation was finally made for the work in 1910. The coagulating plant has since been built, and the writer is informed that coagulation was tried on a working scale a short time ago during a period of high turbidity. A statement of the results of this treatment on the purification of the water in the reservoir system and in the filter plant would be of great interest.
Hydraulic Replacing of Filter Sand.—The author has adopted a method of replacing clean sand in the filters which will commend itself to engineers as containing possibilities of economy in operation. The first experiments in the development of this method at the Washington plant were carried out some three years ago, while the writer was still there. Substantially the same methods were used then as are described in this paper, but examination of the sand layer by cutting vertically downward through it after re‑sanding in this manner showed such a persistent tendency toward the segregation of the coarse material as to hold out rather discouraging promises of success. The greatest degree of separation seemed to be caused by the wash of the stream discharging sand on the surface. It was observed that, near the point where the velocity of the stream was practically destroyed, there seemed to be a tendency to scour away the fine sand and leave the coarse material by itself, and pockets of this kind were found at many points throughout the sand layer. The author states that, in the recent treatment of the filters by this method, there has been no apparent tendency for the materials to separate into different sizes, and it is fortunate if this work can be done in such a manner as to avoid this separation entirely.
It may be questioned whether a certain amount of segregation of the materials will make any practical difference in the efficiency of a filter. In all probability this depends on the degree of the segregation, the quantity of pollution in the water to be filtered, the rate of filtration, and the uniformity of methods followed in the operation, etc. For an applied water as excellent in quality as that of the Washington City Reservoir during favorable summer conditions, a considerable degree of segregation might exist without producing any diminution in efficiency. For a badly polluted water, however, such as the applied water at this plant during certain winter periods, or the water of a great many other polluted supplies, it might be found that even a slight lack of homogeneity in the sand might make an appreciable difference in the results of filtration.
As a result of the experiments herein described, however, this method may be applied at other plants where conditions seem to warrant it, with a largely increased measure of confidence; although, as in the case of the adoption of any new or radical departure, that confidence must not be permitted to foster contempt of the old and tried methods, but its operation must be watched with the utmost caution, until long experience shall have demonstrated its perfect suitability and defined its limitations.
E. D. Hardy, M. Am. Soc. C. E. (by letter).—It was not the writer's original intention to enter into a discussion of either the theory of water purification or of the experimental work on sand handling, but simply to present the main results of operation largely in tabular form. He is gratified, however, to have these sides of the question so ably brought out in Mr. Longley's discussion.
Mr. Hazen referred to the inferior efficiencies of the experimental filters for rate studies (as shown in Table 20) in the removal of the B. Coli from the water tested. This inferiority is really less than the figures in the table would indicate, as the tests for the experimental filters were presumptive only (as shown by the note at the foot of Table 20), while those for the main filters were carried through all the confirmatory steps.
From experiments1 made by Messrs. Longley and Baton in the writer's office, it would seem reasonable to assume that about one‑half of the positive results, would have been eliminated had the confirmatory steps been taken. In other words, the figures showing the number of positive tests for B. Coli in Table 20 should be divided by two when comparing them with corresponding ones for the main filters.
Mr. Knowles seems somewhat apprehensive regarding the methods described in the paper of restoring the capacity of the filters by raking, and replacing sand by the hydraulic method, and yet, from Mr. Johnson's discussion, it would seem that the practice of raking filters between scrapings had recently been adopted at the Pittsburg plant.
Before the practice of raking was finally adopted as a part of the routine filter operation, the subject was given a great deal of thought and study, as may be seen by referring to Mr. Longley's discussion.
The re‑sanding has been done by the hydraulic method, for nearly two years, and, as far as the writer is able to judge, this method has been more economical and also more satisfactory in every way than the old one. As Mr. Hazen states, this does not prove that the hydraulic method would be as satisfactory for other filter plants and other grades of sand. The elevated sand bins at the Washington plant fit in well with this scheme, and save the expense of one shoveling of the sand; and the low uniformity coefficient of the sand is favorable in decreasing its tendency to separate into pockets or strata of coarse and fine sand. The method of washing is also well adapted to this method of re‑sanding, as the sand is made very clean in its passage through the washers and storage bins. The hydraulic method of replacing sand tends to make it cleaner still, because any clay which may be left in the sand is constantly being carried away over the weir and out of the bed, to the sewer. Sand replaced by the hydraulic method is much more compact than when replaced by other methods, and consequently the depth of penetration of mud in a filter thus re‑sanded is less. Careful tests of the effluents from filters which have been re‑sanded by the two methods have invariably shown the superiority of the hydraulic method.
The experiment of replacing sand by water, referred to by Mr. Longley, was not considered a success at the time, and the method was abandoned for about a year. At that time an attempt was made to complete the re‑sanding of a filter which had been nearly completed by the old method. The precaution of filling the filter with water was not taken, nor was any special device used for distributing the sand. When this method was again taken up, various experiments were tried before the present method was adopted.
Mr. Whipple's remarks on the results from the operation of filters under winter conditions are very interesting, and, considering his standing as an authority in such matters, they are worth careful consideration.
In the operation of the Washington plant, it has always been noticeable that the results were much poorer in winter than in summer. In fact, nearly all the unsatisfactory water which has been delivered to the city mains has been supplied during the winter months. On the other hand, the typhoid death rate has always been comparatively low in cold weather. These facts would seem to indicate that the water supply was not responsible for the typhoid conditions.
End of the Project Gutenberg EBook of Transactions of the American Society
of Civil Engineers, vol. LXXII, June, 1911, by E. D. Hardy

*** END OF THIS PROJECT GUTENBERG EBOOK SOC. CIVIL ENGINEERS, JUNE 1911 ***

***** This file should be named 27632-h.htm or 27632-h.zip *****
This and all associated files of various formats will be found in:
        https://www.gutenberg.org/2/7/6/3/27632/

Produced by Juliet Sutherland, Christina and the Online
Distributed Proofreading Team at https://www.pgdp.net


Updated editions will replace the previous one--the old editions
will be renamed.

Creating the works from public domain print editions means that no
one owns a United States copyright in these works, so the Foundation
(and you!) can copy and distribute it in the United States without
permission and without paying copyright royalties.  Special rules,
set forth in the General Terms of Use part of this license, apply to
copying and distributing Project Gutenberg-tm electronic works to
protect the PROJECT GUTENBERG-tm concept and trademark.  Project
Gutenberg is a registered trademark, and may not be used if you
charge for the eBooks, unless you receive specific permission.  If you
do not charge anything for copies of this eBook, complying with the
rules is very easy.  You may use this eBook for nearly any purpose
such as creation of derivative works, reports, performances and
research.  They may be modified and printed and given away--you may do
practically ANYTHING with public domain eBooks.  Redistribution is
subject to the trademark license, especially commercial
redistribution.


*** START: FULL LICENSE ***

THE FULL PROJECT GUTENBERG LICENSE
PLEASE READ THIS BEFORE YOU DISTRIBUTE OR USE THIS WORK

To protect the Project Gutenberg-tm mission of promoting the free
distribution of electronic works, by using or distributing this work
(or any other work associated in any way with the phrase "Project
Gutenberg"), you agree to comply with all the terms of the Full Project
Gutenberg-tm License (available with this file or online at
https://gutenberg.org/license).


Section 1.  General Terms of Use and Redistributing Project Gutenberg-tm
electronic works

1.A.  By reading or using any part of this Project Gutenberg-tm
electronic work, you indicate that you have read, understand, agree to
and accept all the terms of this license and intellectual property
(trademark/copyright) agreement.  If you do not agree to abide by all
the terms of this agreement, you must cease using and return or destroy
all copies of Project Gutenberg-tm electronic works in your possession.
If you paid a fee for obtaining a copy of or access to a Project
Gutenberg-tm electronic work and you do not agree to be bound by the
terms of this agreement, you may obtain a refund from the person or
entity to whom you paid the fee as set forth in paragraph 1.E.8.

1.B.  "Project Gutenberg" is a registered trademark.  It may only be
used on or associated in any way with an electronic work by people who
agree to be bound by the terms of this agreement.  There are a few
things that you can do with most Project Gutenberg-tm electronic works
even without complying with the full terms of this agreement.  See
paragraph 1.C below.  There are a lot of things you can do with Project
Gutenberg-tm electronic works if you follow the terms of this agreement
and help preserve free future access to Project Gutenberg-tm electronic
works.  See paragraph 1.E below.

1.C.  The Project Gutenberg Literary Archive Foundation ("the Foundation"
or PGLAF), owns a compilation copyright in the collection of Project
Gutenberg-tm electronic works.  Nearly all the individual works in the
collection are in the public domain in the United States.  If an
individual work is in the public domain in the United States and you are
located in the United States, we do not claim a right to prevent you from
copying, distributing, performing, displaying or creating derivative
works based on the work as long as all references to Project Gutenberg
are removed.  Of course, we hope that you will support the Project
Gutenberg-tm mission of promoting free access to electronic works by
freely sharing Project Gutenberg-tm works in compliance with the terms of
this agreement for keeping the Project Gutenberg-tm name associated with
the work.  You can easily comply with the terms of this agreement by
keeping this work in the same format with its attached full Project
Gutenberg-tm License when you share it without charge with others.

1.D.  The copyright laws of the place where you are located also govern
what you can do with this work.  Copyright laws in most countries are in
a constant state of change.  If you are outside the United States, check
the laws of your country in addition to the terms of this agreement
before downloading, copying, displaying, performing, distributing or
creating derivative works based on this work or any other Project
Gutenberg-tm work.  The Foundation makes no representations concerning
the copyright status of any work in any country outside the United
States.

1.E.  Unless you have removed all references to Project Gutenberg:

1.E.1.  The following sentence, with active links to, or other immediate
access to, the full Project Gutenberg-tm License must appear prominently
whenever any copy of a Project Gutenberg-tm work (any work on which the
phrase "Project Gutenberg" appears, or with which the phrase "Project
Gutenberg" is associated) is accessed, displayed, performed, viewed,
copied or distributed:

This eBook is for the use of anyone anywhere at no cost and with
almost no restrictions whatsoever.  You may copy it, give it away or
re-use it under the terms of the Project Gutenberg License included
with this eBook or online at www.gutenberg.org

1.E.2.  If an individual Project Gutenberg-tm electronic work is derived
from the public domain (does not contain a notice indicating that it is
posted with permission of the copyright holder), the work can be copied
and distributed to anyone in the United States without paying any fees
or charges.  If you are redistributing or providing access to a work
with the phrase "Project Gutenberg" associated with or appearing on the
work, you must comply either with the requirements of paragraphs 1.E.1
through 1.E.7 or obtain permission for the use of the work and the
Project Gutenberg-tm trademark as set forth in paragraphs 1.E.8 or
1.E.9.

1.E.3.  If an individual Project Gutenberg-tm electronic work is posted
with the permission of the copyright holder, your use and distribution
must comply with both paragraphs 1.E.1 through 1.E.7 and any additional
terms imposed by the copyright holder.  Additional terms will be linked
to the Project Gutenberg-tm License for all works posted with the
permission of the copyright holder found at the beginning of this work.

1.E.4.  Do not unlink or detach or remove the full Project Gutenberg-tm
License terms from this work, or any files containing a part of this
work or any other work associated with Project Gutenberg-tm.

1.E.5.  Do not copy, display, perform, distribute or redistribute this
electronic work, or any part of this electronic work, without
prominently displaying the sentence set forth in paragraph 1.E.1 with
active links or immediate access to the full terms of the Project
Gutenberg-tm License.

1.E.6.  You may convert to and distribute this work in any binary,
compressed, marked up, nonproprietary or proprietary form, including any
word processing or hypertext form.  However, if you provide access to or
distribute copies of a Project Gutenberg-tm work in a format other than
"Plain Vanilla ASCII" or other format used in the official version
posted on the official Project Gutenberg-tm web site (www.gutenberg.org),
you must, at no additional cost, fee or expense to the user, provide a
copy, a means of exporting a copy, or a means of obtaining a copy upon
request, of the work in its original "Plain Vanilla ASCII" or other
form.  Any alternate format must include the full Project Gutenberg-tm
License as specified in paragraph 1.E.1.

1.E.7.  Do not charge a fee for access to, viewing, displaying,
performing, copying or distributing any Project Gutenberg-tm works
unless you comply with paragraph 1.E.8 or 1.E.9.

1.E.8.  You may charge a reasonable fee for copies of or providing
access to or distributing Project Gutenberg-tm electronic works provided
that

- You pay a royalty fee of 20% of the gross profits you derive from
     the use of Project Gutenberg-tm works calculated using the method
     you already use to calculate your applicable taxes.  The fee is
     owed to the owner of the Project Gutenberg-tm trademark, but he
     has agreed to donate royalties under this paragraph to the
     Project Gutenberg Literary Archive Foundation.  Royalty payments
     must be paid within 60 days following each date on which you
     prepare (or are legally required to prepare) your periodic tax
     returns.  Royalty payments should be clearly marked as such and
     sent to the Project Gutenberg Literary Archive Foundation at the
     address specified in Section 4, "Information about donations to
     the Project Gutenberg Literary Archive Foundation."

- You provide a full refund of any money paid by a user who notifies
     you in writing (or by e-mail) within 30 days of receipt that s/he
     does not agree to the terms of the full Project Gutenberg-tm
     License.  You must require such a user to return or
     destroy all copies of the works possessed in a physical medium
     and discontinue all use of and all access to other copies of
     Project Gutenberg-tm works.

- You provide, in accordance with paragraph 1.F.3, a full refund of any
     money paid for a work or a replacement copy, if a defect in the
     electronic work is discovered and reported to you within 90 days
     of receipt of the work.

- You comply with all other terms of this agreement for free
     distribution of Project Gutenberg-tm works.

1.E.9.  If you wish to charge a fee or distribute a Project Gutenberg-tm
electronic work or group of works on different terms than are set
forth in this agreement, you must obtain permission in writing from
both the Project Gutenberg Literary Archive Foundation and Michael
Hart, the owner of the Project Gutenberg-tm trademark.  Contact the
Foundation as set forth in Section 3 below.

1.F.

1.F.1.  Project Gutenberg volunteers and employees expend considerable
effort to identify, do copyright research on, transcribe and proofread
public domain works in creating the Project Gutenberg-tm
collection.  Despite these efforts, Project Gutenberg-tm electronic
works, and the medium on which they may be stored, may contain
"Defects," such as, but not limited to, incomplete, inaccurate or
corrupt data, transcription errors, a copyright or other intellectual
property infringement, a defective or damaged disk or other medium, a
computer virus, or computer codes that damage or cannot be read by
your equipment.

1.F.2.  LIMITED WARRANTY, DISCLAIMER OF DAMAGES - Except for the "Right
of Replacement or Refund" described in paragraph 1.F.3, the Project
Gutenberg Literary Archive Foundation, the owner of the Project
Gutenberg-tm trademark, and any other party distributing a Project
Gutenberg-tm electronic work under this agreement, disclaim all
liability to you for damages, costs and expenses, including legal
fees.  YOU AGREE THAT YOU HAVE NO REMEDIES FOR NEGLIGENCE, STRICT
LIABILITY, BREACH OF WARRANTY OR BREACH OF CONTRACT EXCEPT THOSE
PROVIDED IN PARAGRAPH F3.  YOU AGREE THAT THE FOUNDATION, THE
TRADEMARK OWNER, AND ANY DISTRIBUTOR UNDER THIS AGREEMENT WILL NOT BE
LIABLE TO YOU FOR ACTUAL, DIRECT, INDIRECT, CONSEQUENTIAL, PUNITIVE OR
INCIDENTAL DAMAGES EVEN IF YOU GIVE NOTICE OF THE POSSIBILITY OF SUCH
DAMAGE.

1.F.3.  LIMITED RIGHT OF REPLACEMENT OR REFUND - If you discover a
defect in this electronic work within 90 days of receiving it, you can
receive a refund of the money (if any) you paid for it by sending a
written explanation to the person you received the work from.  If you
received the work on a physical medium, you must return the medium with
your written explanation.  The person or entity that provided you with
the defective work may elect to provide a replacement copy in lieu of a
refund.  If you received the work electronically, the person or entity
providing it to you may choose to give you a second opportunity to
receive the work electronically in lieu of a refund.  If the second copy
is also defective, you may demand a refund in writing without further
opportunities to fix the problem.

1.F.4.  Except for the limited right of replacement or refund set forth
in paragraph 1.F.3, this work is provided to you 'AS-IS' WITH NO OTHER
WARRANTIES OF ANY KIND, EXPRESS OR IMPLIED, INCLUDING BUT NOT LIMITED TO
WARRANTIES OF MERCHANTIBILITY OR FITNESS FOR ANY PURPOSE.

1.F.5.  Some states do not allow disclaimers of certain implied
warranties or the exclusion or limitation of certain types of damages.
If any disclaimer or limitation set forth in this agreement violates the
law of the state applicable to this agreement, the agreement shall be
interpreted to make the maximum disclaimer or limitation permitted by
the applicable state law.  The invalidity or unenforceability of any
provision of this agreement shall not void the remaining provisions.

1.F.6.  INDEMNITY - You agree to indemnify and hold the Foundation, the
trademark owner, any agent or employee of the Foundation, anyone
providing copies of Project Gutenberg-tm electronic works in accordance
with this agreement, and any volunteers associated with the production,
promotion and distribution of Project Gutenberg-tm electronic works,
harmless from all liability, costs and expenses, including legal fees,
that arise directly or indirectly from any of the following which you do
or cause to occur: (a) distribution of this or any Project Gutenberg-tm
work, (b) alteration, modification, or additions or deletions to any
Project Gutenberg-tm work, and (c) any Defect you cause.


Section  2.  Information about the Mission of Project Gutenberg-tm

Project Gutenberg-tm is synonymous with the free distribution of
electronic works in formats readable by the widest variety of computers
including obsolete, old, middle-aged and new computers.  It exists
because of the efforts of hundreds of volunteers and donations from
people in all walks of life.

Volunteers and financial support to provide volunteers with the
assistance they need, is critical to reaching Project Gutenberg-tm's
goals and ensuring that the Project Gutenberg-tm collection will
remain freely available for generations to come.  In 2001, the Project
Gutenberg Literary Archive Foundation was created to provide a secure
and permanent future for Project Gutenberg-tm and future generations.
To learn more about the Project Gutenberg Literary Archive Foundation
and how your efforts and donations can help, see Sections 3 and 4
and the Foundation web page at https://www.pglaf.org.


Section 3.  Information about the Project Gutenberg Literary Archive
Foundation

The Project Gutenberg Literary Archive Foundation is a non profit
501(c)(3) educational corporation organized under the laws of the
state of Mississippi and granted tax exempt status by the Internal
Revenue Service.  The Foundation's EIN or federal tax identification
number is 64-6221541.  Its 501(c)(3) letter is posted at
https://pglaf.org/fundraising.  Contributions to the Project Gutenberg
Literary Archive Foundation are tax deductible to the full extent
permitted by U.S. federal laws and your state's laws.

The Foundation's principal office is located at 4557 Melan Dr. S.
Fairbanks, AK, 99712., but its volunteers and employees are scattered
throughout numerous locations.  Its business office is located at
809 North 1500 West, Salt Lake City, UT 84116, (801) 596-1887, email
business@pglaf.org.  Email contact links and up to date contact
information can be found at the Foundation's web site and official
page at https://pglaf.org

For additional contact information:
     Dr. Gregory B. Newby
     Chief Executive and Director
     gbnewby@pglaf.org


Section 4.  Information about Donations to the Project Gutenberg
Literary Archive Foundation

Project Gutenberg-tm depends upon and cannot survive without wide
spread public support and donations to carry out its mission of
increasing the number of public domain and licensed works that can be
freely distributed in machine readable form accessible by the widest
array of equipment including outdated equipment.  Many small donations
($1 to $5,000) are particularly important to maintaining tax exempt
status with the IRS.

The Foundation is committed to complying with the laws regulating
charities and charitable donations in all 50 states of the United
States.  Compliance requirements are not uniform and it takes a
considerable effort, much paperwork and many fees to meet and keep up
with these requirements.  We do not solicit donations in locations
where we have not received written confirmation of compliance.  To
SEND DONATIONS or determine the status of compliance for any
particular state visit https://pglaf.org

While we cannot and do not solicit contributions from states where we
have not met the solicitation requirements, we know of no prohibition
against accepting unsolicited donations from donors in such states who
approach us with offers to donate.

International donations are gratefully accepted, but we cannot make
any statements concerning tax treatment of donations received from
outside the United States.  U.S. laws alone swamp our small staff.

Please check the Project Gutenberg Web pages for current donation
methods and addresses.  Donations are accepted in a number of other
ways including including checks, online payments and credit card
donations.  To donate, please visit: https://pglaf.org/donate


Section 5.  General Information About Project Gutenberg-tm electronic
works.

Professor Michael S. Hart was the originator of the Project Gutenberg-tm
concept of a library of electronic works that could be freely shared
with anyone.  For thirty years, he produced and distributed Project
Gutenberg-tm eBooks with only a loose network of volunteer support.


Project Gutenberg-tm eBooks are often created from several printed
editions, all of which are confirmed as Public Domain in the U.S.
unless a copyright notice is included.  Thus, we do not necessarily
keep eBooks in compliance with any particular paper edition.


Most people start at our Web site which has the main PG search facility:

     https://www.gutenberg.org

This Web site includes information about Project Gutenberg-tm,
including how to make donations to the Project Gutenberg Literary
Archive Foundation, how to help produce our new eBooks, and how to
subscribe to our email newsletter to hear about new eBooks.